
Best Practices in Health and Safety
By Valerie BradleyHuman Services Research Institute

Signs of Change in Performance Management
No longer just better than the institution Rooted in outcomes Emphasis on enhancement Changing role of the state Changes in experiences of families
and people with mental retardation Changes in accreditation
approaches
Outcomes
Expectations
Inclusion
More Signs of Change
Movement away from prescriptive standards
Emphasis on CQI Exploration of self-assessment Collaborative development of
standards Inclusion of customer satisfaction
Satisfaction
CQI
Consensus
Person-CenteredSystems: Facilitate individual choice Support relationships and community
membership Encourage natural supports Encourage health, well-being and safety Foster productivity and participation in
meaningful work Maximize self-determination Support families Build staff and provider capacity
Public Quality Assurance Responsibilities
Assuring that individuals are free from abuse, neglect, and exploitation;
Protecting the rights of individuals and families; Assuring accountability in the use of public dollars; Assuring that individuals have access to necessary
professional services; Evaluating the effectiveness if service and
supports; Assessing the performance of service providers

Changing Quality Landscape
Exposure of fault-lines in the system (e.g., HCFA and the press)
Expansion of supports to individuals on the waiting list
Emergence of self-determination Olmstead decision Struggles with MIS applications Direct support staff shortages

Critical Constraints
Consolidation of providers Management of multiple systems “Generic” approaches to quality Increasing gray areas in public
jurisdiction Pressure from HCFA Lack of collaboration with sister
agencies

Emergence of Performance Indicators First appeared in behavioral and
acute care Provide some “cues” for managing
these complex systems Highlight impact of cost
containment Illuminate what’s working Provide early warning signs For more information: www.hsri.org (Core Indicators Project)

Project Beginnings
NASDDDS and HSRI collaboration Launched in 1997 Seven field test states + steering
committee ~60 candidate performance
indicators Development of data collection
instruments

Current Participating States
Arizona Connecticut Delaware Hawaii Illinois Iowa Indiana Kentucky Massachusetts Montana
Nebraska North Carolina Oklahoma Pennsylvania Rhode Island Utah Vermont Washington West Virginia Wyoming

What will CIP accomplish?
• Nationally recognized set of performance and outcome indicators for developmental disabilities service systems
• Benchmarks of performance• Trend data at the state level• Broad dissemination to all
stakeholders
What are the Core Indicators?
Consumer Outcomes: Satisfaction, choice, employment, community
inclusion, natural supports, family supports… System Performance:
Service expenditures and utilization, access… Protection of Health and Safety:
Injuries, crime victimization, mortality data… Provider Agency / Workforce Stability:
Staff turnover…

Data Sources
Consumer Survey Family Support Survey (plus new
version for families with kids) Family/Guardian Survey Provider Survey (limited) DD System MIS

Consumer employment data
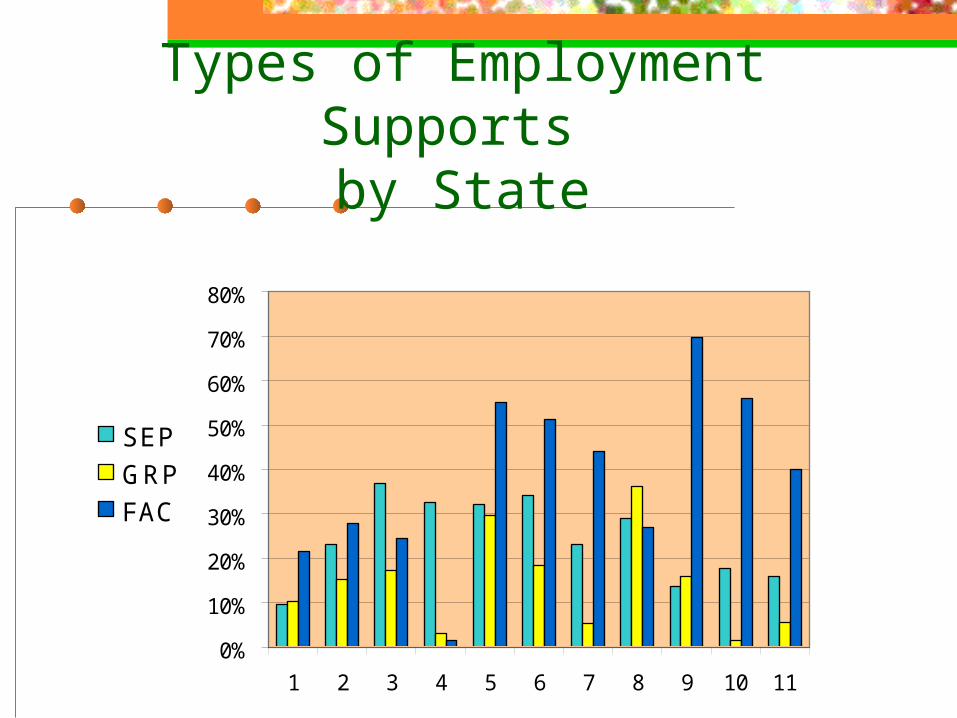
Where people work:Duplicated countsAggregate N = 3900 (11 states)
27.7% -- supported employment 21.7% -- group employment
(enclave/crew) 40.4% -- facility-based employment 36.8% -- non-vocational day supports
0%
10%
20%
30%
40%
50%
60%
70%
80%
1 2 3 4 5 6 7 8 9 10 11
SEP
GRP
FAC
Types of Employment Supports by State

Community Inclusion
93.71%
91.50%
90.15%
84.15%
72.47%
55.93%
0% 20% 40% 60% 80% 100%
errands
shopping
eat at restaurants
go out forentertainment
exercise/sports
attend religiousevents

Choice and Decision-Making
89.46%
75.30%
70.53%
51.13%
50.23%
32.17%
30.77%
29.49%
11.29%
0% 10% 20% 30% 40% 50% 60% 70% 80% 90% 100%
choose freetime activities
choose schedule
chose job
chose home
chose day program
chose people to live with
chose home staff
chose job staff
chose service coordinator

Consumer Outcomes
Access
81% of respondents reported that they almost always have a way to get where they want to go
Safety
93% of respondents report feeling safe in their neighborhoods
96% report feeling safe at home

Health Outcomes
Last OB/GYN Exam
Over a Year Ago14%
Never Had an Exam9%
Within Past Year54%
Don't Know23%

Health Outcomes
Last Physical Exam
Don't Know8%
Over a Year Ago6%
Within Past Year86%

Health Outcomes
Last Routine Dental Exam
Over 6 Months Ago26%
In Last 6 Months55%
Don't Know19%

Family Survey Comparisons
More positive responses on Family/Guardian Survey (this group was generally older and received more supports)
Out-of-home families more satisfied with individual supports than those with family members living at home (84% vs. 64%)
Much greater variation on satisfaction ratings for the in-home group (50% to 70%)
Staff Stability
Day support providers report: Lower turnover Current staff have been employed longer Half as many vacant positions (both FT and PT)
Both types of agencies report: Staff who left within the last year were
employed on average about 19 months Part-time position vacancies are much higher
than full-time position vacancies
For more information…
Visit HSRI’s website:www.hsri.org/cip/core.html

Pennsylvania OMRIndependent Monitoring
Project Provides an independent evaluation of the provided by the
PA mental retardation system Based on personal interviews with consumers and families Reports issued to counties and the state containing with
findings and recommendations for program improvements.
The Mission of the Independent Monitoring Project is to: ID outcomes achieved by persons receiving supports Measure achievements Recommend improvements Continually promote the values of Every Day Lives

Pennsylvania OMRIndependent Monitoring Project
Continued How does the process work?
Monitors have a contract with the local County MH/MR facility
Interviewing teams are made up of consumers, families, and other interested people
Reports prepared by Temple University Reports are used by providers, counties, and the
state to improve the quality of services provided and to make changes where necessary
Reports also reviewed by a state wide steering committee that advises the Office of Mental Retardation on actions to be taken.

Massachusetts DMR Risk Management System
Implemented in 1999 Mission is to balance the responsibility of a public agency to
keep individuals with mental retardation safe while promoting independence and self determination. This involves:
Creating a foundation of trust between the state and individuals that does not limit freedom assists the individual to make safe choices.
Insuring that there is a strong management system and framework that the level of supervision and oversight is appropriate.
Emphasizing safeguards and strategies that result in reasonable risk, and a balance between risks and responsibilities.

Massachusetts DMR Risk Management System Continued
The DMR Risk Management System has 4 basic components: Risk Identification and Prevention
A review process conducted by service coordinators. Risk Assessment and Planning
Persons determined to be at-risk will have a risk management planning meeting with their planning team.
Risk Training, Consultation, and Support Training for DMR staff working with person at-risk; also
provider training and public education efforts. Risk Management System Oversight Activities
A standardized process coordinated by the Central Office Risk Management Director.

California DDSWellness Initiative
A 1996 statewide initiative by DDS to promote quality medical, dental, and mental health services for all Californians with DD.
Activities include: Regional Projects
funding of 86 regional projects that address Abuse, Aging, Behavioral, Dental, Health Documentation, Health Assessment, Medication, Mental Health, Nutrition, Telemedicine, Training, and Women’s Health
Publications includes the Wellness Digest Newsletter and The Road to
Wellness, a booklet on accessing Medical Services Partnership Activities
Provide training & resources for medical professionals, universities, regional centers, care providers, consumers, and families

New Mexico Continuum of Care Project
Mission: to provide quality health care for people with DD including:
Creating learning opportunities, Promoting best practice policies, and Offering specialized developmental disabilities services.
Assumptions: Health care services should be available and delivered in
a comprehensive and coordinated manner from infancy to adulthood
Health services should be multidisciplinary Health care professionals need to becoming more
knowledgeable and competent in dealing with developmental disabilities
Health care should honor personal values, promote quality of life, and respect cultural differences.

Healthy People 2010:Disability & Secondary
Conditions Healthy People 2010 (released by HHS in 2000) is a
set of health objectives over the first decade of the new century.
Chapter 6: Disability and Secondary Conditions was developed by the Center for Disease Control and Prevention, the U.S. Dept. of Education, and the National Institute on Disability and Rehabilitation Research.
The objectives of this chapter are to: promote the health of people with disabilities, prevent secondary conditions, and eliminate disparities between people with and
without disabilities in the U.S. population.

Healthy People 2010:Disability & Secondary Conditions
Misconceptions
Four main misconceptions about people with disabilities: all people with disabilities automatically have poor health, public health should focus only on preventing disabling
conditions, a standard definition of “disability” or “people with
disabilities” is not needed for public health purposes, and the environment plays no role in the disabling process.
Lead to an under emphasis on health promotion and disease prevention and an increase in the occurrence of secondary conditions.
Challenging these misconceptions will clarify the health status of people with disabilities and address the environmental barriers that undermine the health, well-being, and participation in life activities of people with disabilities.
Healthy People 2010: Disability & Secondary Conditions
Objectives Summary of Disability Objectives for 2010:
Include standard definition of people with disabilities in data sets
Reduce feelings of depression among children with disabilities
Reduce feelings of depression interfering with activities among
adults with disabilities
Increase social participation among adults with disabilities
Increase sufficient emotional support among adults with disabilities
Improve satisfaction with life among adults with disabilities

More Recommendations
Reduce congregate care of children and adults with disabilities
Create employment parity between adults with and without disabilities
Increase the number of children and youth with disabilities included in regular education programs
Increase accessibility to health and wellness programs for people with DD
Increase access to assistive devices and technology for people with DD
Reduce environmental barriers affecting participation in activities
Increase public health surveillance and health promotion

Resources: To find more info on the projects presented you can visit the
following web sites:
PA Independent Monitoring Project www.dpw.state.pa.us/omr/omrImt.asp
MA Risk Management System www.qualitymall.org (QA Store, Monitoring
Health & Safety Dept.) CA Wellness Initiative
www.dds.ca.gov/Wellness/main/Well01.cfm NM Continuum of Care
star.nm.org/coc/ Healthy People 2010
www.health.gov/healthypeople/Default.htm

Important Next Steps
Place individual outcomes at the center of the system
Enlist assistance of consumers and families
Identify key areas of performance
Link technology with need for information
Look at the costs and benefits of existing approaches
Make results available and accessible
Get serious about uniform reporting of critical health and safety events
Develop staff credentialing and expand training options
Reassess roles of case managers
Refine performance contracting
Expand understanding of person-centered planning

Final Words
“Beware the Continuous Improvement of Things Not Worth Improving”
W. Edward Deming


