
ENVIRONMENTAL
ISO 9001 & ISO 14001APPROVED
Rawalpindi — Pakistan
Fauji Towers Block III, 68 Tipu Road Chaklala
If Undelivered please return to:
Company Secretary
Fauji Cement Company Limited
LET’S BUILD PAKISTAN TOGETHER
Annual Report 2013
better

Sitting :Left to Right Khaliq (Manager Mining), Soomro (Manager Elect), Tariq (Manager Store), Brig (R) Sajjad Azam (Company Secretary),
Rais Ahmed (Sr. GM Plant), Lt Gen (R) Muhammad Sabir (CEO/MD), Shahid (GM Operations), Siddiq (GM Maintenance),Murtaza (DGM Mechanical), Abrar (Manager Admin & Security), Janas (Manager Production – I)
Standing Left to RightAsif (Manager Mechanical – 3), Wasif (Manager Production - 2), Mahmood (Manager Mechanical – 2),
Khalid Mahmood (Manager Mechanical – 1), Mehboob (Manager QC), Amir (Manager TPI), Tauqir (Manager Power)
PLANT MANAGEMENT 2013

1F C C L
Annual Report 2013
Board of Directors
Company Information
Vision and Mission Statements
Company Profile
Key Operating Indicators
Directors' Report
Statement of Compliance
Review Report to the Members
Auditors' Report
Balance Sheet
Profit and Loss Account
Statement of Comprehensive Income
Cash Flow Statement
Statement of Changes in Equity
Notes to the Financial Statements
Pattern of Shareholding as on 30 June 2013
Notice of 21st Annual General Meeting
Form of Proxy
2
3
4
5
6
7
15
18
19
20
22
23
24
25
26
55
62
64
Contents

2Board of Directors F C C L
Annual Report 2013
Lt Gen (R) Muhammad Sabir, HI (M) (Chief Executive/MD)
Brig Sajjad Azam Khan, SI(M),T.BtCompany Secretary
(R)
Mr. Qaiser Javed Dr. Nadeem Inayat
Lt Gen (R) Muhammad Mustafa Khan, HI (M) (Chairman)
Brig (R) Agha Ali Hassan, SI(M)
Mr. Max Kruse, IFU
Brig Parvez Sarwar Khan, SI(M) (R) Brig (R) Dr. Gulfam Alam, SI(M) Brig (R) Muhammad Saeed khan
Brig (R) Asmat Ullah Khan Niazi Independant Director

Company Secretary
Brig Sajjad Azam Khan, SI (M) T Bt (R)
Fauji Tower Block III
68 Tipu Road Chaklala, Rawalpindi
Tel:
(051) 9280075
Fax: (051) 9280416
E- mail: [email protected]
Mr. Omer Ashraf
Tel: (051) 5500157
Chief Financial Officer
Company Websitehttp://www.fccl.com.pk
Legal Advisors
Fax : (051) 2260653
M/s Dignam Orr & Co, Advocates
M/s CORPLINK (PVT) LIMITED
Wings Arcade, 1- Model Town, Lahore
K, Commercial,
Tel.: 042 -35839182, 35887262 Fax : 042 -35869037
Registration &Shares Transfer Officer
AuditorsM/s KPMG Taseer Hadi & Co,
Chartered Accountants
Fax : (051) 2822671
Brig (R) Dr. Gulfam Alam, SI(M) (President)Brig (R) Parvez Sarwar Khan, SI(M) (Member) Brig (R) Muhammad Saeed Khan (Member)Mr. Rais Ahmed, Senior GM (Plant) (Secretary)
Technical Committee
Human Resource CommitteeDr. Nadeem Inayat (President)Mr.Qaiser Javed (Member)Brig (R) Muhammad Saeed Khan (Member)Brig (R) Sajjad Azam Khan ,SI(M),T.Bt (Secretary)
3
Key Management
Mr. Omer AshrafChief Financial Officer
Mr. Shahid GhazanfarGM (Operations)
Mr. Siddiq Khan GM (Maintenance)
Mr. Rais AhmadSenior GM (Plant)
Company Information F C C LAnnual Report 2013
Brig (R) Muhammad Iqbal,SI(M)GM (Marketing & Sales)
Brig (R) Muhammad Iqbal,SI(M)GM (Marketing & Sales)
Brig (R) Ashfaq Ahmed GM (PHM)
Brig (R) Ashfaq Ahmed GM (PHM)
Audit Committee
Mr. Qaiser Javed Dr. Nadeem Inayat (Member)Brig (R) Agha Ali Hassan, SI(M) (Member)Brig (R) Dr. Gulfam Alam, SI(M) (Member)Brig (R) Sajjad Azam Khan ,SI(M),T.Bt (Secretary )
(Member)Brig (R) Asmat Ullah Khan Niazi (President)
Board of DirectorsLt Gen (R) Muhammad Mustafa Khan, (Chairman)
Lt Gen (R)Muhammad Sabir (CEO/MD),
Mr. Qaiser Javed (Director)
Dr. Nadeem Inayat (Director)
Brig Dr. Gulfam Al(R) am, SI (M) (Director)
Brig Agha Ali Hassan, SI(M) (R) (Director)
Brig Parvez Sarwar Khan, SI (M) (R) (Director)
Brig (R) Muhammad Saeed Khan (Director)Mr. Max Kruse, IFU (Director)Brig (R) Asmat Ullah Khan Niazi (Independent Director)
Registered Office/ Head Office
Fauji Tower Block III68, Tipu Road, Chaklala. RawalpindiTel: 051-9280081-83 051-5763321-24 051-5500159Fax: 051-9280416
FactoryNear Village Jhang Bahtar, Tehsil Fateh Jang
District: Attock
Tel: 057-2538047-48, 2538138, 2538148-49
Fax: 057-2538025
Ist Floor, Aslam Plaza, Sadar, Rawalpindi-Pakistan.
60 Adamjee Road,
Tel:
(051) 5523836, 5528042, 5528960,
5528963-64Fax: (051) 5528965-66
Marketing and Sales Department:

4F C C L
Annual Report 2013
Vision
Mission
Our Values
Customers
People
Accountability
Citizenship
Financial Responsibility
To be a role model cement manufacturing Company, benefiting all stake holders and fulfilling corporate social responsibilities, while enjoying public respect and good will.
While maintaining its leading position in quality of cement, maximize profitability through reduced cost of production and enhanced market share.
We listen to our customers and improve our product to meet their present and future needs.
Our success depends upon high performing people working together in a safe and healthy work place where diversity, development and team work are valued and recongnized.
We expect superior performance and results. Our leaders set clear goals and expectations, are supportive and provide and seek frequent feed back.
We support the communities where we do business, hold ourselves to the highest standards of ethical conduct and environment responsibility and communicate openly with FCCL people and the public.
We are prudent and effective in the use of the resources entrusted to us.
Vision and Mission Statements

5F C C L
Annual Report 2013
FCCL, located at Jhang Bhatar, District Attock, is a leading producer of Pakistan
Cement Industry and a major concern of Fauji Foundation. Incorporated as a public limited
company, it started its operations in 1997 on commissioning of 3150 TPD F.L. Smidth Plant of
DENMARK. Subsequently in 2005, the Plant capacity was enhanced to 3,885 TPD.
To cater for the expanding demand of Fauji Cement a new line of 7560 TPD has been
erected and its production started on 30 May 2011. The new Plant is equipped with latest / state
of art equipment and is also the first GERMAN plant of Pakistan Cement Industry. The Portland
Cement produced at this plant is the finest in the Country. Major Equipment Suppliers are:
a. POLYSIUS AG Germany.
b. LOESCHE GmBH Germany (Vertical Cement Mills).
c. HAVOR & BOECKER Germany (Packing Plant).
d. ABB Switzerland (Electrical Equipment and PLC).
In pursuance of its commitment to ENVIRONMENT, the Company installed in 2009 first
ever Refuse Derived Fuel (RDF) Processing Plant at a cost of Rs. 320 Million. It has not only
provided economical fuel but demonstrated a better way of disposing Municipal Waste. In
addition, this milestone achievement has shown the entire industrial sector the future path to
follow.
FCCL is an ISO 9001:2008 and ISO 14001 : 2004 Certified Company with a total
capacity of 11, 445 TPD and a strong and longstanding tradition of service, reliability and quality.
Company Profile
6F C C L
Annual Report 2013
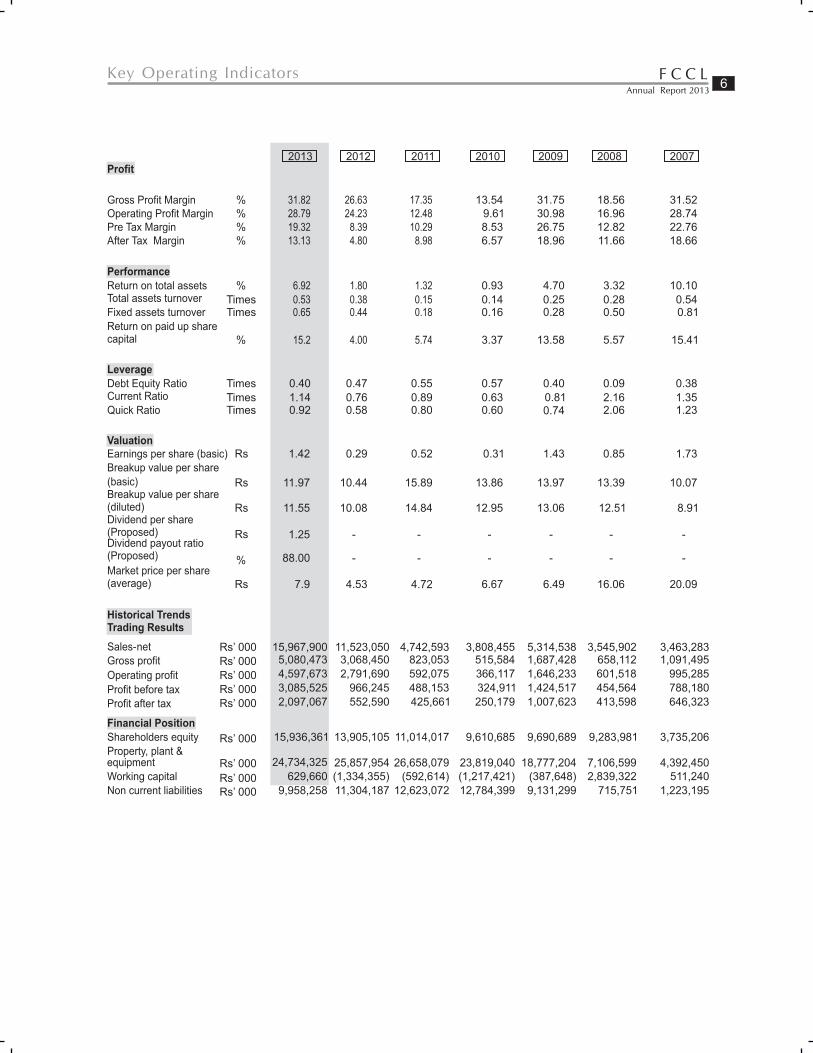
Key Operating Indicators
Profit
Gross Profit Margin
Operating Profit MarginPre Tax Margin
After Tax Margin
Performance
Return on total assets
Total assets turnover
Fixed assets turnover
Return on paid up share capital
Leverage
Debt Equity Ratio
Current Ratio
Quick Ratio
Valuation
Earnings per share (basic)Breakup value per share
(basic)
Breakup value per share (diluted)
Dividend per share (Proposed)
Dividend payout ratio (Proposed)
Market price per share (average)
Historical TrendsTrading Results
Gross profitSales-net
Operating profit
% %
%
%
%
Times
Times
%
Times
Times
Times
Rs
Rs
Rs
Rs
%
Rs
Rs’ 000
Rs’ 000
Rs’ 000
Rs’ 000
Rs’ 000
Rs’ 000
Rs’ 000
Rs’ 000Rs’ 000
Profit after tax
Profit before tax
Financial Position
Shareholders equity
Property, plant & equipment
Working capital
Non current liabilities
31.52
28.74
22.76
18.66
10.10
0.54
0.81
15.41
0.38
1.35
1.23
1.73
10.07
8.91
-
-
20.09
3,463,283
1,091,495
995,285
788,180
646,323
3,735,206
4,392,450
511,240
1,223,195
2007
18.56
16.96
12.82
11.66
3.32
0.28
0.50
5.57
0.09
2.16
2.06
0.85
13.39
12.51
-
-
16.06
3,545,902
658,112
601,518
454,564
413,598
9,283,981
7,106,5992,839,322
715,751
2008
31.75
30.98
26.75
18.96
4.70
0.25
0.28
13.58
0.40
0.81
0.74
1.43
13.97
13.06
-
-
6.49
5,314,538
1,687,428
1,646,233
1,424,517
1,007,623
9,690,689
18,777,204(387,648)
9,131,299
2009
13.54
9.61
8.53
6.57
0.93
0.14
0.16
3.37
0.57
0.63
0.60
0.31
13.86
12.95
-
-
6.67
3,808,455
515,584
366,117
324,911
250,179
9,610,685
23,819,040(1,217,421)
12,784,399
2010
17.35
12.48
10.29
8.98
1.32
0.15
0.18
5.74
0.55
0.89
0.80
0.52
15.89
14.84
-
-
4.72
4,742,593
823,053
592,075
488,153
425,661
11,014,017
26,658,079
(592,614)
12,623,072
2011
26.6331.82
24.2328.79
8.3919.32
4.8013.13
1.806.92
0.380.530.440.65
4.0015.2
0.470.40
0.761.140.580.92
0.291.42
10.4411.97
10.0811.55
-1.25
-88.00
4.537.9
11,523,05015,967,900
3,068,4505,080,473
2,791,6904,597,673
966,2453,085,525
552,5902,097,067
13,905,10515,936,361
25,857,95424,734,325
(1,334,355)629,660
11,304,1879,958,258
20122013

7F C C L
Annual Report 2013
Directors' Report
Generalst
1. The Directors of Fauji Cement Company Limited (FCCL) are pleased to present the 21 th
Annual Report together with audited financial statements of the Company for the year ended 30
June 2013 and Auditors' Report thereon.
Market Overview2. Industry dispatches for the FY 2012-13 were 33.4 Million MT including 25 Million MT
domestic and 8.4 Million MT exports. There is a 3 % increase in total dispatches of the Industry as
compared to the previous year, which were 32.5 Million MT including 24 Million MT domestic and
8.5 Million MT exports. The increase in the domestic dispatches is 5 % and the decrease in
exports is 3 %.
3. FCCL has dispatched 2,500,413 MT for the FY2012-13 including 2,000,461 MT domestic
and 499,952 MT exports. There is a 17 % increase in total dispatches as compared to the
previous year. Capacity utilization of FCCL in FY 2012-13 has been 73% whereas in FY 2011-12
it was 62 % (based on 11,445 TPD). Production Review4. Performance of the plant remained satisfactory. Comparative production figures are
given as under:- 2012 - 13 2011 - 12
a. Clinker ( MT) 2,353,668 2,125,693
b. Cement ( MT) 2,497,529 2,145,050
Financial Performance 5. Profitability. Gross profit ratio was 32% as compared to 27% during last year. An
improvement in cement prices helped the Company in passing on some of its input costs. The
Company earned a Profit after Tax of Rs. 2,097 Million as compared to the last year's profit of Rs.
552 Million. The cost of production increased by 4%. The Company successfully managed debt
servicing of Rs 3.5 billion during this financial year from operational cash flows.
6. Contribution to National Exchequer. The Company contributed a sum of Rs.4,782
Million to the national exchequer in the form of taxes and duties during the year under review.
Fauji Cement also earned USD 36 Million through export of cement.
7. Presentation of Financial Statements. The financial statements prepared by the
Management present the Company's state of affairs, the results of its operations, cash flows and
changes in equity in a fair and accurate manner.
8. Books of Account. Proper books of account have been maintained.
9. Accounting Policies. Appropriate accounting policies have been consistently applied
in preparation of financial statements and accounting estimates are based on reasonable and
prudent judgment.

8F C C L
Annual Report 2013
10. Compliance with International Accounting Standards (IAS) and International
Financial Reporting Standards (IFRS). International Accounting Standards and International
Financial Reporting Standards (IFRS) as applicable in Pakistan have been followed in
preparation of financial statements.
11. Internal Control System. The system of internal control is sound in design and has
been effectively implemented and monitored.
12. Going Concern. There is no doubt that the Company has the ability and strength to
operate as a going concern.
13. Best Practices of Corporate Governance. There has been no material departure from
the best practices of corporate governance, as given in the listing regulations.
14. Financial Data of Last Six Years. Key operating and financial data of last six years is
given below:-
Directors' Report
Description 2013 2012 2011 2010 2009 2008
Operating Results
(Rs. In Million)
Net Sales 15,967.900 11,523.050 4,743.593 3,808.455 5,314.538 3,545.902
Gross Profit 5,080.473 3,068.450 823.053 515.584 1,687.428 658.112
Operating Profit 4,597.673 2,791.690 592.075 366.117 1,646.233 601.518
Financial Charges 1,512.148 1,825.445 103.922 41.206 224.716 146.954
Profit After Taxation
2,097.067 552.590 425.661 250.179 1,007.623 413.598
Balance Sheet
Shareholder’s Equity
15,936.361 13,905.105 11,014.017 9,610.685 9,690.689 9,283,981
Fixed Assets 24,734.325 25,897.954 26,658.079 23,819.040 18,777.204 7,106.599
Long Term Loans including current portion
10,484.209 12,554.908 13,553.62 12,980.414 6,549.227 875.000
EPS (Rs)
Basic 1.42 0.29 0.52 0.31 1.43 0.85
Diluted 1.42 0.29 0.34 0.30 1.36 0.77
15. Dividend. The Board is pleased to propose a dividend at the rate of Rs.1.25 per share i.e
th12.5 % for the financial year ended on 30 June 2013.

Directors' Report 9
F C C LAnnual Report 2013
18. Board of Directors
19. Salient Aspects of Company's Control and Reporting Systems. The Company
complies with all the requirements of the Code of Corporate Governance as contained in the
listing regulations of the Stock Exchanges. To fulfill this role, the Board is responsible to
implement overall corporate governance in the Company including approval of the strategic
direction as recommended by the Management, approving and monitoring capital expenditure,
appointing, removing and creating succession policies for the senior management, establishing
and monitoring the achievement of management's goals and ensuring the integrity of internal
control and Management Information Systems. It is also responsible for approving and
monitoring financial and other reporting. The Board has delegated responsibility for operation
and administration of the Company to the Chief Executive / Managing Director.
Responsibilities are delineated by formal authority delegations. The Board has constituted the
following committees which work under the guidance of Board of Directors:-
16. Outstanding Statutory Dues. The Company does not have any outstanding statutory
dues except as shown in Note number 8.
17. Provident Fund. Value as on 30 June 2013 is given below:-
Management Staff Non-Management Staff
Provident Fund (in Million) : Rs. 164.134 Rs. 90.760

10F C C L
Annual Report 2013
Directors' Report
c. Technical Committee
Note: All meetings of the Board met minimum quorum prescribed by the Code of
Corporate Governance and were also attended by the Chief Financial Officer and the
Company Secretary.
(1) Brig (R) Dr. Gulfam Alam, SI(M) 5 5 (2) Brig (R) Parvez Sarwar Khan, SI(M) 5 4 (3) Brig (R) Muhammad Saeed Khan 5 5
(1) Lt Gen (R) Muhammad Mustafa, HI (M) 4 4
(2) Lt Gen (R) Muhammad Sabir, HI (M) 4 4
(3) Mr. Qaiser Javed 4 4
(4) Dr. Nadeem Inayat 4 3
(5) Brig (R) Agha Ali Hassan, SI (M) 4 4
(6) Brig (R) Parvez Sarwar Khan SI (M) 4 4
(7) Brig (R) Dr. Gulfam Alam SI (M) 4 3
(8) Brig (R) Muhammad Saeed Khan 4 4
(9) Brig (R) Asmat Ullah Khan Niazi 4 2
(10) Mr. Max Kruse 4 -
b. Audit Committee
(1) Brig (R) Asmat Ullah Khan Niazi 5 3 (2) Mr. Qaiser Javed 5 5 (3) Dr. Nadeem Inayat 5 2 (4) Brig (R) Agha Ali Hassan, SI (M) 5 5 (5) Brig (R) Dr. Gulfam Alam 5 4
a. Audit Committee.b. Technical Committee.c. Human Resource Committee.
20. Independent Director. The Board welcomed Brig (R) Asmat Ullah Khan Niazi who has
been elected in EOGM held on 05 Dec 2012 as Independent Director on the Board of FCCL and
Appointed as President of Audit Committee.
21. Attendance of Meetings. During the year under review, attendance by each director is
given below:-a. Board of Directors No of Meetings
Held Attended

11F C C L
Annual Report 2013
Directors' Report
26. Awards, Acknowledgment, Certifications. Fauji Cement has a pro active approach
towards fulfillment of Corporate Social Responsibilities. The measures taken by Fauji Cement
have been acknowledged by the society and concerned authorities through different awards.
22. Disclosures. To the best of our knowledge, the Directors, CEO, CFO, Company
Secretary, Company Auditors, their spouses and their minor children have not undertaken any
trading in shares of the Company during the FY 2012-13.
23. Relations with Company Personnel . Relations between the management and the
workers continued to be extremely cordial based on mutual respect and confidence contributing
to optimal efficiency. The Company has allocated funds for Provident Fund and Profit
Participation Fund for its employees. Considerable investment has been made for welfare of the
staff in order to provide Safe and Healthy work environment.
Pattern of Share-holding
24. Pattern of share-holding as on 30 June 2013 is attached as Annex A.
Corporate Social Responsibilities & Sustainable Environment Care
25. Fauji Cement has always been a socially responsible corporate entity which feels obliged
in paying back to the society, from which we derive economic gains.
Mr. Shahid Ghazanfer, GM Operations receiving “Certificate of Appreciation”by CSR Association of Pakistan, in recognition of initiative taken by Fauji Cement

12F C C L
Annual Report 2013
Directors' Report
Passing out Apprentices 2012
b. FAUJI Model Secondary School (FMSS).
English Medium Secondary School is being run by Fauji Cement with strength of
553 students from Class Nursery to Class 10. Continual improvement measures
are taken to up-grade and up-date the school including up lifting of School Library,
scholarships and up-gradation of Science Laboratory.
c. FCCL Medical Dispensary.
Medical facility is being provided to the local community through Company
Operated Medical Dispensary. The facility is equipped with necessary equipment
and MBBS Doctors are available, including a lady Doctor.
d. Local Community Schools.
With a concept to extend educational support at a larger scale for the local and
adjacent community, FCCL Management decided to up-grade Govt. High School
LANGAR - Rs. 1.6 Million are being spent for construction of additional
classrooms.
e. Children Park.
A children park is being maintained in Factory area for local community.
f. Employees Welfare Activities.
Employees Sports Tournaments are arranged every year enabling healthy
27. Community Welfare
a. FCCL Technical Training Institute.
FCCL management is cognizant of corporate responsibility towards development
of technical skills of young generation and its importance in development of the
country. In pursuance to this objective, FCCL has planned to develop “FCCL
Technical Training Institute. The institute is expected to play vital role in skill
development of local youth, especially from under privileged community.
13F C C L
Annual Report 2013
Directors' Report
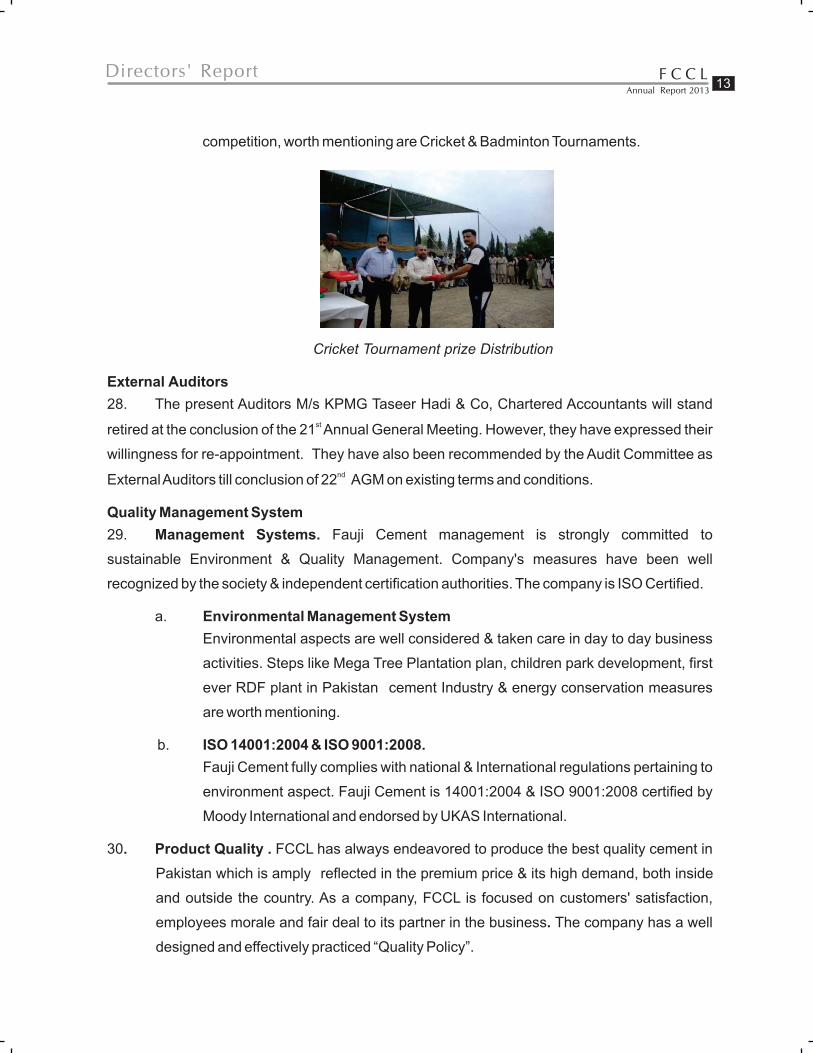
Cricket Tournament prize Distribution
External Auditors
28. The present Auditors M/s KPMG Taseer Hadi & Co, Chartered Accountants will stand stretired at the conclusion of the 21 Annual General Meeting. However, they have expressed their
willingness for re-appointment. They have also been recommended by the Audit Committee as nd
External Auditors till conclusion of 22 AGM on existing terms and conditions. Quality Management System
29. Management Systems. Fauji Cement management is strongly committed to
sustainable Environment & Quality Management. Company's measures have been well
recognized by the society & independent certification authorities. The company is ISO Certified.
a. Environmental Management System
Environmental aspects are well considered & taken care in day to day business
activities. Steps like Mega Tree Plantation plan, children park development, first
ever RDF plant in Pakistan cement Industry & energy conservation measures
are worth mentioning.
b. ISO 14001:2004 & ISO 9001:2008.
Fauji Cement fully complies with national & International regulations pertaining to
environment aspect. Fauji Cement is 14001:2004 & ISO 9001:2008 certified by
Moody International and endorsed by UKAS International.
30. Product Quality . FCCL has always endeavored to produce the best quality cement in
Pakistan which is amply reflected in the premium price & its high demand, both inside
and outside the country. As a company, FCCL is focused on customers' satisfaction,
employees morale and fair deal to its partner in the business. The company has a well
designed and effectively practiced “Quality Policy”.
competition, worth mentioning are Cricket & Badminton Tournaments.

14F C C L
Annual Report 2013
Directors' Report
Acknowledgement
31. The Directors express their deep appreciation to valued Shareholders, Customers,
Suppliers and Financial Institutions / Government Departments for their cooperation and
Company's Employees for their hard work and commitment which enabled the company to
achieve good operational results.
32. The Board is of the opinion that with sustained efforts and ALLAH's blessing, the
Company will remain on its way to success.
For and on behalf of the Board
Rawalpindi Lt Gen (R) Muhammad Mustafa Khan, HI (M) 21 August 2013 Chairman

15F C C L
Annual Report 2013
This statement is being presented to comply with the Code of Corporate Governance (CCG)
contained in listing regulation No 35 of Karachi Stock Exchange, listing regulation No 35 of
Lahore Stock Exchange and Chapter XI of the Listing Regulation of Islamabad Stock Exchanges
for the purpose of establishing a framework of good governance, whereby a listed company is
managed in compliance with the best practices of corporate governance (CCG).
The company has applied the principles contained in the CCG in the following manner:
1. The company encourages representation of independent non-executive directors and
directors representing minority interests on its board of directors. At present the board
includes:
2. The directors have confirmed that none of them is serving as a director on more than
seven listed companies, including this company (excluding the listed subsidiaries of
listed holding companies where applicable).
3. All the resident directors of the company are registered as taxpayers and none of them
has defaulted in payment of any loan to a banking company, a DFI or an NBFI or, being a
member of a stock exchange, has been declared as a defaulter by that stock exchange.
4. No casual vacancy occurred during the period under review.
5. The company has prepared a “Code of Conduct” and has ensured that appropriate steps
have been taken to disseminate it throughout the company along with its supporting
policies and procedures.
6. The board has developed a vision/mission statement, overall corporate strategy and
significant policies of the company. A complete record of particulars of significant policies
along with the dates on which they were approved or amended has been maintained.
Statement of Compliance
Category Names
Independent Director Brig (R) Asmat Ullah Khan Niazi
Executive Director Lt. Gen (R) Muhammad Sabir
Non-Executive Directors 1. Lt Gen (R) Muhammad Mustafa Khan (Chairman)
2. Mr. Qaiser Javed
3. Mr. Dr. Nadeem Inayat
4. Brig (R) Agha Ali Hassan
5. Brig (R) Parvez Sarwar Khan
6. Brig (R) Dr. Gulfam Alam
7. Brig (R) Muhammad Saeed Khan
8. Mr. Max Kruse

16F C C L
Annual Report 2013
7. All the powers of the board have been duly exercised and decision on material
transactions, including appointment and determination of remuneration and terms and
conditions of employment of the CEO, other executive and non-executive directors, have
been taken by the board/shareholders.
8. The meetings of the Board were presided over by the Chairman and, in his absence, by a
director elected by the board for this purpose and the board met at least once in every
quarter. Written notices of the board meetings, along with agenda and working papers,
were circulated at least seven days before the meeting. The minutes of the meetings
were appropriately recorded and circulated.
9. The Directors at FCCL Board are adequately trained to perform their duties. Brig (R)
Muhammad Saeed Khan, director of the Company has obtained certificate under
directors training program offered by institution that meets the criteria specified by SECP
in the period under review.
10. The board has already approved appointment of CFO, Company Secretary and Head of
Internal Audit, including their remuneration and terms and conditions of employment.
11. The directors' report for this year has been prepared in compliance with the requirements
of the CCG and fully describes the salient matters required to be disclosed.
12. The financial statements of the company were duly endorsed by CEO and CFO before
approval of the board.
13. The directors, CEO and executives do not hold any interest in the shares of the company
other than that disclosed in the pattern of share holding.
14. The company has complied with all the corporate and financial reporting requirements of
the CCG.
15. The company has formed an Audit Committee. It comprises five members, of whom all
are non-executive directors and the Chairman of the committee is an Independent non
executive Director.
16. The meetings of the audit committee were held at least once every quarter prior to
approval of interim and final results of the company and as required by the CCG. The
terms of reference of the committee have been formed and advised to the committee for
compliance.
17. The board has formed an HR and Remuneration Committee. It comprises of three
Statement of Compliance

17F C C L
Annual Report 2013
members, of whom all are non-executive directors and the chairman of the committee is
a non executive director.
18. The board has set up an effective internal audit department which is suitably qualified and
experienced for the purpose and is conversant with the policies and procedures of the
company.
19. The statutory auditors of the company have confirmed that they have been given a
satisfactory rating under the quality control review program of the ICAP, that they or any of
the partners of the firm, their spouses and minor children do not hold shares of the
company and that the firm and all its partners are in compliance with International
Federation of Accountants (IFAC) guidelines on code of ethics as adopted by the ICAP.
20. The statutory auditors or the persons associated with them have not been appointed to
provide other services except in accordance with the listing regulations and the auditors
have confirmed that they have observed IFAC guidelines in this regard.
21. The 'closed period', prior to the announcement of interim/final results, and business
decisions, which may materially affect the market price of company's securities, was
determined and intimated to directors, employees and stock exchange(s).
22. Material/price sensitive information has been disseminated among all market
participants at once through stock exchange(s).
23. We confirm that all other material principles enshrined in the CCG have been complied
with.
Rawalpindi LT GEN (R) MUHAMMAD MUSTAFA KHAN, HI(M)
21 August 2013 CHAIRMAN
Statement of Compliance
18F C C L
Annual Report 2013
We have reviewed the Directors' Statement of Compliance with the Best Practices (“the Statement”) contained in the Code of Corporate Governance prepared by the Board of Directors of Fauji Cement Company Limited, (“the Company”) to comply with the Listing Regulations No. 35 of Karachi Stock Exchange Limited, Listing Regulation No. 35 of Lahore Stock Exchange Limited and Chapter XI of the Listing Regulations of Islamabad Stock Exchange Limited, where the Company is listed.
The responsibility for compliance with the Code of Corporate Governance is that of the Board of Directors of the Company. Our responsibility is to review, to the extent where such compliance can be objectively verified, whether the Statement of Compliance reflects the status of the Company's compliance with the provisions of the Code of Corporate Governance and report if it does not. A review is limited primarily to inquiries of the Company personnel and review of various documents prepared by the Company to comply with the Code.
As part of our audit of financial statements we are required to obtain an understanding of the accounting and internal control systems sufficient to plan the audit and develop an effective audit approach. We are not required to consider whether the Board's statement covers all risks or controls, or to form an opinion on the effectiveness of such internal control, the Company's corporate governance procedures and risks.
Further, Sub-Regulation (xiii a) of Listing Regulation 35 notified by the Karachi Stock Exchange Limited vide circular KSE/ N-269 dated 19 January 2009 requires the Company to place before the Board of Director for their consideration and approval related party transactions, distinguishing between transactions carried out on terms equivalent to those that prevail in arm's length transactions and transactions which are not executed at arm's length price recording proper justification for using such alternative pricing mechanism. Further, all such transactions are also required to be separately placed before the Audit Committee. We are only required and have ensured compliance of requirement to the extent of approval of related party transactions by the Board of Directors and placement of such transactions before the Audit Committee. We have not carried out any procedure to determine whether the related party transactions were undertaken at arm's length price or not.
Based on our review, nothing has come to our attention which causes us to believe that the Statement does not appropriately reflect the Company's compliance, in all material respects, with the best practices contained in the Code of Corporate Governance as applicable to the Company for the year ended 30 June 2013.
Islamabad KPMG Taseer Hadi & Co.21 August 2013 Chartered Accountants
Engagement Partner: Riaz Pesnani
Review Report to Members

19F C C L
Annual Report 2013
Auditors’ Report
We have audited the annexed balance sheet of Fauji Cement Company Limited (“the Company”) as at 30 June 2013 and the related profit and loss account, statement of comprehensive income, cash flow statement and statement of changes in equity together with the notes forming part thereof, for the year then ended and we state that we have obtained all the information and explanations which, to the best of our knowledge and belief, were necessary for the purposes of our audit.
It is the responsibility of the Company's management to establish and maintain a system of internal control, and prepare and present the above said statements in conformity with the approved accounting standards and requirements of the Companies Ordinance, 1984. Our responsibility is to express an opinion on these statements based on our audit.
We conducted our audit in accordance with the auditing standards as applicable in Pakistan. These standards require that we plan and perform the audit to obtain reasonable assurance about whether the above said statements are free of any material misstatement. An audit includes examining, on a test basis, evidence supporting the amounts and disclosures in the above said statements. An audit also includes assessing the accounting policies and significant estimates made by management, as well as, evaluating the overall presentation of the above said statements. We believe that our audit provides a reasonable basis for our opinion and, after due verification, we report that:-
a) in our opinion, proper books of account have been kept by the Company as required by the Companies Ordinance, 1984;
b) in our opinion-
i) the balance sheet and profit and loss account together with the notes thereon have been drawn up in conformity with the Companies Ordinance, 1984, and are in agreement with the books of account and are further in accordance with accounting policies consistently applied;
ii) the expenditure incurred during the year was for the purpose of the Company's business; and
iii) the business conducted, investments made and the expenditure incurred during the year were in accordance with the objects of the Company;
c) in our opinion and to the best of our information and according to the explanations given to us, the balance sheet, profit and loss account, statement of comprehensive income, cash flow statement and statement of changes in equity together with the notes forming part thereof conform with approved accounting standards as applicable in Pakistan, and, give the information required by the Companies Ordinance, 1984, in the manner so required and respectively give a true and fair view of the state of the Company's affairs as at 30 June 2013 and of the profits, its cash flows and changes in equity for the year then ended; and
d) in our opinion, no Zakat was deductible at source under the Zakat and Ushr Ordinance, 1980 (XVIII of 1980).
Islamabad KPMG Taseer Hadi & Co.21 August 2013 Chartered Accountants
Engagement Partner: Riaz Pesnani

20F C C L
Annual Report 2013
Balance Sheet as at 30 June 2013
2013
2012
Note
Rupees'000
Rupees'000
SHARE CAPITAL AND RESERVES
Share capital
4
13,798,150
13,798,150
Reserves
5
2,138,211
106,955
15,936,361
13,905,105
NON -
CURRENT LIABILITIES
Long term financing -
secured
6
7,924,264
10,174,513
Deferred liabilities
7
2,034,994
1,129,674
CURRENT LIABILITIES
Trade and other payables 8 1,483,438 1,778,447
Markup accrued 206,362 349,377
Short term borrowings - secured 9 159,685 985,954
Current portion of long term financing 6 2,559,945 2,380,395
4,409,430 5,494,173
30,305,049 30,703,465
CONTINGENCIES AND COMMITMENTS 10
The annexed notes 1 to 37 form an integral part of these financial statements.
These financial statements were authorised for issue by the Board of Directors of the Company in
their meeting held on 21 August 2013.
Chief Executive

21F C C L
Annual Report 2013
2013
2012
Note Rupees'000
Rupees'000
NON - CURRENT ASSETS
Property, plant and equipment 11 24,734,325
25,897,954
Long term advance 12 2,700
3,600
Long term deposits and prepayments 13 528,934 642,093
25,265,959
26,543,647
CURRENT ASSETS
Stores, spares and loose tools 14 1,869,919 2,554,433
Stock in trade
15
981,092
955,337
Trade debts 16 205,802 64,241
Advances 17 12,920
13,077
Trade deposits, short term prepayments
and balances with statutory authority 18 179,119
192,024
Interest accrued 10,472
393
Other receivables 19 22,201 165,242
Derivative financial instrument 20 55,394
-
Cash and bank balances 21 1,702,171 215,071
5,039,090 4,159,818
30,305,049 30,703,465
Director
Balance Sheet as at 30 June 2013

22F C C L
Annual Report 2013
Profit and Loss Account for the year ended June 201330
2013
2012
Note Rupees'000
Rupees'000
Turnover - net
22 15,967,900
11,523,050
Cost of sales 23 (10,887,427)
(8,454,600)
Gross profit 5,080,473
3,068,450
Administrative expenses
24 (205,074)
(129,180)
Distribution cost 25 (143,866)
(101,642)
Other operating expenses 26 (228,579)
(72,457)
Finance cost 27 (1,512,148)
(1,825,445)
Other income 28 94,719
26,519
Profit before taxation 3,085,525
966,245
Taxation 29 (988,458) (413,655)
Profit for the year
2,097,067
552,590
Earnings per share -
Basic (Rupees)
30.1
1.42
0.29
Earnings per share -
Diluted (Rupees)
30.2
1.42
0.29
The annexed notes 1 to 37 form an integral part of these financial statements.
DirectorChief Executive
23F C C L
Annual Report 2013
DirectorChief Executive
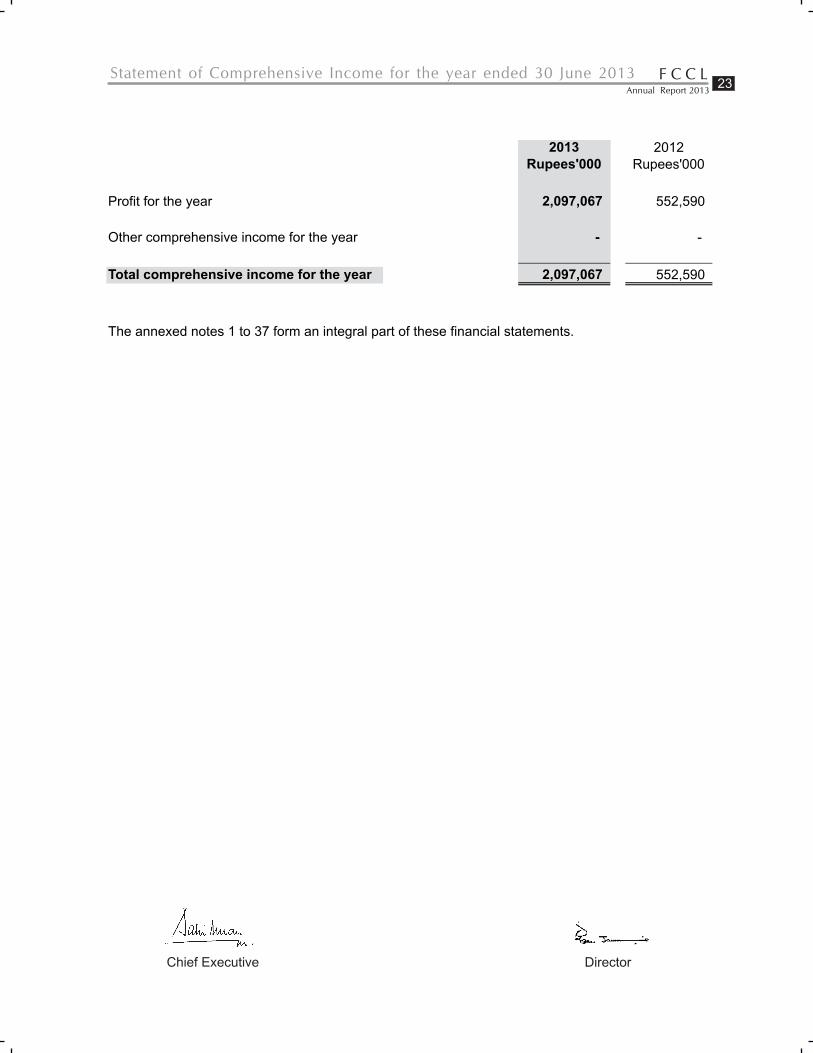
Statement of Comprehensive Income for the year ended 30 June 2013
2013
2012
Rupees'000
Rupees'000
Profit for the year
2,097,067
552,590
Other comprehensive income for the year
-
-
Total comprehensive income for the year
2,097,067
552,590
The annexed notes 1 to 37 form an integral part of these financial statements.

24F C C L
Annual Report 2013
DirectorChief Executive
Cash Flow Statement for the year ended 30 June 2013
2013
2012
Note
Rupees'000
Rupees'000 Cash flows from operating activities
Net profit before taxation
3,085,525
966,245 Adjustments for:
Depreciation
1,273,892
1,070,083
Provision for compensated absences
36,757
20,321
Workers' (Profit) Participation Fund including interest and WWF
227,651
71,455
Finance cost
1,511,851
1,825,187
Gain on disposal of property, plant and equipment
(870)
(7,523)
Interest income including interest on long term advance
(65,885)
(9,343)
2,983,396
2,970,180
Operating cash flows before working capital changes
6,068,921
3,936,425
Decrease/ (increase) in stores and stocks
658,759
(571,675)
Decrease in long-term deposits and prepayments
-
2
Decrease in long-term advance
900
900
Increase in trade debts
(141,561)
(27,281)
Decrease in advances
157
27,656
Decrease in trade deposits, short term prepayments and
balance with statutory authority
6,423
586,815
Decrease in other receivables
143,041
2,193
(Decrease)/ increase in trade and other payables
(457,096)
512,827
210,623
531,437
Cash generated from operations
6,279,544
4,467,862
Compensated absences paid
(18,178)
(21,651)
Payment to Workers' (Profit) Participation Fund
(177,169)
(26,464)
Taxes paid
(89,957)
(114,248) Net cash generated from operating activities
5,994,240
4,305,499
Cash flows from investing activities
Additions in property, plant and equipment
(113,253)
(142,147)
Proceeds from disposal of property, plant and equipment
3,860
7,853
Interest received on bank deposits and long term advance
55,806
9,786 Net cash used in investing activities
(53,587)
(124,508)
Cash flows from financing activities
Repayment of long term finances
(2,423,912)
(1,671,082)
Repayment of sub-ordinated loan
-
(3,189,000)
Proceeds from issue of shares - net of transaction cost
-
2,325,555
Dividend paid on preference shares
(175,573)
(66,885)
Payment of short term borrowings
(940,000)
(466,375)
Finance cost paid
(1,027,799)
(1,427,975) Net cash used in financing activities
(4,567,284)
(4,495,762)
Net increase/ (decrease) in cash and cash equivalents
1,373,369
(314,771) Cash and cash equivalents at beginning of the year
169,117
483,888
Cash and cash equivalents at end of the year 31 1,542,486
169,117
The annexed notes 1 to 37 form an integral part of these financial statements.

25F C C L
Annual Report 2013
DirectorChief Executive
Statement of Changes in Equity for the year ended 30 June 2013
Share capital
Advance against issue of shares
Capital reserve
Revenue reserve
Total
Ordinary
Preference
Share premium/
(discount on issue of shares)
Hedging reserve
Un-appropriated
profit
Rupees'000
Balance at 01 July 2011
6,932,895
486,992
861,871
1,826,452
(606,629)
1,512,436
11,014,017
Total comprehensive income for the year
Profit for the year
-
-
-
-
-
552,590
552,590
Total comprehensive income for the year
-
-
-
-
-
552,590
552,590
Transfer during the year
-
-
-
-
188,516
-
188,516
Transaction with owners, recorded directly in equity
Dividend on preference shares @ Rs. 3.60 per share
-
-
-
-
-
(175,573)
(175,573)
Amount received against issue of right shares
-
-
2,327,261
-
-
-
2,327,261
Issuance of right shares at discount
6,378,263
-
(3,189,132)
(3,189,131)
-
-
-
Cost incurred in connection with right issue
-
-
-
(1,706)
-
-
(1,706)
Total transaction with owners, recorded directly in equity
6,378,263
-
(861,871)
(3,190,837)
-
(175,573)
2,149,982
Balance at 30 June 2012
13,311,158
486,992
-
(1,364,385)
(418,113)
1,889,453
13,905,105
Total comprehensive income for the year
Profit for the year
-
-
-
-
-
2,097,067
2,097,067
Total comprehensive income for the year
-
-
-
-
-
2,097,067
2,097,067
Transfer during the year
-
-
-
-
144,876
-
144,876
Transaction with owners, recorded directly in equity
Dividend on preference shares @ Rs. 4.33 per share
-
-
-
-
-
(210,687)
(210,687)
Total transaction with owners, recorded directly in equity
-
-
-
-
-
(210,687)
(210,687)
Balance at 30 June 2013
13,311,158
486,992
-
(1,364,385)
(273,237)
3,775,833
15,936,361
The annexed notes 1 to 37 form an integral part of these financial statements.

26F C C L
Annual Report 2013
1. LEGAL STATUS AND OPERATIONS
Fauji Cement Company Limited ("the Company") is a public limited company incorporated in Pakistan on 23 November 1992 under the Companies Ordinance, 1984. The Company commenced its business with effect from 22 May 1993. The shares of the Company are quoted on the Karachi, Islamabad and Lahore Stock Exchanges in Pakistan. The principal activity of the Company is manufacturing and sale of ordinary portland cement. The Company's registered office is situated at Fauji Towers, Block-III, 68-Tipu Road, Rawalpindi.
2. BASIS OF PREPARATION
2.1 Statement of Compliance
These financial statements have been prepared in accordance with approved accounting standards as applicable in Pakistan. Approved accounting standards comprise of such International Financial Reporting Standards (IFRS) issued by the International Accounting Standards Board as are notified under the Companies Ordinance, 1984, provisions of and directives issued under the Companies Ordinance, 1984. In case requirements differ, the provisions of, or directives issued under the Companies Ordinance, 1984 shall prevail.
2.2 Basis of measurement
These financial statements have been prepared under the historical cost convention, except that derivative financial instruments are measured at fair value.
2.3 Functional and presentation currency
Items included in the financial statements are measured using the currency of the primary economic environment in which the Company operates. The financial statements are presented in Pakistan Rupees (PKR) which is the Company's functional and presentation currency.
2.4 Use of estimates and judgments
The preparation of financial statements in conformity with the approved accounting standards require management to make judgments, estimates and assumptions that affect the application of policies and reported amounts of assets and liabilities, income and expenses. The estimates and associated assumptions are based on historical experience and various other factors that are believed to be reasonable under the circumstances, the results of which form the basis of making the judgments about carrying values of assets and liabilities that are not readily apparent from other sources. Actual results may differ from these estimates.
The estimates and underlying assumptions are reviewed on an ongoing basis. Revisions to accounting estimates are recognized in the period in which the estimates are revised if the revision affects only that period, or in the period of the revision and future periods if the revision affects both current and future periods.
Judgments made by the management in application of the approved accounting standards that have significant effect on the financial statements and estimates with a significant risk of material adjustment in the next year are discussed in the ensuing paragraphs.
2.4.1 Property, plant and equipment
The Company regularly reviews useful life and residual value for the calculation of depreciation. Further where applicable, an estimate of recoverable amount of assets is made for possible impairment on an annual basis.
Notes to the Financial Statements for the year ended 30 June 2013

27F C C L
Annual Report 2013
2.4.2 Provision for inventory obsolescence and doubtful receivables
The Company reviews the net realisable value of stock in trade and stores, spare parts and loose tools to assess any diminution in the respective carrying values. Net realisable value is determined with reference to estimated selling price less estimated cost to complete and estimated cost to make the sales. Further the carrying amounts of trade and other receivables are assessed on a regular basis and if there is any doubt about the realisability of these receivables, appropriate amount of provision is made.
2.4.3 Taxation
In making the estimates for income taxes payable by the Company, the management refers to the applicable law and the decisions of appellate authorities on pertinent issues in the past.
The Company regularly reviews the trend of proportion of incomes under Presumptive Tax Regime and Normal Tax Regime income and the change in proportions, if significant, is accounted for in the year of change.
2.4.4 Derivative financial instruments
The Company reviews the fair value of derivative financial instruments on regular basis. Fair value is sensitive to changes in interest and exchange rates. If there is any change in interest and exchange rates, fair value is adjusted accordingly.
2.4.5 Contingencies
The Company reviews the status of all the legal cases on a regular basis. Based on the expected outcome and legal advisors' judgments, appropriate provision is made.
2.5 Standards, interpretations and amendments to approved accounting standards that are not yet effective
The following standards, amendments and interpretations of approved accounting standards will be effective for accounting periods beginning on or after 01 July 2013:
-IAS 19 Employee Benefits (amended 2011) - (effective for annual periods beginning on or after 1 January 2013). The amended IAS 19 includes the amendments that require actuarial gains and losses to be recognised immediately in other comprehensive income; this change will remove the corridor method and eliminate the ability for entities to recognise all changes in the defined benefit obligation and in plan assets in profit or loss, which currently is allowed under IAS 19; and that the expected return on plan assets recognised in profit or loss is calculated based on the rate used to discount the defined benefit obligation. The amendments have no impact on financial statements of the Company.
-IAS 27 Separate Financial Statements (2011) - (effective for annual periods beginning on or after 1 January 2013). IAS 27 (2011) supersedes IAS 27 (2008). Three new standards IFRS 10 - Consolidated Financial Statements, IFRS 11- Joint Arrangements and IFRS 12- Disclosure of Interest in Other Entities dealing with IAS 27 would be applicable effective 1 January 2013. IAS 27 (2011) carries forward the existing accounting and disclosure requirements for separate financial statements, with some minor clarifications. The amendments have no impact on financial statements of the Company.
Notes to the Financial Statements for the year ended 30 June 2013

28F C C L
Annual Report 2013
-IAS 28 Investments in Associates and Joint Ventures (2011) - (effective for annual periods beginning on or after 1 January 2013). IAS 28 (2011) supersedes IAS 28 (2008). IAS 28 (2011) makes the amendments to apply IFRS 5 to an investment, or a portion of an investment, in an associate or a joint venture that meets the criteria to be classified as held for sale; and on cessation of significant influence or joint control, even if an investment in an associate becomes an investment in a joint venture. The amendments have no impact on financial statements of the Company.
- Offsetting Financial Assets and Financial Liabilities (Amendments to IAS 32) – (effective for annual periods beginning on or after 1 January 2014). The amendments address inconsistencies in current practice when applying the offsetting criteria in IAS 32 Financial Instruments: Presentation. The amendments clarify the meaning of 'currently has a legally enforceable right of set-off'; and that some gross settlement systems may be considered equivalent to net settlement.
- Offsetting Financial Assets and Financial Liabilities (Amendments to IFRS 7) – (effective for annual periods beginning on or after 1 January 2013). The amendments to IFRS 7 contain new disclosure requirements for financial assets and liabilities that are offset in the statement of financial position or subject to master netting agreement or similar arrangement.
-Annual Improvements 2009–2011 (effective for annual periods beginning on or after 1 January 2013). The new cycle of improvements contains amendments to the following four standards, with consequential amendments to other standards and interpretations.
-IAS 1 Presentation of Financial Statements is amended to clarify that only one comparative period – which is the preceding period – is required for a complete set of financial statements. If an entity presents additional comparative information, then that additional information need not be in the form of a complete set of financial statements. However, such information should be accompanied by related notes and should be in accordance with IFRS. Furthermore, it clarifies that the 'third statement of financial position', when required, is only required if the effect of restatement is material to statement of financial position.
-IAS 16 Property, Plant and Equipment is amended to clarify the accounting of spare parts, stand-by equipment and servicing equipment. The definition of 'property, plant and equipment' in IAS 16 is now considered in determining whether these items should be accounted for under that standard. If these items do not meet the definition, then they are accounted for using IAS 2 Inventories. The amendments have no impact on financial statements of the Company.
-IAS 32 Financial Instruments: Presentation - is amended to clarify that IAS 12 Income Taxes applies to the accounting for income taxes relating to distributions to holders of an equity instrument and transaction costs of an equity transaction. The amendment removes a perceived inconsistency between IAS 32 and IAS 12.
-IAS 34 Interim Financial Reporting is amended to align the disclosure requirements for segment assets and segment liabilities in interim financial reports with those in IFRS 8 Operating Segments. IAS 34 now requires the disclosure of a measure of total assets and liabilities for a particular reportable segment. In addition, such disclosure is only required when the amount is regularly provided to the chief operating decision maker and there has been a material change from the amount disclosed in the last annual financial statements for that reportable segment.
Notes to the Financial Statements for the year ended 30 June 2013

29F C C L
Annual Report 2013
-IFRIC 20 - Stripping cost in the production phase of a surface mining (effective for annual periods beginning on or after 1 January 2013). The interpretation requires production stripping cost in a surface mine to be capitalized if certain criteria are met. The amendments have no impact on financial statements of the Company.
-IFRIC 21- Levies an Interpretation on the accounting for levies imposed by governments' (effective for annual periods beginning on or after 1 January 2014). IFRIC 21 is an interpretation of IAS 37 Provisions, Contingent Liabilities and Contingent Assets. IAS 37 sets out criteria for the recognition of a liability, one of which is the requirement for the entity to have a present obligation as a result of a past event (known as an obligating event). The Interpretation clarifies that the obligating event that gives rise to a liability to pay a levy is the activity described in the relevant legislation that triggers the payment of the levy.
-IAS 39 Financial Instruments: Recognition and Measurement- Novation of Derivatives and Continuation of Hedge Accounting (Amendments to IAS 39) (effective for annual periods beginning on or after 1 January 2014). The narrow-scope amendments will allow hedge accounting to continue in a situation where a derivative, which has been designated as a hedging instrument, is novated to effect clearing with a central counterparty as a result of laws or regulation, if specific conditions are met (in this context, a novation indicates that parties to a contract agree to replace their original counterparty with a new one).
-Amendment to IAS 36 “Impairment of Assets” Recoverable Amount Disclosures for Non-Financial Assets (effective for annual periods beginning on or after 1 January 2014). These narrow-scope amendments to IAS 36 Impairment of Assets address the disclosure of information about the recoverable amount of impaired assets if that amount is based on fair value less costs of disposal.
3. SUMMARY OF SIGNIFICANT ACCOUNTING POLICIES
The accounting policies set out below have been applied consistently to the period presented in these financial statements.
3.1 Taxation
Income tax expense comprises current and deferred tax. Income tax is recognized in profit and loss account except to the extent that it relates to items recognized directly in statement of comprehensive income or equity, in which case it is recognized in statement of comprehensive income or equity.
Current
Provision for current taxation is based on taxable income at the current rate of tax after taking into account applicable tax credits, rebates and exemptions available, if any.
Deferred
Deferred tax liabilities are recognized for all major taxable temporary differences and deferred tax assets are recognized to the extent that is probable that taxable profits will be available against which the deductible temporary differences, unused tax losses and tax credits can be utilized.
Deferred tax is accounted for using the balance sheet liability method in respect of all major taxable temporary differences arising from differences between the carrying amount of assets and liabilities in the financial statements and the corresponding tax bases used in the computation of tax. The amount of deferred tax recognized is based on
Notes to the Financial Statements for the year ended 30 June 2013

30F C C L
Annual Report 2013
expected manner of realization or settlement of the carrying amount of assets and liabilities using the tax rates enacted or substantially enacted at the balance sheet date.
Taxable temporary difference are adjusted by the portion of income expected to fall under presumptive tax regime in accordance with the requirement of Accounting Technical Release - 27 of the Institute of Chartered Accountants of Pakistan. The effect of the adjustment is charged or credited to income currently.
3.2 Property, plant and equipment
Property, plant and equipment except freehold land and capital work in progress are stated at cost less accumulated depreciation and impairment loss, if any. Freehold land and capital work in progress are stated at cost less allowance for impairment, if any. Cost of property, plant and equipment includes acquisition cost, borrowing cost during construction phase of relevant asset and other directly attributable costs including trial run production expenses (net of income, if any). Transfers from capital work in progress are made to the relevant category of property, plant and equipment as and when the assets are available for use in the manner intended by the Company's management.
Depreciation is charged to income on the straight line method so as to write off the depreciable amount of the property, plant and equipment over their estimated useful lives at the rates specified in note 11. Depreciation on depreciable assets is commenced from the month the asset is available for use upto the date when the asset is disposed off.
The cost of replacing a major item of property, plant and equipment is recognized in the carrying amount of the item if it is probable that the future economic benefits embodied within the item will flow to the Company and its cost can be measured reliably. The carrying amount of the replaced item is derecognized. The cost of the day to day servicing of property, plant and equipment are recognized in profit or loss as incurred.
Gains and losses on disposal of an item of property, plant and equipment are determined by comparing the proceeds from disposals with the carrying amount of property, plant and equipment and are recognized on net basis within "other income" in profit or loss.
3.3 Impairment
Non-financial assets
The carrying amount of the Company's assets are reviewed at each balance sheet date to determine whether there is any indication of impairment. If any such indication exists, then the asset's recoverable amount is estimated. Impairment losses are recognized as expense in the profit and loss account.
An impairment loss is reversed if there has been a change in the estimates used to determine the recoverable amount and loss is reversed only to the extent that the asset's carrying amount does not exceed the carrying amount that would have been determined, net of depreciation or amortisation, if no impairment loss had been recognised. For non-financial assets, financial assets measured at amortized cost, available-for-sale financial assets that are debt securities, the reversal is recognised in profit and loss account.
Financial assets
A financial asset is assessed at each reporting date to determine whether there is any objective evidence that it is impaired. A financial asset is considered to be impaired if objective evidence indicates that one or more events have had a negative effect on the estimated future cash flows of that asset. Individually significant financial assets are tested for impairment on an individual basis. The remaining financial assets are assessed collectively in groups that share similar credit risk characteristics.
Notes to the Financial Statements for the year ended 30 June 2013

31F C C L
Annual Report 2013
3.4 Stores, spares and loose tools
Stores, spares and loose tools are valued at lower of weighted average cost and net realisable value less impairment, if any. Cost is determined using weighted average method except for items in transit which is determined on the basis of cost incurred upto the balance sheet date. For items which are slow moving and/ or identified as surplus to the Company's requirements, adequate impairment is recognised. The Company reviews the carrying amount of stores, spare parts and loose tools on a regular basis and provision is made for obsolescence.
3.5 Stock in trade
Stock of raw material, except for those in transit, work in process and finished goods are valued at the lower of average cost and net realizable value. Stock of packing material is valued at moving average cost less impairment, if any. Cost of work in process and finished goods comprises cost of direct materials, labour and appropriate manufacturing overheads.
Materials in transit are stated at cost comprising invoice value plus other charges paid thereon less impairment, if any.
Net realizable value signifies the estimated selling price in the ordinary course of business less estimated cost of completion and estimated costs necessary to be incurred in order to make a sale.
3.6 Foreign currency transactions
Transactions in foreign currencies are translated into functional currency at exchange rates at the date of transaction. Monetary assets and liabilities denominated in foreign currencies at balance sheet date are translated to the functional currency at the exchange rates at that date. The foreign currency gain or loss on monetary items is the difference between amortised cost in the functional currency at beginning of the year, adjusted for effective interest and payments during the year, and amortised cost in foreign currency translated at the exchange rate at balance sheet date. Exchange differences are included in the profit and loss account.
3.7 Revenue recognition
3.8 Mark-up bearing borrowings
Mark-up bearing borrowings are recognized initially at cost being the fair value of consideration received, less attributable transaction costs. Subsequent to initial recognition, markup bearing borrowings are stated at originally recognized amount less subsequent repayments, while the difference between the original recognized amounts (as reduced by periodic payments) and redemption value is recognized in the profit and loss account over the period of borrowings on an effective rate basis.
Revenue from sale of goods in the course of ordinary activities is measured at the fair value of the consideration received or receivable. Revenue is recognized when significant risks and rewards of ownership have been transferred to the customer, recovery of the consideration is probable, there is no continuing management involvement with the goods, and the amount of revenue can be measured reliably. The transfer of risk and rewards occur when the goods are despatched. Scrap sales and miscellaneous receipts are recognised on realised amounts. Profit on deposits and advances is accounted for on a time proportion basis using the applicable rate of interest.
Notes to the Financial Statements for the year ended 30 June 2013
32F C C L
Annual Report 2013
3.9 Financial instruments
Financial assets and financial liabilities are recognized when the Company becomes a party to the contractual provisions of the instrument and assets and liabilities are stated at fair value and amortized cost as the case may be. The Company de-recognizes the financial assets and liabilities when it ceases to be a party to such contractual provision of the instrument. The Company recognises the regular way of purchase or sale of financial assets using settlement date accounting.
Trade and other payables
Liabilities for trade and other amounts payable are initially recognised at fair value less any directly attributable transaction cost. Subsequent to initial recognition, these are measured at amortised cost using effective interest method.
Trade debts and other receivables
Trade debts and other receivables are are initially recognised at fair value plus any directly attributable transaction cost. Subsequent to initial recognition, these are measured at amortised cost using effective interest method, less any impairment losses. Known bad debts are written off, when identified.
Off-setting of financial assets and liabilities
A financial asset and a financial liability is offset and the net amount is reported in the balance sheet if the Company has a legally enforceable right to set-off the recognized amounts and intends either to settle on a net basis or to realize the asset and settle the liability simultaneously.
3.10 Borrowing cost
Borrowing costs are recognised as an expense in the period in which they are incurred except where such costs relate to the acquisition, construction or production of a qualifying asset in which case such costs are capitalised as part of the cost of that asset. Borrowing cost includes exchange differences arising from foreign currency borrowings to the extent these are regarded as an adjustment to borrowing costs.
3.11 Staff retirement benefits
Provident fund
The Company operates a defined contributory provident fund scheme for permanent employees. Monthly contributions are made to the fund @ 10% of the basic salary both by the Company and employees. The Company's contribution is charged to the profit and loss account.
Compensated absences
The Company also provides for compensated absences to its employees on unavailed leaves according to the Company's policy. Charge for the year is included in profit and loss account.
3.12 Derivative financial instruments
Derivatives are recognised initially at fair value and attributable transaction costs are recognised in profit or loss as incurred. Subsequent to initial recognition, derivatives are measured at fair value and changes therein are recognised in profit or loss.
Notes to the Financial Statements for the year ended 30 June 2013
33F C C L
Annual Report 2013
3.13 Cash and cash equivalents
Cash and cash equivalents comprise cash in hand, balances at banks, running finances
and short term highly liquid investments with maturity of three months or less from the
acquisition date that are subject to insignificant risk of changes in their fair value.
3.14 Provisions
A provision is recognized in the balance sheet when the Company has a legal or
constructive obligation as a result of a past event, and it is probable that an outflow of
economic benefits will be required to settle the obligation and a reliable estimate can be
made of the amount of obligation. Provisions are measured at the present value of
expected expenditure, discounted at a pre tax rate that reflects current market
assessment of the time value of the money and the risk specific to the obligation.
Provisions are reviewed at each balance sheet date and adjusted to reflect current best
estimate.
3.15 Earnings per share
The Company presents basic and diluted earnings per share (EPS). Basic EPS is
calculated by dividing the profit and loss attributable to ordinary shareholders of the
Company by the weighted average number of ordinary shares outstanding during the
period. Diluted EPS is determined by using profit and loss attributable to ordinary
shareholders and the weighted average number of ordinary shares outstanding, adjusted
for the effects of all dilutive potential ordinary shares.
3.16 Dividend
Dividend on ordinary shares is recognized as a liability in the period in which it is declared.
Dividend on preference shares is recognized as a liability when the conditions as agreed
with the preference shareholders are fulfilled.
Notes to the Financial Statements for the year ended 30 June 2013

34F C C L
Annual Report 2013
4 SHARE CAPITAL
AUTHORIZED SHARE CAPITAL
This represents 1,451,300,813 (2012 : 1,451,300,813) ordinary shares of Rs. 10 each and
48,699,187 (2012 : 48,699,187) preference shares of Rs. 10 each.
ISSUED, SUBSCRIBED AND PAID UP CAPITAL
4.1 Preference shares are convertible into ordinary shares only, at any time at Rs.10 each without further payment, such conversion being irreversible once exercised and having the same rights as ordinary shares in the Company including pari passu voting rights with ordinary shares.
4.2 Fauji Foundation holds 494,951,055 (2012: 787,376,055) ordinary shares and 48,699,187 (2012: 48,699,187) preference shares of the Company at the year end. In addition Fauji Fertilizer Company Limited, Fauji Fertilizer Bin Qasim Limited and Fauji Oil Terminal & Distribution Company Limited hold 93,750,000 (2012: 93,750,000) , 18,750,000 (2012 : 18,750,000) and 18,750,000 (2012: 18,750,000) ordinary shares respectively of the Company at the year end.
2013
2012 5 RESERVES
Rupees '000
Rupees '000
Capital
Discount on issue of shares
(1,364,385)
(1,364,385)
Hedging reserve
(273,237)
(418,113)
Revenue
Un-appropriated profit
3,775,833
1,889,453
2,138,211
106,955
Notes to the Financial Statements for the year ended 30 June 2013
2013
2012
2013
2012
Number '000
Number '000
Rupees '000
Rupees '000
Ordinary shares
171,310 171,310 Ordinary shares of Rs. 10 each fully paid in cash
1,713,105 1,713,105
199,433 199,433 Ordinary shares of Rs. 10 each issued at a discount of Rs. 3.85 per share -
paid in cash
1,994,325 1,994,325
322,546
322,546 Ordinary shares of Rs.
10 each
issued at a premium of Rs. 6 per share-paid in cash
3,225,465
3,225,465
637,826
637,826
Ordinary shares of Rs. 10 each issued at a discount of Rs. 5 per share paid in cash
6,378,263
6,378,263
1,331,115
1,331,115
13,311,158
13,311,158
Preference shares (note 4.1)
48,699
48,699
Preference shares of Rs. 10 each issued at a discount of Rs. 3.85 per share -
paid in cash
486,992
486,992
1,379,814
1,379,814
13,798,150
13,798,150

35F C C L
Annual Report 2013
6.1 This is a syndicated term finance facility obtained from consortium of banks consisting of Allied Bank Limited, United Bank Limited, Bank Alfalah Limited, Bank of Khyber, Bank Al Habib Limited and Soneri Bank Limited. During the year, Bank Alfalah Limited has also taken over the loan liability pertaining to Pak Libya Investment Company Limited and Summit Bank Limited.
6.2 This foreign currency loan facility is an Export Credit Agency (Euler Hermes Kreditversicherungs-AG (Hermes)) backed term finance facility obtained through The Royal Bank of Scotland N.V.
6.3 The above facilities are secured by way of creation of 1st pari passu mortgage over the immovable property of the Company and hypothecation charge over all current and future assets of the Company with 25% margin. Allied Bank Limited is the security trustee and inter creditor agent on behalf of all the first pari passu lenders.
6
LONG TERM FINANCING- Secured
-
Loans from banking companies-under mark up arrangements
Lender
Note
2013
2012
Rate of interest per
annum
Outstanding installment
Interest payable
Rupees'000
Syndicate Finance
6.1
2,690,909
3,363,636
6 month's KIBOR + 1.5%
(2012: 6 month's KIBOR + 2%)
8 semi annual installments ending 16 February 2017
Semi annual
The Royal Bank of Scotland N.V.
6.2
5,813,100
6,904,337
6 month's LIBOR + 0.8%
(2012: 6 month's LIBOR +0.8%)
8 semi annual installments ending 7 May 2017
Semi annual
National Bank of Pakistan
1,392,857
1,500,000
6 month's KIBOR + 1.75%
(2012: 6 month's KIBOR +2.25%)
13 semi annual installments ending 19 July 2019
Semi annual
Faysal Bank Limited
357,143
500,000
6 month's KIBOR + 1%
(2012: 6 month's KIBOR + 2%)
5 semi annual installments ending 7 December 2015
Semi annual
Habib Bank Limited
268,800
345,600
6 month's KIBOR + 1%
(2012: 6 month's KIBOR +2.5%)
7 semi annual
installments ending 29 July 2016
Semi annual
Less: Unamortized portion of transaction cost
(38,600)
(58,665)
10,484,209
12,554,908
Less: Current portion shown under current liabilities
(2,559,945)
(2,380,395)
7,924,264
10,174,513
2013
2012
7 DEFERRED LIABILITIES
Note
Rupees'000
Rupees'000
Provision for compensated absences
7.1
38,152
24,851
Deferred taxation
7.2
1,996,842
1,104,823
2,034,994
1,129,674
7.1 Provision for compensated absences
Balance at beginning of the year
29,832
31,162
Add: Charge for the year
36,757
20,321
66,589
51,483
Less: Amount paid during the year
(18,178)
(21,651)
48,411 29,832
Less: Amount transferred to current liabilities
(10,259)
(4,981)
38,152
24,851
Notes to the Financial Statements for the year ended 30 June 2013

36F C C L
Annual Report 2013
As per the rules of compensated absences, unavailed leaves up to 30 days are payable at the time of retirement. Compensated absences over and above the period of 30 days are paid to the employees as per the Company policy. Therefore the balance of unavailed compensated absences over that period has been transferred to current liabilities. Actuarial valuation has not been carried out as the impact is considered immaterial.
2013
2012
7.2 Deferred taxation
Note
Rupees'000
Rupees'000
Deductible temporary differences
Unused tax losses representing unabsorbed depreciation
(1,950,359)
(2,985,687)
Unrealised exchange loss on foreign currency loan
(212,466)
-
Taxable temporary difference
Excess of accounting book value of fixed assets over their tax base
4,159,667
4,090,510
1,996,842
1,104,823
8 TRADE AND OTHER PAYABLES
Creditors 135,022 346,396
Accrued liabilities 381,322 400,042
Retention money
14,891
14,649
Security deposits 79,661 70,554
Advances from customers 213,343 192,416
Workers' (Profit) Participation Fund 8.1 40,644 51,872
Workers' Welfare Fund 89,671 27,962
Swap fee payable
71,214
-
Federal excise duty payable
67,875 84,799
Sales tax payable (net) 69,507 42,887
Other liabilities
97,081 364,055
Compensated absences
10,259 4,981
Dividend payable on preference shares
210,687 175,573
Unclaimed dividend
2,261 2,261
1,483,438 1,778,447
8.1 Workers' (Profit) Participation Fund (WPPF)
Balance at beginning of the year
51,872
26,206
Interest on funds utilised in the Company's business
297
258
Allocation for the year
165,644
51,872
Payment to the fund during the year
(177,169)
(26,464)
40,644
51,872
Allocation for the year is made up as follows:
Profit for the year before tax, WPPF and WWF
3,312,879 1,037,442
Charge for the year at the rate of 5%
165,644
51,872
Notes to the Financial Statements for the year ended 30 June 2013

37F C C L
Annual Report 2013
Notes to the Financial Statements for the year ended 30 June 2013
The Company filed an application before FBR under Section 47A of the Sales Tax Act, 1990 and Section 195C of the Customs Act, 1969 for constitution of an Alternate Dispute Resolution Committee (ADRC) on the above cases. The proceedings of ADRC were concluded and final recommendations were forwarded to FBR, which were in the Company's favour. FBR has informed the Company that recommendations of ADRC are not acceptable and advised the Company to plead the cases in court of law. The management of the Company is confident of a favourable outcome, since the management believes that the goods imported by the Company (against which the purported duties have been assessed) were covered by statutory exemption issued by the Ministry of Finance in 1992, the grant of which was confirmed by the custom authorities through various documents obtained from the appropriate authorities.

38F C C L
Annual Report 2013
b) The Company has filed an appeal in Lahore High Court against decision of Civil Court in a suit for damages filed by a supplier of raw materials upon termination of its contract of services. Arbitrators of the case have ascertained a liability of Rs. 32.979 million payable by the Company out of which Rs. 14.923 million has been provided for in these financial statements. The net liability of Rs. 18.056 million so arising, has not been accounted for, as the management is confident that the appeal will ultimately be decided in favour of the Company.
c) A claim for damages amounting to Euros 833,120 equivalent Pak Rs. 108.31 million was in a tribunal of Arbitrators by the supplier of plant and machinery against which the Company had filed a counter claim of Euros 410,914 equivalent Pak Rs. 53.42 million and Rs. 11.824 million (less the aggregate sum of equivalent Pak Rs. 21.33 million previously recovered/ adjusted by the Company). In the arbitration proceedings between the supplier and the Company, awards were passed by each arbitrator appointed by each party. As a result of the difference in opinion of the two arbitrators, the matter was referred to an umpire, on whose recommendations the supplier filed the award in the Court of Senior Civil Judge Islamabad, for the same to be made a rule of court where it is still pending. The management believes that the Company has a strong grounds to argue the case in the court and accordingly, no liability has been accounted for in these financial statements.
d) The Company is contesting a claim of damages amounting to Rs. 19.75 million filed by a supplier of plant and machinery arising from encashment by the Company of bank guarantee amounting to Rs. 5.32 million which is appearing under payables in these financial statements. The case is currently in High Court. No provision has been made against any liability as the management is confident that the case will be decided in favour of the Company.
e) Competition Commission of Pakistan (CCP) has issued a show cause notice dated October 28, 2008 to 21 cement manufacturers (including the Company) under section 30 of the Competition Ordinance, 2007 and imposed a penalty of Rs. 266 million on the Company. The cement manufacturers (including the Company) have filed a review petition in Lahore High Court (Court) and also challenged the CCP order in the Court . Based on expert legal advice, the management is confident that the case will be decided in favour of the Company.
f) The Company is contingently liable in respect of guarantees amounting to Rs. 363 million (2012: Rs. 347 million) issued by banks on behalf of the Company in the normal course of business. These guarantees are secured against margin/lien on bank deposits and against first pari passu ranking charge by way of hypothecation over the present and future assets of the Company (excluding land and building) retaining 25% margin.
g) For tax related contingency refer note 30.1
10.2 Commitments
a) The Company has opened letters of credit for the import of spare parts valuing Rs. 82 million (2012: Rs. 51 million).
Notes to the Financial Statements for the year ended 30 June 2013

39F C C L
Annual Report 2013
Notes to the Financial Statements for the year ended 30 June 2013
6
PROP
ERTY
, PLA
NT A
ND E
QUIP
MEN
T
Free
hold
la
nd
Bu
ildin
g on
fre
ehol
d la
nd
Pl
ant a
nd
mac
hine
ry
St
ore
held
fo
r cap
ital
expe
nditu
re
Of
fice
equi
pmen
t
Co
mpu
ters
Elec
tric
inst
alla
tion
and
othe
r eq
uipm
ent
Furn
iture
an
d fit
tings
M
otor
ve
hicl
es
Quar
ry ro
ad
and
deve
lopm
ent
Capi
tal w
ork
in p
rogr
ess
To
tal
Rupe
es'00
0
Cost
Balan
ce a
s at 0
1 Ju
ly 20
11
141,
246
1,65
5,98
0
6,79
3,41
3
35,9
80
9,41
9
52,7
98
83,2
11
21,6
02
147,
424
27,8
55
21,6
07,7
03
30,5
76,6
31
Addit
ions d
uring
the
year
7,20
6
385
32,0
00
-
354
677
796
293
13,2
72
-
219,
325
274,
308
Disp
osals
-
-
-
-
(8)
(1,6
81)
-
-
(10,
106)
-
-
(11,
795)
Tran
sfers
-
3,39
4,09
5
18,4
18,1
00
-
-
-
-
-
-
-
(21,
812,
195)
-
Bala
nce
as a
t 30
June
201
2
148,
452
5,05
0,46
0
25,2
43,5
13
35,9
80
9,76
5
51,7
94
84,0
07
21,8
95
150,
590
27,8
55
14,8
33
30,8
39,1
44
Balan
ce a
s at 0
1 Ju
ly 20
12
148,
452
5,05
0,46
0
25,2
43,5
13
35,9
80
9,76
5
51,7
94
84,0
07
21,8
95
150,
590
27,8
55
14,8
33
30,8
39,1
44
Addit
ions d
uring
the
year
-
7,05
3
42,9
34
-
1,46
2
6,07
7
897
928
23,1
76
-
30,7
26
113,
253
Disp
osals
/writ
ten
off
-
-
-
(2,2
92)
(198
)
(1,2
68)
(24)
(41)
(18,
481)
-
-
(22,
304)
Tran
sfers
-
38,6
27
-
-
-
-
-
-
-
-
(38,
627)
-
Bala
nce
as a
t 30
June
201
3
148,
452
5,09
6,14
0
25,2
86,4
47
33,6
88
11,0
29
56,6
03
84,8
80
22,7
82
155,
285
27,8
55
6,93
2
30,9
30,0
93
Depr
eciat
ion
Balan
ce a
s at 0
1 Ju
ly 20
11
-
821,
996
2,80
5,05
5
-
7,09
6
39,6
50
71,7
76
10,2
01
98,9
43
27,8
55
-
3,88
2,57
2
Char
ge fo
r the
year
-
170,
693
861,
617
1,43
1
751
7,33
7
2,64
2
2,29
2
23,3
20
-
-
1,07
0,08
3
On d
ispos
als
-
-
-
-
(8)
(1,6
47)
-
-
(9,8
10)
-
-
(11,
465)
Bala
nce
as a
t 30
June
201
2
-
992,
689
3,66
6,67
2
1,43
1
7,83
9
45,3
40
74,4
18
12,4
93
112,
453
27,8
55
-
4,94
1,19
0
Balan
ce a
s at 0
1 Ju
ly 20
12
-
992,
689
3,66
6,67
2
1,43
1
7,83
9
45,3
40
74,4
18
12,4
93
112,
453
27,8
55
-
4,94
1,19
0
Char
ge fo
r the
year
-
203,
538
1,03
4,73
6
3,24
4
696
6,14
3
2,51
3
2,32
5
20,6
97
-
-
1,27
3,89
2
On d
ispos
als/w
ritte
n of
f
-
-
-
(277
)
(198
)
(1,2
43)
(24)
(41)
17,5
31)
-
-
(19,
314)
Bala
nce
as a
t 30
June
201
3
-
1,19
6,22
7
4,70
1,40
8
4,39
8
8,33
7
50,2
40
76,9
07
14,7
77
115,
619
27,8
55
-
6,19
5,76
8
Carry
ing a
mou
nts -
2013
148,
452
3,89
9,91
3
20,5
85,0
39
29,2
90
2,69
2
6,36
3
7,97
3
8,00
5
39,6
66
-
6,93
2
24,7
34,3
25
Carry
ing a
mou
nts -
2012
148,
452
4,05
7,77
1
21,5
76,8
41
34,5
49
1,92
6
6,45
4
9,58
9
9,40
2
38,1
37
-
14,8
33
25,8
97,9
54
Rate
s of d
epre
ciatio
n
-
4%
4%
4%
15%
33.3
3%
10%
-15%
15%
25%
10%

40F C C L
Annual Report 2013
12.1 This represents long term advance for construction of gas pipeline. It is repayable annually in equal installments over 4 years and carries mark-up @ 1.5% per annum.
11.1 Depreciation charge for the year has been allocated as follows:
2013
2012
Rupees'000
Rupees'000
Cost of sales
1,261,532
1,057,463
Distribution cost
4,242
5,264
Administrative expenses
8,118
7,356
1,273,892
1,070,083
11.2 Detail of disposals during the year is as follows:
Original cost
Book value
Sale proceeds
Gain/ (loss) Mode of disposal
Rupees'000
Motor vehicle 1,626 69 155 86
As per Company's policy to Mr. Mohammad Sarwar Ex-executive
Motor vehicle 1,769 113 172 59
As per Company's policy to Mr. Zubair Tahir Ex-executive
Motor vehicle 1,398 642 132 (510)
As per Company's policy to Mr. Saeed Akhtar Ex-executive
Aggregate of other assets disposed-off
17,511 2,166 3,401 1,235
2013
22,304 2,990 3,860 870
2012
11,795 330 7,853 7,523
12 LONG TERM ADVANCE - Considered good Note 2013
2013
2012
2012
Rupees'000
Rupees'000
Sui Northern Gas Pipelines Limited 12.1 3,600
4,500
Less: Amount receivable within 12 months shown
under current assets
(900)
(900)
2,700
3,600
13
LONG TERM DEPOSITS AND PREPAYMENTS
Note Rupees'000
Rupees'000
Islamabad Electric Supply Company Limited
61,590 61,590
Sui Northern Gas Pipelines Limited
25,011
25,011
Prepaid guarantee fee
13.1 442,333 555,492
528,934 642,093
Notes to the Financial Statements for the year ended 30 June 2013

41F C C L
Annual Report 2013
2013
2012
15 STOCK IN TRADE
Raw and packing material
201,766 132,198
Work in process
638,144 677,001
Finished goods
141,182 146,138
981,092 955,337
16 TRADE DEBTS
Unsecured
Considered good
152,146 63,504
Considered doubtful
3,281 3,281
155,427 66,785
Secured considered good
53,656 737
Less: Provision for doubtful debts
(3,281) (3,281)
205,802 64,241
17
11,781 11,986
239 191
ADVANCES
Advances - Considered good
To suppliers
To employees
Current portion of long term advance
900 900
12,920 13,077
18 TRADE DEPOSITS, SHORT TERM PREPAYMENTS AND BALANCES WITH STATUTORY AUTHORITY
Deposits 9,438 17,667
Prepayments 3,270 1,464
Advance tax-net 166,411 172,893
179,119 192,024
19 OTHER RECEIVABLES
Other receivables- Considered good
3,134 146,175
Margin on letter of guarantee
19,067 19,067
22,201 165,242
Notes to the Financial Statements for the year ended 30 June 2013
14 STORES, SPARES AND LOOSE TOOLS
Rupees'000
Rupees'000
Stores 801,266 1,501,742
Spares (Including items in transit of Rs. 25.2 million (2012: Rs. 4.7 million) 1,067,516
1,039,037
Loose tools
1,137
13,654
1,869,919
2,554,433
13.1 This represents premium paid to Euler Hermes Kreditversicherungs-AG (Hermes) for guarantee issued to a lender as a security against long term loan for construction of new cement manufacturing line.

42F C C L
Annual Report 2013
21.1
Balances with banks include Rs. 79.7 million (2012 : Rs. 70.5 million) in respect of security deposits received.
Deposits of Rs. 4 million (2012 : Rs. 4 million) with banks are under lien for letters of guarantee issued on behalf of the Company.
This includes Term Deposit Receipts (TDRs) amounting to Rs. 1,974 million (2012: Rs. 69 million) carrying interest @ 9.8% p.a. (2012: 11.5% p.a.).
2013 2012
21 CASH AND BANK BALANCES
Note Rupees'000
Rupees'000
Cash at banks
Deposit accounts
21.1 1,618,436
79,886
Current accounts
83,670
135,175
1,702,106
215,061
Cash in hand 65 10
1,702,171
215,071
2013
2012
22 TURNOVER - NET
Rupees'000 Rupees'000
Sales - Local
15,720,886 11,565,193
- Export
3,246,189 2,341,300
18,967,075 13,906,493
Less: Sales tax
2,192,785 1,595,345
Excise duty
797,765 780,759
Export development surcharge
8,625 7,339
2,999,175 2,383,443
15,967,900 11,523,050
Notes to the Financial Statements for the year ended 30 June 2013
20 DERIVATIVE FINANCIAL INSTRUMENT
During the year the Company has entered into cross currency swap agreements to hedge its foreign currency exposure on foreign currency floating rate borrowing under a finance facility agreement with the Standard Chartered Bank (Pakistan) Limited for one year. Under the swap agreement, the Company will receive applicable LIBOR and USD principal at the date of payment and pay applicable KIBOR-0.9% and the principal in Pak Rupees to hedging party. Fair value of derivative represents present value of future cash inflows/ outflows of cross currency swap.

43F C C L
Annual Report 2013
2013
2012
Note Rupees'000 Rupees'000
23 COST OF SALES
Raw materials consumed
711,425 577,400
Packing material consumed
838,149 664,647
Stores and spares consumed
42,437 39,157
Salaries, wages and benefits
715,956
423,841
(including retirement benefits of Rs. 44.4 million (2012 : Rs. 24.4 million)
Rent, rates and taxes
17,090 13,481
Insurance
87,407 70,605
Fuel consumed
4,230,292 3,831,144
Power consumed
2,506,812 1,690,002
Depreciation
11.1 1,261,532 1,057,463
Repairs and maintenance
373,115 185,602
Technical assistance
4,700 1,398
Vehicle running and maintenance expenses
25,996 20,302
Printing and stationery
1,663 1,998
Travelling and conveyance
15,779 12,414
Communication, establishment and other expenses
11,261 9,852
10,843,614 8,599,306
Add: Opening work-in-process
677,001 210,041
Work in process transferred after trial run of Line-II - 260,372
Less: Closing work-in-process
(638,144) (677,001)
Cost of goods manufactured
10,882,471 8,392,718
Add: Opening finished goods
146,138 80,289
Finished goods transferred after trial run of Line-II - 135,052
Less: Closing finished goods
(141,182) (146,138)
10,887,427 8,461,921
Less: Own consumption capitalized
- (7,321)
10,887,427 8,454,600
24 ADMINISTRATIVE EXPENSES
Salaries, wages and benefits
(including retirement benefits of Rs. 11.4 million (2012: Rs. 6.5 million)
159,336
91,196
Travelling and entertainment
4,089 1,251
Vehicle running and maintenance expenses
8,689 6,528
Insurance
725 730
Rent, rates and taxes
5,934 2,859
Repairs and maintenance
813 475
Printing and stationery
2,737 2,120
Communication, establishment and other expenses
8,477 6,608
Legal and professional charges
5,456 7,757
Depreciation
11.1 8,118 7,356
Donations
24.1 700 2,300
205,074 129,180
Notes to the Financial Statements for the year ended 30 June 2013
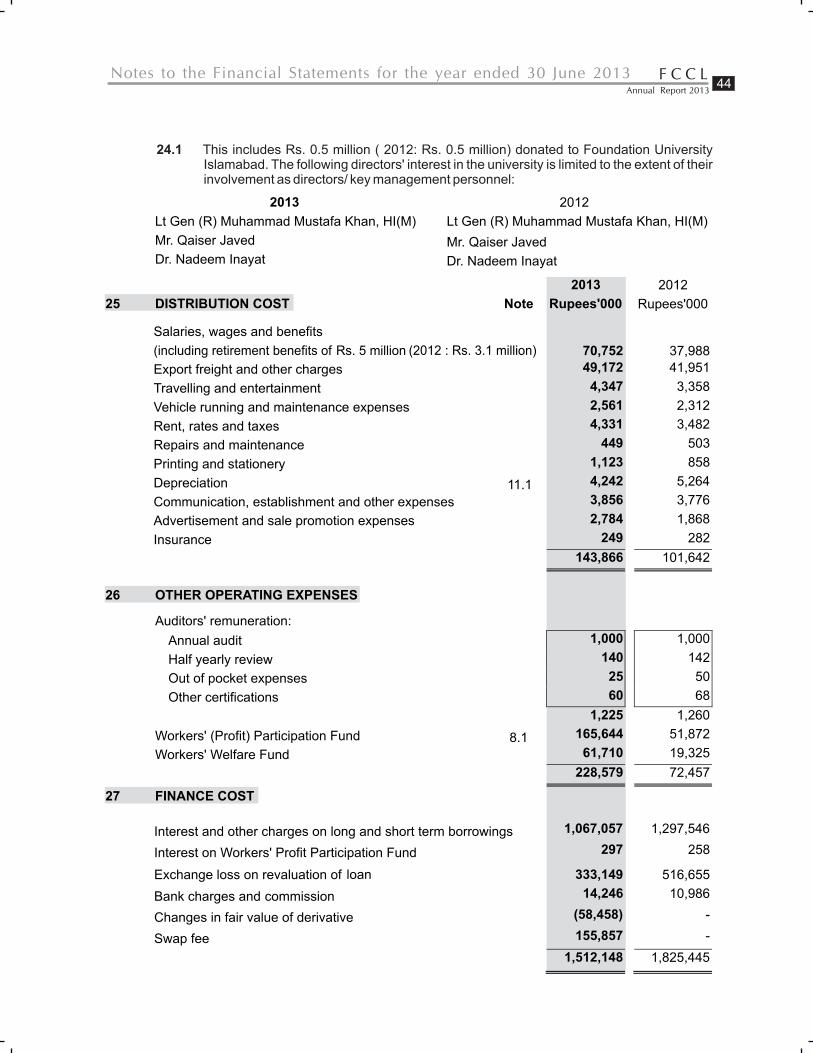
44F C C L
Annual Report 2013
2013
2012
Lt Gen (R) Muhammad Mustafa Khan, HI(M) Lt Gen (R) Muhammad Mustafa Khan, HI(M)
Mr. Qaiser Javed Mr. Qaiser Javed
Dr. Nadeem Inayat Dr. Nadeem Inayat
2013
2012
25 DISTRIBUTION COST
Note Rupees'000
Rupees'000
Salaries, wages and benefits
(including retirement benefits of Rs. 5 million 70,752 37,988
Export freight and other charges
49,172 41,951
Travelling and entertainment
4,347 3,358
Vehicle running and maintenance expenses
2,561 2,312
Rent, rates and taxes
4,331 3,482
Repairs and maintenance
449 503
Printing and stationery
1,123 858
Depreciation
11.1 4,242 5,264
Communication, establishment and other expenses
3,856 3,776
Advertisement and sale promotion expenses
2,784 1,868
Insurance
249 282
143,866 101,642
26 OTHER OPERATING EXPENSES
Auditors' remuneration:
Annual audit
1,000 1,000
Half yearly review
140 142
Out of pocket expenses
25 50
Other certifications
60 68
1,225 1,260
Workers' (Profit) Participation Fund
8.1 165,644 51,872
Workers' Welfare Fund
61,710 19,325
228,579 72,457
27 FINANCE COST
Interest and other charges on long and short term borrowings
1,067,057 1,297,546
Interest on Workers' Profit Participation Fund
297 258
Exchange loss on revaluation of loan
333,149 516,655
Bank charges and commission
14,246 10,986
Changes in fair value of derivative
(58,458) -
Swap fee
155,857 -
1,512,148 1,825,445
24.1 This includes Rs. 0.5 million ( 2012: Rs. 0.5 million) donated to Foundation University Islamabad. The following directors' interest in the university is limited to the extent of their involvement as directors/ key management personnel:
Notes to the Financial Statements for the year ended 30 June 2013
(2012 : Rs. 3.1 million)

45F C C L
Annual Report 2013
29.1 Assessments of the Company upto Assessment Year 2002-2003 were finalized by the taxation officer mainly by treating advances received from customers as deemed income and curtailing administrative expenses claimed by the Company. The appeals filed by the Company have been decided by the Appellate authorities for the most part in the Company's favour up to and including Assessment Years 2001-2002, however, appeal filed for Assessment Years 2001-2002 and 2002-2003 was decided against the Department and Company respectively, by the Commissioner (Appeals) and is now pending before the Appellate Tribunal.
For the Tax Year 2005, certain payments on account of transportation charges are disallowed by the Assistant Commissioner Inland Revenue by treating these payments as income. The Company filed appeal before Commissioner Inland Revenue (Appeal) and the Commissioner Inland Revenue (Appeal) upheld the order of the Assistant Commissioner Inland Revenue. The Company has now filed an appeal in the Appellate Tribunal.
28 OTHER INCOME
Income from financial assets
Profit on deposit accounts
65,821 9,265
Interest on long term advance
64 78
65,885 9,343
Income from assets other than financial assets
Gain on disposal of property, plant and equipment
870 7,523
Others
27,964 9,653
94,719 26,519
2013
2012
Rupees'000
Rupees'000
29 TAXATION
Current
For the year
96,027 119,737
Prior
412 (15,987)
96,439 103,750
Deferred
892,019 309,905
988,458 413,655
Accounting profit for the year
3,085,525
966,245
Applicable tax rate (%)
35%
35%
Income tax at applicable rate 1,079,934 338,186
Tax effect of export sales to local sales at prior years' estimate 37
(478,923)
Tax effect of change in proportion of export sales to local sales (104,889)
524,424
Net impact of effect of change in proportion
(104,852)
45,501
Minimum tax
63,652
119,737
Tax effect of income taxable under final tax regime
(32,376)
(72,199)
Prior year
412
(15,987)
Tax effect on permanent differences
(18,312)
(1,583)
413,655
988,458
Notes to the Financial Statements for the year ended 30 June 2013
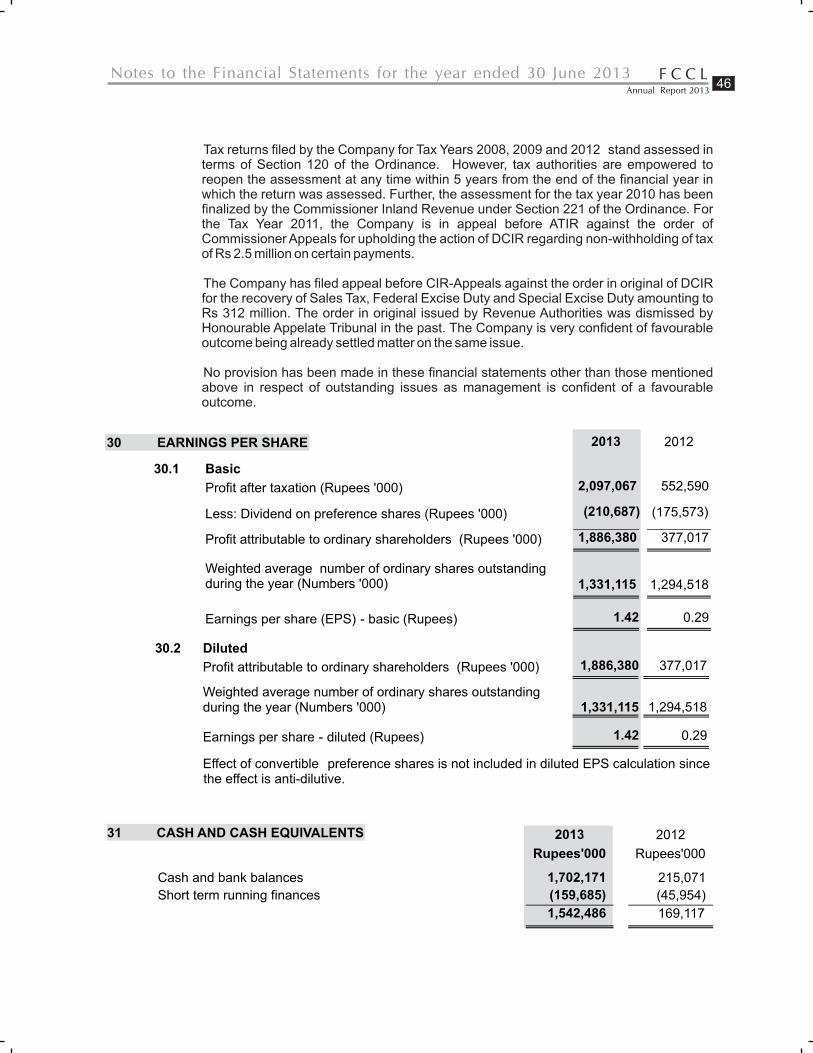
46F C C L
Annual Report 2013
Tax returns filed by the Company for Tax Years 2008, 2009 and 2012 stand assessed in terms of Section 120 of the Ordinance. However, tax authorities are empowered to reopen the assessment at any time within 5 years from the end of the financial year in which the return was assessed. Further, the assessment for the tax year 2010 has been finalized by the Commissioner Inland Revenue under Section 221 of the Ordinance. For the Tax Year 2011, the Company is in appeal before ATIR against the order of Commissioner Appeals for upholding the action of DCIR regarding non-withholding of tax of Rs 2.5 million on certain payments.
The Company has filed appeal before CIR-Appeals against the order in original of DCIR for the recovery of Sales Tax, Federal Excise Duty and Special Excise Duty amounting to Rs 312 million. The order in original issued by Revenue Authorities was dismissed by Honourable Appelate Tribunal in the past. The Company is very confident of favourable outcome being already settled matter on the same issue.
No provision has been made in these financial statements other than those mentioned above in respect of outstanding issues as management is confident of a favourable outcome.
30 EARNINGS PER SHARE
2013
2012
30.1 Basic
Profit after taxation (Rupees '000)
2,097,067 552,590
Less: Dividend on preference shares (Rupees '000) (210,687) (175,573)
Profit attributable to ordinary shareholders (Rupees '000)
1,886,380 377,017
Weighted average number of ordinary shares outstanding during the year (Numbers '000) 1,331,115 1,294,518
Earnings per share (EPS) - basic (Rupees)
1.42 0.29
30.2 Diluted
Profit attributable to ordinary shareholders (Rupees '000)
1,886,380 377,017
Weighted average number of ordinary shares outstanding during the year (Numbers '000) 1,331,115
1,294,518
Earnings per share - diluted (Rupees)
1.42 0.29
Effect of convertible preference shares is not included in diluted EPS calculation since the effect is anti-dilutive.
Notes to the Financial Statements for the year ended 30 June 2013
31 CASH AND CASH EQUIVALENTS
Cash and bank balances
Short term running finances
2013
2012
Rupees'000
Rupees'000
1,702,171 215,071
(159,685) (45,954)
1,542,486 169,117

47F C C L
Annual Report 2013
Notes to the Financial Statements for the year ended 30 June 2013
32 REMUNERATION OF MANAGING DIRECTOR, DIRECTORS AND EXECUTIVES
The aggregate amounts charged in the year for remuneration, including benefits and perquisites,
Managing Director Executives
2013 2012 2013
2012
Rupees'000 Rupees'000 Rupees'000 Rupees'000
Managerial remuneration
19,022 15,824 245,981
95,287
Provident fund
584 420 8,986
3,774
Compensated absences
977 496 5,929
4,709
Utilities and upkeep
964 616 17,458
3,774
21,547 17,356 278,354 107,544
No of persons
1 1 103
44
33 FINANCIAL INSTRUMENTS
The Company has exposures to the following risks from its use of financial instruments:
Credit riskLiquidity riskMarket risk
The Board of Directors has overall responsibility for the establishment and oversight of the Company's risk management framework. The Board is also responsible for developing and monitoring the Company's risk management policies.
The Company's risk management policies are established to identify and analyse the risks faced by the Company, to set appropriate risk limits and controls, and to monitor risks and adherence to limits. Risk management policies and systems are reviewed regularly to reflect changes in market conditions and the Company's activities. The Company, through its training and management standards and procedures, aims to develop a disciplined and constructive control environment in which all employees understand their roles and obligations.
The Audit Committee of the Company oversees how management monitors compliance with the Company's risk management policies and procedures, and reviews the adequacy of the risk management framework in relation to the risks faced by the Company. The Audit Committee is assisted in its oversight role by Internal Audit. Internal Audit undertakes both regular and adhoc reviews of risk management controls and procedures, the results of which are reported to the Audit Committee.
33.1 Credit risk
Credit risk is the risk of financial loss to the Company if a customer or counterparty to a financial instrument fails to meet its contractual obligations, and arises principally from trade debts, advances and deposits, interest accrued, other receivables, margin on letter of guarantee, derivative financial instrument and bank balances. The carrying amount of financial assets represents the maximum credit exposure. The maximum exposure to credit risk at the reporting date was:
were as follows:
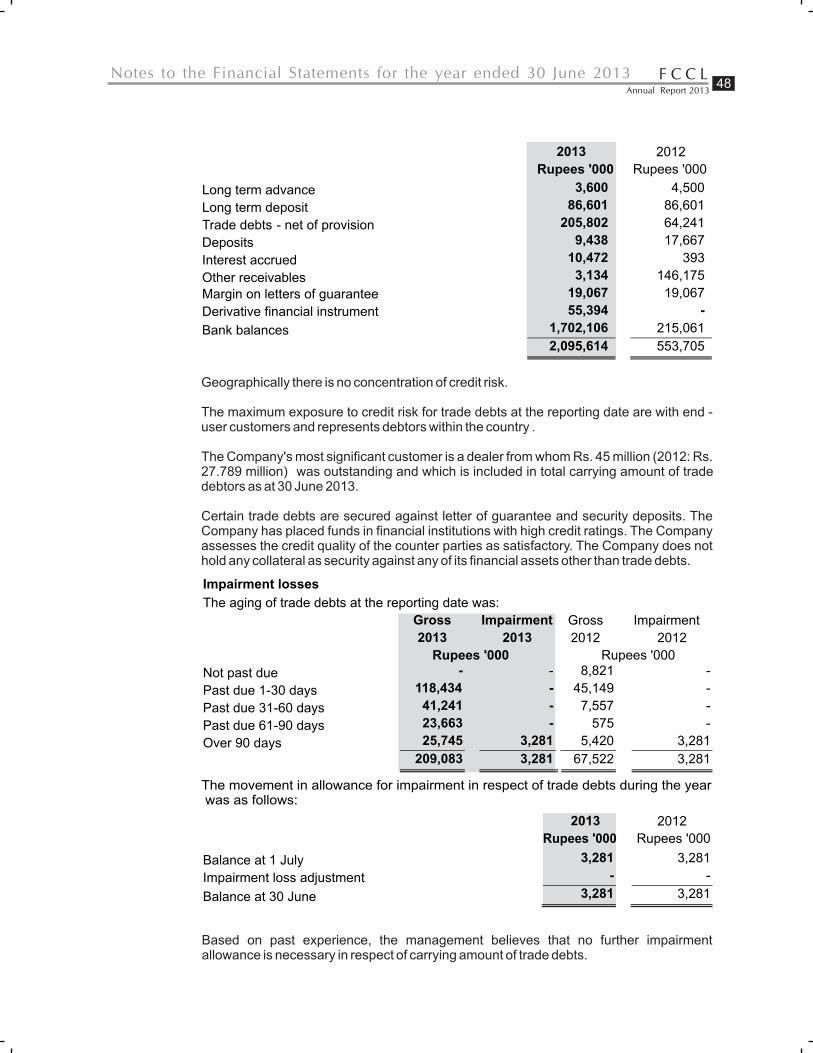
48F C C L
Annual Report 2013
Impairment losses The aging of trade debts at the reporting date was:
Gross
Impairment Gross
Impairment
2013
2013 2012
2012
Rupees '000 Rupees '000
Not past due
- - 8,821 -
Past due 1-30 days
118,434 - 45,149 -
Past due 31-60 days
41,241 - 7,557 -
Past due 61-90 days
23,663 - 575 -
Over 90 days
25,745 3,281 5,420 3,281
209,083 3,281 67,522 3,281
The movement in allowance for impairment in respect of trade debts during the year was as follows:
2013
2012
Rupees '000 Rupees '000
Balance at 1 July
3,281 3,281
Impairment loss adjustment
- -
Balance at 30 June
3,281 3,281
Based on past experience, the management believes that no further impairment allowance is necessary in respect of carrying amount of trade debts.
Notes to the Financial Statements for the year ended 30 June 2013
Geographically there is no concentration of credit risk.
The maximum exposure to credit risk for trade debts at the reporting date are with end - user customers and represents debtors within the country .
The Company's most significant customer is a dealer from whom Rs. 45 million (2012: Rs. 27.789 million) was outstanding and which is included in total carrying amount of trade debtors as at 30 June 2013.
Certain trade debts are secured against letter of guarantee and security deposits. The Company has placed funds in financial institutions with high credit ratings. The Company assesses the credit quality of the counter parties as satisfactory. The Company does not hold any collateral as security against any of its financial assets other than trade debts.
2013
2012
Rupees '000 Rupees '000
Long term advance
3,600 4,500
Long term deposit
86,601 86,601
Trade debts - net of provision
205,802 64,241
Deposits
9,438 17,667
Interest accrued
10,472 393
Other receivables
3,134 146,175
Margin on letters of guarantee
19,067 19,067
Derivative financial instrument
55,394 -
Bank balances
1,702,106 215,061
2,095,614 553,705

49F C C L
Annual Report 2013
It is not expected that the cash flows included in the maturity analysis could occur significantly earlier or at significantly different amounts.
33.2.1 The contractual cash flow relating to long and short term borrowings have been determined on the basis of expected mark up rates. The mark-up rates have been disclosed in note 6 and 10 to these financial statements.
33.3 Market risk
Market risk is the risk that the value of the financial instrument may fluctuate as a result of changes in market interest rates or the market price due to change in credit rating of the issuer or the instrument, change in market sentiments, speculative activities, supply and
Notes to the Financial Statements for the year ended 30 June 2013
The allowance account in respect of trade debts is used to record impairment losses unless the Company is satisfied that no recovery of the amount owing is possible; at that point the amount considered irrecoverable is written off against the financial asset directly.
33.2 Liquidity risk
Liquidity risk is the risk that the Company will not be able to meet its financial obligations as they fall due. The Company's approach to managing liquidity is to ensure, as far as possible, that it will always have sufficient liquidity to meet its liabilities when due, under both normal and stressed conditions, without incurring unacceptable losses or risking damage to the Company's reputation. The Company uses different methods which assists it in monitoring cash flow requirements and optimising its cash return on investments. Typically the Company ensures that it has sufficient cash on demand to meet expected operational expenses for a reasonable period, including the servicing of financial obligations; this excludes the potential impact of extreme circumstances that cannot reasonably be predicted, such as natural disasters. In addition the Company maintains lines of credit as mentioned in note 9 to the financial statements.
The following are the contractual maturities of financial liabilities, including expected interest payments and excluding the impact of netting agreements:
Carrying amount
Contractual cash flows
Six months or
less
Six to twelve months
One to two years
Two to five years
Five years
onwards
2013
Rupees '000
Rupees '000
Non Derivative Financial Liabilities
Long term loans and mark-up accrued
10,689,038 (11,911,351) (1,743,239) (1,503,848) (2,904,014) (5,420,982) (339,268)
Trade and other payables
992,139 (992,139) (992,139) - - - -
Short term borrowings and markup accrued
161,218 (162,734) (162,734) - - - -
11,842,395 (13,066,224) (2,898,112) (1,503,848) (2,904,014) (5,420,982) (339,268)
2012
Long term loans and mark-up accrued
12,866,504 (15,120,892) (1,845,202) (1,598,900) (3,072,256) (7,992,534) (612,000)
Trade and other payables
1,347,294 (1,347,294) (1,347,294) - - - -
Short term borrowings and markup accrued
1,023,734 (1,041,480) (1,041,480) - - - -
15,237,532 (17,509,666) (4,233,976) (1,598,900) (3,072,256) (7,992,534) (612,000)

50F C C L
Annual Report 2013
Sensitivity
An increase profit or loss by the amounts shown below.
of 3% in exchange rate at the reporting date would have decreased
2013 2012
Profit or loss Profit or loss
Gross exposure
Net of tax exposure
Gross exposure
Net of tax exposure
Rupees '000 Rupees '000
Long term loan 174,392 113,355 207,130 134,634
A 3% decrease in exchange rate would have had an equal but opposite effect to the amount shown above. The above mentioned risk is mitigated through derivative financial instrument.
33.3.2 Interest rate risk
The interest rate risk is the risk that the fair value or future cash flows of a financial instrument will fluctuate because of changes in market interest rates. Majority of interest rate exposure arises from short and long term borrowings from banks and deposits with banks. At the balance sheet date, the interest rate profile of the Company's interest bearing financial instruments is:
Carrying Amount 2013 2012
Rupees '000 Rupees '000
1,622,036 139,675 - 940,000
Fixed rate instruments Financial assets Financial liabilities
Variable rate instruments Financial liabilities 10,682,494 12,659,527
Notes to the Financial Statements for the year ended 30 June 2013
2013 2012
Rupees '000
US Dollar '000
Rupees '000
US Dollar '000
Long term loan 5,813,100 58,511 6,904,337 73,139
The following significant exchange rate applied during the year:
Average rates Balance sheet date rate
2013 2012 2013 2012
US Dollars 96.88 90.20 99.35 94.4
The Company is exposed to currency risk on long term loan which is denominated in currency other than the functional currency of the Company. The Company's exposure to foreign currency risk is as follows:
demand of securities and liquidity in the market. The Company is exposed to currency risk and interest rates only.
33.3.1 Currency risk
Exposure to Currency Risk

51F C C L
Annual Report 2013
Rupees '000
Variable rate instruments (32,147) 32,147 30 June 2012 (32,147) 32,147
33.4 Fair value of financial assets and liabilities
The fair values of financial assets and liabilities, together with the carrying amounts shown in the balance sheet, are as follows:
2013 2012
Note Carrying amount
Fair value Carrying amount
Fair value
Assets carried at amortized cost Rupees '000 Rupees '000
Long term advance
12 3,600 3,600 4,500 4,500
Long term deposit
13 86,601 86,601 86,601 86,601
Trade debts - net of provision
16 205,802 205,802 64,241 64,241
Deposits
18 9,438 9,438 17,667 17,667
Interest accrued
10,472 10,472 393 393
Other receivables
19 3,134 3,134 146,175 146,175
Margin on letters of guarantee 19
19,067 19,067 19,067 19,067
Cash and bank balances
21
1,702,171
1,702,171
215,071
215,071
2,040,285
2,040,285
553,715
553,715
Assets carried at fair value
Derivative financial instrument
55,394
55,394
-
-
Notes to the Financial Statements for the year ended 30 June 2013
Fair value sensitivity analysis for variable rate instruments
The Company does not hold any financial asset or liability at fair value through profit and loss.
Cash flow sensitivity analysis for variable rate instruments
A change of 100 basis points in interest rates at the reporting date would have increased (decreased) profit or loss by the amounts shown below. This analysis assumes that all other variables, in particular foreign currency rates, remain constant. The analysis is performed on the same basis for 2012.
Profit or loss 100 basis
points increase
100 basis points
decrease
Rupees '000
Cash flow sensitivity (net) Variable rate instruments (25,974) 25,974 30 June 2013 (25,974) 25,974
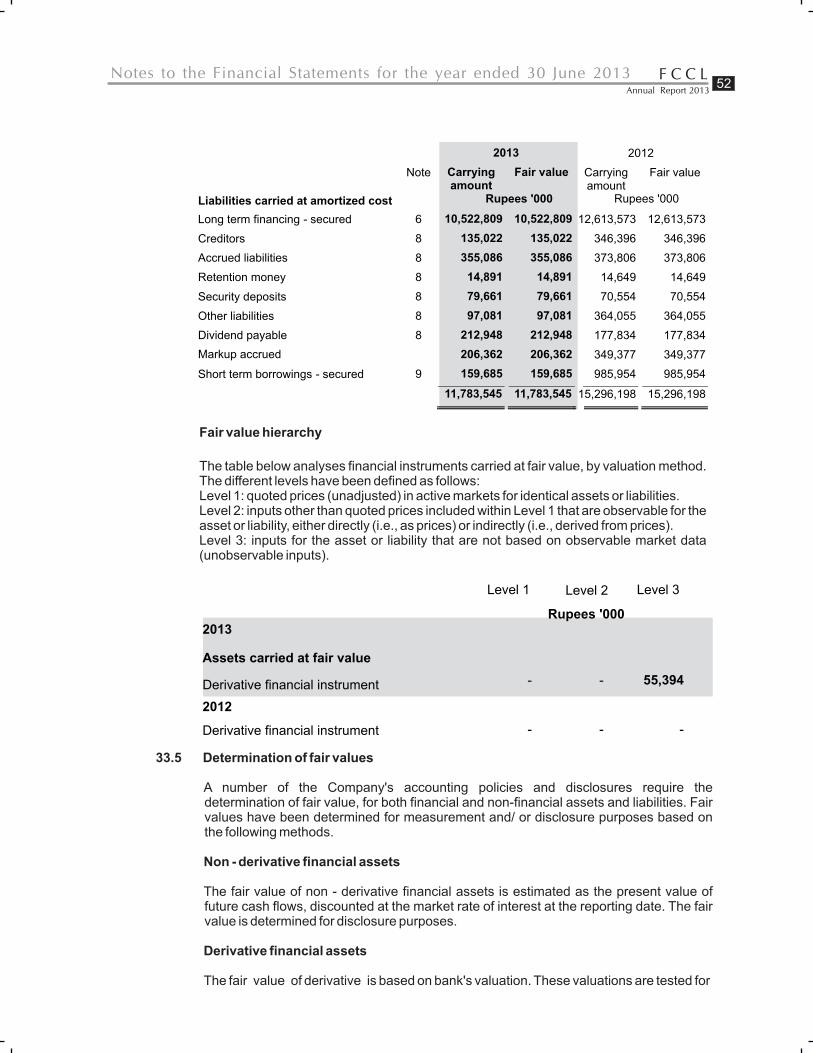
52F C C L
Annual Report 2013
Level 1 Level 2 Level 3
Rupees '000
2013
Assets carried at fair value
Derivative financial instrument
Derivative financial instrument
- - 55,394
2012
- - -
33.5 Determination of fair values
A number of the Company's accounting policies and disclosures require the determination of fair value, for both financial and non-financial assets and liabilities. Fair values have been determined for measurement and/ or disclosure purposes based on the following methods.
Non - derivative financial assets
The fair value of non - derivative financial assets is estimated as the present value of future cash flows, discounted at the market rate of interest at the reporting date. The fair value is determined for disclosure purposes.
Derivative financial assets
The fair value of derivative is based on bank's valuation. These valuations are tested for
Notes to the Financial Statements for the year ended 30 June 2013
2013 2012
Note Carrying amount
Fair value Carrying amount
Fair value
Rupees '000 Rupees '000 Liabilities carried at amortized cost
Long term financing - secured
6
10,522,809
10,522,809
12,613,573
12,613,573
Creditors
8
135,022
135,022
346,396
346,396
Accrued liabilities
8
355,086
355,086
373,806
373,806
Retention money
8
14,891
14,891
14,649
14,649
Security deposits
8
79,661
79,661
70,554
70,554
Other liabilities
8
97,081
97,081
364,055
364,055
Dividend payable
8
212,948
212,948
177,834
177,834 Markup accrued
206,362
206,362
349,377
349,377
Short term borrowings - secured
9
159,685
159,685
985,954
985,954
11,783,545
11,783,545
15,296,198
15,296,198
Fair value hierarchy
The table below analyses financial instruments carried at fair value, by valuation method. The different levels have been defined as follows:Level 1: quoted prices (unadjusted) in active markets for identical assets or liabilities.Level 2: inputs other than quoted prices included within Level 1 that are observable for the asset or liability, either directly (i.e., as prices) or indirectly (i.e., derived from prices).Level 3: inputs for the asset or liability that are not based on observable market data (unobservable inputs).

53F C C L
Annual Report 2013
2013 2012 Rupees'000 Rupees'000 Transactions with associated undertakings/companies
due to common
directorship - Sale of cement 15,321 622 - Payment for use of medical facilities 98 36 - Payment on account of clearance of shipments 214 14,515 - Preference dividend paid 175,572 66,885 - Payment of rent and utilities 5,934 4,397 - Amount payable-unsecured - 300,000 - Repayment of amount payable 300,000 -
Employees Funds - Payments made into the fund 26,667 17,875 Others
- Remuneration to key management personnel
(including retirement benefits) 42,344 28,343
35 PLANT CAPACITY AND ACTUAL PRODUCTION 2013 2012
Metric Tons Metric Tons Current installed capacity 3,433,500 2,926,980
Actual production 2,497,529 2,010,006
Difference is due to supply demand situation of the market.
Notes to the Financial Statements for the year ended 30 June 2013
reasonableness by discounting estimated future cash flows based on the terms and maturity of each contract. Interest rates used to discount estimated future cash flows are based on the respective currency's yield curve.
Non - derivative financial liabilities
Fair value, which is determined for disclosure purposes, is calculated based on the present value of future principal and interest cash flows, discounted at the market rate of interest at the reporting date.
33.6 Capital management
The Board's policy is to maintain a strong capital base so as to maintain investor, creditor and market confidence and to sustain future development of the business. The Board of Directors monitors the return on capital, which the Company defines as net profit after taxation divided by total shareholders' equity and monitors that the Company has appropriate mix of capital and debt. The Board of Directors also monitors the level of dividend to ordinary shareholders. There were no changes to the Company's approach to capital management during the year and the Company is not subject to externally imposed capital requirements except for the maintenance of debt to equity ratios under the financing agreements.
34 RELATED PARTY TRANSACTIONS
Fauji Foundation holds 37.18 % ordinary shares and 100% preference shares of the Company at the year-end. Therefore all subsidiaries and associated undertakings of Fauji Foundation are related parties of the Company. Other related parties comprise of directors, key management personnel, entities over which the directors are able to exercise influence and employees' funds. Transactions with related parties are as follows:

54F C C L
Annual Report 2013
37 GENERAL
37.1 Facilities of letters of guarantee and letters of credit
Facilities of letters of guarantee and letters of credit amounting to Rs. 315 million and Rs. 3,500 million (2012: Rs. 347 million and Rs. 1,650 million) respectively are available to the Company. Letters of guarantees are secured by way of hypothecation charge on present and future assets of the Company (excluding land and building) and lien on bank deposits/ margin.
37.2 Number of persons employed
2013
2012
Employees on year end (Number)
1,061 1,093
Average employees during the year (Number)
1,077 1,178
37.3 Comparative figures have been reinstated where necessary
37.4 Figures have been rounded off to the nearest thousand of Rupee unless otherwise stated.
DirectorChief Executive
Notes to the Financial Statements for the year ended 30 June 2013
36 EMPLOYEES PROVIDENT FUND TRUST
2013 2012
Size of the Fund (Rupees'000) 254,894 193,896
Cost of investments made (Rupees'000) 218,698 171,726
Percentage of investments made (%) 85.80 88.57
Fair value of investments (Rupees'000) 231,096 181,777
2013 2012
Rupees'000
% of full Rupees'000
% of full
Defense Saving Certificates
17,893 8 17,893 10
Term deposits in different banks
149,563 68 105,805 62
Term finance certificates
49,425 23 46,211 27
Listed securities
1,817 1 1,817 1
218,698 100 171,726 100
All the investments out of provident fund trust have been made in accordance with the provisions of Section 227 of the Companies Ordinance, 1984 and the rules formulated for this purpose.

55F C C L
Annual Report 2013
Pattern of Share-holding
Annex-A
No. of Shareholders From To Total Shares
Held
240
1
100
6,930
1195
101
500
563,435
1769
501
1,000
1,746,691
3481
1,001
5,000
10,922,070
1445
5,001
10,000
12,384,417
495
10,001
15,000
6,530,689
386
15,001
20,000
7,333,752
288
20,001
25,000
6,976,326
177
25,001
30,000
5,099,522
92
30,001
35,000
3,082,846
108
35,001
40,000
4,222,661
52
40,001
45,000
2,254,690
210
45,001
50,000
10,420,720
44
50,001
55,000
2,344,311
48
55,001
60,000
2,830,671
29
60,001
65,000
1,836,705
34
65,001
70,000
2,344,908
34
70,001
75,000
2,516,408
20
75,001
80,000
1,581,002
15
80,001
85,000
1,265,500
14
85,001
90,000
1,247,000
12
90,001
95,000
1,130,000
142
95,001
100,000
14,183,500
17
100,001
105,000
1,753,999
15
105,001
110,000
1,639,000
7
110,001
115,000
783,225
12
115,001
120,000
1,421,500
21
120,001
125,000
2,613,059
13
125,001
130,000
1,669,649
11
130,001
135,000
1,463,758
11
135,001
140,000
1,534,000
10
140,001
145,000
1,427,850
39
145,001
150,000
5,840,742
6
150,001
155,000
927,000
6
155,001
160,000
958,500
2
160,001
165,000
321,990
5
165,001
170,000
840,000
12
170,001
175,000
2,085,209
10
175,001
180,000
1,788,500
3
180,001
185,000
547,500
6
185,001
190,000
1,125,000
3
190,001
195,000
581,311
48
195,001
200,000
9,599,242
6
200,001
205,000
1,218,723
6
205,001
210,000
1,255,250
5
210,001
215,000
1,064,745

56F C C L
Annual Report 2013
Pattern of Share-holding
8
215,001
220,000
1,750,850
4
220,001
225,000
899,300
2
225,001
230,000
456,500
2
230,001
235,000
470,000
4
235,001
240,000
954,000
2
240,001
245,000
490,000
20
245,001
250,000
4,992,000
1
250,001
255,000
251,620
2
260,001
265,000
530,000
1
265,001
270,000
269,500
1
275,001
280,000
278,683
1
285,001
290,000
290,000
1
290,001
295,000
293,000
26
295,001
300,000
7,796,500
3
300,001
305,000
908,353
4
305,001
310,000
1,235,341
1
315,001
320,000
320,000
5
320,001
325,000
1,625,000
1
325,001
330,000
330,000
1
330,001
335,000
332,000
2
335,001
340,000
673,500
2
340,001
345,000
685,500
9
345,001
350,000
3,145,531
1
350,001
355,000
351,500
1
365,001
370,000
369,000
1
375,001
380,000
380,000
3
385,001
390,000
1,166,000
19
395,001
400,000
7,600,000
1
405,001
410,000
407,000
1
415,001
420,000
415,440
1
425,001
430,000
430,000
1
430,001
435,000
435,000
2
435,001
440,000
880,000
3
440,001
445,000
1,329,000
8
445,001
450,000
3,596,350
1
455,001
460,000
460,000
1
470,001
475,000
475,000
1
475,001
480,000
480,000
1
490,001
495,000
494,000
20
495,001
500,000
9,998,000
1
520,001
525,000
525,000
1
525,001
530,000
529,500
1
535,001
540,000
540,000
4
545,001
550,000
2,200,000
1
550,001
555,000
552,000
1
580,001
585,000
582,000
7
595,001
600,000
4,200,000
1
600,001
605,000
600,100
1
620,001
625,000
622,500

57F C C L
Annual Report 2013
Pattern of Share-holding
1
645,001
650,000
650,000
2
655,001
660,000
1,318,398
8
695,001
700,000
5,600,000
3
745,001
750,000
2,250,000
1
750,001
755,000
755,000
1
760,001
765,000
761,300
2
770,001
775,000
1,546,964
1
775,001
780,000
780,000
1
780,001
785,000
785,000
1
785,001
790,000
790,000
1
790,001
795,000
795,000
4
795,001
800,000
3,200,000
1
805,001
810,000
810,000
1
825,001
830,000
829,300
1
855,001
860,000
858,000
1
865,001
870,000
866,000
1
875,001
880,000
878,500
2
960,001
965,000
1,924,000
1
965,001
970,000
969,500
5
995,001
1,000,000
5,000,000
1
1,035,001
1,040,000
1,039,000
1
1,045,001
1,050,000
1,050,000
1
1,070,001
1,075,000
1,075,000
1
1,090,001
1,095,000
1,094,000
4
1,095,001
1,100,000
4,396,975
1
1,120,001
1,125,000
1,125,000
1
1,145,001
1,150,000
1,150,000
1
1,170,001
1,175,000
1,173,000
2
1,195,001
1,200,000
2,400,000
1
1,210,001
1,215,000
1,215,000
1
1,245,001
1,250,000
1,249,000
1
1,295,001
1,300,000
1,300,000
1
1,315,001
1,320,000
1,318,900
1
1,395,001
1,400,000
1,400,000
1
1,475,001
1,480,000
1,479,580
3
1,495,001
1,500,000
4,500,000
1
1,540,001
1,545,000
1,542,367
1
1,560,001
1,565,000
1,564,000
1
1,565,001
1,570,000
1,566,500
1
1,570,001
1,575,000
1,574,661
1
1,595,001
1,600,000
1,595,500
1
1,615,001
1,620,000
1,617,502
1
1,645,001
1,650,000
1,650,000
1
1,660,001
1,665,000
1,664,000
1
1,675,001
1,680,000
1,675,500
1
1,695,001
1,700,000
1,700,000
1
1,715,001
1,720,000
1,717,500
1
1,735,001
1,740,000
1,739,100
1
1,760,001
1,765,000
1,760,562

58F C C L
Annual Report 2013
Pattern of Share-holding
1
1,785,001
1,790,000
1,790,000
1
1,795,001
1,800,000
1,800,000
1
1,895,001
1,900,000
1,900,000
6
1,995,001
2,000,000
12,000,000
1
2,165,001
2,170,000
2,167,000
1
2,235,001
2,240,000
2,239,500
1
2,295,001
2,300,000
2,300,000
1
2,300,001
2,305,000
2,301,000
1
2,395,001
2,400,000
2,400,000
2
2,495,001
2,500,000
5,000,000
1
2,575,001
2,580,000
2,576,500
1
2,645,001
2,650,000
2,650,000
1
2,660,001
2,665,000
2,662,000
1
2,795,001
2,800,000
2,800,000
1
2,845,001
2,850,000
2,847,935
1
2,895,001
2,900,000
2,900,000
1
3,130,001
3,135,000
3,130,365
1
3,440,001
3,445,000
3,444,500
1
3,545,001
3,550,000
3,550,000
1
3,705,001
3,710,000
3,708,500
1
3,795,001
3,800,000
3,800,000
1
3,815,001
3,820,000
3,817,750
1
4,315,001
4,320,000
4,317,500
1
4,395,001
4,400,000
4,400,000
1
4,995,001
5,000,000
5,000,000
1
5,220,001
5,225,000
5,225,000
1
5,285,001
5,290,000
5,289,700
1
5,295,001
5,300,000
5,300,000
1
5,345,001
5,350,000
5,347,500
1
5,430,001
5,435,000
5,432,750
1
5,790,001
5,795,000
5,793,600
1
6,395,001
6,400,000
6,400,000
1
6,675,001
6,680,000
6,677,000
1
6,740,001
6,745,000
6,743,500
1
6,915,001
6,920,000
6,916,500
1
7,575,001
7,580,000
7,575,500
1
7,995,001
8,000,000
8,000,000
1
8,495,001
8,500,000
8,500,000
1
9,615,001
9,620,000
9,619,500
1
9,785,001
9,790,000
9,790,000
1
9,790,001
9,795,000
9,795,000
1
11,995,001
12,000,000
12,000,000
1
12,670,001
12,675,000
12,675,000
1
15,095,001
15,100,000
15,100,000
1
16,240,001
16,245,000
16,241,000
1
17,765,001
17,770,000
17,766,000
2
18,745,001
18,750,000
37,500,000
1
21,015,001
21,020,000
21,016,000
1
25,980,001
25,985,000
25,981,000

59F C C L
Annual Report 2013
Pattern of Share-holding
1
36,335,001
36,340,000
36,340,000
1
48,695,001
48,700,000
48,699,187
1
56,305,001
56,310,000
56,309,000
1
93,745,001
93,750,000
93,750,000
1
494,950,001
494,955,000
494,951,055
10,926 1,379,815,025
5. Categories of shareholders
Share held
Percentage
5.1 Directors, Chief Executive Officers,
7
0.0000%
and their spouse and minor childern
5.2 Associated Companies,
674,900,242
48.9124%
undertakings and related
parties. (Parent Company)
5.3 NIT and ICP
1,542,367
0.1118%
5.4 Banks Development
76,224,110
5.5242%
Financial Institutions, Non
Banking Financial Institutions.
5.5 Insurance Companies
17,308,673
1.2544%
5.6 Modarabas and Mutual
Funds
23,168,000
1.6791%
5.7 Share holders holding 10%
543,650,242
39.4002%
5.8 General Public
a. Local
428,118,813
31.0273%
b. Foreign
0
0.0000%
5.9 Others (to be specified)
a-
InvestmentCompanies
1,257,000
0.0911%
b-
Joint Stock Companies
75,871,739
5.4987%
c-
Pension Funds
386,000
d-
Others
60,828,874
4.4085%
e-
Foreign Companies
20,209,200
1.4646%

60F C C L
Annual Report 2013
Pattern of Share-holding
Catagories of Shareholding required under Code of Coprorate Governance (CCG)
As on June 30, 2013
Sr. No. Name No. of Shares Held
Percentage
Associated Companies, Undertakings and Related Parties
1 COMMITTEE OF ADMIN. FAUJI FOUNDATION (CDC) 494,951,055 35.8708
2 FAUJI FOUNDATION (Preference Shares) 48,699,187 3.5294
3 FAUJI FERTILIZER BIN QASIM LIMITED
18,750,000 1.3589
4 FAUJI OIL TERMINAL & DISTRIBUTION
18,750,000
1.3589
5 FAUJI FERTILIZER COMPANY LTD (CDC)
93,750,000
6.7944
Mutual Funds
1 CDC -
TRUSTEE ABL STOCK FUND (CDC)
2,301,000
0.1668
2 CDC -
TRUSTEE AKD AGGRESSIVE INCOME FUND (CDC)
498,000
0.0361
3 CDC -
TRUSTEE AKD INDEX TRAKER FUND (CDC)
175,000
0.0127
4 CDC -
TRUSTEE ASKARI ASSET ALLOCATION DUND (CDC)
795,000
0.0576
5 CDC -
TRUSTEE ASKARI EQUITY FUND (CDC)
300,000
0.0217
6 CDC -
TRUSTEE CROSBY DRAGON FUND (CDC)
440,000
0.0319
7 CDC -
TRUSTEE HBL -
STOCK FUND (CDC)
6,677,000
0.4839
8
CDC -
TRUSTEE KASB ASSET ALLOCATION FUND (CDC)
2,000
0.0001
9
CDC -
TRUSTEE KASB IMCOME OPPETUNITY FUND (CDC)
961,500
0.0697
10
CDC -
TRUSTEE MCBDYNAMIC ALLOCATION FUND (CDC)
351,500
0.0255
11
CDC -
TRUSTEE NIT-EQUITY MARKET OPPORTUNITY FUND (CDC)
1,094,000
0.0793
12
CDC -
TRUSTEE PICIC INCOME FUND -
MT (CDC)
2,662,000
0.1929
13
CDC -
TRUSTEE UBL STOCK ADVANTAGE FUND (CDC)
2,900,000
0.2102
14
FIRST CAPITAL MUTUAL FUND (CDC)
200,000
0.0145
15
MCBFSL -
TRUSTEE ABL AMC CAPITAL PROTECTED FUND (CDC)
25,000
0.0018
16
MCBFSL -
TRUSTEE NAMCO BALANCED FUND -
MT (CDC)
1,039,000
0.0753
17
MCBFSL -
TRUSTEE PAK OMAN ADVANTAGE ASSET (CDC)
100,000
0.0072
18
POLININ FUNDS [1500-0] (CDC)
2,400,000
0.1739
19
TRUSTEE -
PALISTAN PESION FUND -
EQUITY SUB FUND (CDC)
167,000
0.0121
20
PRUDENTIAL STOCKS FUND LTD. (CDC)
500
0.0000
21
PRUDENTIAL STOCKS FUND LTD. (03360) (CDC)
15,000
0.0011
Directors and their Spouse and Minor Children
1
LT GEN MUHAMMAD MUSTAFA KHAN, HI(M) (RETD)
1
0.0000
2
LT GEN MUHAMMAD SABIR, HI(M) (RETD)
1
0.0000
3
MR. QAISER JAVED
1
0.0000
4
DR. NADEEM INAYAT
1
0.0000
5
BRIG PAREZ SARWAR KHAN (RETD)
1
0.0000
6
BRIG DR. GULFAM ALAM (RETD)
1
0.0000
7
BRIG MUHAMMAD SAEED KHAN (RETD)
1
0.0000

61F C C L
Annual Report 2013
Pattern of Share-holding
Executives - -
Shareholders holding five percent or more voting interest in the Company
1
FAUJI FOUNDATION (ORDINARY + PREFERENCE SHARES)
543,650,242
39.4002
2
FAUJI FERTILIZER COMPANY LTD (CDC)
93,750,000
6.7944
No trade has been carried out in the shares of the Company by its Directors, Executives and theirSpouses and their Minor children.
Public Sector Companies & Corporations - -
Banks, Development Finance Institutions, Non Banking Finance
93,983,283 6.8113% Companies, Insurance Companies, Takaful, Modarabas and Pension Funds
Name No. of Shares Held
Percentage

62F C C L
Annual Report 2013
Notice of 21st Annual General Meeting
stNotice is hereby given that the 21 Annual General Meeting of the Company will be held
that 1000 hours 24 September 2013 (Tuesday) at Hotel Pearl Continental The Mall, Rawalpindi, to transact the following business:-
th1. To confirm the Minutes of 8th Extra-Ordinary General Meeting held on 5 December 2012.
2. To receive, consider and adopt the Audited Accounts of the Company together with the Directors' and the Auditors' Reports for the Year ended
th30 June 2013.
3. To appoint Statutory Auditors of the Company and fix their remuneration.
4. To approve payment of Final Dividend of Rs. 1.25 per share for the year th
ended 30 June 2013 as recommended by the Board of Directors to th
those who are share holders as at close of business on 17 September 2013.
5. Any other business with the permission by the Chairman.
By order of the Board
Place: Rawalpindi Brig (R) Sajjad Azam Khan thDate: 26 August 2013 Company Secretary
NOTES
1. The Share Transfer Books of the Company will remain closed from th th
18 September 2013 to 24 September 2013 (both days inclusive). Transfers received in order at the Share Registrar office M/s Corplink (Pvt) Ltd, Wings Arcade, 1 K Commercial, Model Town
thLahore, at close of business on 17 September 2013 will be treated in time for the entitlement of cash dividend and to attend the Annual General Meeting.
2. A member entitled to attend and vote at the Annual General Meeting may appoint a proxy to attend and vote in place of the member. Proxies, in order to be effective, must be received at the Registered Office located at Fauji Towers, Block III, 68 Tipu Road, Chaklala, Rawalpindi, Pakistan duly stamped and signed, not less than 48 hours before the Meeting. A member may not appoint more than one proxy. A copy of shareholder's attested CNIC must be attached with the proxy form.

63F C C L
Annual Report 2013
Notice of 21st Annual General Meeting
3. CDC Account Holders are required to follow the under mentioned guidelines as laid down by the Securities & Exchange Commission of Pakistan:-
(a) For Attending the Meeting
i. In case of individuals, the account holder or sub-account holder shall authenticate his/her identity by showing his/her original computerized national identity card or original passport at the time of attending the Meeting.
ii. In case of corporate entity, the Board of Directors' resolution/ power of attorney with specimen signatures of the nominee shall be produced at the Meeting.
(b) For Appointing Proxies
i. In case of individuals, the account holder or sub-account holder shall submit the proxy form as per the above requirement.
ii. The proxy form shall be witnessed by two persons whose names, addresses and CNIC numbers shall be mentioned on the form.
iii. Attested copies of CNIC or the passport of the beneficial owners and the proxy shall be furnished with the Proxy Form.
iv. The Proxy shall produce his/her original CNIC or original passport at the time of Meeting.
v. In case of corporate entity, the Board of Directors' resolution /
power of attorney with specimen signatures shall be submitted along with proxy form to the Company.
4. Members are requested to promptly notify any change in their address.
5. As per SECP directives, the future dividend warrants of the share holders whose CNICs are not available with the Share Registrar could be withheld. All share holders having physical share holding are advised to submit copies of their valid Computerised National Identity Cards (CNIC) to the Share Registrar at the above address.
6. Under the law, Share holders are entitled to receive their cash dividends directly in their bank accounts instead of receiving the same physically. Share holders having physical holding and desiring to use the option may submit their request to the Company's Share Registrar. The share holders having CDC account may approach CDC for the same.
7. For any other information, please contact Ph: 051-9280075, Fax No: 051 – 9280416.
E-mail: [email protected] Web Site: www.fccl.com.pk

I/We ____________________________________________________________________
of_______________________________________________________________________
being Member (s) of Fauji Cement Company Limited hold ___________________________
Ordinary Shares hereby appoint Mr./Mrs./Miss of ___________________________________
_________________________ or failing him/her __________________________________
of ____________________ as my / our proxy in my / our absence to attend and vote for me/us
and on my/our behalf at the 21st Annual General Meeting of the Company to be held on
Tuesday, 24th September 2013 and at any adjournment thereof.
As witness my/our hand/seal this ___________________________ day ____________2013.
Signed by________________________________________________________________
said in the presence of :-
(1) Name _____________________Address:_______________________________
______________________________ N.I.C No:___________________________________
(2) Name _______________________Address:_____________________________
_______________________________N.I.C. No: __________________________________
Folio No CDC Account #
Participant I.D. Account # Signature on
Five Rupees
Revenue Stamp
The signature should agree with
the specimen registered with
the Company IMPORTANT:1. This Form of proxy, duly completed and signed, must be received at the registered office of the Company, at Fauji Tower, Block III, Tipu Road, Rawalpindi Pakistan, not less then 48hours before the time of holding the meeting.
2. If a member appoints more than one proxy and more than one instruments of proxy are deposited by a member with the Company, all such instruments of proxy shall be rendered invalid.
Form of Proxy - 21st Annual General Meeting64
F C C LAnnual Report 2013

65F C C L
Annual Report 2013
AFFIXCORRECTPOSTAGE
The Company Secretary
Fauji Cement Company LimitedFauji Towers Block III 68 Tipu Road ChaklalaRawalpindi - Pakistan


