
BMS 524: Lecture 3Purdue University Cytometry Laboratories
Lecture 4
The Principles of Confocal Microscopy: Components of the microscope.
BMS 524 - “Introduction to Confocal Microscopy and Image Analysis”
1 Credit course offered by Purdue University Department of Basic Medical Sciences, School of Veterinary Medicine
UPDATED October 27, 1998
J.Paul Robinson, Ph.D. Professor of Immunopharmacology
Director, Purdue University Cytometry Laboratories
These slides are intended for use in a lecture series. Copies of the graphics are distributed and students encouraged to take their notes on these graphics. The intent is to have the student NOT try to reproduce the
figures, but to LISTEN and UNDERSTAND the material. All material copyright J.Paul Robinson unless otherwise stated, however, the material may be freely used for lectures, tutorials and workshops. It may not
be used for any commercial purpose.
The text for this course is Pawley “Introduction to Confocal Microscopy”, Plenum Press, 2nd Ed. A number of the ideas and figures in these lecture notes are taken from this text.

BMS 524: Lecture 3Purdue University Cytometry Laboratories
Overview
• Components of a confocal microscope system
• Optical pathways
• Optical filters
• Resolution
• 3D basics
• Other components

BMS 524: Lecture 3Purdue University Cytometry Laboratories
Benefits of Confocal Microscopy
• Reduced blurring of the image from light scattering• Increased effective resolution• Improved signal to noise ratio• Clear examination of thick specimens• Z-axis scanning• Depth perception in Z-sectioned images• Magnification can be adjusted electronically
BMS 524: Lecture 3Purdue University Cytometry Laboratories
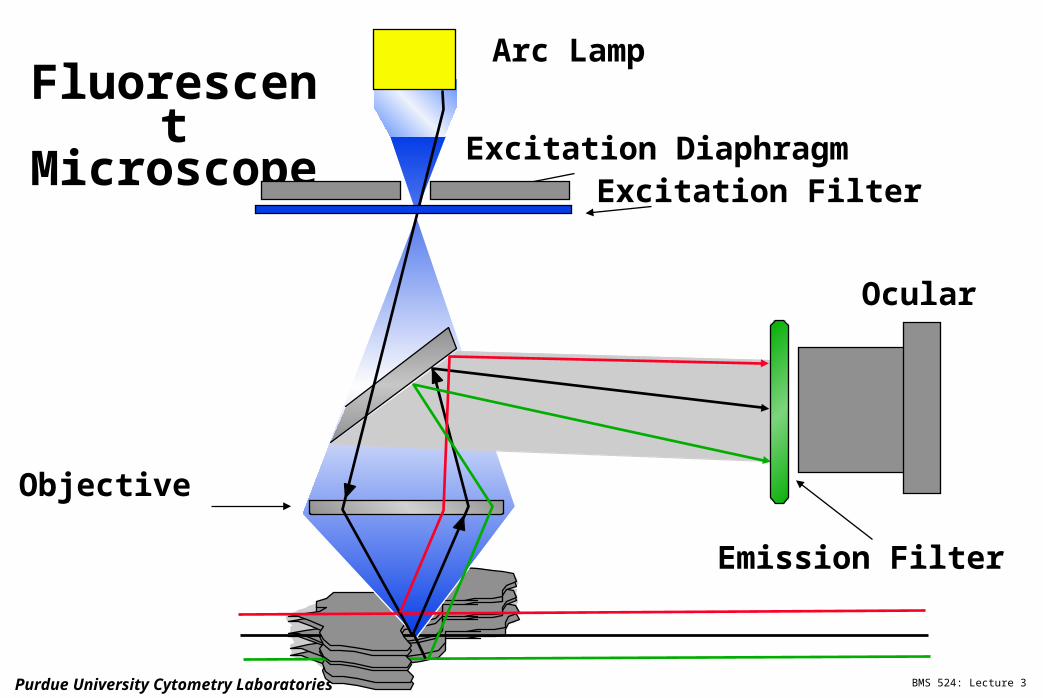
Fluorescent Microscope
Objective
Arc Lamp
Emission Filter
Excitation Diaphragm
Ocular
Excitation Filter

BMS 524: Lecture 3Purdue University Cytometry Laboratories
Confocal Principle
Objective
Laser
Emission Pinhole
Excitation Pinhole
PMT
EmissionFilter
Excitation Filter

BMS 524: Lecture 3Purdue University Cytometry Laboratories
Fluorescent Microscope
Objective
Arc Lamp
Emission Filter
Excitation Diaphragm
Ocular
Excitation Filter
Objective
Laser
Emission Pinhole
Excitation Pinhole
PMT
EmissionFilter
Excitation Filter
Confocal Microscope

BMS 524: Lecture 3Purdue University Cytometry Laboratories
MRC 1024 System
UV Laser
Kr-Ar Laser
Optical Mixer
ScanheadMicroscope

BMS 524: Lecture 3Purdue University Cytometry Laboratories
MRC 1024 SystemLight Path
PMT

BMS 524: Lecture 3Purdue University Cytometry Laboratories
Optical Mixer - MRC 1024 UV
Argon Laser
Argon-KryptonLaser
Fast Shutter
UV CorrectionOptics
FilterWheels
To Scanhead
UV Visible
Beam Expander
BMS 524: Lecture 3Purdue University Cytometry Laboratories
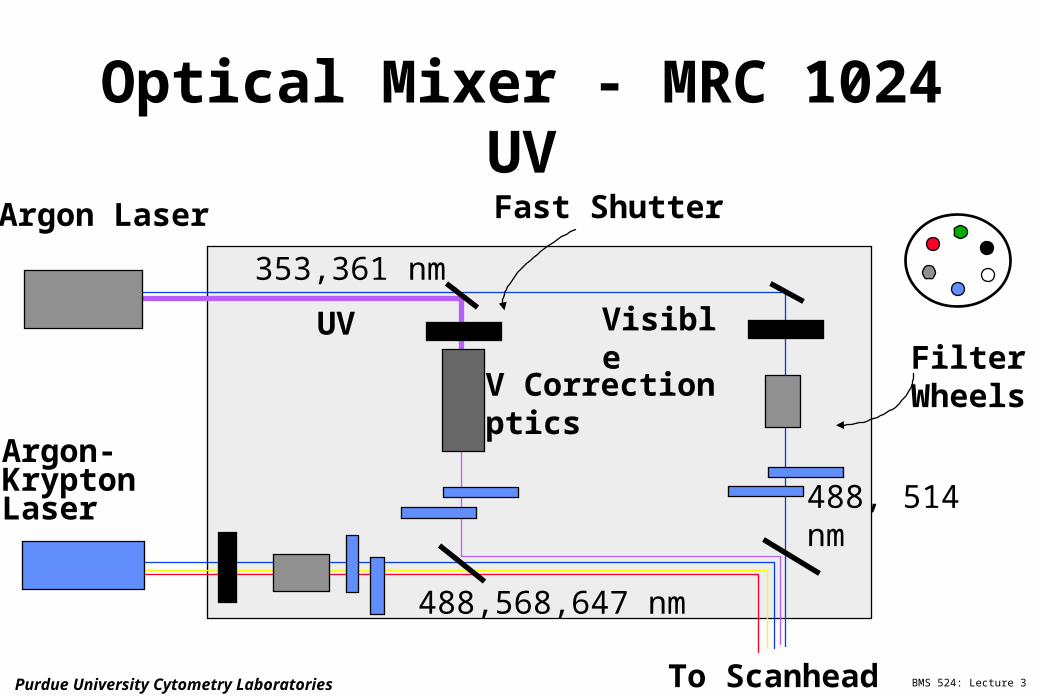
Optical Mixer - MRC 1024 UV
Argon Laser
Argon-KryptonLaser
Fast Shutter
UV CorrectionOptics
FilterWheels
To Scanhead
UV Visible
353,361 nm
488, 514 nm
488,568,647 nm

BMS 524: Lecture 3Purdue University Cytometry Laboratories
MRC 1024 Scanhead
From Laser
To and from Scope
32
1PMTGalvanometers
EmissionFilterWheel

BMS 524: Lecture 3Purdue University Cytometry Laboratories
To Scanhead
From Scanhead

BMS 524: Lecture 3Purdue University Cytometry Laboratories
Scanning Galvanometers
xy
Laser in
Laser out
Point Scanning
ToMicroscope

BMS 524: Lecture 3Purdue University Cytometry Laboratories
The Scan Path of the Laser Beam767, 1023, 1279
511, 1023
00Start
Specimen
Frames/Sec # Lines1 5122 2564 1288 6416 32

BMS 524: Lecture 3Purdue University Cytometry Laboratories
How a Confocal Image is Formed
CondenserLens
Pinhole 1 Pinhole 2
ObjectiveLens
Specimen
Detector
Modified from: Handbook of Biological Confocal Microscopy. J.B.Pawley, Plennum Press, 1989

BMS 524: Lecture 3Purdue University Cytometry Laboratories
Fundamental Limitations of Confocal Microscopy
FromSource
To Detector
.x,y,z
2
n2 photons2
1
n1 photons
1
z
y
xVOXEL
PIXEL
From: Handbook of Biological Confocal Microscopy. J.B.Pawley, Plennum Press, 1989

BMS 524: Lecture 3Purdue University Cytometry Laboratories
Optical Resolution
• Gray Level
• Pixelation
• Aberrations

BMS 524: Lecture 3Purdue University Cytometry Laboratories
Gray Level & Pixelation• Analogous to intensity range
For computer images each pixel is assigned a value. If the image is 8 bit, there are 28 or 256 levels of intensity If the image is 10 bit there are 1024 levels, 12 bit 4096 levels etc.
• The intensity analogue of a pixel is its grey level which shows up as brightness.
• The display will determine the possible resolution since on a TV screen, the image can only be displayed based upon the number of elements in the display. Of course, it is not possible to increase the resolution of an image by attributing more “pixels” to it than were collected in the original collection!

BMS 524: Lecture 3Purdue University Cytometry Laboratories
Pixels
• Pixels & image structure
Hardcopy usually compromises pixel representation. With 20/20 vision you can distinguish dots 1 arc second apart (300 m at 1 m) so 300 DPS on a page is fine. So at 100 m, you could use dots 300 mm in size and get the same effect! Thus an image need only be parsimonius, i.e., it only needs to show what is necessary to provide the expected image.

BMS 524: Lecture 3Purdue University Cytometry Laboratories
Pixels
T
BMS 524: Lecture 3Purdue University Cytometry Laboratories
BMS 524: Lecture 3Purdue University Cytometry Laboratories
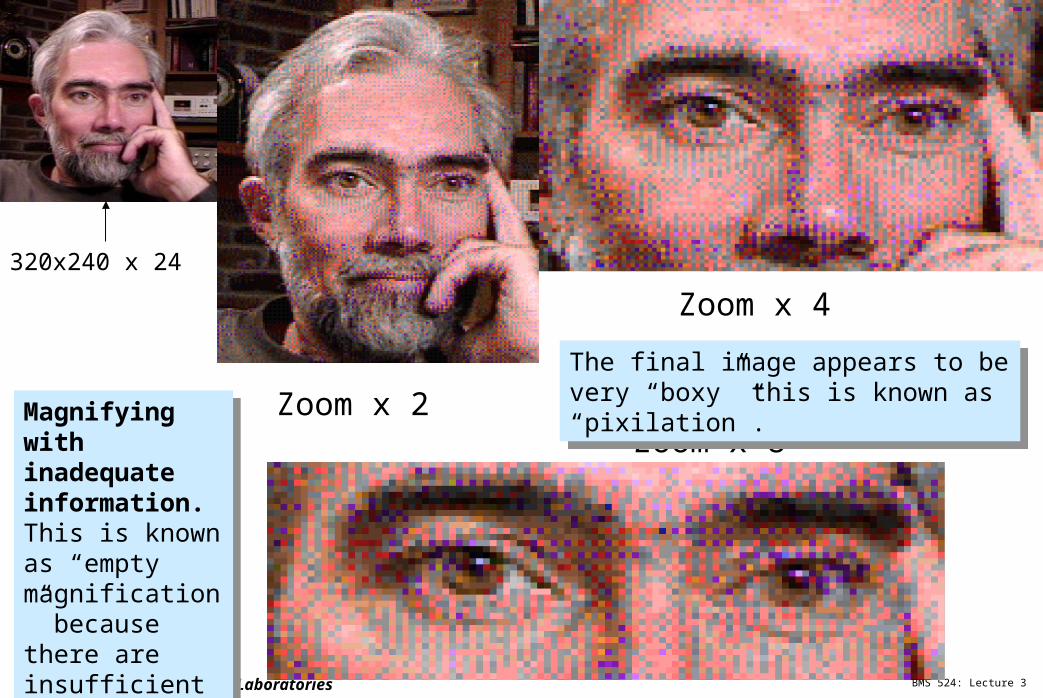
320x240 x 24
Zoom x 2Zoom x 8
Zoom x 4
Magnifying with inadequate information. This is known as “empty magnification” because there are insufficient data points.
Magnifying with inadequate information. This is known as “empty magnification” because there are insufficient data points.
The final image appears to be very “boxy” this is known as “pixilation”.
The final image appears to be very “boxy” this is known as “pixilation”.

BMS 524: Lecture 3Purdue University Cytometry Laboratories
541x600x8
361x400x8
180x200x8
Magnifying with adequate information. Here, the original image was collected with many more pixels - so the magnified image looks better!
Magnifying with adequate information. Here, the original image was collected with many more pixels - so the magnified image looks better!
Socrates?….well perhaps not...
Socrates?….well perhaps not...
BMS 524: Lecture 3Purdue University Cytometry Laboratories
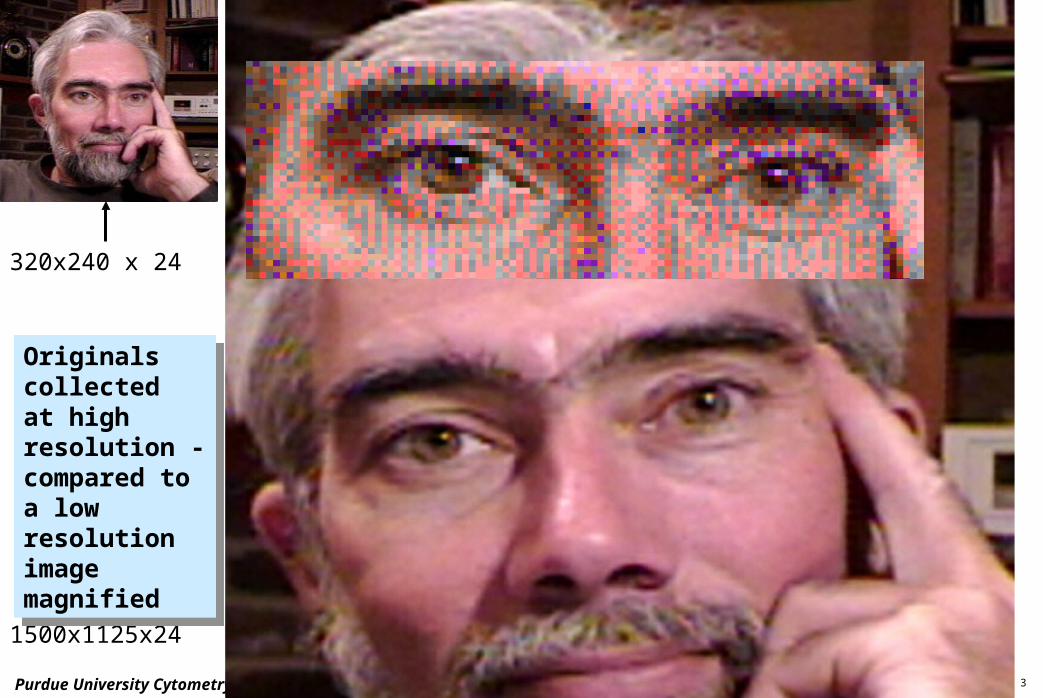
320x240 x 24
1500x1125x24
Originals collected at high resolution - compared to a low resolution image magnified
Originals collected at high resolution - compared to a low resolution image magnified
BMS 524: Lecture 3Purdue University Cytometry Laboratories
Sampling Theory• The Nyquist Theorem
– Nyquest theory describes the sampling frequency required to represent the true identity of the sample.
– i.e., how many times must you sample an image to know that your sample truly represents the image?
• Nyquist claimed that the rate was 2f. It has been determined that in reality the rate is 2.3f - in essence you must sample at least 2 times the highest frequency.

BMS 524: Lecture 3Purdue University Cytometry Laboratories
Raman Scattering
• At an excitation line of 488 nm, Raman scatter will be at 584 nm or less with increased concentration of protein, etc.
• Is directly proportional to the power of the laser light

BMS 524: Lecture 3Purdue University Cytometry Laboratories
3D Image Reconstruction
z
x
y

BMS 524: Lecture 3Purdue University Cytometry Laboratories
z
x
y
z
yy
3D Image Reconstruction

BMS 524: Lecture 3Purdue University Cytometry Laboratories
x
y
z
y
y
z
3D Image Reconstruction

BMS 524: Lecture 3Purdue University Cytometry Laboratories
Fluorescent image of paper

BMS 524: Lecture 3Purdue University Cytometry Laboratories
Pine Tree pollen - collected on a Bio-Rad MRC 1024 at Purdue University Cytometry Laboratories

BMS 524: Lecture 3Purdue University Cytometry Laboratories
Fly eye! - collected on a Bio-Rad MRC 1024 at Purdue University Cytometry
Laboratories

BMS 524: Lecture 3Purdue University Cytometry Laboratories
Collagen fibers collected using transmitted light and fluorescence [collected on a Bio-Rad MRC 1024 at Purdue University Cytometry Laboratories ]

BMS 524: Lecture 3Purdue University Cytometry Laboratories
Collagen fibers collected using transmitted light [collected on a Bio-Rad
MRC 1024 at Purdue University Cytometry Laboratories ]
BMS 524: Lecture 3Purdue University Cytometry Laboratories
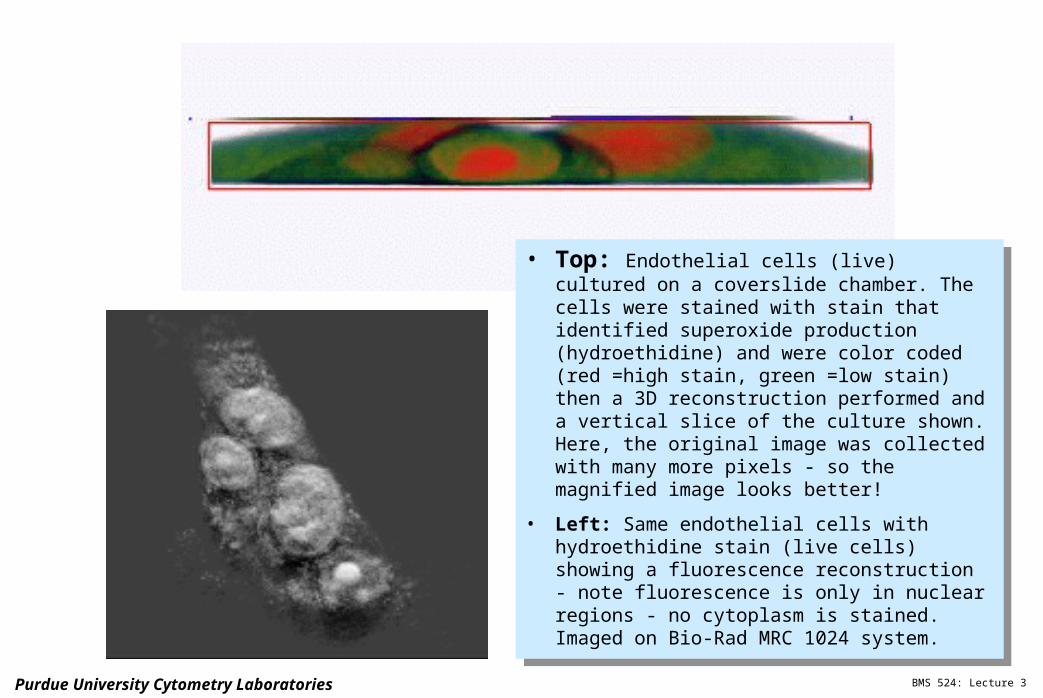
• Top: Endothelial cells (live) cultured on a coverslide chamber. The cells were stained with stain that identified superoxide production (hydroethidine) and were color coded (red =high stain, green =low stain) then a 3D reconstruction performed and a vertical slice of the culture shown. Here, the original image was collected with many more pixels - so the magnified image looks better!
• Left: Same endothelial cells with hydroethidine stain (live cells) showing a fluorescence reconstruction - note fluorescence is only in nuclear regions - no cytoplasm is stained. Imaged on Bio-Rad MRC 1024 system.

BMS 524: Lecture 3Purdue University Cytometry Laboratories
BMS 524: Lecture 3Purdue University Cytometry Laboratories
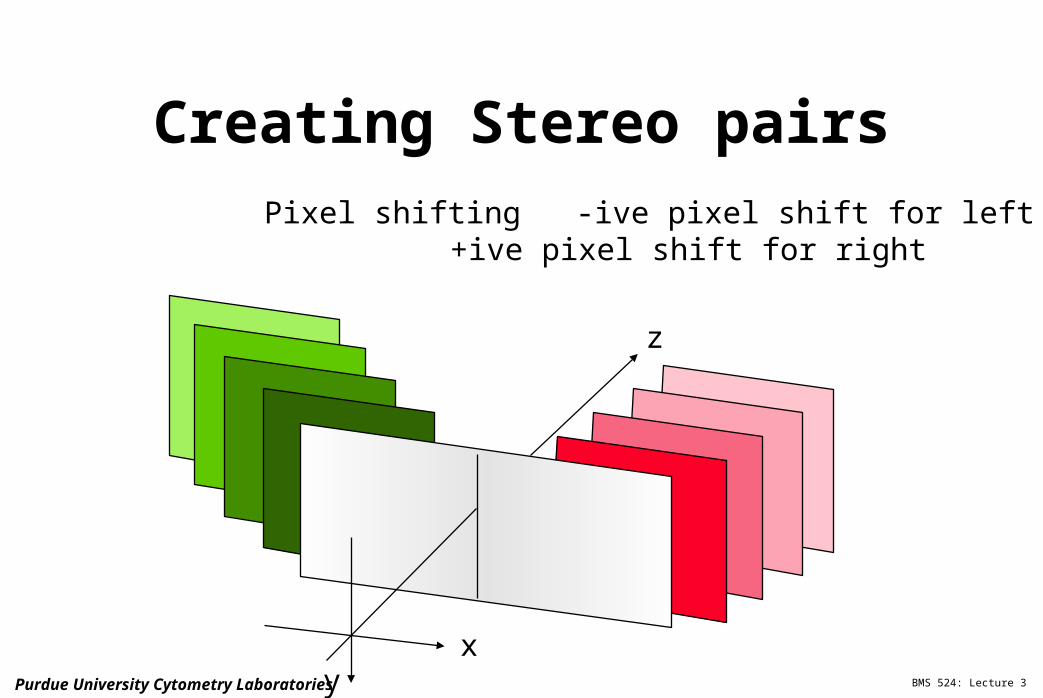
Creating Stereo pairs
z
xy
Pixel shifting -ive pixel shift for left+ive pixel shift for right

BMS 524: Lecture 3Purdue University Cytometry Laboratories
BMS 524: Lecture 3Purdue University Cytometry Laboratories
SUMMARY SLIDE
• Components of a confocal system
• Optical pathways
• Optical filters
• Resolution
• 3D basics
• Light paths and lasers


