California Recreational Boating Accident Statistics
Edmund G. Brown Jr., Governor State of California
John Laird Secretary for Resources
Sylvia Ortega Hunter, Acting Director Department of Boating and Waterways
State of California The Natural Resources Agency
California Department of Boating and Waterways
2012
California
2012 California Recreational Boating Accident Statistics2 I

Boating Accident Statistics
3
California Boating Accidents by Location 2011-2012
Accidents Injuries Fatalities
Waterway Categories 2011 2012 2011 2012 2011 2012
Northern Lake 137 151 100 96 9 18
Southern Lake 68 48 56 24 7 6
Northern Coast 23 23 10 17 2 9
Southern Coast 133 125 53 39 10 9
Northern River 27 23 16 17 9 5
Southern River 10 2 13 0 6 0
SF Bay Area 31 15 9 6 5 0
Delta 58 66 32 34 2 5
Colorado River 25 20 24 14 4 1
Totals 512 473 313 247 54 53
Property Damage 2003-2012
Year Property Damage
2003 $3,820,000
2004 $4,073,400
2005 $3,584,700
2006 $8,913,375
2007 $10,643,800
2008 $5,899,184
2009 $4,484,105
2010 $4,040,700
2011 $2,142,655
2012 $5,794,000
963
744 801
757 804
686
627
570
512 473
502
439 428 445 482
382 398
283 313
247
61 44 58 42 55 48 49 49 54 53
0
200
400
600
800
1,000
2003 2004 2005 2006 2007 2008 2009 2010 2011 2012
Accidents, Injuries, Fatalities, and Property Damage 2003-2012
Accidents Injuries Fatalities
California
2012 California Recreational Boating Accident Statistics4 I
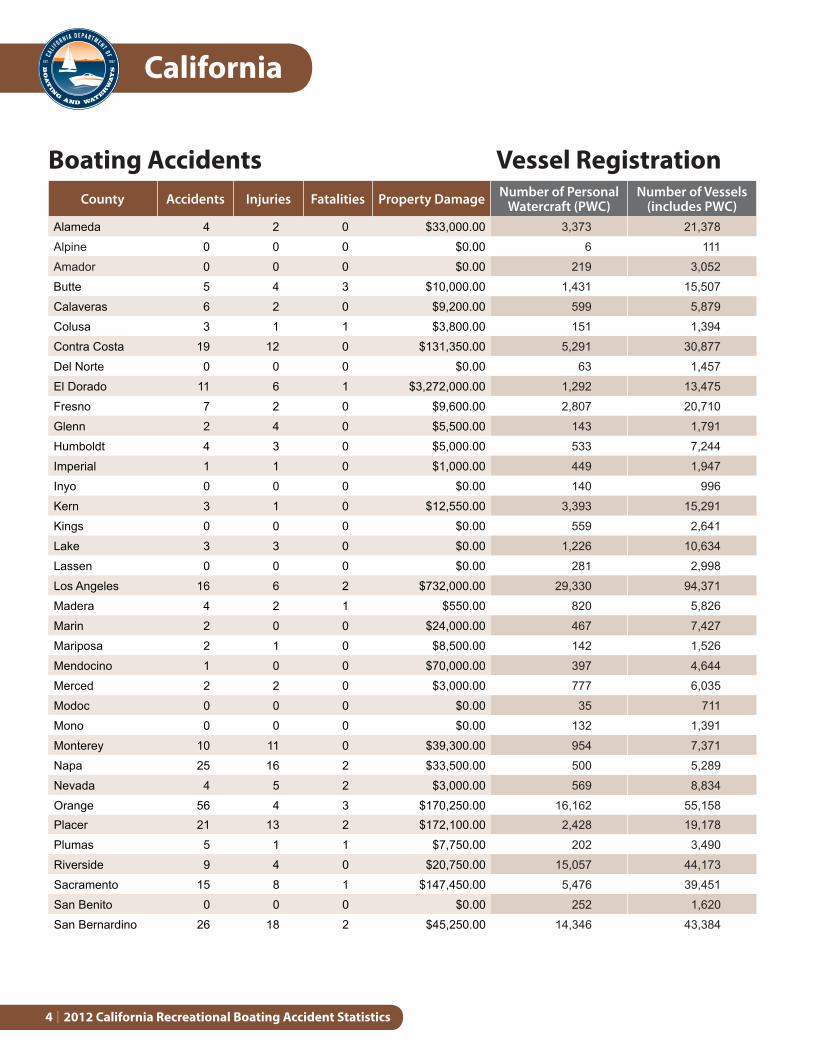
Boating Accidents Vessel RegistrationCounty Accidents Injuries Fatalities Property Damage Number of Personal
Watercraft (PWC)Number of Vessels
(includes PWC)
Alameda 4 2 0 $33,000.00 3,373 21,378
Alpine 0 0 0 $0.00 6 111
Amador 0 0 0 $0.00 219 3,052
Butte 5 4 3 $10,000.00 1,431 15,507
Calaveras 6 2 0 $9,200.00 599 5,879
Colusa 3 1 1 $3,800.00 151 1,394
Contra Costa 19 12 0 $131,350.00 5,291 30,877
Del Norte 0 0 0 $0.00 63 1,457
El Dorado 11 6 1 $3,272,000.00 1,292 13,475
Fresno 7 2 0 $9,600.00 2,807 20,710
Glenn 2 4 0 $5,500.00 143 1,791
Humboldt 4 3 0 $5,000.00 533 7,244
Imperial 1 1 0 $1,000.00 449 1,947
Inyo 0 0 0 $0.00 140 996
Kern 3 1 0 $12,550.00 3,393 15,291
Kings 0 0 0 $0.00 559 2,641
Lake 3 3 0 $0.00 1,226 10,634
Lassen 0 0 0 $0.00 281 2,998
Los Angeles 16 6 2 $732,000.00 29,330 94,371
Madera 4 2 1 $550.00 820 5,826
Marin 2 0 0 $24,000.00 467 7,427
Mariposa 2 1 0 $8,500.00 142 1,526
Mendocino 1 0 0 $70,000.00 397 4,644
Merced 2 2 0 $3,000.00 777 6,035
Modoc 0 0 0 $0.00 35 711
Mono 0 0 0 $0.00 132 1,391
Monterey 10 11 0 $39,300.00 954 7,371
Napa 25 16 2 $33,500.00 500 5,289
Nevada 4 5 2 $3,000.00 569 8,834
Orange 56 4 3 $170,250.00 16,162 55,158
Placer 21 13 2 $172,100.00 2,428 19,178
Plumas 5 1 1 $7,750.00 202 3,490
Riverside 9 4 0 $20,750.00 15,057 44,173
Sacramento 15 8 1 $147,450.00 5,476 39,451
San Benito 0 0 0 $0.00 252 1,620
San Bernardino 26 18 2 $45,250.00 14,346 43,384

Boating Accident Statistics
5
Boating Accidents Vessel RegistrationCounty Accidents Injuries Fatalities Property Damage Number of Personal
Watercraft (PWC)Number of Vessels
(includes PWC)
San Diego 42 30 4 $227,800.00 11,461 55,399
San Francisco 8 7 6 $21,000.00 320 3,354
San Joaquin 32 11 5 $166,950.00 3,386 23,030
San Luis Obispo 7 1 0 $99,500.00 1,615 12,028
San Mateo 3 3 3 $3,000.00 1,699 9,973
Santa Barbara 5 0 4 $15,400.00 1,190 8,870
Santa Clara 5 3 0 $6,200.00 4,069 22,531
Santa Cruz 3 0 0 $7,000.00 644 6,675
Shasta 32 22 5 $50,650.00 1,497 18,371
Sierra 0 0 0 $0.00 13 311
Siskiyou 0 0 0 $0.00 155 3,905
Solano 11 7 0 $74,350.00 1,727 13,202
Sonoma 11 5 0 $37,300.00 1,782 16,177
Stanislaus 3 1 0 $15,000.00 2,408 16,531
Sutter 1 0 0 $2,000.00 603 5,107
Tehama 1 1 0 $0.00 365 4,299
Trinity 3 2 1 $0.00 129 2,010
Tulare 6 2 0 $12,850.00 1,354 8,273
Tuolumne 19 9 1 $50,100.00 456 5,651
Ventura 9 1 0 $14,900.00 4,475 20,603
Yolo 2 2 0 $2,600.00 561 5,537
Yuba 4 8 3 $17,000.00 427 4,230
Out of State 0 0 0 $0.00 785 3,256
Totals 473 247 53 $5,794,000.00 151,123 776,584

California
2012 California Recreational Boating Accident Statistics6 I
Time of Day Number of Accidents
12:00-1:59 a.m. 11
200-3:59 a.m. 6
4:00-5:59 a.m. 7
6:00-7:59 a.m. 9
8:00-9:59 a.m. 27
10:00-11:59 a.m. 51
12:00-1:59 p.m. 73
2:00-3:59 p.m. 95
4:00-5:59 p.m. 92
6:00-7:59 p.m. 58
8:00-9:59 p.m. 25
10:00-11:59 p.m. 11
Time Unknown 8
Total Accidents 473
Accidents by Time of Day
18
14
16
21
41
73
110
69
59
28
13
11
0 20 40 60 80 100 120
January
February
March
April
May
June
July
August
September
October
November
December
Accidents by Month (Total Accidents 473)
148
40
30
41
40
50
124
0 20 40 60 80 100 120 140 160
Sunday
Monday
Tuesday
Wednesday
Thursday
Friday
Saturday
Accidents by Day of the Week (Total Accidents 473)
Boating Accident Statistics
7
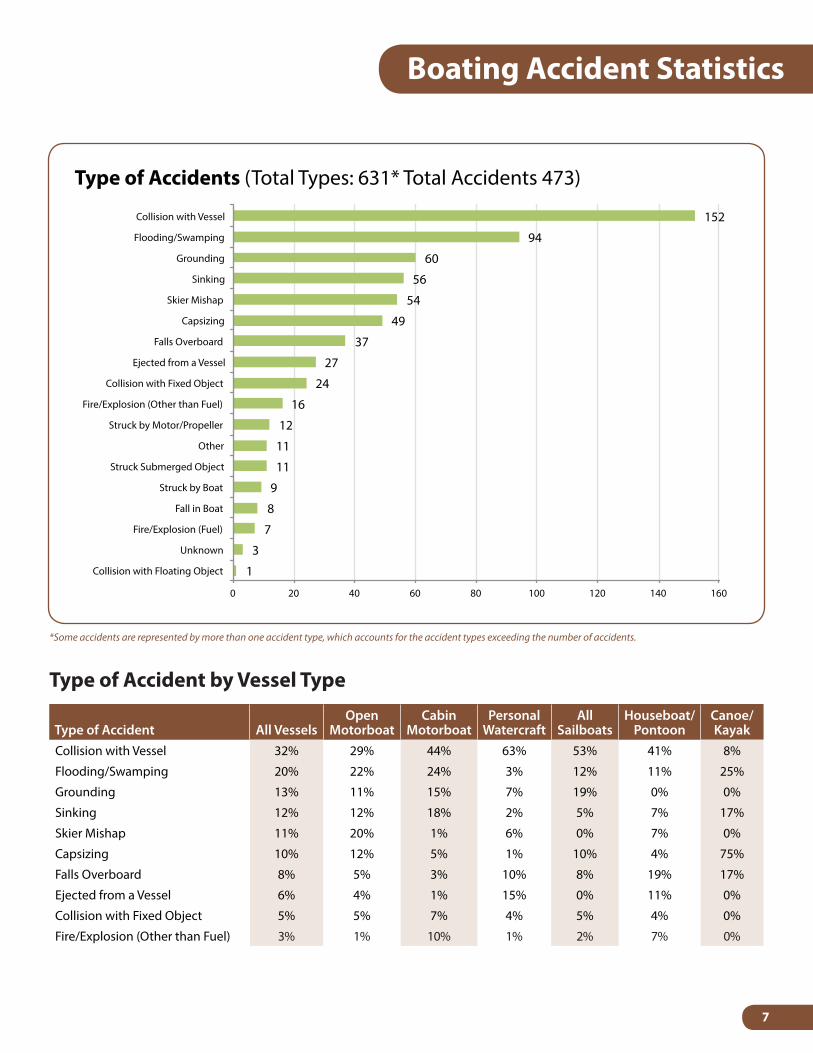
Type of Accident by Vessel Type
Type of Accident All VesselsOpen
MotorboatCabin
MotorboatPersonal
WatercraftAll
SailboatsHouseboat/
PontoonCanoe/ Kayak
Collision with Vessel 32% 29% 44% 63% 53% 41% 8%
Flooding/Swamping 20% 22% 24% 3% 12% 11% 25%
Grounding 13% 11% 15% 7% 19% 0% 0%
Sinking 12% 12% 18% 2% 5% 7% 17%
Skier Mishap 11% 20% 1% 6% 0% 7% 0%
Capsizing 10% 12% 5% 1% 10% 4% 75%
Falls Overboard 8% 5% 3% 10% 8% 19% 17%
Ejected from a Vessel 6% 4% 1% 15% 0% 11% 0%
Collision with Fixed Object 5% 5% 7% 4% 5% 4% 0%
Fire/Explosion (Other than Fuel) 3% 1% 10% 1% 2% 7% 0%
*Some accidents are represented by more than one accident type, which accounts for the accident types exceeding the number of accidents.
152
94
60
56
54
49
37
27
24
16
12
11
11
9
8
7
3
1
0 20 40 60 80 100 120 140 160
Collision with Vessel
Flooding/Swamping
Grounding
Sinking
Skier Mishap
Capsizing
Falls Overboard
Ejected from a Vessel
Collision with Fixed Object
Fire/Explosion (Other than Fuel)
Struck by Motor/Propeller
Other
Struck Submerged Object
Struck by Boat
Fall in Boat
Fire/Explosion (Fuel)
Unknown
Collision with Floating Object
Type of Accidents (Total Types: 631* Total Accidents 473)

California
2012 California Recreational Boating Accident Statistics8 I
Cause of Accident by Type of Vessel
Cause of Accident All VesselsOpen
MotorboatCabin
MotorboatPersonal
WatercraftAll
SailboatsHouseboat/
PontoonCanoe/ Kayak
Operator Inattention 36% 41% 37% 43% 39% 41% 17%
Operator Inexperience 22% 17% 14% 51% 17% 26% 25%
Excessive Speed 21% 23% 15% 47% 14% 11% 8%
Passenger/Skier Behavior 14% 22% 1% 4% 2% 26% 8%
Machinery Failure 10% 10% 22% 2% 7% 7% 0%
Equipment Failure 7% 5% 11% 1% 12% 7% 0%
Weather 6% 5% 6% 2% 17% 0% 17%
*Many accidents had more than one cause, which is reflected in this chart. The “Other” category includes causes that do not fit into any of the other categories listed above.
168 103
101 67
56 49
32 30
16 16 15 15
13 9 9
6 6 5 5 4 4 4
2 2 1 1 1
0 20 40 60 80 100 120 140 160 180
Operator Inattention
Operator Inexperience
Excessive Speed
Passenger/Skier Behavior
Unknown
Machinery Failure
Equipment Failure
Weather
Careless/Reckless Operation
Off Throttle Steering
Improper anchoring
Wake
Alcohol Use
Improper Loading
Sharp Turn
Hazardous Waters
Restricted Vision
Ignition of Spilled Fuel or Vapor
Standing/Sitting on gunwales, bow, transom
Lack of or improper boat lights
Other
Overloading
Failure to vent
No Proper Lookout
Drug Use
Hull Failure
Rules of the Road infraction
Cause of Accidents (Total Causes 740* Total Accidents 473)
Boating Accident Statistics
9
All Vessels Open Motorboats Personal Watercraft
Operated ByNumber of
VesselsPercent of
VesselsNumber of
VesselsPercent of
VesselsNumber of
VesselsPercent of
Vessels
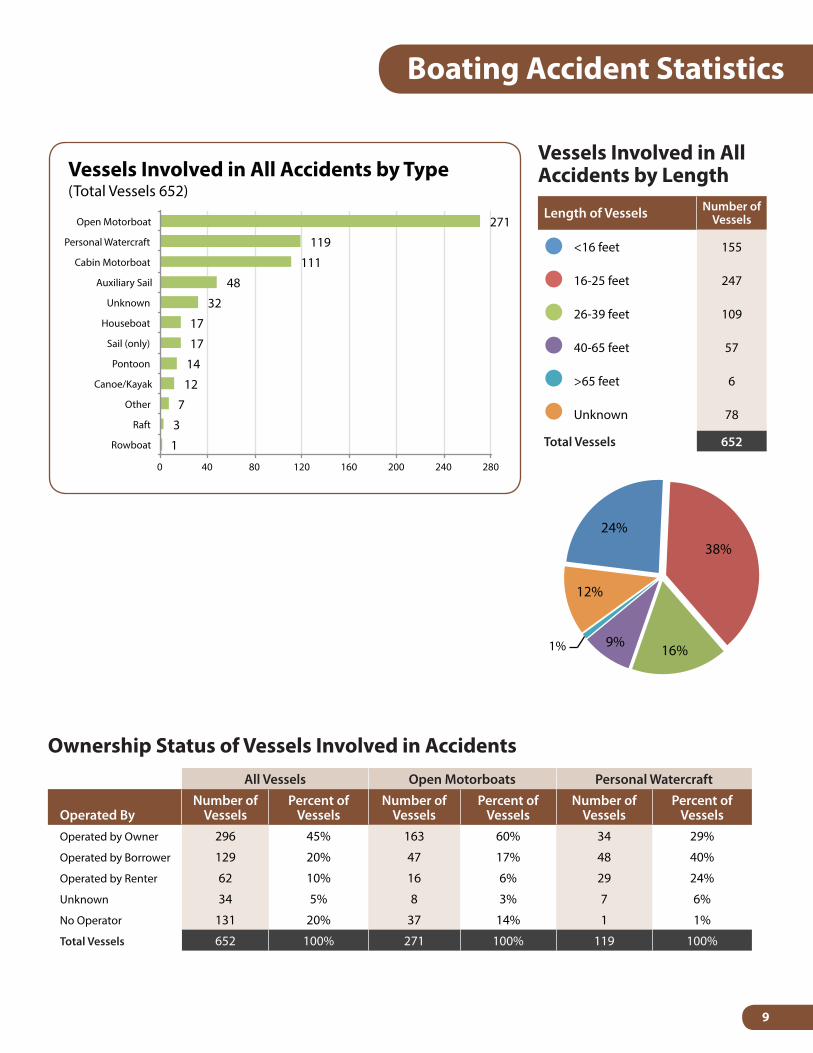
Operated by Owner 296 45% 163 60% 34 29%
Operated by Borrower 129 20% 47 17% 48 40%
Operated by Renter 62 10% 16 6% 29 24%
Unknown 34 5% 8 3% 7 6%
No Operator 131 20% 37 14% 1 1%
Total Vessels 652 100% 271 100% 119 100%
Ownership Status of Vessels Involved in Accidents
Vessels Involved in All Accidents by Length
Length of Vessels Number of Vessels
<16 feet 155
16-25 feet 247
26-39 feet 109
40-65 feet 57
>65 feet 6
Unknown 78
Total Vessels 652
24% 38%
16% 9% 1%
12%
Vessels Involved in All Accidents by Length
Vessels <16 feet
Vessels 16-25 feet
Vessels 26-39 feet
Vessels 40-65 feet
Vessels over 65 feet
Unknown
168 103
101 67
56 49
32 30
16 16 15 15
13 9 9
6 6 5 5 4 4 4
2 2 1 1 1
0 20 40 60 80 100 120 140 160 180
Operator Inattention
Operator Inexperience
Excessive Speed
Passenger/Skier Behavior
Unknown
Machinery Failure
Equipment Failure
Weather
Careless/Reckless Operation
Off Throttle Steering
Improper anchoring
Wake
Alcohol Use
Improper Loading
Sharp Turn
Hazardous Waters
Restricted Vision
Ignition of Spilled Fuel or Vapor
Standing/Sitting on gunwales, bow, transom
Lack of or improper boat lights
Other
Overloading
Failure to vent
No Proper Lookout
Drug Use
Hull Failure
Rules of the Road infraction
Cause of Accidents (Total Causes 740* Total Accidents 473)
271
119
111
48
32
17
17
14
12
7
3
1
0 40 80 120 160 200 240 280
Open Motorboat
Personal Watercraft
Cabin Motorboat
Auxiliary Sail
Unknown
Houseboat
Sail (only)
Pontoon
Canoe/Kayak
Other
Raft
Rowboat
Vessels Involved in All Accidents by Type (Total Vessels 652)
California
2012 California Recreational Boating Accident Statistics10 I
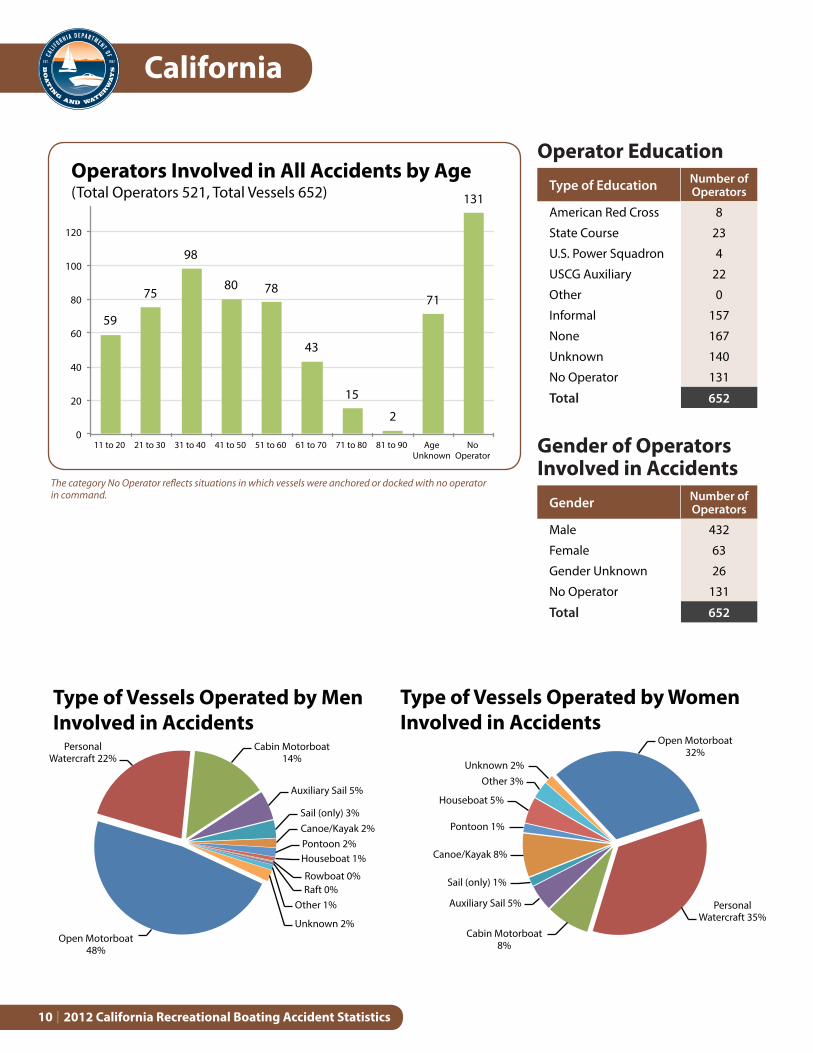
Operator Education
Gender of Operators Involved in Accidents
Type of Education Number of Operators
American Red Cross 8
State Course 23
U.S. Power Squadron 4
USCG Auxiliary 22
Other 0
Informal 157
None 167
Unknown 140
No Operator 131
Total 652
Gender Number of Operators
Male 432
Female 63
Gender Unknown 26
No Operator 131
Total 652
The category No Operator reflects situations in which vessels were anchored or docked with no operator in command.
Open Motorboat 32%
Personal Watercraft 35%
Cabin Motorboat 8%
Auxiliary Sail 5%
Sail (only) 1%
Canoe/Kayak 8%
Pontoon 1%
Houseboat 5%
Other 3% Unknown 2%
Type of Vessels Operated by Women Involved in Accidents
Open Motorboat 48%
Personal Watercraft 22%
Cabin Motorboat 14%
Auxiliary Sail 5%
Sail (only) 3% Canoe/Kayak 2% Pontoon 2% Houseboat 1%
Rowboat 0% Raft 0%
Other 1%
Unknown 2%
Type of Vessels Operated by Men Involved in Accidents
59
75
98
80 78
43
15
2
71
131
0
20
40
60
80
100
120
11 to 20 21 to 30 31 to 40 41 to 50 51 to 60 61 to 70 71 to 80 81 to 90 Age Unknown
No Operator
Operators Involved in All Accidents by Age (Total Operators 521, Total Vessels 652)
Boating Accident Statistics
11
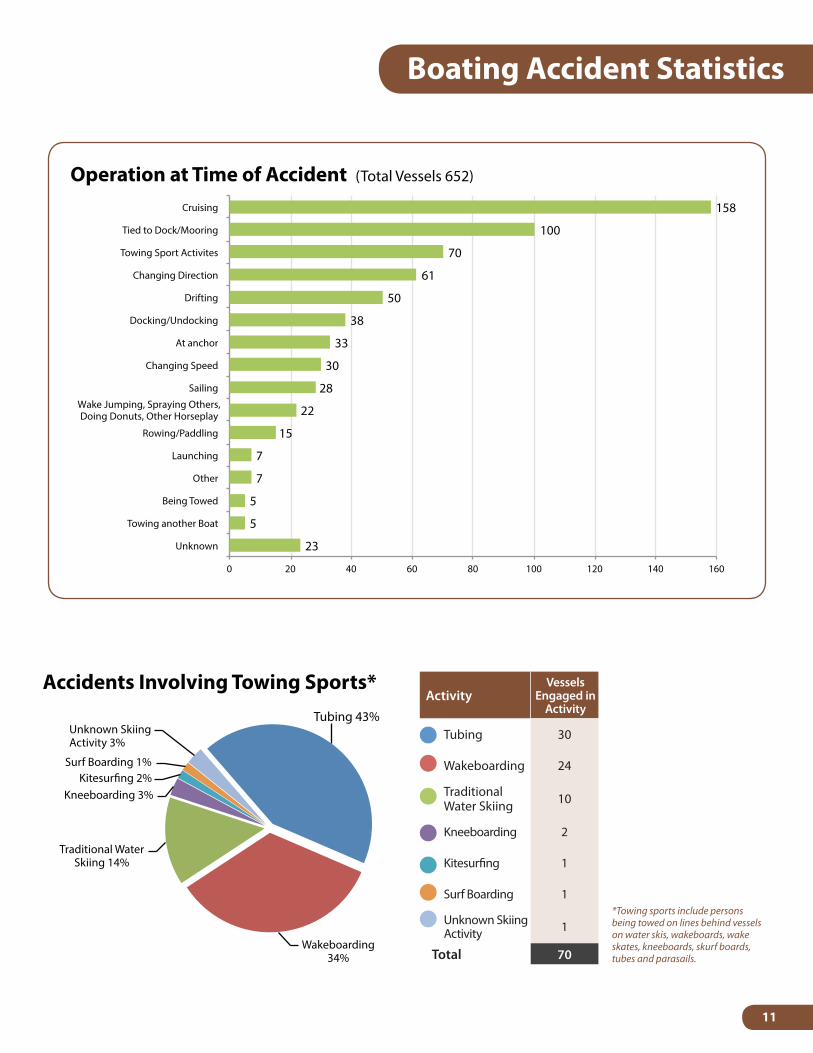
*Towing sports include persons being towed on lines behind vessels on water skis, wakeboards, wake skates, kneeboards, skurf boards, tubes and parasails.
Tubing 43%
Wakeboarding 34%
Traditional Water Skiing 14%
Kneeboarding 3% Kitesur�ng 2%
Surf Boarding 1%
Unknown Skiing Activity 3%
Accidents Involving Towing Sports*
Open Motorboat 32%
Personal Watercraft 35%
Cabin Motorboat 8%
Auxiliary Sail 5%
Sail (only) 1%
Canoe/Kayak 8%
Pontoon 1%
Houseboat 5%
Other 3% Unknown 2%
Type of Vessels Operated by Women Involved in Accidents
ActivityVessels
Engaged in Activity
Tubing 30
Wakeboarding 24
Traditional Water Skiing 10
Kneeboarding 2
Kitesurfing 1
Surf Boarding 1
Unknown Skiing Activity 1
Total 70
Cruising
Tied to Dock/Mooring
Towing Sport Activites
Changing Direction
Drifting
Docking/Undocking
At anchor
Changing Speed
Sailing
Rowing/Paddling
Launching
Other
Being Towed
Towing another Boat
Unknown
Wake Jumping, Spraying Others,Doing Donuts, Other Horseplay
Operation at Time of Accident (Total Vessels 652)
0 20 40 60 80 100 120 140 160
158
100
70
61
50
38
33
30
28
22
15
7
7
5
5
23

California
2012 California Recreational Boating Accident Statistics12 I
Accidents by Time of Day
Time of Day Number of Fatalities
12:00-1:59 a.m. 4
200-3:59 a.m. 1
4:00-5:59 a.m. 2
6:00-7:59 a.m. 0
8:00-9:59 a.m. 2
10:00-11:59 a.m. 3
12:00-1:59 p.m. 7
2:00-3:59 p.m. 15
4:00-5:59 p.m. 8
6:00-7:59 p.m. 7
8:00-9:59 p.m. 1
10:00-11:59 p.m. 1
Time Unknown 2
Total Accidents 53
12
7
2
3
1
3
25
0 5 10 15 20 25 30
Sunday
Monday
Tuesday
Wednesday
Thursday
Friday
Saturday
Fatalities by Day of the Week (Total Fatatalities 53)
2
2
5
6
2
11
7
4
8
5
0
1
0 2 4 6 8 10 12
January
February
March
April
May
June
July
August
September
October
November
December
Fatalities by Month (Total Fatatalities 53)

Boating Accident Statistics
13
18
17
10
10
6
6
2
2
2
1
1
1
0 2 4 6 8 10 12 14 16 18 20
Falls Overboard
Capsizing
Flooding/Swamping
Person(s) leaves or is ejected from a vessel
Collision with Vessel
Grounding
Other
Sinking
Unknown
Skier Mishap
Struck by Boat
Struck by Motor/Propeller
Fatalities by Type of Accident (Total Types: 76* Total Fatalities: 53)
*Some accidents are represented by more than one accident type, which accounts for the accident types exceeding the number of accidents.
*Many accidents had more than one cause, which is reflected in this chart. The “Other” category includes causes that do not fit into any of the other categories listed left.
15 13
10 8
6 5
2 2
1 1 1 1 1 1
0 2 4 6 8 10 12 14 16
Unknown
Passenger/Skier
Operator Inattention
Hazardous Waters
Excessive Speed
Alcohol Use
Improper Loading
Overloading
Drug Use
Improper Anchoring
Machinery Failure
Operator Inexperience
Sharp Turn
Weather
Fatalities by Cause of Accident (Total Causes: 67* Total Fatalities: 53)

California
2012 California Recreational Boating Accident Statistics14 I
Vessels Involved in Fatal Accidents by Length
20
8
5
4
3
2
2
1
1
1
2
0 5 10 15 20
Open Motorboat
Personal Watercraft
Houseboat
Canoe/Kayak
Raft
Auxiliary Sail
Cabin Motorboat
Pontoon
Sail (only)
Kite surfboard
Unknown
Vessels Involved in Fatal Accidents (Total Vessels 49)
Length of Vessels Number of Vessels
<16 feet 15
16-25 feet 16
26-39 feet 5
40-65 feet 4
> 65 feet 0
Unknown 9
Total Vessels 49
10
8
6
5
3
3
3
2
2
1
1
5
0 2 4 6 8 10
Drifting
Cruising
Tied to Dock/Mooring
Rowing/Paddling
Changing Direction
Changing Speed
Sailing
At anchor
Towing Sport Activities
Docking/Undocking
Launching
Unknown
Operation at Time of Fatal Accident (Total Vessels 49)

Boating Accident Statistics
15
Male 70%
Female 8%
Unknown 4%
No Operator 18%
Gender of Operators Involved in Fatal Accidents
Male
Female
Unknown
No Operator
Operator EducationType of Education Number of
Operators
American Red Cross 0
State Course 0
U.S. Power Squadron 0
USCG Auxiliary 2
Other 0
Informal 13
None 9
Unknown 16
No Operator 9
Total Operators 49
The category No Operator reflects situations in which vessels were anchored or docked with no operator in command.
9
6
1
7
8
6
7
4
1
0 0
1
2
3
4
5
6
7
8
9
10
No Operator Age Unknown
71+ 61 to 70 51 to 60 41 to 50 31 to 40 21 to 30 11 to 20 0 to 10
Age of Operator
Operators Involved in Fatal Accidents by Age (Total Operators: 40, Total Vessels: 49)
California
2012 California Recreational Boating Accident Statistics16 I
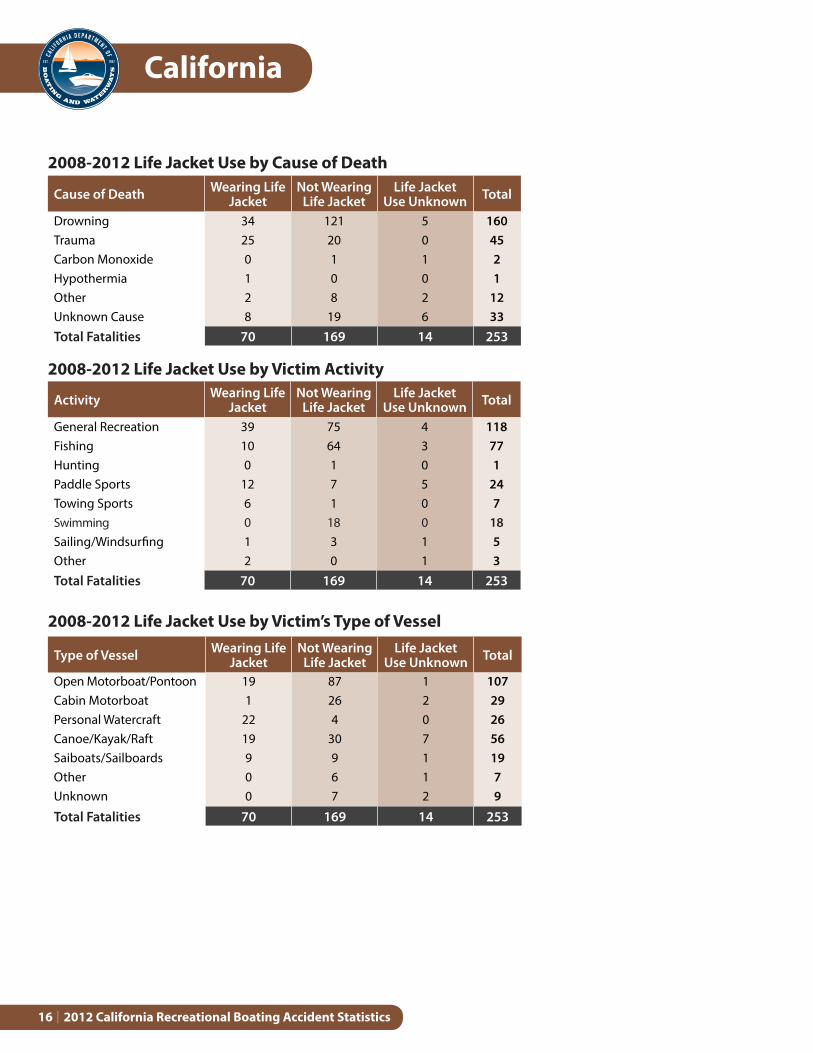
Cause of Death Wearing Life Jacket
Not Wearing Life Jacket
Life Jacket Use Unknown Total
Drowning 34 121 5 160
Trauma 25 20 0 45
Carbon Monoxide 0 1 1 2
Hypothermia 1 0 0 1
Other 2 8 2 12
Unknown Cause 8 19 6 33
Total Fatalities 70 169 14 253
Activity Wearing Life Jacket
Not Wearing Life Jacket
Life Jacket Use Unknown Total
General Recreation 39 75 4 118
Fishing 10 64 3 77
Hunting 0 1 0 1
Paddle Sports 12 7 5 24
Towing Sports 6 1 0 7
Swimming 0 18 0 18
Sailing/Windsurfing 1 3 1 5
Other 2 0 1 3
Total Fatalities 70 169 14 253
Type of Vessel Wearing Life Jacket
Not Wearing Life Jacket
Life Jacket Use Unknown Total
Open Motorboat/Pontoon 19 87 1 107
Cabin Motorboat 1 26 2 29
Personal Watercraft 22 4 0 26
Canoe/Kayak/Raft 19 30 7 56
Saiboats/Sailboards 9 9 1 19
Other 0 6 1 7
Unknown 0 7 2 9
Total Fatalities 70 169 14 253
2008-2012 Life Jacket Use by Cause of Death
2008-2012 Life Jacket Use by Victim Activity
2008-2012 Life Jacket Use by Victim’s Type of Vessel
Boating Accident Statistics
17
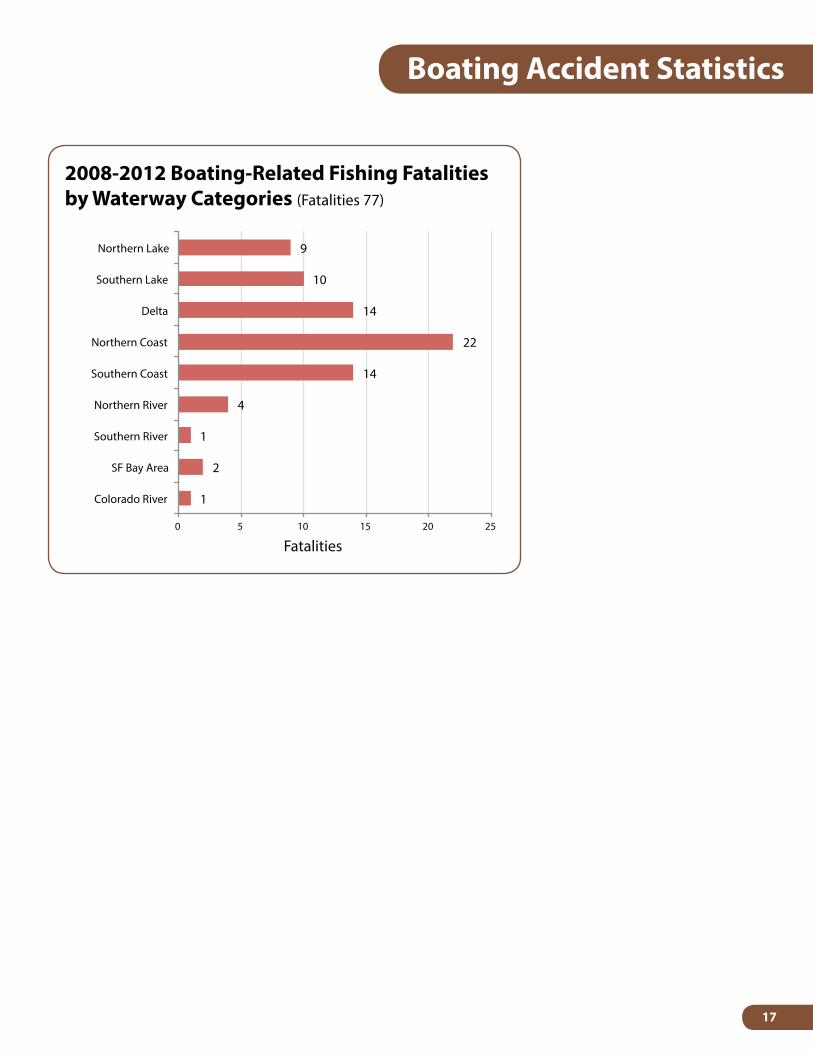
9
10
14
22
14
4
1
2
1
0 5 10 15 20 25
Northern Lake
Southern Lake
Delta
Northern Coast
Southern Coast
Northern River
Southern River
SF Bay Area
Colorado River
Fatalities
2008-2012 Boating-Related Fishing Fatalities by Waterway Categories (Fatalities 77)
California
2012 California Recreational Boating Accident Statistics18 I
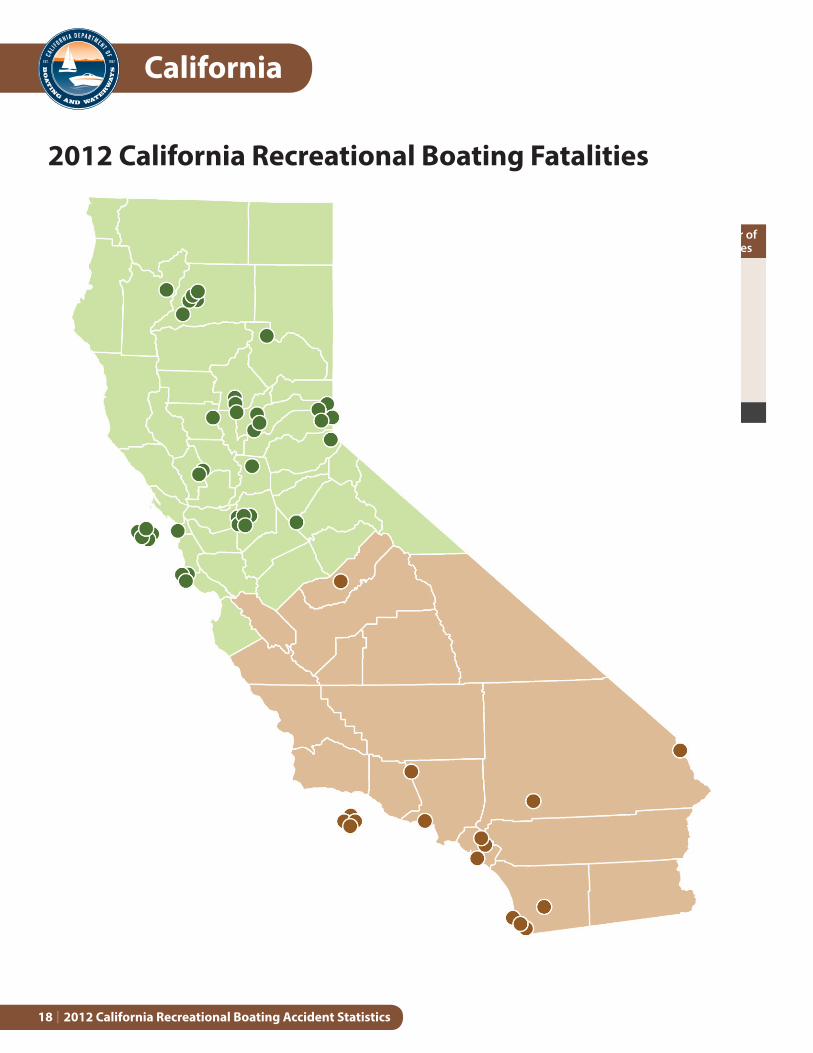
Fatalities by Location
Water Body Number of Fatalities
Northern Lake 18
Southern Lake 6
Northern River 5
Northern Coast 9
Southern Coast 9
Delta 5
Colorado River 1
Total Fatalities 53
2012 California Recreational Boating Fatalities


