
BRACE IMPACT EVALUATION: PHASE II BASELINE
Findings from Upper Nile and Western Bahr el Ghazal StatesJuba, 31 October 2013
www.southsudan-braceproject.org

WH
AT IS ...WHAT is BRACE?
“Building Resilience through Asset Creation and Enhancement” (BRACE) – 2012 until 2015
Food and cash transfers to householdsBuilds skills, physical assets and knowledge
To strengthen household and community resilience.
FFA: ‘Food For Assets’ in 3 states – Northern Bahr el Ghazal & Warrap State (Phase I), & Western Bahr el Ghazal (Phase II)
Funded by:
Implemented by:
Through: Local Partners
WHAT is BRACE Impact Evaluation?
An Impact Evaluation of BRACE FFA activities using two complementary methodologies:
Household Economic Analysis (HEA) methodology Focus Group Discussions
Quasi-experimental methodology Household interviews Community discussions
Funded by:
Implemented by:

LIVELIHO
OD
ZON
E – IRON
STON
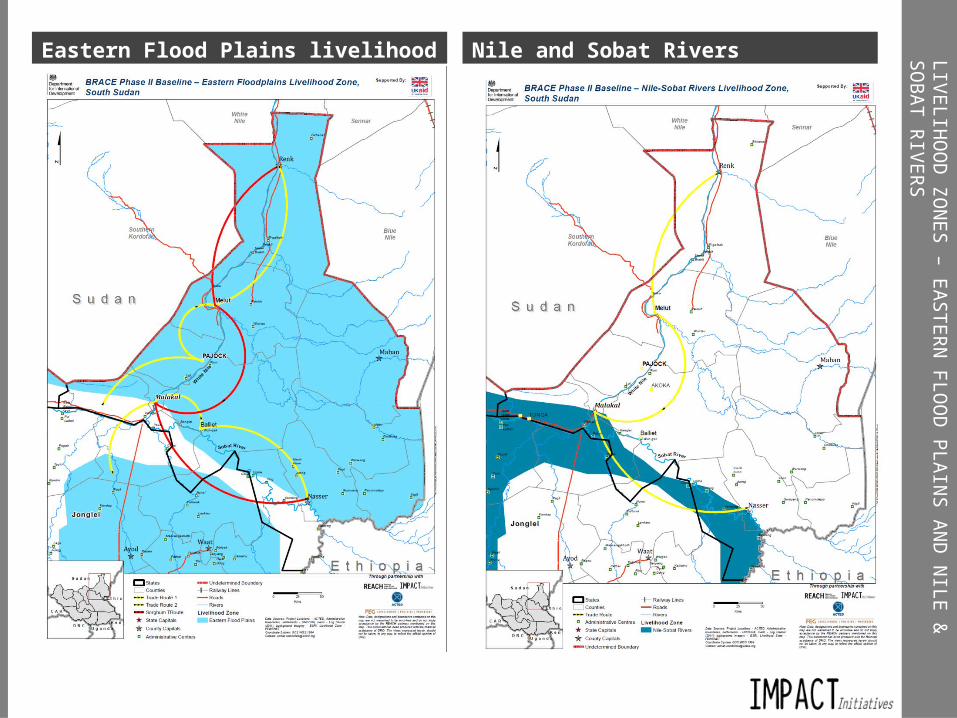
E PLATEAUIronstone Plateau livelihood zone
LIVELIHO
OD
ZON
ES – EASTERN FLO
OD
PLAINS AN
D N
ILE & SO
BAT RIVERSEastern Flood Plains livelihood zone Nile and Sobat Rivers livelihood zone

WEALTH
GRO
UP CH
ARACTERISTICS – IRON
STON
E PLATEAUHEA Wealth Group Characteristics – Ironstone Plateau (Western Bahr el Ghazal State)Wealth Group
Proportion of population belonging to Wealth Group
Livelihoods expenditure/12 months/SSP
Land Area Cultivated
Crops Cultivated Livestock/Asset Holding
Very Poor 32% 0-110 0.5-1 feddan
Maize, sorghum, groundnut, sesame, pumpkin, okra
4-5 hens and 0-1 beehives
Poor 25% 111-355 0.5-1.5 feddanMaize, sorghum, groundnut, sesame, pumpkin, okra
0-3 goats, 3-5 hens, 0-2 beehives
Middle 28% 356-790 2-2.5 feddanMaize, sorghum, groundnut, sesame, pumpkin, okra, millet, cow pea
2-3 cattle, 3-4goats, 0-4 sheep, 5-7 hens, 0-4 beehives
Better-off 15% 791+ 2-4 feddan
Maize, sorghum, groundnut, sesame, pumpkin, okra, millet, cow pea
4-5 cattle, 6-14 goats, 5-9 sheep, 8-12 hens, 0-2 fishing nets, 0-6 beehives
1 feddan = 0.42 hectare

WEALTH
GRO
UP CH
ARACTERISTICS –NILE &
SOBAT RIVERS
HEA Wealth Group Characteristics – Nile & Sobat Rivers (Upper Nile State)
Wealth Group
Proportion of population belonging to Wealth Group
Livelihoods expenditure/12 months/SSP
Land Area Cultivated
Crops Cultivated Livestock/Asset Holding
Very Poor
23%0-120 0.5-1 feddan
Maize, sorghum, cowpeas, sesame, pumpkin, okra
1-3 cattle, 1-3 goats, 0-3 sheep, 2-4 hens, 0-1 fishing spear
Poor 27% 121-340 1.01-1.5 feddanMaize, sorghum, cowpeas, sesame, pumpkin, okra
3-5 cattle, 3-6 goats, 3-5 sheep, 4-6 hens, 1 fishing spear
Middle 37%
341-700 1.51-2.5 feddanMaize, sorghum, cowpeas sesame, pumpkin, okra, tomatoes
5-15 cattle, 6-12 goats, 5-10 sheep, 6-10 hens, 0.5-1 fishing net, 1-2 fishing spears
Better-off
13%701+ 2.51-4.5 feddan
Maize, sorghum, cowpeas, sesame, pumpkin, okra, tomatoes
15-25 cattle, 12-20 goats, 10-15 sheep, 10-18 hens, 1 fishing net, 1-2 fishing spears
1 feddan = 0.42 hectare

WEALTH
GRO
UP CH
ARACTERISTICS – EASTERN FLO
OD
PLAINS
HEA Wealth Group Characteristics – Eastern Flood Plains (Upper Nile State)
Wealth Group
Proportion of population belonging to Wealth Group
Livelihoods expenditure/12 months/SSP
Land Area Cultivated
Crops Cultivated Livestock/Asset Holding
Very Poor 30% 0-300 1-2 feddan
Sorghum, maize, cowpea, pumpkin, okra
0-1 cattle, 4-6 goats, 1-2 sheep, 4-6 hens, 0-1 fishing nets, 1 hook
Poor 28%301-800 2 feddan
Sorghum, maize, cowpea, pumpkin, okra
2-6 cattle, 6-10 goats, 2-5 sheep, 6-8 hens, 1-2 fishing nets, 1-3 hooks
Middle25%
801-2700 3-4 feddanSorghum, maize, cowpea, pumpkin, okra
6-20 cattle, 10-20 goats, 5-15 sheep, 8-15 hens, 2-4 fishing nets, 2-4 hooks
Better-off17% 2701+ 4-6 feddan
Sorghum, maize, cowpeas, pumpkin, okra, groundnuts, tobacco
20-30 cattle, 20-35 goats, 15-25 sheep, 15+ hens, 4-6 fishing nets, 4-6 hooks
1 feddan = 0.42 hectare

BRACE HO
USEH
OLD
INTERVIEW
S – BY LIVELIHO
OD
ZON
ES

LIVELIHO
OD
S EXPEND
ITURE
0 45 89 133 178 233 290 371 482 605 745 900 11021305164519602470327068000
200
400
600
800
1000
1200
1400
1600
1800
2000
Households by expenditure on livelihoods in SSP/most recent 12 months
Num
ber o
f hou
seho
lds

INTERVIEW
LOCATIO
NS – BY FSM
S COU
NTY-LEVEL FO
OD
INSECU
RITY RATIN
G

FOO
D IN
SECURITY RATIN
G CALCU
LATION
Food Insecurity Rating – developed by WFPs Food Security Monitoring System (FSMS)
Food Consumption
Poor Borderline Acceptable
Ability to access food
Poor
Coping Strategies Index
High Medium Low
Medium
Coping Strategies Index
High Medium Low
Good
Coping Strategies Index
High Medium Low
Food Secure
Moderately Food Insecure Severely Food Insecure
SAMPLE
Severely food insecure county
Moderately food insecure
county
Food secure county
Severely food insecure county
Moderately food insecure
county
Food secure county
Upper Nile Western Bahr el Ghazal
0%
10%
20%
30%
40%
50%
60%
70%
80%
90%
100%
11%2% 4% 0% 1%
27%
47%
24%
45%
24% 24%
38%
43%
74%
51%
76% 75%
35%
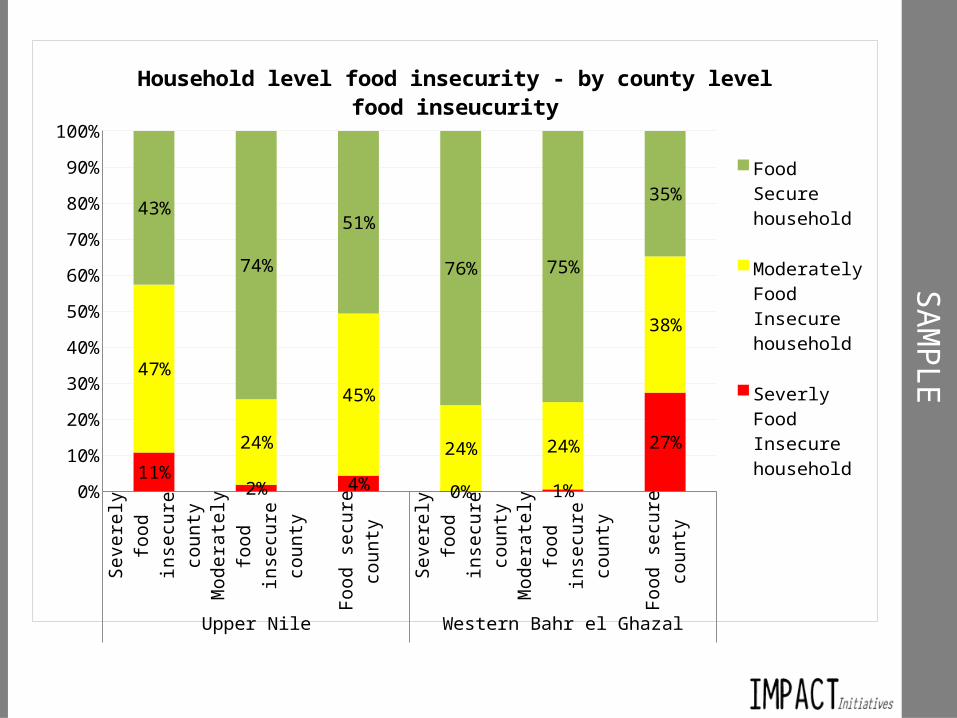
Household level food insecurity - by county level food inseucurity
Food Secure household
Moderately Food Insecure household
Severly Food Insecure household

THE SAM
PLESample by household level food insecurity , wealth group and FFA participation/eligibility
Sample by Livelihood Zone
HOUSEHOLDS Very Poor Poor Middle/ Better-off TOTAL
Food Secure 1,443 323 262 2028
Non-FFA 413 97 110 620FFA 1030 226 152 1408Moderately Food Insecure 884 159 65 1108
Non-FFA 315 29 24 368FFA 569 130 41 740Severely Food Insecure 92 89 21 202
Non-FFA 45 6 1 52FFA 47 83 20 150
TOTAL 2,419 (72%) 571 (17%) 348 (10%) 3,338
HOUSEHOLDS Very Poor % Poor % Middle/Better-off % TOTAL %
Eastern Flood Plains 757 81% 120 13% 53 6% 930 28%
Nile & Sobat Rivers 833 69% 156 13% 219 18% 1208 36%
Ironstone Plateau 867 70% 296 24% 79 6% 1242 37%
TOTAL 2,457 73% 572 17% 351 10% 3,380 100%

FOOD INSECURITY – STATE, WEALTH, COUNTY AND PRIOR FFA/GFD PARTICIPATION

FOO
D IN
SECURITY – BY LIVELIH
OO
D ZO
NE
Eastern Floodplains Nile and Sobat Rivers Ironstone PlateauUpper Nile WBeG
0%10%20%30%40%50%60%70%80%90%
100%
4% 4% 10%
45%28%
29%
50%68% 62%
Household level food insecurity - by livelihood zone
Food SecureModerately Food InsecureSeverely Food Insecure
FINDINGSHigher proportion of food insecure households in the Eastern Flood Plains LZ (50%)
compared to Nile and Sobat Rivers (32%) and Ironstone Plateau (38%)
No significant difference in proportion of food insecurity when comparing states – 39% in Western Bahr el Ghazal and 40% in Upper Nile
Similar to FSMS data (Round 10, June 2013): 39% of households in Western Bahr el Ghazal and 38% of households in Upper Nile were found to be food insecure.
Higher proportion of severely food insecure households in Western Bahr el Ghazal (10%) compared to Upper Nile (3%).

FOO
D IN
SECURITY – BY W
EALTH G
ROU
P AND
LIVELIHO
OD
ZON
E
FINDINGS• Recall that highest proportion of food insecure households was found in the Eastern Flood Plains livelihood
zone in Upper NileOn the Eastern Flood Plains, the Very Poor were much more likely to be food insecure (67%) than
Middle/Better-off households (13%)
Same in Nile and Sobat River – 34% of Very Poor households were food insecure, compared to 19% of Middle/Better-off
Trend reversed in Western Bahr el Ghazal – Very Poor were less likely to be categorised as food insecure (32%) compared to Middle/Better-off (47%).
Middle/ Better-off
Poor Very Poor Middle/ Better-off
Poor Very Poor Middle/ Better-off
Poor Very Poor
Eastern Floodplains Nile and Sobat Rivers Ironstone PlateauUpper Nile Western Bahr el Ghazal
0%10%20%30%40%50%60%70%80%90%
100%
2% 2% 5% 8% 4%25% 25%
3%11% 16%
52%
19%
32% 30%
22% 30%
29%
87% 82%
43%
81%60% 66%
53% 44%68%
Household level food insecurity - by wealth group, and livelihood zone
Food SecureModerately Food InsecureSeverely Food Insecure

FOO
D IN
SECURITY – BY CO
UN
TY
FINDINGS
Upper Nile: Longochuk County highest proportion of food insecure households (72%)
Western Bahr el Ghazal: Jur River County highest proportion food insecure households (65%)
Long
ochu
k
Ulan
g
Fash
oda
Luak
piny
/Nas
ir
Mel
ut
Mal
akal
Akok
a
Jur R
iver
Raga
Wau
Upper Nile Western Bahr elGhazal
0%10%20%30%40%50%60%70%80%90%
100%
25%11% 2% 6% 0% 2%
27%
1%
47%
46%53%
30% 34% 24% 21%
38%
24% 24%
28%43% 45%
64% 66% 74% 76%
35%
75% 76%
Household level food insecurity - by county
Food SecureModerately Food InsecureSeverely Food Insecure

PRIOR FFA/G
FD PARTICIPATIO
N – BY LO
CATION
AND
STATE
FINDINGS• Baseline data collection included communities selected for BRACE FFA participation (treatment) and those that were not selected
(control) in Upper Nile – and selection from all bomas in Western Bahr el Ghazal (all eligible for FFA selection)• Some households had already participated in FFA, either through BRACE in Upper Nile or through previous interventions in Western
Bahr el Ghazal• Based on baseline data households were split into four groups – those that had 1) already participated in FFA; 2) switched from FFA to
GFD; 3) participated in GFD; 4) not participated in any intervention• Aim of the impact evaluation is to assess difference in change of food security and resilience status of households, depending on these
four ‘starting points.’
FFA participation was actually higher in Western Bahr el Ghazal where 23% of households had participated in FFA during the 12 months preceding the survey compared to 10% in Upper Nile.
In Upper Nile, 39% of households at FFA locations had participated in FFA and the vast majority of households at non-FFA locations (96%) had not participated in any intervention at all - just 4% had participated in GFD.
Non-FFA location FFA location FFA/Non-FFA locationUpper Nile Western Bahr el Ghazal
0%10%20%30%40%50%60%70%80%90%
100%
4%
6%14%
96%
55% 64%
20%8%
19%15%
Prior participation in FFA/GFD interventions - by FFA/Non-FFA location and and State
NoneGFDFFA/GFDFFA

PRIOR FFA/G
FD PARTICIPATIO
N – BY W
EALTH G
ROU
P, LOCATIO
N AN
D
STATE
FINDINGS
In Upper Nile: Very Poor households were the least likely to have participated in any intervention – 42% had taken part compared to 55% of Poor and 54% of Middle/better-off households.
Trend reversed in Western Bahr el Ghazal: Poorer households were more likely to have participated in FFA and/or GFD – 37% of Very Poor households had participated compared to 30% of Middle/better-off households.
Future rounds of surveying will aim to establish whether FFA participation is associated with an increase in wealth or whether wealthier households are more likely to participate in FFA.
Mid
dle/
Bet
ter-o
ff
Poor
Very
Poo
r
Mid
dle/
Bet
ter-o
ff
Poor
Very
Poo
r
Non-FFA loca-tion
FFA location Non-FFA/FFA location
Upper Nile WBeG
0%20%40%60%80%
100%
4%
9% 6%5%
13% 11% 14%
96%
46% 45% 58% 70% 64% 63%
13% 21% 22% 6% 4% 9%
33% 28% 15%11% 21% 13%
Prior participation in FFA/GFD intervention - by wealth group, FFA/Non-FFA location and State
NoneGFDFFA/GFDFFA
FOO
D IN
SECURITY – PRIO
R FFA/GFD
PARTICIPATION
FINDINGS
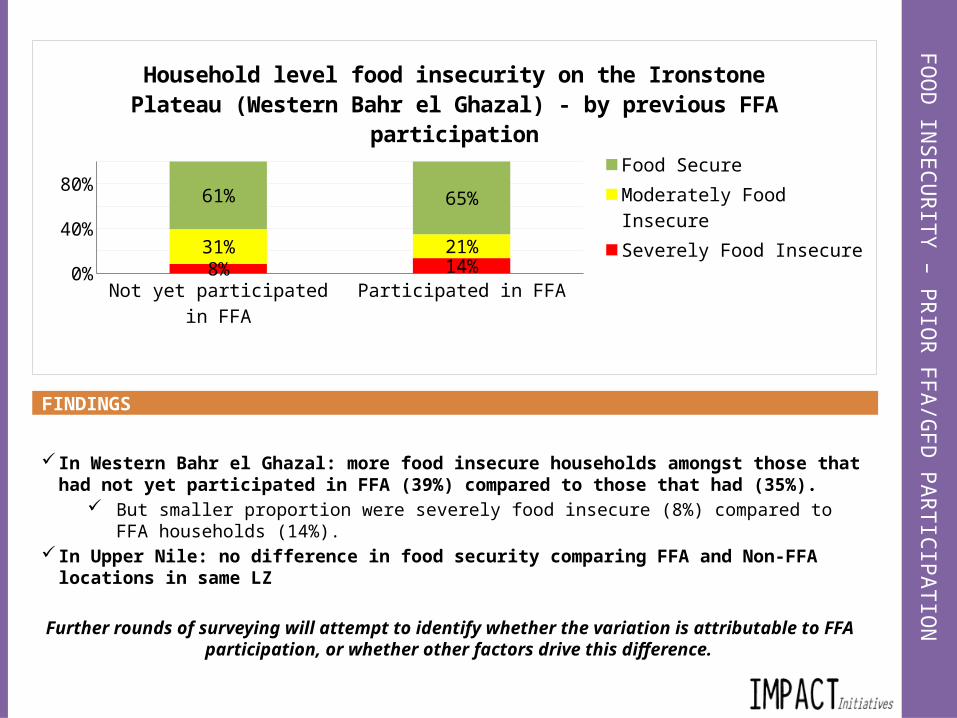
In Western Bahr el Ghazal: more food insecure households amongst those that had not yet participated in FFA (39%) compared to those that had (35%).
But smaller proportion were severely food insecure (8%) compared to FFA households (14%). In Upper Nile: no difference in food security comparing FFA and Non-FFA locations in same LZ
Further rounds of surveying will attempt to identify whether the variation is attributable to FFA participation, or whether other factors drive this difference.
Not yet participated in FFA Participated in FFA0%
10%20%30%40%50%60%70%80%90%
100%
8% 14%
31% 21%
61% 65%
Household level food insecurity on the Ironstone Plateau (Western Bahr el Ghazal) - by previous FFA participation
Food SecureModerately Food InsecureSeverely Food Insecure

DEMOGRAPHICS
DEM
OG
RAPHICS – AG
E AND
HO
USEH
OLD
SIZE
0-4
5-14
15-24
25-49
50+
5,000 4,000 3,000 2,000 1,000 0 1,000 2,000 3,000 4,000 5,000
3,194
4,007
2,897
2,116
665
2,905
3,756
2,816
2,477
1,065
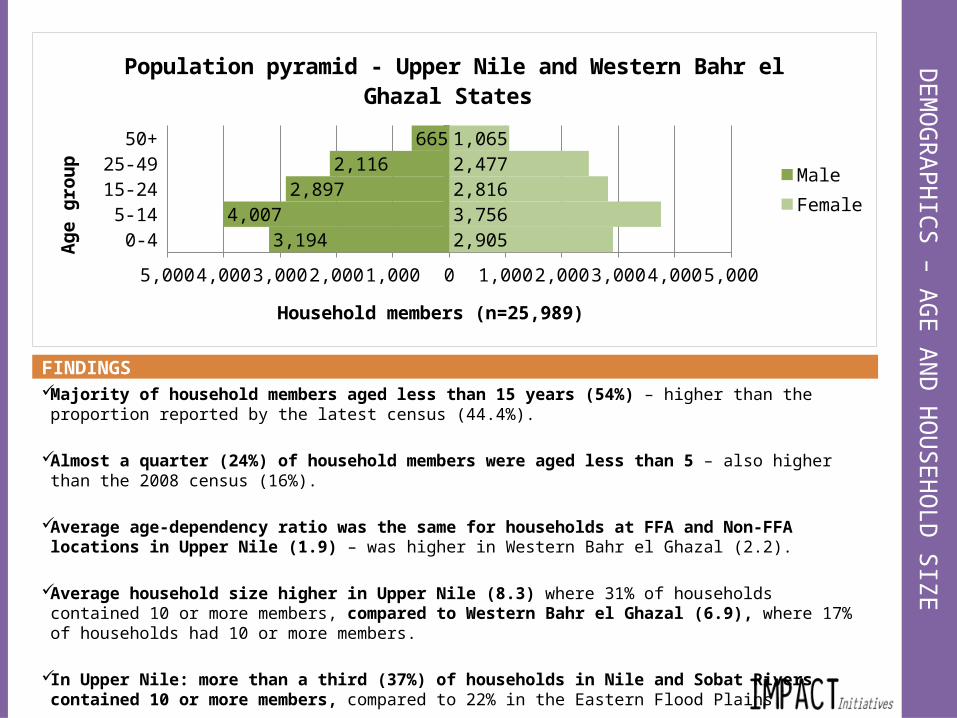
Population pyramid - Upper Nile and Western Bahr el Ghazal States
MaleFemale
Household members (n=25,989)
Age
gro
up
FINDINGS Majority of household members aged less than 15 years (54%) – higher than the proportion reported by the
latest census (44.4%).
Almost a quarter (24%) of household members were aged less than 5 – also higher than the 2008 census (16%).
Average age-dependency ratio was the same for households at FFA and Non-FFA locations in Upper Nile (1.9) – was higher in Western Bahr el Ghazal (2.2).
Average household size higher in Upper Nile (8.3) where 31% of households contained 10 or more members, compared to Western Bahr el Ghazal (6.9), where 17% of households had 10 or more members.
In Upper Nile: more than a third (37%) of households in Nile and Sobat Rivers contained 10 or more members, compared to 22% in the Eastern Flood Plains.

DEM
OG
RAPHICS – FO
OD
INSECU
RITY BY HO
USEH
OLD
SIZE AND
LIVELIH
OO
D ZO
NE
FINDINGS
Larger households were more likely to be food secure, across all livelihood zones.
Hence 66% of households with 10 or members in Eastern Flood Plains; 77% in Nile and Sobat Rivers; and 78% in Ironstone Plateau livelihood zones were found to be food secure.
The corresponding figure amongst households with 1-6 members was just 46% on the Eastern Flood Plains; 57% in Nile and Sobat Rivers; and 56% on the Ironstone Plateau.
10+ 9 7-8 1-6 10+ 9 7-8 1-6 10+ 9 7-8 1-6Eastern Floodplains Nile and Sobat Rivers Ironstone Plateau
Upper Nile Western Flood Plains
0%
10%
20%
30%
40%
50%
60%
70%
80%
90%
100%
3% 2% 5% 4% 3% 2% 4% 5% 3%10% 14% 10%
30%42%
52% 49%
20% 22%29%
38%
19%
22%26% 35%
66%56%
43% 46%
77% 75%66%
57%
78%68%
60% 56%
Household food insecurity by number of household members and livelihood zone
Food SecureModerately Food InsecureSeverely Food Insecure

DEM
OG
RAPHICS – FO
OD
INSECU
RITY BY HO
USEH
OLD
SIZE, WEALTH
G
ROU
P AND
LIVELIHO
OD
ZON
E
FINDINGS
This effect remained when controlling for wealth amongst poorer households – larger households were more likely to be food secure when compared to smaller households in the same Poor or Very Poor wealth group
Up-per Nile Eastern Floodplains M/BO
Up-per Nile Eastern Floodplains
Poor 10+
Up-per Nile Eastern Floodplains
Poor 9
Up-per Nile Eastern Floodplains
Poor 7-8
Up-per Nile Eastern Floodplains
Poor 1-6
Up-per Nile Eastern Floodplains
Very Poor 10+
Up-per Nile Eastern Floodplains
Very Poor
9
Up-per Nile Eastern Floodplains
Very Poor 7-8
Up-per Nile Eastern Floodplains
Very Poor 1-6
Up-per Nile Nile and So-bat
Rivers
M/BO
Up-per Nile Nile and So-bat
Rivers
Poor 10+
Up-per Nile Nile and So-bat
Rivers
Poor 9
Up-per Nile Nile and So-bat
Rivers
Poor 7-8
Up-per Nile Nile and So-bat
Rivers
Poor 1-6
Up-per Nile Nile and So-bat
Rivers
Very Poor 10+
Up-per Nile Nile and So-bat
Rivers
Very Poor
9
Up-per Nile Nile and So-bat
Rivers
Very Poor 7-8
Up-per Nile Nile and So-bat
Rivers
Very Poor 1-6
Western
Bahr el
Ghazal
Iron-ston
e Plateau M/BO
Western
Bahr el
Ghazal
Iron-ston
e Plateau
Poor 10+
Western
Bahr el
Ghazal
Iron-ston
e Plateau
Poor 9
Western
Bahr el
Ghazal
Iron-ston
e Plateau
Poor 7-8
Western
Bahr el
Ghazal
Iron-ston
e Plateau
Poor 1-6
Western
Bahr el
Ghazal
Iron-ston
e Plateau
Very Poor 10+
Western
Bahr el
Ghazal
Iron-ston
e Plateau
Very Poor
9
Western
Bahr el
Ghazal
Iron-ston
e Plateau
Very Poor 7-8
Western
Bahr el
Ghazal
Iron-ston
e Plateau
Very Poor 1-6
Severely Food Insecure
0.0188679245283019
0 0 0 0.0307692307692308
0.0460526315789478
0.0256410256410259
0.0598802395209585
0.0469973890339426
0 0.0819672131147541
0 0.0967741935483873
0.0754716981132075
0.0258302583025831
0.0333333333333333
0.04301075268817
2
0.0505050505050505
0.25316455696202
5
0.0952380952380953
0.24 0.30769230769230
8
0.3 0 0.0270270270270273
0.03791469194312
8
0.0308370044052865
Moderately Food Insecure
0.11320754716981
1
0.0909090909090911
0.16666666666666
7
0.13333333333333
3
0.2 0.38157894736842
6
0.46153846153846
4
0.56886227544910
2
0.56657963446475
7
0.19444444444444
6
0.27868852459016
4
0.27272727272727
3
0.22580645161290
3
0.43396226415094
8
0.19926199261992
6
0.23333333333333
4
0.30107526881720
7
0.41077441077441
3
0.21518987341772
2
0.20634920634920
7
0.28 0.29487179487179
5
0.36153846153846
5
0.184
0.20270270270270
3
0.25592417061611
4
0.34801762114537
5
Food Secure
0.86792452830189
2
0.90909090909090
9
0.83333333333333
4
0.86666666666666
7
0.76923076923076
9
0.57236842105262
7
0.51282051282051
7
0.37125748502994
4
0.38642297650130
8
0.80555555555555
6
0.63934426229509
1
0.72727272727272
7
0.67741935483871
0.49056603773585
3
0.77490774907749
1
0.73333333333333
4
0.65591397849462
4
0.53872053872053
9
0.53164556962025
3
0.69841269841269
8
0.48 0.3974358974359
0.33846153846153
8
0.816
0.77027027027027
6
0.70616113744075
9
0.62114537444934
5
5%
25%
45%
65%
85%
Household level food insecurity - by number of household members and wealth group

DEM
OG
RAPHICS – W
EALTH G
ROU
P BY GEN
DER O
F HO
USEH
OLD
HEAD
AN
D LIVELIH
OO
D ZO
NE
FINDINGSHouseholds identifying themselves as female headed were more likely to be poorer – 77% of female
headed households were Very Poor (77%) compared to 69% of male headed households
This effect remained when controlling for livelihood zone – the most marked difference is on the Ironstone Plateau, where 76% of female headed households were Very Poor, compared to 63% of male headed households.
• Households identifying themselves as female headed were actually more likely to be food secure (62%) compared to male headed households (60%). This trend remained when comparing households within the same livelihood zones.
Female Male Female Male Female MaleEastern Floodplains Nile and Sobat Rivers Ironstone Plateau
Upper Nile Western Bahr el Ghazal
0%10%20%30%40%50%60%70%80%90%
100%
83% 80% 74% 66%76%
63%
13% 13%13%
13%
19%28%
4% 7% 13% 21%4% 9%
Household wealth group - by gender of household head and livelihood zone
Middle/ Better-offPoorVery Poor

DEM
OG
RAPHICS – FO
OD
INSECU
RITY BY RESIDEN
CE STATUS O
F H
OU
SEHO
LD H
EAD AN
D STATE
FINDINGS
Overall, IDP households were most likely to be food insecure (60%), followed by hosts (49%), migrants (35%) and returnees (32%).
This effect remained when comparing households in Western Bahr el Ghazal – while 63% of IDP households were found to be food insecure in Western Bahr el Ghazal, the corresponding proportion amongst Host households was 36%, followed by Migrants (32%) and Returnees (25%).
The effect did not remain when comparing households in Upper Nile.
IDP Host Migrant Returnee IDP Host Migrant ReturneeUpper Nile Western Bahr el Ghazal
0%
10%
20%
30%
40%
50%
60%
70%
80%
90%
100%
8% 4% 0% 1%
44%
8% 2% 3%
30% 36% 50%34%
29%
29%30% 22%
63% 60%50%
65%
27%
63% 68%75%
Household food insecurity rating - by residence status and State
Food SecureModerately Food InsecureSeverely Food Insecure
DEM
OG
RAPHICS – FO
OD
INSECU
RITY BY TRIBAL AFFILIATION
AND
STATE
FINDINGS
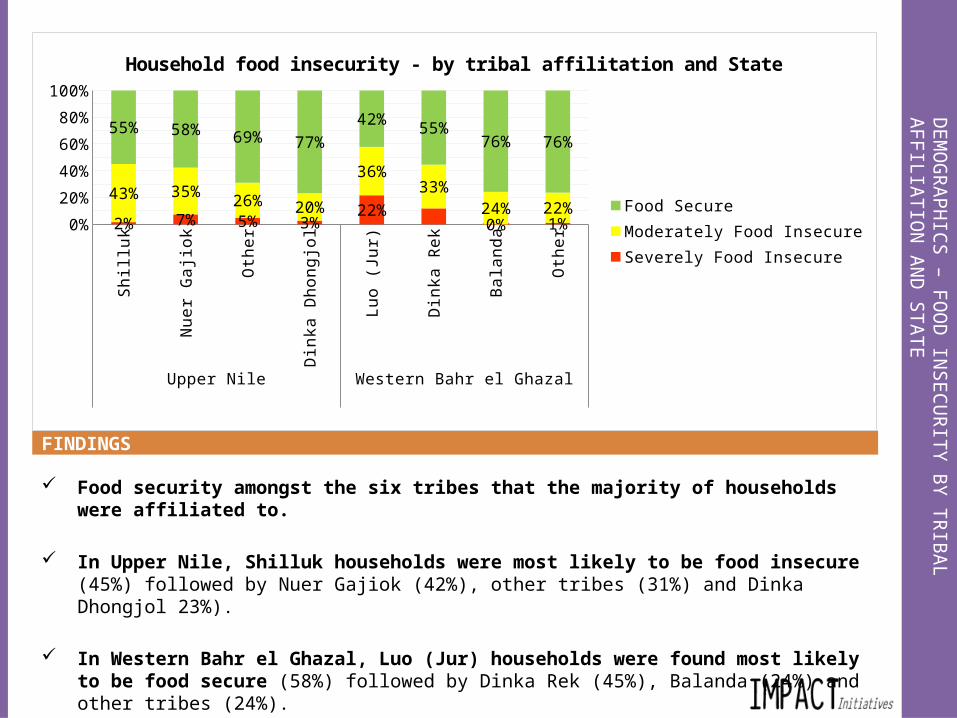
Food security amongst the six tribes that the majority of households were affiliated to.
In Upper Nile, Shilluk households were most likely to be food insecure (45%) followed by Nuer Gajiok (42%), other tribes (31%) and Dinka Dhongjol 23%).
In Western Bahr el Ghazal, Luo (Jur) households were found most likely to be food secure (58%) followed by Dinka Rek (45%), Balanda (24%) and other tribes (24%).
Shilluk Nuer Gajiok Other Dinka Dhongjol
Luo (Jur) Dinka Rek Balanda Other
Upper Nile Western Bahr el Ghazal
0%
10%
20%
30%
40%
50%
60%
70%
80%
90%
100%
2% 7% 5% 3%
22%
0% 1%
43% 35%26%
20%
36%
33%
24% 22%
55% 58%69%
77%
42%55%
76% 76%
Household food insecurity - by tribal affilitation and State
Food SecureModerately Food InsecureSeverely Food Insecure

LINEAR REGRESSION – FOOD INSECURITY
FOO
D IN
SECURITY – LIN
EAR REGRESSIO
NTHE MODEL
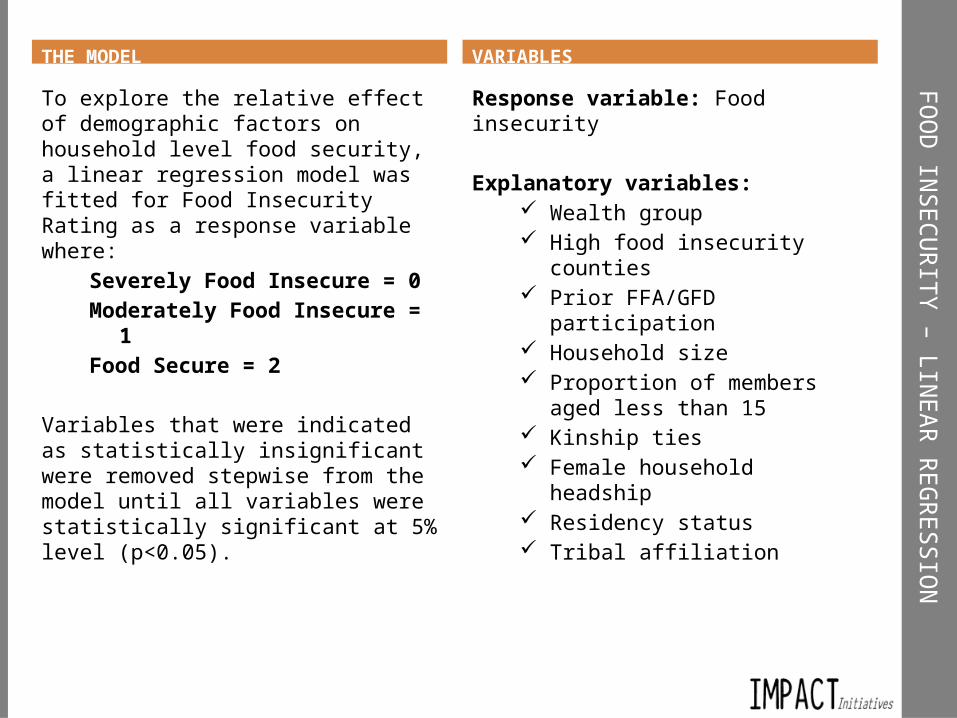
To explore the relative effect of demographic factors on household level food security, a linear regression model was fitted for Food Insecurity Rating as a response variable where:
Severely Food Insecure = 0Moderately Food Insecure = 1Food Secure = 2
Variables that were indicated as statistically insignificant were removed stepwise from the model until all variables were statistically significant at 5% level (p<0.05).
VARIABLES
Response variable: Food insecurity
Explanatory variables: Wealth group High food insecurity counties Prior FFA/GFD participation Household size Proportion of members aged less
than 15 Kinship ties Female household headship Residency status Tribal affiliation
FOO
D IN
SECURITY – LIN
EAR REGRESSIO
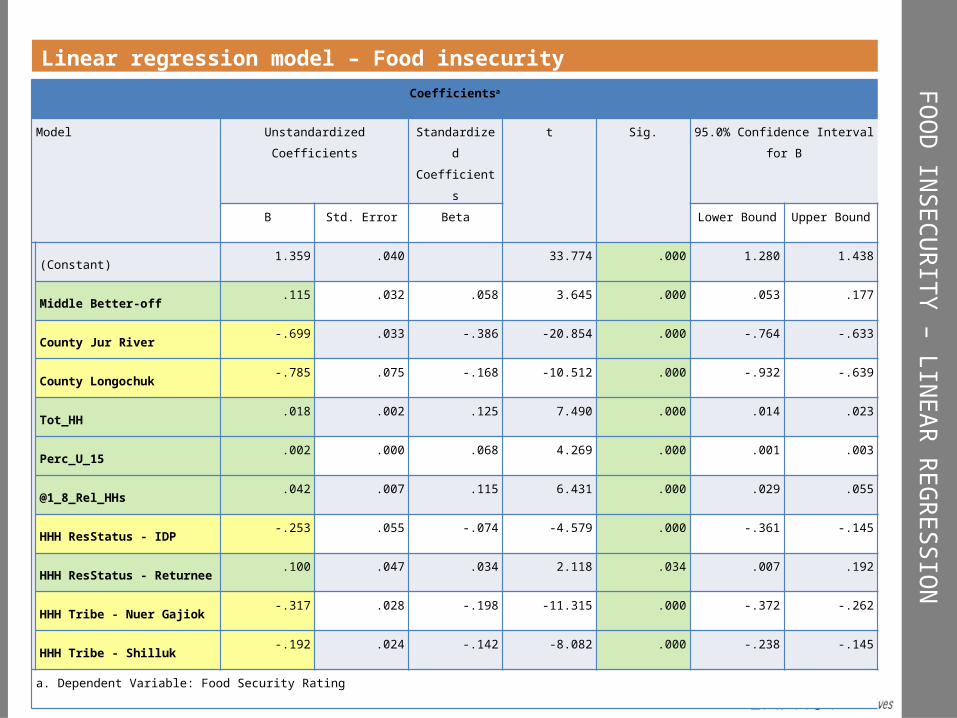
NLinear regression model – Food insecurity
Coefficientsa
Model Unstandardized Coefficients Standardized
Coefficients
t Sig. 95.0% Confidence Interval for B
B Std. Error Beta Lower Bound Upper Bound
1
(Constant)1.359 .040 33.774 .000 1.280 1.438
Middle Better-off.115 .032 .058 3.645 .000 .053 .177
County Jur River-.699 .033 -.386 -20.854 .000 -.764 -.633
County Longochuk-.785 .075 -.168 -10.512 .000 -.932 -.639
Tot_HH.018 .002 .125 7.490 .000 .014 .023
Perc_U_15.002 .000 .068 4.269 .000 .001 .003
@1_8_Rel_HHs.042 .007 .115 6.431 .000 .029 .055
HHH ResStatus - IDP-.253 .055 -.074 -4.579 .000 -.361 -.145
HHH ResStatus - Returnee.100 .047 .034 2.118 .034 .007 .192
HHH Tribe - Nuer Gajiok-.317 .028 -.198 -11.315 .000 -.372 -.262
HHH Tribe - Shilluk-.192 .024 -.142 -8.082 .000 -.238 -.145
a. Dependent Variable: Food Security Rating

FOO
D IN
SECURITY – LIN
EAR REGRESSIO
NLinear regression model - Findings
Belonging to the Middle/better-off wealth group was associated with a 11.5% increase in food security bracket compared to the poorer wealth groups.
Living in Longochuk County was associated with a 78.5% decrease and in Jur River County with a 69.9% decrease in food security bracket, compared to other counties
Each additional household member was associated with a 1.8% increase in food security bracket.
Each additional five households that a household was related to by kinship were associated with a 4.2% increase in food security bracket.
Having an IDP household head was associated with a 25.3% decrease in food security bracket and a returnee household head with a 10% increase, compared to other households.
Nuer Gajiok tribal affiliation was associated with a 31.7% decrease in food security bracket and Shilluk tribal affiliation with a 19.2% decrease compared to other tribes.
oVariation when comparing the Poor and Very Poor wealth groups; FFA, GFD and no participation; female and male headship; migrant and host residency status; Dinka Rek, Dinka Dhongjol, Balanda and Luo and other tribal affiliations, was not statistically significant once controlling for the variables above.

THAN
K YOU
!Thank you!
The full dry season baseline report for Western Bahr el Ghazal and Upper Nile states will be released shortly – here we will explore food insecurity factors in detail, looking at food consumption, food sources, expenditures, income sources, coping strategies and other resilience indicators including health, water and sanitation.
All reports, primary and secondary data and mapping for the BRACE project can be found at: www.southsudan-braceproject.org
For further information and comments please do not hesitate to get in touch: [email protected]


