
Brighter MarylandA Study on Solar in Maryland Schools
Sargent Shriver Elementary School
(Photo Courtesy of Meridian Construction Co.)

1
Acknowledgements
The Solar Foundation® (TSF) is an independent 501(c)(3) nonprofit whose mission is to increase
understanding of solar energy through strategic research and education that transform markets. TSF is
considered by the Congressional Research Office and others as the premier research organization on
the solar labor force, employer trends, and economic impacts of solar. TSF is also one of the nation's
leading providers of solar educational materials and technical assistance support for local government
through its work with the U.S. Department of Energy's SunShot Solar Outreach Partnership. In late
2014, The Solar Foundation released the most comprehensive database of known K-12 solar schools
throughout the United States, identifying over 3,700 K-12 solar schools in the nation.
TSF would like to acknowledge and thank the following organizations and individuals. Without their
contributions, this report would not have been possible.
The Town Creek Foundation for providing the financial support to produce this work.
Our Maryland-based advisory committee for providing valuable time and resources to ensure
the report reaches key individuals and organizations: Stuart Clarke at The Town Creek
Foundation, Lynn Heller at The Abell Foundation, Marta Tomic and Kyle Haas at the
Maryland Energy Administration, Anya Schoolman and Corey Ramsden at Community Power
Network, and Kathy Magruder and Wyatt Shiflett at the Maryland Clean Energy Center.
Finally, the individuals who contributed to the report by sharing their experience: Sean
Gallagher with Montgomery County Public Schools, Joanna Pi-Sunyer and Rajeshri
Bachubhay with Baltimore City Public Schools, Bill Merritt with the Baltimore City
Government, Keith Gascon with North Point High School, Martha Barss with Rowland Park
Country School, Daniel Bresette with the Maryland Energy Administration, Andrew Cassilly
with Harford County Public Schools, and Mary Yates with the Shore Power Project at
Washington College.
For media inquiries about this report, please contact:
Andrea Luecke, President and Executive Director at aluecke [at] solarfound.org / 202-469-3732
For all other questions or comments, please contact:
Mary Liang, Program Associate at mliang [at] solarfound.org / 202-556-2894
Please cite this publication as "The Solar Foundation. (2015). Brighter Maryland: A Study on Solar in
Maryland Schools. Available at “http://mdschools.tsfcensus.org”
© August 2015 The Solar Foundation

2
Table of Contents
Executive Summary ...................................................................................................................... 4
Introduction ................................................................................................................................... 6
Solar Energy 101 ........................................................................................................................... 7
Maryland Solar Policy and Market Context ............................................................................ 10
Maryland Solar Schools: Progress to Date ............................................................................... 12
Eastern Shore ....................................................................................................................... 12
Caroline, Cecil, Dorchester, Kent, Queen Anne's, Somerset, Talbot, Wicomico, Worcester 12
Capital................................................................................................................................... 13
Frederick, Montgomery, Prince George's .............................................................................. 13
Central .................................................................................................................................. 15
Anne Arundel, Baltimore City, Baltimore County, Carroll, Harford, Howard ..................... 15
Southern ............................................................................................................................... 16
Calvert, Charles, St. Mary's ................................................................................................... 16
Western ................................................................................................................................. 16
Allegany, Garrett, Washington .............................................................................................. 16
Why Should Maryland Schools Go Solar? ............................................................................... 19
School & Student Reinvestment ............................................................................................ 19
Educational Opportunities ..................................................................................................... 22
Economic Development ........................................................................................................ 26
Environmental Protection ...................................................................................................... 31
Community Resiliency and Emergency Response ................................................................ 33
Financial Analysis Case Study ................................................................................................... 41
Financing Mechanisms ............................................................................................................... 44
Private Financing Options ...................................................................................................... 44
Third Party Ownership - Power Purchase Agreements (PPA) .............................................. 44
Energy Services Performance Contracts (ESPCs) ................................................................. 45
Public Finance Programs........................................................................................................ 47
MCEC’s Maryland Capital Program (MCAP) ...................................................................... 47
Qualified Energy Conservation Bonds (QECBs) .................................................................. 48
Solar Renewable Energy Certificates (SRECs) ..................................................................... 50
Community Shared Solar....................................................................................................... 52
Conclusion ................................................................................................................................... 53
Appendix ...................................................................................................................................... 54
Solar Schools Financed with Power Purchase Agreements – Press Releases .................... 54

3
Figures & Tables
Figure 1. Photovoltaic Solar Resource of the United States .......................................................... 8
Figure 2. Average Reported System Prices: US and Maryland, 2010-Q1 2015 ............................ 9
Figure 3. Annual Maryland Solar Photovoltaic Capacity Additions, 2010-2016E ..................... 11
Figure 4. Map of Maryland Counties with K-12 Solar Schools .................................................. 12
Table 1. Eastern Shore K-12 Solar Schools ................................................................................. 13
Table 2. Capital Region K-12 Solar Schools ............................................................................... 14
Table 3. Central Region K-12 Solar Schools ............................................................................... 15
Table 4. Southern Region K-12 Solar Schools ............................................................................ 16
Table 5. County per Pupil Spending (2013) ................................................................................. 21
Figure 5. Counties with the Greatest School Reinvestment Opportunities .................................. 22
Table 6. County 4-Year Adjusted Cohort Graduation Rates (2013), and Science Mean ACT
Scores (2014) ................................................................................................................................ 24
Figure 6. Counties with the Greatest Educational Opportunities ................................................. 25
Table 7. County Median Household Income (2011-2013) and Unemployment Rates
(April 2014) .................................................................................................................................. 28
Figure 7. Counties with the Greatest Economic Development Opportunities ............................. 29
Figure 8. Overlay of Selected Demographic Indicators in Maryland Counties ........................... 30
Table 8. Additional Cost-Effective Solar School Opportunities per Maryland Public School
District – Energy and Environmental Value ................................................................................. 36
Figure 9. Nine Public School Districts with the Greatest Cost Savings Potential with Solar
School Installations ....................................................................................................................... 37
Table 9. Additional Cost-Effective Solar School Opportunities per Maryland Public School
District – Economic Value ............................................................................................................ 38
Figure 10. Six Public School Districts with the Greatest Economic Impacts Potential with
Solar School Installations ............................................................................................................. 39
Figure 11. Public School Districts with Greatest Cost Savings and Economic Impacts
Potential for Solar School Installations......................................................................................... 40
Table 10. MD Public School Districts with the MD Public School Districts with the Greatest
Value in Energy Savings and Local Economic Development ...................................................... 40
Table 11. Potential Leading Benefits of Solar Schools ................................................................ 41
Table 12. Bowie High School Solar Project Modeling Assumptions .......................................... 43
Table 13. Installed Cost Sensitivity Analysis for Bowie High School Solar Project .................. 43
Table 14. Remaining Maryland QECB Sub-Allocations ............................................................. 49

4
Executive Summary
While over 3,700 K-12 schools nationwide have realized the multiple benefits of installing solar,
the potential for still more schools to go solar is massive. In a seminal report entitled Brighter
Future: A Study on Solar in U.S. Schools, The Solar Foundation identified 3,727 public and
private K-12 schools across the U.S. with installed solar photovoltaic (PV) systems. An original
analysis produced for the report found that up to 72,000 additional K-12 schools could cost-
effectively adopt solar energy today.
The research effort underpinning the Brighter Future report found 36 Maryland K-12 schools
with solar PV systems currently installed. Combined, these systems represent 8.35 megawatts
(MW) of solar capacity and generate an estimated 9.5 million kWh each year at an annual energy
value of nearly $1.02 million, or about $28,000 per school per year. Examination of the total
national potential for solar PV on K-12 schools revealed that up to 1,867 more Maryland schools
could cost-effectively deploy solar energy systems,1 generating more than 165,000 megawatt-
hours (MWh) per year and over $18 million in annual energy value – approximately equal to 421
starting teacher salaries or 36,000 tablet computers each year.
Recognizing this potential, The Solar Foundation sought to more fully explore the breath of
potential for additional Maryland schools to “go solar”, and to help school district administrators,
teachers, and other public officials better understand which schools and districts stand to benefit
the most from investments in solar energy. These benefits include:
School and Student Reinvestment. When schools and districts save money with solar, funds that
would otherwise have been used to cover utility costs can be reinvested in infrastructure and
other educational support services. This may be significant for the fifteen MD school districts
that fall below the state average for per-pupil student spending.
Educational Opportunities. Solar energy systems installed on a school and included in lesson
plans as an interactive, hands-on teaching tool can help improve student learning and
performance. Six school districts - Baltimore City, Caroline, Dorchester, Prince George’s,
Somerset, and Wicomico – have graduation rates below the state average, and thirteen school
districts have mean ACT science scores below the state average. These school districts may see
solar as a means for improving student performance.
Economic Development. One of the most compelling reasons to invest in solar is the economic
growth and job creation opportunity linked to solar. Maryland solar installers earn on average
$22.67 per hour, or approximately $47,150 annually.2 Four Maryland counties – Allegany,
Dorchester, Garrett, and Somerset – along with Baltimore City have median incomes below this
1 All 1,867 K-12 schools have some untapped solar potential and can cost-effectively install solar energy systems.
This figure includes 29 solar schools that have not yet reached their maximum solar potential. 2 The Solar Foundation. (2015). Maryland Solar Jobs Census 2014. Available at: www.thesolarfoundation.org

5
figure and unemployment rates higher than the state average. Targeting schools in these districts
for solar development may help alleviate the economic strain felt in these areas.
Environmental Protection. A single 110 kilowatt (kW) solar PV installation (the median system
size of the existing K-12 solar energy systems in the state) will produce nearly 150,000 kilowatt-
hours (kWh) of electricity in its first year of operation.3 This production will offset
approximately 103 metric tons of carbon dioxide equivalent (CO2e) emissions.4 Furthermore,
electricity derived from solar can also help reduce emissions of criteria air pollutants, such as
nitrogen oxides (NOx) and sulfur dioxide (SO2), as well as help conserve natural resources.
Community Resiliency and Emergency Response. Solar schools also have the ability to act as
centralized emergency centers during natural disasters and help build community resiliency.
Maryland, like many states on the east coast, is susceptible to natural disasters such as flooding,
hurricanes, tornados, and severe winter storms. Given energy storage capabilities, installing solar
energy systems at many of the state’s 50 emergency shelters can be one way to prepare for and
recover from natural disasters.
Looking more closely at the untapped potential for public solar schools in Maryland, Brighter
Future identified 1,232 schools that can cost-effectively deploy solar,5 with a potential capacity
of over 123,000 kW across 21 school districts. If these schools fully tapped their solar potential,
the state would create over 1,440 one-time construction jobs, resulting in approximately $81
million in construction earnings and $189 million in total economic output.6
Furthermore, nine Maryland public school districts were identified as having the potential to
each save $1 million or more over 30 years if schools in the district deployed solar to its full PV
capacity potential. These nine districts largely correspond to the most populous school districts in
the state, collectively representing approximately 645,000 students, or about 77 percent of K-12
school students in Maryland.7 Together, these nine districts could net the state approximately $33
million in financial benefits over 30 years.
3 According to the NREL PVWatts Calculator, available at http://pvwatts.nrel.gov/pvwatts.php. Assumes 110kW
system installed in Baltimore area with tilt of 30 degrees. All other inputs are PVWatts defaults. 4 According to the Environmental Protection Agency’s “Greenhouse Gas Equivalencies Calculator”, available at:
www.epa.gov/cleanenergy/energy-resources/calculator.html 5 1,232 public schools have some untapped solar potential and can cost-effectively install solar energy systems,
including the 24 schools that currently have solar systems. 6 According to the National Renewable Energy Laboratory's (NREL) Jobs and Economic Development Impact
Models (JEDI). Available at: http://www.nrel.gov/analysis/jedi/ 7 Maryland State Department of Education. (2015). Fall Enrollment - Maryland Public Schools: September 30, 2013.
The Fact Book 2013-2014. Available at:
www.marylandpublicschools.org/msde/divisions/bus_svcs/docs/Fact_Book_2013-2014.pdf

6
Introduction
In September 2014, The Solar Foundation released a report entitled Brighter Future: A Study on
Solar in U.S. Schools. This seminal report found that 3,727 public and private K-12 schools in
the nation have solar photovoltaic (PV) systems, with a combined capacity of 490 megawatts
(MW) and generating approximately 642,000 megawatt-hours (MWh) of electricity each year.
Across all solar schools, this combined solar energy production represents $77.8 million per year
in utility bills, or an average of about $21,000 per school each year.
While thousands of schools have realized the many benefits of installing solar, the potential for
still more schools to go solar is vast. Many schools are excellent candidates for rooftop solar PV
due to their large and flat roofs and may also be suitable for solar PV canopies on large parking
areas. Brighter Future found that up to 72,000 more K-12 schools in the U.S. can cost-
effectively adopt solar energy.8 If fully tapped, this potential would result in 5,400 MW of total
solar capacity on K-12 schools – a figure representing nearly one-third of the nation's current
total solar PV capacity.9
The research effort underpinning the Brighter Future report found 36 Maryland K-12 schools
with solar PV systems currently installed. Combined, these systems represent 8.35 MW of
installed solar capacity, and generate an estimated 9.5 million kWh each year at an annual energy
value of nearly $1.02 million, or about $28,000 per school each year. Examination of the total
national potential for solar PV on K-12 schools revealed that up to 1,867 10 more Maryland
schools could cost-effectively deploy solar energy systems, generating more than 165,000 MWh
per year and over $18 million in energy value each year. Additionally, nine public school
districts were identified as having the potential to each save up to $1 million dollars or more over
the course of 30 years, during which the system is completely paid off, if schools in each district
deployed solar to its full PV capacity potential. These nine districts largely correspond to the
most populous school districts in the state, collectively representing approximately 645,000
students, or about 77 percent of K-12 school students in Maryland.11 Together, these nine
districts could net the state approximately $33 million in financial benefits over 30 years.12
8 The Solar Foundation. (2014). Brighter Future: A Study on Solar in U.S. Schools. Available at:
www.thesolarfoundation.org/solar-schools/ 9 SEIA/GTM Research. (2015). U.S. Solar Market Insight: 2014 Year in Review. Available at:
www.seia.org/research-resources/us-solar-market-insight 10 All 1,867 schools have some untapped solar potential and can cost-effectively install solar energy systems. This
figure includes 29 solar schools that have not yet reached their maximum solar potential. 11 Maryland State Department of Education. (2015). Fall Enrollment - Maryland Public Schools: September 30,
2013. The Fact Book 2013-2014. Available at:
www.marylandpublicschools.org/msde/divisions/bus_svcs/docs/Fact_Book_2013-2014.pdf 12 Estimates were simulated using the PV Watts model from the National Renewable Energy Laboratory's (NREL)
System Advisor Model. The model assumes a $2.00 per watt solar system cost, a typical 20-year financing option,
and operations and maintenance costs of $15/kW/year over a 30 year analyses period. For more information on
modeling assumptions, please refer to page 25 of the Brighter Future report.

7
Solar provides a number of benefits beyond energy value. Solar arrays installed on school
rooftops or grounds can provide teachers with unique opportunities to incorporate renewable
energy concepts into lesson plans using real-world and hands-on examples. The increased use of
solar could provide school districts across the state with an opportunity to help raise student
achievement test scores and promote literacy in science, technology, engineering, and
mathematics (STEM) fields. Highly-visible solar energy systems may also pique interest in the
technology among younger students, introducing STEM concepts earlier in their education.
Furthermore, deployment of more solar on schools may also open up opportunities for solar jobs
in the community or across the state, which may be of particular benefit to areas with high
unemployment rates and low median household incomes.
Finally, the increased use of solar on schools can help move the state closer to its energy goals,
specifically the state’s Renewable Portfolio Standard (RPS) solar carve-out goal of producing
two percent of the electricity sold by utilities in 2020 and each year thereafter from solar
technologies. Attached to the increased use of solar on Maryland schools are significant
environmental benefits – including a reduction in carbon dioxide emissions of up to 114,000
metric tons of CO2 equivalent (CO2e) per year – roughly equivalent to the annual greenhouse gas
emissions from 24,000 passenger vehicles.13
Considering the significant untapped potential of Maryland solar schools, this report was
produced to: (1) analyze the state’s use of solar on schools and its untapped solar potential; (2)
demonstrate to the state’s schools and school districts the various opportunities for achieving
community goals through investments in solar; (3) provide actionable information on specific
financing mechanisms schools and school districts can use to get started on their own solar
school projects, and; (4) help the state of Maryland understand the importance of deploying more
solar energy systems on K-12 schools.
Solar Energy 101
Solar energy can come from a number of different technologies, including solar photovoltaics
(PV), solar heating and cooling, or concentrated solar power (CSP). Solar PV, the most common
technology, uses cells made from semiconductor material to collect the sun's photons and
convert them into useable electricity for the consumer. Over 99 percent of solar school projects
in the nation are solar PV systems.14 Solar thermal technologies, including solar hot water and
solar heating and cooling, harness the sun's heat energy to help meet residential, commercial, or
industrial heating and cooling needs. CSP facilities – typically found in the desert Southwest –
use large mirrors to focus light onto a single point to create steam to drive a turbine to produce
electricity.
13 According to the Environmental Protection Agency’s “Greenhouse Gas Equivalencies Calculator”, available at:
www.epa.gov/cleanenergy/energy-resources/calculator.html 14 The Solar Foundation. (2014). Brighter Future: A Study on Solar in U.S. Schools. Available at:
www.thesolarfoundation.org/solar-schools/

8
The size, or capacity, of a solar energy system is measured in terms of power, with watts (W),
kilowatts (kW; one thousand watts), and even megawatts (MW; one thousand kilowatts), as
common metrics. The amount of energy these systems can produce is a measurement of power
generated over a period of time, and measured in watt-hours (Wh), kilowatt-hours (kWh), and
megawatt-hours (MWh).
Solar PV is a modular technology, and thus can be sized to fit the specific needs of the consumer.
A residential solar system project can range from one to ten kW, with an average size of five
kW. Office buildings and schools with greater energy needs can have projects several hundred
kW in size. Large factory buildings and utilities may have projects with an even greater capacity,
falling in the MW range.
One common misconception regarding solar energy is that the technology is not feasible in all
communities and regions in the United States. Though the desert Southwest receives the most
solar radiation in the U.S., all contiguous 48 states have a sufficient solar resource for producing
electricity. As shown in Figure 1 below, most of Maryland receives about 4.5 to 5.0 kWh of
solar radiation per square meter of land area every day, which is approximately 70 percent of that
received in the desert southwest, which has the greatest solar resource in the nation.15
Figure 1. Photovoltaic Solar Resource of the United States
15 Robert, B. J. (2012). Photovoltaic Solar Resource of the United States. National Renewable Energy Laboratory.
Available at: www.nrel.gov/gis/images/eere_pv/national_photovoltaic_2012-01.jpg

9
One of the most oft-cited benefits of solar energy is the financial benefits these systems can
deliver. After a solar energy system is installed, the electricity or other energy it produces comes
at essentially no cost, as the fuel source behind the technology is free and practically limitless.
As installed costs continue to decline (Figure 2),16 many residential and commercial users are
looking at solar technologies as a way to reduce high and volatile utility costs associated with
fossil fuels. For example, there are currently nearly 650,000 residential solar PV systems
installed throughout the U.S., representing 93 percent of the total number of solar energy systems
installed to date.17 Corporate use of solar is also on the rise. By the end of 2014, the top 25
corporate users of solar – including companies such as Walmart, Kohl’s, Costco, Apple, and
IKEA – had installed nearly 490 MW of solar.18 If these companies collectively represented a
U.S. state, it would be the seventh-largest solar market in the nation, ahead of strong solar states
such as Hawaii, Colorado, New York, and Texas.19
Figure 2. Average Reported System Prices: US and Maryland, 2010-Q1 2015
Source: SEIA/GMT Research U.S. Solar Market Insight report series
16 SEIA/GTM Research. (2015). U.S. Solar Market Insight: Q1 2015. Available at: www.seia.org/research-
resources/us-solar-market-insight 17 Ibid. 18 SEIA. (2014). Solar Means Business: Top U.S. Commercial Solar Users. Available at: www.seia.org/research-
resources/solar-means-business-2014-top-us-commercial-solar-users 19 SEIA. (2015). 2014 Top 10 Solar States. Available at: http://www.seia.org/research-resources/2014-top-10-solar-
states
$-
$1.00
$2.00
$3.00
$4.00
$5.00
$6.00
$7.00
2010 2011 2012 2013 2014 2015 (Q1)
Ave
rage
Re
po
rte
d S
yste
m P
rice
s ($
/Wd
c)
Year
Residential (US) Non-Residential (US)
Non-Residential (MD) Utility (US)

10
The environmental benefits of solar must also not go unnoticed. In Maryland, a single 110 kW
solar PV installation (the median system size of the existing K-12 solar energy systems in the
state) will produce nearly 150,000 kWh of electricity in its first year of operation.20 This
production will offset approximately 103 metric tons of CO2e emissions, roughly equal to taking
nearly 22 passenger vehicles off the road for an entire year or the amount of carbon sequestered
annually by almost 85 acres of U.S. forests.21 Electricity derived from solar can also help reduce
emissions of criteria air pollutants, such as nitrogen oxides (NOx) and sulfur dioxide (SO2), and
help conserve natural resources such as land and water.
Maryland Solar Policy and Market Context
Since 2007, Maryland has established a number of environmental and energy objectives to
decrease the use of conventional energy resources and reduce greenhouse gas emissions. The
EmPOWER Maryland Energy Efficiency Act of 2008 set targets to reduce per capita electricity
consumption by 15 percent by the end of 2015, based on 2007 levels.22 In addition, the
Greenhouse Gas Emissions Reduction Act of 2009 requires the state to reduce greenhouse gas
emission by 25 percent compared with 2006 levels by 2020.23 In support of this goal, Maryland
has joined the Northeast Regional Greenhouse Gas Initiative (RGGI), a multi-state market-based
regulatory program focused on reducing greenhouse gas emissions from conventional fossil fuel
electricity generation.24 Finally, the state renewable portfolio standard (RPS) requires that 20
percent of the state’s electricity be generated from renewable energy by the year 2022, including
a two percent solar ‘carve-out’ by 2020.25 To facilitate attainment of some of these energy
policies, Maryland has a robust net metering law, requiring that all utilities credit residents,
businesses, schools, and government entities for electricity generated by a wide variety of
renewable technologies and exported onto the electric grid.26
This collection of energy goals emphasizes the state’s awareness and aspirations to increase the
use of clean energy technologies, but they can nonetheless fall short of their annual benchmarks.
In 2013, Maryland's RPS targets were set at 10.7 percent for all renewable energy generation,
with at least 0.25 percent derived from solar energy.27 Only 8.2 percent of Maryland’s energy
20 According to the NREL PVWatts Calculator, available at http://pvwatts.nrel.gov/pvwatts.php. Assumes 110kW
system installed in Baltimore area with tilt of 30 degrees. All other inputs are PVWatts defaults. 21 According to the Environmental Protection Agency’s “Greenhouse Gas Equivalencies Calculator”, available at:
www.epa.gov/cleanenergy/energy-resources/calculator.html 22 Maryland Energy Administration. (2015). EmPOWER Maryland Planning. Available at:
energy.maryland.gov/empower3/ 23 Maryland Department of Environment. (2015). Facts about the Greenhouse Gas Reduction Act of 2009. Available
at: www.mde.state.md.us/assets/document/Air/ClimateChange/GGRA_factsheet.pdf 24 Maryland Department of Environment. (2015). Regional Greenhouse Gas Initiative. Available at:
www.mde.state.md.us/programs/Air/RGGI/Pages/Air/RGGI.aspx 25 North Carolina Clean Energy Technology Center. (2015). Maryland Renewable Energy Portfolio Standard.
Available at: http://programs.dsireusa.org/system/program/detail/1085 26 North Carolina Clean Energy Technology Center. (2015). Maryland Net Metering. Available at:
http://programs.dsireusa.org/system/program/detail/363 27 Maryland House Bill 226. (2013). Available at:
http://mgaleg.maryland.gov/2013RS/chapters_noln/Ch_3_hb0226E.pdf

11
generation came from renewable sources that year and approximately 0.52 percent of that
electricity generation came from solar energy.28 The state can benefit from investing in more of
clean energy projects to meet the general renewable energy targets in coming years, a goal in
which the deployment of solar on K-12 schools can help attain.
However, as evidenced by its progress with interim solar carve-out goals, Maryland has already
experienced great success with solar. Annual solar capacity additions in Maryland have grown
from around 7 MW in 2010 to 73 MW in 2014 (Figure 3), with another 27 MW added in just the
first three months of 2015.29 This brings the cumulative solar capacity from 2010-Q12015 to 242
MW, making Maryland 13th in the nation in terms of the total amount of solar installed to date.30
Figure 3. Annual Maryland Solar Photovoltaic Capacity Additions, 2010-2016E
Source: SEIA/GTM Research. (2015). Solar Market Insight: 2014 Year in Review.
28 In 2013, Maryland generated 185,731 MWh in solar energy, and 35,717,500 MWh in electricity generation from
all sources. Based on data from https://data.maryland.gov/Energy-and-Environment/Renewable-Energy-Generated-
In-Maryland/79zg-5xwz? 29 SEIA/GTM Research. (2015). U.S. Solar Market Insight: Q1 2015. Available at: www.seia.org/research-
resources/us-solar-market-insight 30 SEIA. (2015). Maryland Solar. Available at: www.seia.org/state-solar-policy/maryland
0.0
20.0
40.0
60.0
80.0
100.0
120.0
140.0
160.0
2010 2011 2012 2013 2014 2015E 2016E
Meg
awat
ts (
MW
dc)
Residential (PV) Non-residential (PV) Utility (PV)

12
Maryland Solar Schools: Progress to Date
Although they represent only a small portion of the state’s total solar capacity (3.5 percent), solar
schools have undeniably contributed to the state’s solar success. As of September 2014,
Maryland has 36 solar K-12 schools across 13 counties and Baltimore City, with a total solar
capacity of 8.35 MW. While these figures put the state at only 20th in terms of the number of
solar installations on K-12 schools, the state is ranked ninth in total solar capacity on schools
– with its 8.35 MW generating 9.5 million kWh each year, equivalent to over $1 million in
annual utility costs and offsetting over 6,550 metric tons of CO2e emissions each year.
Figure 4. Map of Maryland Counties with K-12 Solar Schools
Progress with solar on schools varies from school to school and district to district. In an effort to
describe solar schools with similar demographics, districts were grouped into five regions for
discussion in the following sections.
Eastern Shore
Caroline, Cecil, Dorchester, Kent, Queen Anne's, Somerset, Talbot, Wicomico, Worcester
The Eastern Shore consists of nine counties predominately lying on the east side of the
Chesapeake Bay, with just under eight percent of Marylanders living in the region.31 There are a
total of seven solar public schools (and no private schools) in the Eastern Shore: two elementary
schools, three middle schools, and two high schools, accounting for more than 4,000 kW of
installed PV capacity and saving over 4,615,000 kWh in utility-supplied energy valued at over
half a million dollars each year (Table 1). Caroline County holds the largest single PV rooftop
31 U.S. Census Bureau. (2015). Maryland State & County QuickFacts: 2014 Population Estimate. Available at:
http://quickfacts.census.gov/qfd/states/24000.html

13
system in Maryland with a 919 kW system on North Caroline High School, producing electricity
worth over $125,000 per year.32 The Caroline County school district also has the most installed
capacity of all Maryland counties, with its three solar schools representing a total PV capacity of
2,030 kW. Dorchester County holds the second largest single PV system in Maryland with an
803 kW system on Mace's Lance Middle School, saving over $107,000 every year.
Table 1. Eastern Shore K-12 Solar Schools
County Name Of
School
System
Size
(kW)
Annual
Energy
Production
(kWh)
Annual CO2e
Emissions
Reductions
(Metric Tons)
Annual
Energy
Value ($)
Caroline North Caroline
High
919 1,045,822 721 $125,499
Colonel
Richardson
Middle & High
796 908,968 627 $90,897
Greensboro
Elementary
315 358,470 247 $35,847
Dorchester Mace's Lane
Middle
803 893,675 616 $107,241
Kent Kent County
High*
1,200 1,370,712 945 $164,485
Worton
Elementary*
see note see note see note see note
Queen
Anne's
Sudlersville
Middle School
33 37,952 26 $3,795
TOTAL 4,066 4,615,599 3,183 $527,764
*Kent County High School and Worton Elementary are two of five recipients of the 1,200 kW
Worton Solar Field in Kent County
Capital
Frederick, Montgomery, Prince George's
The Capital region of Maryland consists of three counties located on the outskirts of
Washington, D.C. and is home to over two million people (36 percent of the state’s
population).33 Collectively, there are about 306,500 K-12 public school students in these
counties, which is approximately 37 percent of the state's public school student population,34
with Montgomery and Prince George's County together accounting for over 267,000 students.
The Capital region has fourteen K-12 solar schools, with an installed capacity of 1,944 kW
32 1,200 kW of solar capacity at the Worton Solar Field is distributed over 5 sites in Kent County. 33 U.S. Census Bureau. (2015). Maryland State & County QuickFacts: 2014 Population Estimate. Available at:
http://quickfacts.census.gov/qfd/states/24000.html 34 Maryland State Department of Education. (2015). Fall Enrollment - Maryland Public Schools: September 30,
2013. The Fact Book 2013-2014. Available at:
www.marylandpublicschools.org/msde/divisions/bus_svcs/docs/Fact_Book_2013-2014.pdf

14
producing over $230,000 worth of electricity every year (Table 2). Out of those 14 solar schools,
ten are public schools with a solar capacity of 1,693 kW (87 percent of the region's capacity) and
producing nearly $203,000 worth of electricity each year.
Montgomery County has greatest number of solar schools in the state – nine in total – with two
elementary schools, three middle schools, three high schools, and one private day school for
grades 2-12, representing a combined capacity of 1,255 kW and producing $155,000 worth of
electricity each year.
Table 2. Capital Region K-12 Solar Schools
County Name Of
School
System
Size
(kW)
Annual
Energy
Production
(kWh)
Annual CO2e
Emissions
Reductions
(Metric Tons)
Annual
Energy
Value ($)
Frederick Mother Seton
Elementary
1 1,337 1 $120
Lucy School 12 13,600 9 $1,088
Oakdale High 499 565,547 390 $50,899
Montgomery The Bullis
School
111 125,463 87 $10,037
College
Gardens
Elementary
76 86,135 59 $10,336
Lakelands Park
Middle
110 124,670 86 $14,960
Quince Orchard
High
238 269,740 186 $32,369
Richard
Montgomery
High
108 120,195 83 $14,423
Francis Scott
Key Middle
92 102,389 71 $12,287
Sargent Shriver
Elementary
92 102,389 71 $12,287
Parkland
Middle
151 168,051 116 $20,166
Clarksburg
High
277 313,941 216 $28,255
Prince
George's
Dematha
Catholic High
127 141,341 97 $16,961
University Park
Elementary
50 55,646 38 $6,678
TOTAL 1,944 2,190,444 1,510 $230,866
15
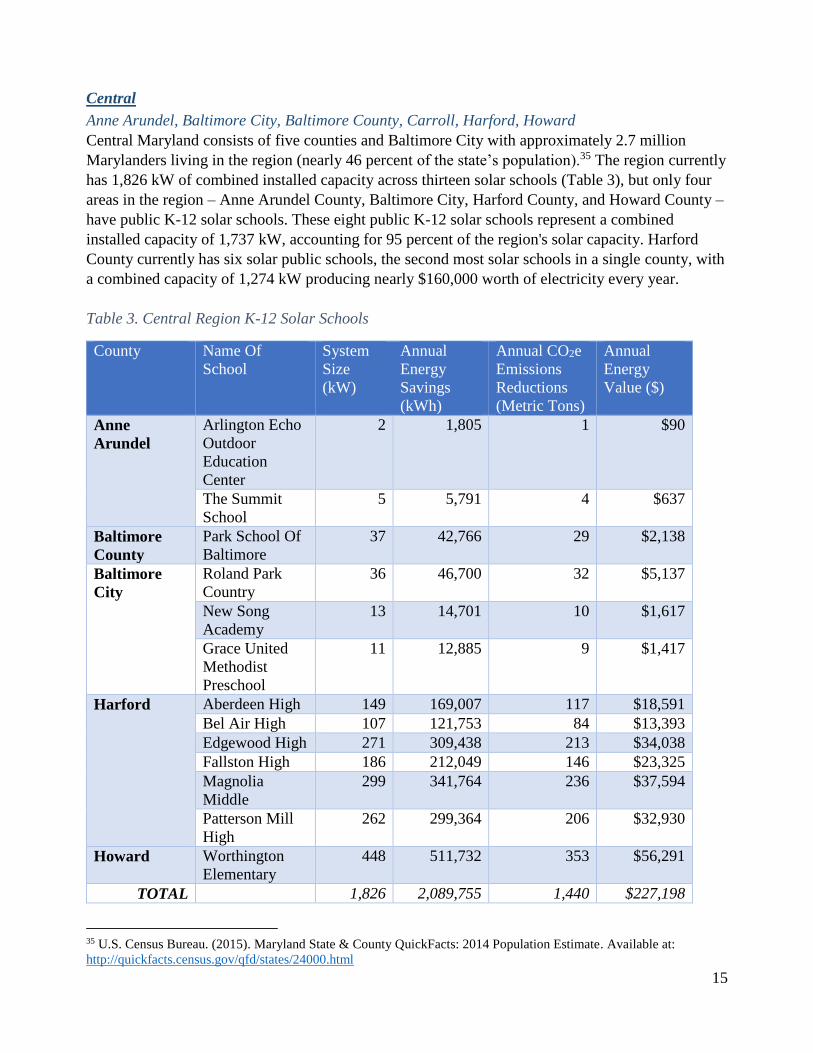
Central
Anne Arundel, Baltimore City, Baltimore County, Carroll, Harford, Howard
Central Maryland consists of five counties and Baltimore City with approximately 2.7 million
Marylanders living in the region (nearly 46 percent of the state’s population).35 The region currently
has 1,826 kW of combined installed capacity across thirteen solar schools (Table 3), but only four
areas in the region – Anne Arundel County, Baltimore City, Harford County, and Howard County –
have public K-12 solar schools. These eight public K-12 solar schools represent a combined
installed capacity of 1,737 kW, accounting for 95 percent of the region's solar capacity. Harford
County currently has six solar public schools, the second most solar schools in a single county, with
a combined capacity of 1,274 kW producing nearly $160,000 worth of electricity every year.
Table 3. Central Region K-12 Solar Schools
County Name Of
School
System
Size
(kW)
Annual
Energy
Savings
(kWh)
Annual CO2e
Emissions
Reductions
(Metric Tons)
Annual
Energy
Value ($)
Anne
Arundel
Arlington Echo
Outdoor
Education
Center
2 1,805 1 $90
The Summit
School
5 5,791 4 $637
Baltimore
County
Park School Of
Baltimore
37 42,766 29 $2,138
Baltimore
City
Roland Park
Country
36 46,700 32 $5,137
New Song
Academy
13 14,701 10 $1,617
Grace United
Methodist
Preschool
11 12,885 9 $1,417
Harford Aberdeen High 149 169,007 117 $18,591
Bel Air High 107 121,753 84 $13,393
Edgewood High 271 309,438 213 $34,038
Fallston High 186 212,049 146 $23,325
Magnolia
Middle
299 341,764 236 $37,594
Patterson Mill
High
262 299,364 206 $32,930
Howard Worthington
Elementary
448 511,732 353 $56,291
TOTAL 1,826 2,089,755 1,440 $227,198
35 U.S. Census Bureau. (2015). Maryland State & County QuickFacts: 2014 Population Estimate. Available at:
http://quickfacts.census.gov/qfd/states/24000.html

16
Southern
Calvert, Charles, St. Mary's
The Southern region of Maryland consists of three counties representing approximately six
percent of the state's population.36 Charles County and St. Mary's County each have one public
solar school with a combined capacity of 513 kW producing nearly $30,000 worth of electricity
each year (Table 4).
Table 4. Southern Region K-12 Solar Schools
County Name Of
School
System
Size
(kW)
Annual
Energy
Savings
(kWh)
Annual CO2e
Emissions
Reductions
(Metric Tons)
Annual
Energy
Value ($)
Charles North Point
High
3 2,894 2 $289
St. Mary's George
Washington
Carver
Elementary
510 591,841 408 $29,592
TOTAL 513 594,735 410 $29,881
Western
Allegany, Garrett, Washington
The Western region of Maryland consists of three counties with nearly four percent of the state's
population living in the area.37 As of September of 2014, no solar schools were identified in this
region.
With 36 schools in Maryland already equipped with solar energy systems, schools and school
districts across the state are working to bring solar to still more schools. In April 2015, Cecil
County Public Schools installed the first school solar energy system in the county, completing a
2.5 MW system with funding through Maryland’s Aggregated Net Metering Program, and
signing a power purchase agreement (PPA) with SunEdison.38
In addition, Montgomery County is currently in the process of installing more solar on their
public K-12 schools, marking it the second time the county has retrofitted schools with solar.
Between 2008 and 2009, realizing the school district could save money through solar
installations, the county signed a PPA with SunEdison to purchase electricity from solar systems
36 U.S. Census Bureau. (2015). Maryland State & County QuickFacts: 2014 Population Estimate. Available at:
http://quickfacts.census.gov/qfd/states/24000.html 37 Ibid. 38 Standard Solar. (2015). SunEdison Completes 2.5 Megawatt System For Cecil County School Of Technology
[Press Release]. Retrieved from: http://standardsolar.com/node/292

17
installed on eight public schools in the county. In 2014, with rapidly falling solar costs and a
newly established environmental sustainability management plan,39 the county once again saw a
"window of opportunity" for more solar schools, currently going through the request for proposal
(RFP) process and proposing fourteen additional projects.40
CASE STUDY: Montgomery County Public Schools
Montgomery County Public Schools (MCPS) is a school district that is composed of
147,500 students enrolled in over 200 schools. Within MCPS, one of the Department of
Facilities’ goals is to provide meaningful education for its students and create a healthy
learning environment for students in the most cost-effective manner possible.41 Before
2008, MCPS only had small demonstration solar systems, but wanted to move toward
investments in larger, more substantial solar installations that could save the school money.
The school district entered into a power purchase agreement (PPA) with SunEdison –
through which MCPS agreed to purchase the electricity produced by eight solar energy
systems throughout its elementary to secondary schools – and the district has been reaping
the financial benefits of solar energy ever since, saving between $10,000 and $15,000 in the
2013 -2014 academic school year.
In 2014, Montgomery County Public Schools established an aggressive county-wide
sustainability and energy plan aimed at eliminating volatility in utility costs. Given continued
sharp declines in solar installed costs, and recognizing that still more schools could deploy
solar cost-effectively, the school district saw a window of opportunity for putting solar on more
schools. As a result, MCPS proposed several large rooftop and ground-mounted solar energy
projects to achieve greater economies of scale. Learning from its previous experiences with
solar schools, MCPS is expecting even greater returns on investment, anticipating $130,000 in
total savings every year.42
39 Montgomery County Public Schools. (2014). FY 2014 Environmental Sustainability Management Plan. Available
at: www.montgomeryschoolsmd.org/departments/facilities/facdocs/1072.14_environsustainmanagementplanweb.pdf 40 S. Gallagher. Personal Communication. March 2015. 41 Ibid. 42 Ibid.

18
Other schools and districts across the state continue to make progress with solar schools as well.
The Baltimore City Office of Sustainable Energy offered a grant to the Baltimore Polytechnic
Alumni Association to install a small solar array on a parking lot, but city schools administrators
have yet to approve the project.43 Additionally, the Maryland Net Zero Energy Schools program,
administered by the Maryland Energy Administration (MEA), is currently underway to identify,
design, and build three net-zero energy schools – or schools that produce as much energy as they
consume – in as many different counties across the state.44 Although a solar energy system is not
a requirement for a net-zero energy building (as other clean energy solutions may be used), solar
technologies may help schools attain this net-zero energy status.
While Maryland continues to make great progress in deploying solar on K-12 schools, there
exists a large untapped potential for still more schools to invest in solar energy systems. With
this in mind, the following section will examine the economic, educational, environmental, and
other opportunities possible through investments in solar energy through the lens of Maryland-
specific demographic, income and employment, and educational indicators. Looking at these
factors may help identify where the benefits of putting solar on schools would have the greatest
impact.
A 510 kW system at George Washington Carver Elementary School, St. Mary’s County
(Photo: Standard Solar)
43 B. Merritt. Personal Communication. June 2015. 44 Maryland Energy Administration. (2014). Maryland Net Zero Energy Schools Program Annual Report. Available
at:
http://webapp.psc.state.md.us/newIntranet/Casenum/NewIndex3_VOpenFile.cfm?filepath=C:%5CCasenum%5C92
00-9299%5C9271%5CItem_421%5C%5CPSC9271.CIF.FY14NZSAnnualReport.pdf

19
Why Should Maryland Schools Go Solar?
Investments in solar energy on K-12 schools stand to deliver a number of significant benefits not
only to those within the school system, but to the surrounding community as well. School and
district administrators will see an obvious benefit in the energy cost savings achievable with
solar, creating the potential for these funds to be reinvested in teacher and staff salaries or new
curriculum and learning tools. Additionally, when properly incorporated into lesson plans, these
systems can deliver a double educational dividend, providing a real-life demonstration of STEM
concepts. The economic activity attached to the installation of these systems can provide a direct
benefit to the community in the form of increased employment opportunities or wages for
workers in related trades, and can contribute to community prosperity indirectly when these
workers spend their income in the local economy. The community at large also receives part of
the environmental benefits of solar, in the form of reduced emissions of greenhouse gas and
criteria air pollutants and fewer demands on local natural resources, such as water and land.
Finally, schools retrofitted with solar energy systems designed to continue to provide power for
critical services during times of disaster can serve as emergency shelters for the surrounding
community.
This section explores the specific benefits solar can provide to Maryland communities, and
examines select employment, income, and educational indicators in counties throughout the state
to identify areas that stand to gain the most from each benefit type.
School & Student Reinvestment
Perhaps the greatest benefit solar energy can offer is the opportunity for a school to realize
significant savings on its energy bills. As the installed cost of solar continues to fall and utility
rates keep rising (as they are expected to by 0.6 percent annually on average through 2040),45
investments in solar will increasingly offer consumers an opportunity to save money. Utility cost
savings can be reinvested back into the public school system in various ways, such as by hiring
new teachers, improving the district's transportation system, developing more comprehensive
curricula, or obtaining additional resources (e.g. updated textbooks, tablet computers, and school
field trips) – all of which contribute to increased per-pupil spending. As an example, in 2012
California's Firebaugh-Las Deltas Unified School District reinstated their music program, which
was halted in 2009 due to the lack of funding, with savings from a solar installation. The school
district installed nearly one megawatt of solar at three schools, expecting $900,000 in savings
over the first five years.46 Solar energy is a smart investment for communities or as Russell
Freitas, Superintendent of Firebaugh-Las Deltas Unified School District stated, “Solar energy
projects for public schools are essentially revenue enhancements for school districts which
directly benefit the students and taxpayers.”47
45 U.S. Energy Information Administration. (2015). Table A8. Electricity supply, disposition, prices, and emissions.
Annual Energy Outlook 2015. Available at: www.eia.gov/forecasts/aeo/pdf/tbla8.pdf 46 Energy Digital. (2012). Schools Reinvest in Programs with Savings from Solar Power. Retrieved from:
www.energydigital.com/renewables/3183/Schools-Reinvest-in-Programs-with-Savings-from-Solar-Power 47 Ibid.

20
In fiscal year 2013, Maryland spent nearly $12 billion in public elementary and secondary
education on 836,000 students, with approximately $7.3 billion of this spent on instruction and
$4.2 billion on support services.48 On average, the state spends about $13,600 per pupil,49 and
although this figure is high compared with much of the rest of the nation (the national average is
approximately $10,700 per pupil), a total of fifteen school districts fall below the Maryland state
average for per-pupil spending (Table 5 and Figure 5). Energy cost savings from investments in
solar energy project may be reinvested in instruction and other educational support services, and
as a result may help bring school districts in these counties closer to the state average.
A 127kW system at DeMatha Catholic High School, Prince George's County
(Photo: Altus Power America)
48 U.S. Census Bureau. (2015). Table 6. Current Spending of Public Elementary-Secondary School Systems by
State: Fiscal Year 2013. Public Education Finances: 2013. Available at
www2.census.gov/govs/school/13f33pub.pdf 49 Maryland State Department of Education (2015). Cost Per Pupil Belonging Maryland Public Schools: FY 2013.
The Fact Book 2013-2014. Available at:
www.marylandpublicschools.org/msde/divisions/bus_svcs/docs/Fact_Book_2013-2014.pdf. Excludes equipment,
tuition payments, and interfund transfer expenditures.

21
Table 5. County Per Pupil Spending (2013)
County Per Pupil
Spending ($)50
Allegany 13,751
Anne Arundel 12,687
Baltimore City 14,631
Baltimore County 13,012
Calvert 13,074
Caroline 11,792
Carroll 12,763
Cecil 12,327
Charles 12,742
Dorchester 13,105
Frederick 12,268
Garrett 14,251
Harford 12,534
Howard 14,694
Kent 14,271
Montgomery 14,891
Prince George’s 13,784
Queen Anne’s 11,593
Somerset 13,637
St. Mary’s 12,313
Talbot 11,855
Washington 12,157
Wicomico 12,610
Worcester 16,220
State Average 13,572
National Average 10,700 51
50 Ibid. 51 U.S. Census Bureau. (2015). Table 8. Per Pupil Amounts for Current Spending of Public Elementary-Secondary
School System by State: Fiscal Year 2013. Public Education Finances: 2013. Available at
www2.census.gov/govs/school/13f33pub.pdf

22
Figure 5. Counties with the Greatest School Reinvestment Opportunities
When individual schools invest in solar, the energy cost savings often go back to the school
district’s general fund, leaving the decision of how to reallocate these savings up to the district.
While the savings may not necessarily all go back into a school with a solar energy system, the
district as a whole can realize the financial benefits for students, teachers, and staff.
Educational Opportunities
The Maryland public school system has been shown to have some of the best schools in the
nation. According to Education Week, Maryland ranked third for the best public schools in the
nation in 2014.52 Maryland also led other states in the nation in the U.S. News 2015 Best High
School Rankings, with 20 of its schools ranked in the top 500 schools nationwide.53 Maryland
has some of the highest performing students, with an 85 percent graduation rate in 2013 54
(compared with the national average of 81 percent 55) and an ACT college readiness assessment
mean science score of 22.2, (compared with 20.8 nationally).56
Despite these successes, several Maryland districts have graduation rates and test assessment
scores below state averages. Six school districts – Baltimore City, Caroline County, Dorchester
52 Education Week. (2015). Maryland Earns a B on State Report Card, Ranks Third in Nation.
Available at: www.edweek.org/ew/qc/2015/state-highlights/2015/01/08/maryland-education-ranking.html 53 U.S. News. (2015). Best High Schools in Maryland. Available at: www.usnews.com/education/best-high-
schools/maryland 54 2014 Maryland Report Card. (2015). Graduation Rate: 4-Year Adjusted Cohort Class of 2013. Available at:
www.mdreportcard.org 55 National Center for Education Statistics’ Common Core Data. (2015). Public high school 4-year adjusted cohort
graduation rate (ACGR) for the United States, the 50 states and the District of Columbia: School years 2010-11 to
2012-13. Available at: https://nces.ed.gov/ccd/tables/ACGR_2010-11_to_2012-13.asp 56 ACT Inc. (2014). 2014 ACT National and State Scores: Average Scores by State. Available at:
www.act.org/newsroom/data/2014/states.html

23
County, Prince George’s County, Somerset County, and Wicomico County – have graduation
rates below the state average. In addition, a total of thirteen districts have mean ACT science
scores below the state average (Table 6). A solar energy system installed on a school and
included in lesson plans as a teaching tool can help improve student learning and performance.
Studies have shown that interactive, hands-on curricula can enhance student learning and
retention.57 For example, math and science curricula that include modules on renewable energy
systems were found to increase student performance on the math and science portions of state
assessments relative to control classes that did not receive this curriculum.58 As another example,
in 2011, Antelope Valley Union High School District in Northern Los Angeles County saw
construction finish on a 9.6 MW solar PV system. As part of this effort, the district partnered
with the solar developer to integrate the system into algebra and science lesson plans. Using the
system as a “real-world application” of concepts in these subjects helped improve student test
scores by 60 percent during a week-long trial period.59
Six school districts – Baltimore City, Caroline County, Dorchester County, Prince George's
County, Somerset County, and Wicomico County – have both low graduation rates and ACT
science scores compared to state averages (Figure 6). Some of these districts also represent a
large number of students, creating the potential for a large educational impact, such as Baltimore
City Public Schools with nearly 85,000 students,60 and Prince George's Public Schools with over
127,000 students.61 As more districts deploy solar on schools, there will be a greater opportunity
for more students to become exposed to and learn about renewable energy and other STEM-
related concepts.
57 Ibrahim, M. and O. Al-Shara. (2007). Impact of Interactive Learning on Knowledge Retention. Human Interface
and the Management of Information. SpringerLink. Accessed April 22, 2014. 58 Dewaters, J., S.E. Powers. Improving science and energy literacy through project-based K-12 outreach efforts. In
Proceedings of the 113th Annual ASEE Conference & Exposition (Chicago IL June 2006, paper number 2006-262). 59 Schueneman, T. (2011, August 19). How One School District’s Solar Array Raises Student Test Scores. Triple
Pundit. Available at www.triplepundit.com/2011/08/school-solar-array-raises-student-test-scores/ 60 Baltimore City Public Schools. (2015). Baltimore City Public Schools: District Profile. Available at:
www.baltimorecityschools.org/cms/lib/MD01001351/Centricity/Domain/8048/DistrictDataProfile.pdf 61 Prince George’s County Public Schools. (2014). Enrollment Reports by School and Grade: Official September 30,
2014 Report. Available at: www1.pgcps.org/pasb/index.aspx?id=20160

24
Table 6. County 4-Year Adjusted Cohort Graduation Rates (2013), and Science Mean ACT Scores
(2014)
County Graduation
Rate62
Science Mean
ACT Score63
Allegany 90.1 23
Anne Arundel 85.6 23
Baltimore City 68.5 16
Baltimore County 86.3 21
Calvert 91.8 23
Caroline 84.2 22
Carroll 94.4 23
Cecil 86.7 21
Charles 89.8 20
Dorchester 83.8 19
Frederick 93.3 23
Garrett 92.6 25
Harford 89.5 23
Howard 93.3 24
Kent 88.0 22*
Montgomery 88.3 23
Prince George’s 74.1 18
Queen Anne’s 93.5 22
Somerset 77.0 18
St. Mary’s 91.5 23
Talbot 91.2 23
Washington 91.5 20
Wicomico 82.0 19
Worcester 90.9 21
State Average 85.0 22.2
National Average 81.0 64 20.8 65
*Figure represents the 2013 ACT score. Fewer than five students surveyed indicated a 2014 graduation
year.
62 2014 Maryland Report Card. (2015). Graduation Rate: 4-Year Adjusted Cohort Class of 2013. Available at:
www.mdreportcard.org. Graduation Rates are based on the number of total diplomas earned by the 2013 cohort,
matriculated in Fall of 2009. Students who have dropout remain in the adjusted cohort. 63 2014 Maryland Report Card. (2015). ACT Graduating Class Means Sore Trends by Year: 2014 Science Mean.
Available at: www.mdreportcard.org. Scores based on students who indicated to ACT that they would graduate in the
given year. 64 National Center for Education Statistics’ Common Core Data. (2015). Public high school 4-year adjusted cohort
graduation rate (ACGR) for the United States, the 50 states and the District of Columbia: School years 2010-11 to 2012-
13. Available at: https://nces.ed.gov/ccd/tables/ACGR_2010-11_to_2012-13.asp 65 ACT Inc. (2014). 2014 ACT National and State Scores: Average Scores by State. Available at:
www.act.org/newsroom/data/2014/states.html.

25
Figure 6. Counties with the Greatest Educational Opportunities
CASE STUDY: North Point High School
Keith Gascon, an Electrical Construction Program Instructor at North Point High School in
Charles County, teaches students enrolled in his program using a 9-panel, 2.6 kW PV system
donated by the Washington, D.C. Joint Apprenticeship and Training Committee (JATC)
and the International Brotherhood of Electrical Workers (IBEW) Local 26.66 Gascon also
uses the system to teach night classes with members of JATC and IBEW. The system
donation was originally made as a way to attract more people into the Electrical
Construction Program, and now the small solar energy system is part of Gascon’s lectures
on alternative energies each year.
“While the system does not provide a great amount of energy to power the school, it is most
valued as an instructive tool to better prepare students interested in pursuing an electrical
career. This was an opportunity to give potential apprentices a hands-on experience,
especially in the growing green sector of our industry,” said Ralph Neidert, a Master
Electrician in Virginia, Maryland, and West Virginia and Assistant Director at the JATC.67
66 K. Gascon, Personal Communication. January 26, 2015. 67 Southern Maryland Online. (2011, December 6). New Solar Array Provides Learning Tool for North Point
Students. Southern Maryland Online. Retrieved from: http://somd.com/news/headlines/2011/14692.shtml

26
CASE STUDY: Rowland Park Country School
From the very beginning, students enrolled in the Sustainable Design elective class at
Rowland Park Country School (RPCS) led the effort to install solar on the school.68 When
Martha Barss, the school's Environmental Education and Sustainability Coordinator,
received a request for proposal (RFP) from Lockhart Vaughan Foundation to fund projects
that supported the school’s commitment to environmental sustainability, she
recommended her elective class get involved with writing the proposal with help from the
school's development office. After several revisions and solicited bids, the proposal was
sent, and by the summer of 2011, the school was awarded a grant to install a 36 kW PV
solar array on the school’s roof. "I definitely think the initiative should come from
students who are interested and want to know how to go about getting solar for their
school," said Barss.
RPCS has integrated solar into the curriculum in various ways. The lower school students,
representing kindergarten to fifth grade, received moving toys powered with solar energy.
Ninth grade students in a STEM class studied how solar output (viewed through the
school's real-time energy use website) relates to the leaf color changes in the fall. The high
school physics students study solar PV in the classroom, visit the installation on the
building’s roof, and then calculate the energy produced. Aside from educational impacts,
the 36 kW solar energy system generated nearly 43,000 kWh of electricity during its first
year in operation,69 offsetting over 65,000 pounds of carbon dioxide annually.
Economic Development
Looking to community-wide benefits, one of the most compelling reasons to invest in solar is the
economic growth and job creation opportunities attached to the industry. In less than a decade,
the national solar industry has grown over 1,000 percent – from a $1.5 billion industry in 2006 to
a nearly $18 billion industry by the end of 2014.70 This economic growth has in turn fueled
steady increases in solar employment. In 2010, the U.S. solar industry employed 93,502 solar
workers. By the end of 2014, this number had grown to nearly 174,000, representing 86 percent
growth in employment in just five years.71
Overall, employment and incomes in Maryland are strong compared with national averages.
Between 2011 and 2013, Maryland had the highest median household income of any U.S. state at
$72,345, approximately $20,000 more than the national median income of $52,176 during the
68 M. Barss, Personal Communication. January 2015. 69 Based on data found on https://enlighten.enphaseenergy.com/pv/public_systems/bFN341543 70 SEIA/GTM Research. (2015). U.S. Solar Market Insight: 2014 Year in Review. Available at:
www.seia.org/research-resources/us-solar-market-insight 71 The Solar Foundation. (2015). National Solar Jobs Census 2014. Available at:
www.thesolarfoundation.org/national-solar-jobs-census-2014/

27
same time period.72 As of April 2015, the state’s unemployment rate of 5.3 percent73 is slightly
lower than the U.S. average of 5.4 percent.74 These state averages, however, conceal county-
level variations that may help prioritize certain areas for increased solar development.
According to the Maryland Solar Jobs Census, solar installers in the state earn an average wage
of $22.67 per hour (approximately equivalent to an annual salary of $47,150),75 which is
significantly higher than the living wage in the state of $13.39 per hour.76 In other solar sectors,
the national average salary for salespeople and system designers is around $75,000, while an
individual working in production or assembly earns about $36,600.77 Over 78 percent of
Maryland solar workers are employed in the installation sector78 and while many parts of the
state have median household incomes above the $47,150 typically earned by these workers, four
counties – Allegany, Dorchester, Garrett, and Somerset – in addition to Baltimore City have
median incomes below this figure (Table 7). In addition, eleven Maryland counties have
unemployment rates higher than the state average. Together, four counties – Allegany,
Dorchester, Garrett, and Somerset – as well as Baltimore City have both high unemployment
rates and low median household incomes compared with state averages (Figure 7). Targeting
schools in these districts for solar development may help alleviate the economic strain felt in
these areas. See Table 9 for more detailed information on Maryland-specific jobs and economic
impacts of solar.
A 796 kW system at Colonel Richardson Middle and High Schools, Caroline County
(Photo: REC Solar)
72 U.S. Census Bureau. (2015). 2011-2013 Income in the Past 12 Months (In 2013 Inflation- Adjusted Dollars).
American Community Survey 3-Year Estimates. Available at: http://factfinder.census.gov 73 U.S. Department of Labor Bureau of Labor Statistics. (2015). Local Area Unemployment Statistics Map:
Maryland Counties April 2015 Unemployment Rate. Available at: www.data.bls.gov/map 74 U.S. Department of Labor Bureau of Labor Statistics. (2015). Labor Force Statistics from the Current Population
Survey [Database]. Available at http://data.bls.gov/timeseries/LNS14000000. 75 The Solar Foundation. (2015). Maryland Solar Jobs Census 2014. Available at: www.thesolarfoundation.org 76 Ibid. 77 The Solar Foundation. (2015). National Solar Jobs Census 2014. Available at: www.thesolarfoundation.org 78 The Solar Foundation. (2015). Maryland Solar Jobs Census 2014. Available at: www.thesolarfoundation.org

28
Table 7. County Median Household Income (2011-2013) and Unemployment Rates (April 2014)
County Median Household
Income ($)79
Unemployment
Rate (%)80
Allegany 39,846 6.3
Anne Arundel 87,460 4.3
Baltimore City 40,798 7.4
Baltimore County 64,700 5.3
Calvert 92,601 4.2
Caroline 52,967 5.4
Carroll 81,600 4.1
Cecil 66,575 5.6
Charles 90,789 4.6
Dorchester 45,508 7.7
Frederick 82,061 4.3
Garrett 41,728 5.8
Harford 79,091 4.9
Howard 107,452 3.7
Kent 58,157 5.5
Montgomery 97,181 3.7
Prince George’s 72,098 4.8
Queen Anne’s 84,309 4.4
Somerset 32,997 8.1
St. Mary’s 85,174 4.6
Talbot 58,618 5.0
Washington 55,700 5.6
Wicomico 50,473 6.5
Worcester 56,279 10.1
State Average 72,345 5.3
National Average 52,176 81 5.4 82
79 U.S. Census Bureau. (2015). 2011-2013 Income in the Past 12 Months (In 2013 Inflation- Adjusted Dollars).
American Community Survey 3-Year Estimates. Available at: http://factfinder.census.gov 80 U.S. Department of Labor Bureau of Labor Statistics. (2015). Local Area Unemployment Statistics Map:
Maryland Counties April 2015 Unemployment Rate. Available at: www.data.bls.gov/map 81 U.S. Census Bureau. (2015). 2011-2013 Income in the Past 12 Months (In 2013 Inflation- Adjusted Dollars).
American Community Survey 3-Year Estimates. Available at: http://factfinder.census.gov 82 U.S. Department of Labor Bureau of Labor Statistics. (2015). Labor Force Statistics from the Current Population
Survey [Database]. Available at http://data.bls.gov/timeseries/LNS14000000.

29
Figure 7. Counties with the Greatest Economic Development Opportunities
Maryland has already started reaping some of these economic development benefits. In late
2014, the state solar industry employed 3,012 solar workers, representing 29 percent growth in
employment over the previous year.83 Several recent projects and industry developments help to
illustrate the job creation potential of solar. In 2012, the state completed a 160-acre, 20 MW
solar farm, located at the Maryland Correctional Institution (MCI) in Hagerstown. As the state's
largest solar power facility, it was estimated that the project created 125 temporary construction
jobs and at least three full time project maintenance jobs for the lifetime of the system.84 Howard
County-based Direct Energy Solar, a full service solar provider, is planning to add 240 new jobs
by the end of 2017, tripling the size of their current workforce.85 SolarCity, a leading solar
energy provider, opened a Baltimore County Operations Center in Hunt Valley in September of
2014, with 35 open positions at this location and more than 70 other positions across the state.86
The solar industry in Maryland is growing quickly, and local governments can use this as a smart
opportunity to grow their local economies.
83 The Solar Foundation. (2015). Maryland Solar Jobs Census 2014. Available at: www.thesolarfoundation.org 84 First Solar. (2012). Governor O'Malley Celebrates Groundbreaking on State's Largest Solar Power Project [Press
Release]. Retrieved from: investor.firstsolar.com/releasedetail.cfm?ReleaseID=689787 85 Direct Energy Solar. (2015). Howard County's Astrum Solar Plans Expansion, 240 New Jobs. [Press Release].
Retrieved from:
www.directenergysolar.com/pressreleases/press_release_Astrum_Solar_plans_expansion_240_new_jobs 86 SolarCity. (2014). SolarCity Launches Baltimore County Operations Center [Press Release]. Retrieved from:
www.solarcity.com/newsroom/press/solarcity-launches-baltimore-county-operations-center

30
CASE STUDY: Oakdale High School, Frederick County Public Schools
Oakdale High School in Ijamsville, located in Frederick County, was one of sixteen
awardees of the Maryland Energy Administration’s Project Sunburst, a grant program
designed to fund the installation of renewable energy systems on public buildings in
Maryland in 2011.87 Awarded with nearly $500,000, Frederick County Public Schools
(FCPS) installed a 499kW solar energy system on Oakdale High, entering into a 20-year
power purchase agreement (PPA) with Nautilus Solar Energy. Under the PPA, FCPS will
only pay $0.055 per kilowatt-hour (as opposed to of $0.0914/kWh with their current
supplier), and is expected to save up to $317,000 over the contract’s 20 year lifetime.88
The map shown in Figure 8 below is an overlay of Figures 5-7, showing how each county or
district could benefit from an investment in solar. The overlaid indicators are: economic,
education, and school reinvestment. Dorchester County is the only county that can benefit from
all three indicators, while three counties – Caroline County, Somerset County, and Wicomico
County – and Baltimore City can benefit from two. Nevertheless, the majority of Maryland
counties (20 out of 24) can benefit from solar in at least one way.
Figure 8. Overlay of Selected Indicators in Maryland Counties
87 Maryland Energy Administration. (2015). Project Sunburst. Available at:
http://energy.maryland.gov/Govt/sunburst.html 88 Neal, M. (2011, March 20). Grant funds Oakdale solar project. The Frederick News-Post. Retrieved from:
www.fredericknewspost.com/archive/grant-funds-oakdale-solar-project/article_8803ffc3-dc8c-51f6-98f3-
e01183bea8b9.html

31
Environmental Protection
Solar energy can also help the state achieve its energy and environmental goals by both
contributing to attainment of the renewable portfolio standard and by avoiding emissions of air
pollutants and impacts on natural resources. As noted earlier, a single 110 kW solar PV
installation (the median system size of the existing K-12 solar energy systems in the state) will
produce nearly 150,000 kWh of electricity in its first year of operation.89 This production will
offset approximately 103 metric tons of CO2e emissions, roughly equal to taking nearly 22
passenger vehicles off the road for an entire year or the amount of carbon sequestered annually
by almost 85 acres of U.S. forests.90 Electricity derived from solar can also help reduce
emissions of criteria air pollutants, such as nitrogen oxides (NOx) and sulfur dioxide (SO2). The
150,000 kWh of annual production expected from a median-sized solar school installation can
reduce NOx emissions by nearly 225 pounds and SO2 emissions by up to nearly four pounds
annually.91
In addition to reducing air pollution, producing electricity with solar can also help conserve
natural resources. The annual production from the 110 kW system in the example above can save
over 30,000 gallons of water each year, which would have otherwise been used for cooling at a
natural gas combined-cycle power plant.92 And finally, rooftop solar PV can help avoid the need
to site conventional power plants on previously undisturbed land. The Natural Gas Supply
Association estimates that generating one million kWh from a natural gas combined cycle plant
requires just under 1,000 square feet of land each year.93 Rooftop solar, by contrast, can be
implemented on sites already being used for another purpose.
89 According to the NREL PVWatts Calculator, available at http://pvwatts.nrel.gov/pvwatts.php. Assumes 110kW
system installed in Baltimore area with tilt of 30 degrees. All other inputs are PVWatts defaults. 90 According to the Environmental Protection Agency’s “Greenhouse Gas Equivalencies Calculator”, available at:
www.epa.gov/cleanenergy/energy-resources/calculator.html 91 According to the Environmental Protection Agency’s “eGRID Year 2010 Data Files”, available at:
www.epa.gov/cleanenergy/energy-resources/egrid/. Figures cited assume solar offsets electricity from existing
Maryland natural gas plants at the median emissions rates of these facilities. 92 Macknick, J. Newmark, R., Heath, G, and Hallett, K C. (2012). Operational water consumption and withdrawal
factors for electricity generating technologies: a review of existing literature. Environmental Research Letters, 7
(2012). Available at: http://iopscience.iop.org/1748-9326/7/4/045802 93 Natural Gas Supply Association. (2013). Comparison of Fuels Used for Electric Generation in the U.S. Available
at: www.ngsa.org/download/analysis_studies/beck%20enviro%20factors%20-%20updated.pdf

32
CASE STUDY: Mace's Lane Middle School
Mace's Lane Middle School, one of eleven public schools in Dorchester County, has an 803
kW solar energy system that was completely financed through a 20-year power purchase
agreement with Washington Gas Energy Systems and was designed and installed by Kenyon
Energy and Rec Solar.94 The 3,276-panel project is expected to reduce 764 metric tons of
carbon dioxide emissions, equivalent to the annual carbon sequestration potential of over 625
acres of forests or taking 161 passenger vehicles off the road for a year.95 The school district is
no stranger to environmentally-friendly initiatives and technologies, having previously
implemented a single-stream recycling program in all district buildings and being the first
school district in Maryland to use geothermal technologies to heat and cool five facilities.96
Chris Hauge, Dorchester County Public Schools’ Facilities Engineer, said the solar project was
created "in concert with a theme we have in Dorchester County [of]… being interested in green
technologies, sustainability, environmental preservation, and doing what is right for Dorchester
County and the larger community.”97
The solar panels were seen as the next logical choice in the district’s pursuit of sustainability
measures at its schools. As Dr. Henry V. Wagner Jr., Dorchester County School District
Superintendent stated, “This successful public/private partnership is resulting, each day, in
clean energy at a lower than market price to meet the energy demand for our already
environmentally friendly Mace’s Lane Middle School. This solar array field is a welcome and
complimentary addition to the existing geothermal system, which is designed to deliver
comfortable and energy efficient heating and cooling to this school facility. Now we have green
electricity to power the pumps and fan systems in our geothermal HVAC systems."98
The solar energy system is but one piece of an effort to implement an energy management
program designed in 2007 to save the district more than one million dollars in avoided energy
costs. As of June 2010, Dorchester County Public Schools had saved a total of $1.5 million by
also participating in a multi-party energy trust for the lowest possible prices and implementing
energy management best practices such as automatic monitoring systems to regulate heating
and cool systems in all schools.99
94 Anderson, L. (2013, March 26). Mace's Lane Middle Now More Eco-Friendly. The Dorchester Banner. Retrieved
from: http://maryland.newszap.com/cambridgedorchester/121065-92/maces-lane-middle-now-more-eco-friendly 95 According to the Environmental Protection Agency’s “Greenhouse Gas Equivalencies Calculator”, available at:
www.epa.gov/cleanenergy/energy-resources/calculator.html 96 Anderson, L. (2013, March 26). Mace's Lane Middle Now More Eco-Friendly. The Dorchester Banner. Retrieved
from: http://maryland.newszap.com/cambridgedorchester/121065-92/maces-lane-middle-now-more-eco-friendly 97 Ibid. 98 Ibid. 99 Office of Legislative Audits. (2011). Financial Management Practices Performance Audit Report: Dorchester
County Public Schools. Available at: www.ola.state.md.us/Reports/schools/DCPS11.pdf

33
Community Resiliency and Emergency Response
The value of solar on schools can extend far beyond cost and emission savings. Solar schools
also have the ability to act as centralized emergency centers during natural disasters and help
build community resiliency, given energy storage capabilities. There are multiple energy storage
technologies although they exist at different maturity levels. Currently, pumped hydro represent
95 percent of installed storage capacity, while compressed air energy storage (CAES), batteries
(NAS, Li-ion, PB-Acid), and flywheels make up the remaining five percent.100 Residential and
non-residential solar systems mostly rely on batteries to store excess electricity and the market
for these batteries have recently been growing (including Tesla's battery,101 and Daimler's
Mercendez-Benz energy storage unit 102), allowing customers to store solar PV energy for later
use.
Although no Maryland schools currently act as solar-powered shelters during emergencies,
schools in other states have already tapped into this benefit of solar. The Florida Solar Energy
Center (FSEC) has installed more than 115 10-kW PV systems on schools serving as emergency
shelters across Florida through the SunSmart E-Shelters Program.103 In addition to providing
power during emergencies, one of the program’s goals was to incorporate the solar energy
systems into lesson plans, educating students about renewable energy and energy efficiency.
Inspired by this program, Wells Junior High School in Peaks Island, Maine is looking into
installing rooftop solar panels on the island’s only school. Peaks Island hopes to use this system
to produce and store solar power in batteries. During storms or other emergencies, the system
will provide a backup source of electricity until power from the mainland can be restored.104
Maryland, like many states on the east coast of the United States, is susceptible to natural
disasters such as flooding, hurricanes, tornados, and severe winter storms. According to the
Federal Emergency Management Agency (FEMA), Maryland has experienced 25 major disasters
since 1962, including seven hurricanes, and eleven severe storm declarations.105 As evidenced by
the state’s continued efforts to adapt to the changing environment and prepare for future natural
disasters – such as through providing state funding to install backup power systems in service
stations and volunteer firehouses to help protect community resiliency in times of disaster106 –
the need for more reliable ways to provide emergency power is extremely crucial. Solar energy
100 U.S. Department of Energy Office of Electricity Delivery and Energy Reliability. (2014). Energy Storage Safety
Strategic Plan. Available at: http://energy.gov/sites/prod/files/2014/12/f19/OE Safety Strategic Plan December
2014.pdf 101 See Tesla Motors at http://www.teslamotors.com/powerwall for more information. 102 Coxworth, B. (2015, June 5). Daimler to offer Mercedes-Benz energy-storage system. Gizmag. Retrieved from:
http://www.gizmag.com/daimler-mercedes-benz-energy-storage-battery/37909/ 103 Florida Solar Energy Center. (2014). SunSmart E-Shelters Program. Available at:
www.fsec.ucf.edu/en/education/sunsmart/index.html 104 Ellis, C. (2014, October 21). Peaks Island School eyed for emergency solar array. Bangor Daily News. Retrieved
from http://bangordailynews.com/2014/10/21/news/portland/peaks-island-school-eyed-for-emergency-solar-array/ 105 Federal Emergency Management Agency. (2015). Disaster Declarations for Maryland. Available at
www.fema.gov/disasters. 106 Maryland Energy Administration. (2015). Energy Resiliency Grant Program. Available at:
http://energy.maryland.gov/Business/fuelupmd/index.html

34
systems with battery storage installed at many of the state’s 50 emergency shelters107 can be one
way to prepare and recover from natural disasters.
Maryland Solar Schools: Untapped Potential
Despite Maryland’s continued progress in installing solar on schools, there remains a significant
untapped potential for deploying solar on more schools in most districts in the state.
Of the 2,873 K-12 schools in the state,108 nearly 99 percent do not have solar. Of these non-solar
schools, about 65 percent (or 1,838 schools, both public and private) can cost-effectively install
solar energy systems.109 However, a total of 1,867 schools have the potential to cost-effectively
install solar energy systems in the state, as 29 current solar schools have not reached their
maximum solar capacity potential, and as a result have the opportunity to deploy more solar
energy systems. Solar installations at each of these 1,867 schools would result in over
143,500 kW of new solar capacity, generating more than 165,000 MWh per year. To put
this into perspective, the entire state generated over 35,000,000 MWh of electricity in
2013.110 This solar electricity would equal an annual energy value of over $18.3 million –
approximately equal to 421 starting teacher salaries or 36,000 tablet computers each
year.111 Additionally, this combined electricity generation would offset over 114,000 metric
tons of carbon dioxide, equivalent to taking 24,000 passenger vehicles off the road or the amount
of carbon sequestered by over 93,000 acres of U.S. forests each year.112
Looking specifically at Maryland’s public schools, Brighter Future identified 1,232 schools that
can cost-effectively deploy solar, with a potential capacity of over 123,000 kW across 21 school
districts.113 This solar school capacity could generate over 142,500 MWh per year, or a 30-year
107 Maryland Department of Human Resources. (2015). Directory of Maryland Emergency Shelter and Transitional
Housing Programs. Available at: www.dhr.state.md.us/blog/wp-content/uploads/2015/01/Homeless-
Shelters_Update_01-2015.pdf 108 Maryland State Department of Education. (2015). Number of Public and Nonpublic Schools in Maryland: 2013-
2014. The Fact Book 2013-2014. Available at:
www.marylandpublicschools.org/msde/divisions/bus_svcs/docs/Fact_Book_2013-2014.pdf 109 The Solar Foundation. (2014) Brighter Future: A Study on Solar in U.S. Schools. Available at:
www.thesolarfoundation.org/solar-schools/. This report only identified 2,178 K-12 schools in Maryland, and as a
result more schools may cost effectively deploy solar. For the purposes of this report, a school can cost-effectively
install solar if it had a positive net present value (NPV) – the difference between project costs and benefits, adjusted
to reflect inflation and the time value of money – after a solar installation. Modeling assumptions include a $2.00 per
watt system cost and a PV system size proportional to the school's student population. 110 Based on data from https://data.maryland.gov/Energy-and-Environment/Renewable-Energy-Generated-In-
Maryland/79zg-5xwz? 111 Maryland State Department of Education. (2015). Salary Range for Ten-Month Teachers in Public Schools:
2013-2014. The Fact Book 2013-2014. Available at
www.marylandpublicschools.org/msde/divisions/bus_svcs/docs/Fact_Book_2013-2014.pdf Assuming an average
tablet cost of $500 and an average starting teacher salary in Maryland of $43,375. 112 According to the Environmental Protection Agency’s “Greenhouse Gas Equivalencies Calculator”, available at:
www.epa.gov/cleanenergy/energy-resources/calculator.html 113 1,232 public schools have some untapped solar potential and can cost-effectively install solar energy systems,
including the 24 schools that currently have solar systems.

35
net present value (NPV) – the difference between project costs and benefits, adjusted to reflect
inflation and the time value of money – of over $37 million (Table 8).
A 110 kW system at Lakelands Park Middle School, Montgomery County
(Photo: InEnergy Inc.)

36
Table 8. Additional Cost-Effective Solar School Opportunities per Maryland Public School District – Energy and Environmental Value
Public School District PV Potential
Capacity
(kW)
Potential
Energy
Savings (kWh)
Potential CO2
Emissions
Reduction (MT)
30 Year
Solar NPV
($)
Potential Annual
Generation
Value ($/yr)
Allegany County† n/a n/a n/a n/a n/a
Anne Arundel County 12,886 14,704,174 10,139 3,879,890 1,617,459
Baltimore City 14,125 16,149,137 11,136 4,277,463 1,776,405
Baltimore County 17,702 20,220,181 13,943 5,301,410 2,219,744
Calvert County 2,931 3,303,532 2,278 412,749 332,367
Caroline County 583 1,090,909 752 116,612 115,653
Carroll County 4,378 5,000,764 3,448 239,925 468,035
Cecil County 2,793 3,178,049 2,191 1,200,737 377,724
Charles County 4,612 5,136,030 3,542 520,371 513,603
Dorchester County 707 896,970 619 302,841 107,636
Frederick County 149 170,275 117 73 15,325
Garrett County† n/a n/a n/a n/a n/a
Harford County 5,682 7,566,877 5,218 1,636,034 826,459
Howard County 8,649 9,968,654 6,874 2,595,169 1,094,733
Kent County 205 365,172 252 79,891 42,856
Montgomery County 17,202 20,230,685 13,950 6,805,380 2,398,452
Prince George’s County 21,843 24,458,936 16,866 6,616,680 2,751,389
Queen Anne’s County 1,310 1,533,232 1,057 565,345 181,101
Somerset County 499 577,182 398 237,392 69,262
St. Mary’s County 2,522 2,887,020 1,991 390,595 288,702
Talbot County 775 882,836 609 178,492 93,094
Washington County† n/a n/a n/a n/a n/a
Wicomico County 2,519 2,876,886 1,984 1,142,388 345,226
Worcester County 1,148 1,310,430 904 520,361 157,252
TOTAL 123,220 142,507,933 98,266 37,019,797 15,792,476
† Denotes County has solar PV potential but under the assumptions of $2.00/W, it is currently not cost-effective for these schools to
deploy solar

37
Nine public school districts stand out with a potential NPV of up to one million dollars or more
over a 30-year period (Figure 9). Together, these nine school districts, with 103,402 kW of solar
capacity potential across 1,024 schools, could deliver nearly $33.5 million in annual energy
savings. This is not to discourage other school districts from installing solar on their schools, but
rather to offer more encouragement to those districts with greater potential financial gains.
Figure 9. School Districts with the Greatest Cost Savings Potential
In addition to cost savings, solar deployment on schools will have the potential to boost the local
economy. Using NREL's Jobs and Economic Development (JEDI) model, if all 1,232 public
schools fully tapped their solar capacity, the state would create over 1,440 one-time jobs in
construction and nearly 30 ongoing jobs in operations and maintenance (O&M) over 30 years.
This activity would result in approximately $81 million in construction earnings (and $189
million in total economic output), in addition to $1.5 million in O&M earnings over 30 years
(with nearly $2.6 million in total economic output) (Table 9).114
114 To obtain these results, school capacity figures were sorted into “buckets” of 5kW or 50-500kW (in 50kW
increments). The number of jobs created includes construction and maintenance workers over a 30 year analysis
period. Worker earnings assume MD state average of $22.67 for construction worker wages. Other altered JEDI
assumptions include a Base Installation cost of $2000/kWDC and a 6% cost of capital.

38
Table 9. Additional Cost-Effective Solar School Opportunities per Maryland Public School District – Economic Value
Public School District PV Potential
Capacity
(kW)
Total
Construction
Employment
(FTE)
Total
Construction
Earnings
(1000$)
Total
Construction
Output
(1000$)
Annual O&M
Employment
(FTE)
Annual
O&M
Earnings
(1000$)
Annual
O&M
Output
(1000$)
Allegany County† n/a n/a n/a n/a n/a n/a n/a
Anne Arundel County 12,886 148 8,353 19,441 2.7 160.5 267.9
Baltimore City 14,125 152 8,538 19,966 2.9 158.3 266.5
Baltimore County 17,702 203 11,407 26,572 3.8 217.7 364.1
Calvert County 2,931 34 1,934 4,491 0.6 37.7 62.7
Caroline County 583 10 585 1,363 0.2 11.1 18.6
Carroll County 4,378 49 2,754 6,407 1.0 53.0 88.5
Cecil County 2,793 32 1,808 4,215 0.6 34.3 57.5
Charles County 4,612 54 3,019 7,019 0.9 58.5 97.5
Dorchester County 707 8 444 1,042 0.1 8.1 13.6
Frederick County 149 2 89 209 0 1.5 2.6
Garrett County† n/a n/a n/a n/a n/a n/a n/a
Harford County 5,682 78 4,374 10,156 1.5 85.4 142.1
Howard County 8,649 106 5,971 13,868 2.0 116.5 193.8
Kent County 205 2 103 239 0 2.0 3.3
Montgomery County 17,202 211 11,914 27,704 4.0 230.3 384.0
Prince George’s County 21,843 251 14,142 32,910 4.7 271.9 454.0
Queen Anne’s County 1,310 15 851 1,989 0.2 15.9 26.7
Somerset County 499 6 343 802 0.2 6.4 10.8
St. Mary’s County 2,522 29 1,628 3,785 0.6 31.5 52.6
Talbot County 775 10 545 1,269 0.2 10.5 17.5
Washington County† n/a n/a n/a n/a n/a n/a n/a
Wicomico County 2,519 28 1,596 3,713 0.5 30.8 51.3
Worcester County 1,148 13 726 1,698 0.3 13.5 22.7
TOTAL 123,220 1,441 81,124 188,858 27 1,555 2,598
† Denotes County has solar PV potential but under the assumptions of $2.00/W, it is currently not cost-effective for these schools to deploy solar

39
Six school districts were identified as those who could support over 100 new construction jobs
(and $13 million in economic output), and over two ongoing O&M jobs for over 30 years (and
$150,000 in economic output) (Figure 10). Again, this is not to discourage other public school
districts from installing solar on schools, as all 21 school districts stand to realize some financial
benefit from going solar, but rather to identify the school districts that can provide the greatest
employment opportunities through solar school projects.
Figure 10. Public School Districts with the Greatest Economic Impact Potential
Overlaying Figures 9 and 10 shows six school districts – Anne Arundel County, Baltimore City,
Baltimore County, Howard County, Montgomery County, and Prince George's County – that
could save the most money and have the greatest economic output through solar schools (see
Figure 11 and Table 10). Collectively, these six school districts could support a solar PV
capacity of 92,407 kW – with a 30 year NPV of nearly $30 million – and support 1,071 one-
time construction jobs and approximately 20 annual O&M jobs over 30 years, with an
economic value of $140 million and $1.9 million in construction and O&M respectively.

40
Figure 11. School Districts with Greatest Cost Savings and Economic Impacts Potential
Table 10. MD Public School Districts with the Greatest Value in Energy Savings and Local
Economic Development
Public
School
District
PV
Capacity
(kW)
30 Year
Solar NPV
($)
Total
Construction
Employment
(FTE)
Total
Construction
Output
(1000$)
Annual
O&M
Employment
(FTE)
Annual
O&M
Output
(1000$)
Anne
Arundel
County 12,886 3,879,890 148 19,441 2.7 267.9
Baltimore
City 14,125 4,277,463 152 19,966 2.9 266.5
Baltimore
County 17,702 5,301,410 203 26,572 3.8 364.1
Howard
County 8,649 2,595,169 106 13,868 2.0 193.8
Montgomery
County 17,202 6,805,380 211 27,704 4.0 384.0
Prince
George's
County 21,843 6,616,680 251 32,910 4.7
454.0
TOTAL 92,407 29,475,992 1,071 140,461 20.1 1,930
To further target areas where an investment in solar can have the greatest impact, it may be
useful to see how the six districts that stand to realize the greatest cost savings, jobs, and
economic impacts compare with the demographic indicators discussed earlier (i.e., per-pupil
spending, high unemployment/low wages, and low science test scores – recall Figure 8 on page

41
30). Anne Arundel and Baltimore County stand to realize the greatest benefit from reinvesting
solar cost savings back into the school and increasing per-pupil spending. Baltimore City can
gain the most with solar job creation, as well as boosting the local economy with solar schools.
And finally, Baltimore City and Prince George’s County have the most to gain from using solar
schools as an educational opportunity (Table 11).
Table 11. Potential Leading Benefits of Solar Schools
Public School District Economic
Development
School &
Student
Reinvestment
Educational
Opportunity
Anne Arundel County X
Baltimore City X X
Baltimore County X
Howard County
Montgomery County
Prince George's County X
Financial Analysis Case Study
Although deploying solar energy remains highly promising on schools throughout Maryland, it
may not be feasible for all schools or districts to install solar energy systems to the fullest
potential. For example, PV rooftop systems require that the school’s roof be in good condition to
support the installation, which may not be the case for older schools. Additionally, because a
solar PV system can generate electricity for several decades, it would be most beneficial to site
solar on schools that will not close down in the foreseeable future. Even with these challenges,
hundreds of schools across the state would likely be good candidates for solar energy. If five
schools in each of the nine districts that stand to save up to $1 million or more over 30
years by going solar were to install a 110 kW system with a total of 4.95 MW in solar
capacity, each school district could receive nearly $80,000 in annual energy value.115
Additionally, Maryland is expected to add approximately 139 MW of solar capacity in 2015,
which would bring the state’s cumulative installed capacity to 354 MW.116 If the public school
system were to deploy an additional 4.95 MW of solar throughout 45 schools across the state,
solar schools would account for 13.3 MW (or 3.8 percent) of the state’s solar capacity. Although
these systems would represent only a small percentage of all the solar in the state – and an even
smaller proportion of the state’s total renewable energy generation – the benefits to the schools
hosting these systems could be significant.
115 According to the NREL PVWatts Calculator, available at http://pvwatts.nrel.gov/pvwatts.php. Assumes a system
installed in the Baltimore area with tilt of 30 degrees. All other inputs are PVWatts defaults. 116 SEIA/GTM Research. (2015). U.S. Solar Market Insight: Q1 2015. Available at: www.seia.org/research-
resources/us-solar-market-insight

42
In order to illustrate the benefits of solar on K-12 schools at a level of refinement beyond that
achievable in the Brighter Future report, The Solar Foundation collected 12 consecutive months
of electricity utility bill data from Bowie High School in Prince George’s County and produced a
system production and financial analysis using the NREL System Advisor Model (SAM).117 This
analysis found that a 518 kW solar PV system would produce over 690,000 kWh of
electricity in its first year of operation (nearly 29 percent of that used by the school on an
annual basis), providing Bowie High School with a net present value of up to $617,000 over
30 years and a payback period of 8.8 years.
According to the NREL Jobs and Economic Development Impacts (JEDI) model,118 such a
project would support 7.7 full-time equivalent (FTE) workers during the construction
period, who would receive $433,200 in combined wages. Total economic output from the
construction and installation period of the project is just over $1 million. The project would
support a combined total of 3 FTEs over the course of the 30-year operations period (i.e., 0.1
FTE per year). Combined worker earnings over this period would total $251,700, with a total
economic output of $416,400.
The 690,000 kWh of annual solar electricity produced by the system would offset 476 metric
tons of CO2e emissions each year, equivalent to taking 100 passenger vehicles off the road for a
year or the annual carbon sequestration potential of 390 acres of U.S. forests.119 This amount of
generation would also reduce annual NOx emissions by over 1,000 pounds and SO2 emissions by
almost 20 pounds.120 Finally, the electricity generated by the project would save over 140,000
gallons of water each year.121
117 National Renewable Energy Laboratory. System Advisor Model 2014.1.14. Available at: https://sam.nrel.gov/ 118 National Renewable Energy Laboratory. Jobs and Economic Development Impact Models (JEDI). Available at:
http://www.nrel.gov/analysis/jedi/ 119 Environmental Protection Agency. “Greenhouse Gas Equivalencies Calculator.” Available at
www.epa.gov/cleanenergy/energy-resources/calculator.html 120 According to the Environmental Protection Agency’s “eGRID Year 2010 Data Files”, available at:
www.epa.gov/cleanenergy/energy-resources/egrid/. Figures cited assume solar offsets electricity from existing
Maryland natural gas plants at the median emissions rates of these facilities. 121 Macknick, J. Newmark, R., Heath, G, and Hallett, K C. (2012). Operational water consumption and withdrawal
factors for electricity generating technologies: a review of existing literature. Environmental Research Letters, 7
(2012). Available at: http://iopscience.iop.org/1748-9326/7/4/045802

43
Table 12. Bowie High School Solar Project Modeling Assumptions
Recognizing that the installed cost assumption included in the SAM analysis represents an
average for the state – suggesting some schools may face higher prices – we performed a
sensitivity analysis to estimate system production and investment value across a number of price
points. The results of the sensitivity analysis, which show that even installed costs as high as
$2.85 per watt would yield a significant positive net present value, are shown in Table 13 below.
Table 13. Installed Cost Sensitivity Analysis for Bowie High School Solar Project
Results Installed Cost Assumptions
$2.07/W $2.25/W $2.50/W $2.85/W
Net Present Value $617,000 $527,918 $404,193 $230,978
Payback Period 8.8 years 9.5 years 10.6 years 12.0 years
SAM and JEDI Modeling Assumptions
Weather Station: USA MD Baltimore (TMY 2)
System Size: 518 kWdc (estimate based on student body size from Brighter
Future)
Tilt: 30 degrees
Azimuth: 158 degrees
Installed Cost: $2.07/Watt (average reported MD non-residential price in
SEIA/GTM Research Solar Market Insight 2014 Year in Review)
O&M Costs: $20/kW/year
Degradation Rate: 0.5% per year
Financing: 100% debt; 6% loan rate for 20 year term (consistent with tax-
exempt lease-purchase financing); 100% exemption from property
and sales taxes
Analysis Period: 30 years
Inflation Rate: 2.5% per year
Real Discount Rate: 5% per year
Nominal Discount
Rate:
7.63% per year
Incentives: Performance-Based Incentive of $0.07/kWh. Represents a weighted
average value of revenue from solar renewable energy certificate
(SREC) value over 30 years.
Rate Schedule: BGE Commercial Schedule GL (Secondary Voltage)
Net Metering: Enabled; Net Excess Generation valued at $0.0807/kWh (the energy
commodity supply rate from latest BGE utility bills)
Annual Electricity Cost
Escalation:
0.6% (EIA 2015 Annual Energy Outlook estimate through 2040)
Percentage of Materials
Purchased Locally:
25%
Construction Worker/
Installer Wages
$22.67 (average wage for Maryland installers from Maryland Solar
Jobs Census)
44
Financing Mechanisms
As solar installations typically represent a large upfront investment, financing remains one of the
biggest barriers to going solar, especially for schools and districts with limited budgets.
Fortunately, there are a number of options available for financing solar on public K-12 schools in
Maryland. While not intended to be an exhaustive list of financing mechanisms for solar on
schools, the options listed below represent some of the most feasible and easily accessible
options for Maryland schools and districts.
Private Financing Options
Several private financing options exist for school districts to leverage external funds. The leading
private option for many school districts, and in fact the most common form of solar school
financing, is third-party ownership through power purchase agreements. Financing solar through
energy services performance contracts can also be another strategy for overcoming the high
upfront cost barrier.
Third Party Ownership - Power Purchase Agreements (PPA)
Power purchase agreements (PPAs) are a type of third-party ownership financing mechanism
where a solar developer owns, operates, and maintains a solar PV system, and then sells the
electricity produced by the system to the host (such as a K-12 school) over a fixed term at a
predetermined rate. PPAs remain one of the most popular financing mechanisms for schools
(with approximately one-third of school installations 200 kW or greater in size financed through
PPAs), as these agreements allow customers to go solar at low or no upfront cost, which is
attractive given the high upfront cost of solar systems. In addition, PPAs can provide solar
customers with a lower degree of risk, as the PPA provider is typically responsible for
guaranteeing a minimum level of electricity production, and must pay for any shortfalls even if
the providers must purchase more expensive power from the utility during these periods.122 PPAs
also allow for solar developers or investors to leverage the federal investment tax credit (ITC) –
an income tax credit equal to 30 percent of total system installation costs – as well as accelerated
depreciation benefits, which combined can reduce system costs by up to 55 to 60 percent. As
public schools do not pay income taxes, these solar customers would otherwise be unable to take
advantage of these solar tax incentives. Additionally, because PPAs typically range from 10 to
25 years in length, schools can purchase electricity at more stable and even lower rates over time,
as electricity prices are determined when the agreement is signed. Electricity prices can be
determined based on a rate escalation schedule, where the annual price per kilowatt-hour of
electricity increases 2-5 percent or a fixed rate schedule for the entire term of the PPA.123
Another benefit attached to PPAs is that under these agreements, the solar developer is
responsible for system operations and maintenance work.
122 Coughlin, J., and A. Kandt. (2011). Solar Schools Assessment and Implementation Project: Financing Options
for Solar Installations on K-12 Schools. National Renewable Energy Laboratory (NREL/TP-7A40-51815).
Available at: www.nrel.gov/docs/fy12osti/51815.pdf 123 Ibid.

45
Several public school districts and counties, such as Caroline, Cecil, Dorchester, Harford, Kent,
Montgomery, and St. Mary’s, have used PPAs in the past to help finance their solar energy
systems. For more information about these schools, please see the list of press releases in the
appendix.
Getting Started with a Power Purchase Agreement
There are several resources available to help local governments and school districts understand
the PPA process, including The Solar Foundation's Steps to a Successful Solar Request for
Proposal,124 and the National Renewable Energy Laboratory's (NREL) Power Purchase
Agreement Checklist for State and Local Governments.125 The Interstate Renewable Energy
Council (IREC), under the SunShot Solar Outreach Partnership program, has developed a PPA
Toolkit designed to help local governments and other public entitles overcome the common
challenges and costs associated with PPAs.126 This comprehensive, user-friendly guide is an
excellent resource through which school districts can learn about procuring solar under a PPA,
with annotated model PPA documents and templates, and general guidance on request for
proposal design and implementation. In addition, NREL’s Solar Access to Public Capital
(SAPC) working group has developed model PPA and lease contracts to serve as templates for
commercial solar customers and installers.127 Learning from the numerous experiences of other
Maryland solar schools can also be useful in understanding more nuanced opportunities for (or
challenges to) solar deployment.
If school districts decide to finance a solar installation through a PPA, a number of solar
developers are available to work with school districts throughout Maryland. Schools can identify
solar companies in their area through the Solar Energy Industries Association’s “National Solar
Database” (www.seia.org/research-resources/national-solar-database) or on the “Find a Solar
Professional” page on the Maryland-DC-Virginia Solar Energy Industries Association (MDV-
SEIA) website (http://mdvseia.org/directory/).
Energy Services Performance Contracts (ESPCs)
Energy services performance contracts (ESPCs) can also provide schools with another means of
financing solar projects. ESPCs are an agreement between a client and an energy services
company (ESCO), and while ESPCs typically involve energy efficiency measures with short
payback periods, solar PV installations can be included in these contracts as well. The process of
completing an ESPC is relatively straightforward: school district members approach an ESCO to
124 The Solar Foundation. (2012). Steps to a Successful Solar Request for Proposal. Available at:
www.thesolarfoundation.org/steps-to-a-successful-solar-request-for-proposal/ 125 National Renewable Energy Laboratory. (2009). Power Purchase Agreement Checklist for State and Local
Governments (NREL/FS-6A2-46668). Available at: www.nrel.gov/docs/fy10osti/46668.pdf 126 Interstate Renewable Energy Council. (2015). Solar Power Purchase Agreement: A Toolkit for Local
Governments. Available at http://solaroutreach.org/wp-content/uploads/2015/04/FINALFINALNew-
Cover_041015.pdf 127 National Renewable Energy Laboratory. (2014). Renewable Energy Project Finance – Solar Securitization and
the Solar Access to Public Capital (SAPC) Working Group. Available at:
https://financere.nrel.gov/finance/content/solar-securitization-and-solar-access-public-capital-sapc-working-group

46
perform a comprehensive energy audit of a specific, or set of, school(s) to identify and
implement a number of energy-saving measures. Through an ESPC, the ESCO often covers the
upfront cost of these measures, receiving compensation in the form of a portion of the energy
cost savings achieved through the upgrades. After the length of the contract is over, the school
will be able to accrue all the cost savings.128 Under ESPCs, school districts can finance a solar
system by paying for the project themselves, or working directly with the ESCO to arrange for
upfront financing.129
As an example, Mahopac Central School District in Mahopac, New York approached ConEdison
Solutions (CES) in April 2008 to complete an energy audit on the district’s six schools and two
administrative offices. CES implemented several energy savings projects including lighting and
heating upgrades, building envelope infrastructure improvements, and a solar PV system
installation. CES guaranteed the district $546,000 in annual savings.130
Getting Started with an Energy Services Performance Contract
In Maryland, seven ESCOs have worked with the Department of General Services (DGS) and
Maryland Energy Administration (MEA) to qualify under the state's existing Indefinite Delivery
Contract (IDC).131 Under an IDC, ESCOs are prequalified by the state to help accelerate vendor
selection timelines by allowing government agencies to bypass much of the traditional
procurement process. While principally designed to support energy performance contracting for
state agencies, local governments can utilize the IDC for their own large-scale energy
improvement projects. Under the IDC process, an ESCO submits a proposal to complete a
feasibility study and to develop a guaranteed savings program. Once the proposal is accepted and
a fee negotiated, the ESCO performs the proposed study and identifies project costs and
guaranteed annual energy savings. If the feasibility study shows the project will delivered the
desired savings and meet other project objectives, the ESCO can proceed to the construction
phase. If not, the ESCO must cover the cost of the study.132 However, school districts still have
the option to pursue ESPCs through more usual means, i.e., by issuing an request for proposal to
solicit bids from other ECSOs.
For those interested in learning more about ESPCs, the Pacific Northwest National Laboratory
and Portland Energy Conservation, Inc. have prepared a guide titled A Guide to Performance
128 U.S. Department of Energy – Office of Energy Efficiency & Renewable Energy. (2015). Energy Savings
Performance Contracts. Available at: http://energy.gov/eere/femp/energy-savings-performance-contracts 129 U.S. Department of Energy – Office of Energy Efficiency & Renewable Energy. (2015). Energy Savings
Performance Contracting. Available at: http://energy.gov/eere/slsc/energy-savings-performance-contracting 130 ConEdison Solutions Inc. (2011). Mahopac Central School District (CSD) Cast Study. Retrieved from:
http://energyservicescoalition.org/Data/Sites/1/documents/casestudies/Mahopac%20Central%20School.pdf 131 Maryland Energy Administration. (2015). Energy Performance Contracts. Available at:
http://energy.maryland.gov/Govt/epc/ 132 Maryland Energy Administration. (2015). Energy Performance Contracting. Available at:
http://energy.maryland.gov/incentives/allprograms/epc/energy_performance_contracting.pdf

47
Contracting with ESCOs,133 which provides a general overview of ESCOs and the ESPC
process. In addition, the Maryland Energy Administration (MEA) has a state-specific Guide for
Energy Performance Contracting for Local Governments – as well as template requests for
proposals (RFPs) for these contracts – available on their website.134 And finally, the North
Carolina Clean Energy Technology Center has a guide on performance contracting for local
governments, including case studies of successful public projects, available through the SunShot
Solar Outreach Partnership.135
Public Finance Programs
In addition to private financing options, numerous public incentives and financing mechanisms
exist for schools to defray costs before and after a solar energy system has been installed.136
These include tax credits, deductions, and exemptions, as well as grants, loans, rebates, and
bonds.
MCEC’s Maryland Capital Program (MCAP)
The Maryland Clean Energy Center’s (MCEC) Maryland Capital Program (MCAP) allows
schools to leverage the private bond market and borrow funds at low interest rates for energy
efficiency projects.137 This program relies on energy services performance contracts, but instead
of working directly with an ESCO to arrange funding, schools approach MCEC to finance the
project. MCEC finances these systems by selling tax-exempt bonds on the private bond market,
raising project capital which is then passed onto the ESCO periodically to finance the project.
Under MCAP, MCEC writes up one performance contract with the ESCO and one energy
savings contract with the client or school. A performance contract with the ESCO ensures that
the ESCO can provide energy savings to the school and will be responsible for any short-falls in
savings. Additionally, the ESCO is responsible for completing, measuring and verifying actual
energy savings after the project is completed. A shared energy savings agreement with the client
(e.g., school or municipality) states the school is responsible for bond payments to MCEC, with
any excess in energy savings beyond bond payments retained by the client.
133 Baechler/ Pacific Northwest National Laboratory, M., and Webster/Portland Energy Conservation, Inc., L. (2011)
A Guide to Performance Contracting with ESCOs (PNNL-20939). Available at:
www.pnnl.gov/main/publications/external/technical_reports/PNNL-20939.pdf 134 Maryland Energy Administration. (2015). Energy Performance Contracting Assistance Program. Available at:
http://energy.maryland.gov/Education/EnergyPerformanceContractingAssistanceProgram.htm. See under
Resources. 135 North Carolina Clean Energy Technology Center. (2014). Integrating Solar PV Into Energy Services
Performance Contracts: Options for Local Governments Nationwide. Available at:
http://icma.org/en/icma/knowledge_network/documents/kn/Document/306953/Integrating_Solar_PV_into_Energy_
Services_Performance_Contracts 136 North Carolina Clean Energy Technology Center. (2015). Maryland Net Metering. Available at:
http://programs.dsireusa.org/system/program/detail/363 137 Maryland Clean Energy Center. (2014). MCEC Maryland Clean Energy Capital Financing Program FAQs.
Available at: www.mdcleanenergy.org/maryland-clean-energy-capital-financing-program-FAQs

48
Benefits of financing solar through the MCAP are similar to those of completing an ESPCs,
including a reduced burden on schools to raise their own project capital and the ability for utility
cost savings to go towards bond obligations to MCEC.138 The school does not incur any
additional debt, as MCEC owns the solar installation, and the bond rates are generally attractive
relative to other sources of capital, at typically three to four percent for an average of ten
years.139
MCEC’s MCAP has completed three energy efficiency and conservation projects at the
University of Maryland – Baltimore County, Coppin State University, and the National
Aquarium, ranging from $3.4 to $6.2 million projects, but no school district has yet approached
MCEC to pursue a solar school project under MCAP.140
Getting Started with the Maryland Capital Program
To learn more about how a school district can take advantage of MCAP, schools or districts can
visit the program webpage at www.mdcleanenergy.org/maryland-clean-energy-capital-financing-
program-FAQs, which contains additional program details as well as contact information for
program staff who can answer questions and provide guidance on next steps. In addition, MCEC
may be able to provide case studies of successful projects funded under the program, as well as
insight on commonly proposed projects and example cost savings for different project types.
Schools or districts interested in pursuing projects under MCAP must partner with an ESCO to
complete a feasibility analysis on the site(s) before approaching MCEC. Once such an analysis
has been completed, MCEC will be able to provide school districts and the participating ESCO
with the next steps moving forward, if both parties agree to complete the projects under MCAP.
Qualified Energy Conservation Bonds (QECBs)
Qualified Energy Conservation Bonds (QECBs) are taxable bonds issued by the U.S. Department
of Treasury with reduced interest rates for state and local governments.141 QECBs were
originally authorized by Congress in the 2008 Energy Improvement and Extension Act, and later
the American Recovery and Reinvestment Act of 2009, to finance renewable energy and energy
efficiency projects. Most of these bonds are direct subsidy bonds where bond issuers (such as a
local school district) receive cash rebates from the Treasury to subsidize their net interest
payments on the bond. Another option is for bond holders to receive tax credits. Bond holders
make a payment of the lower amount of the interest on the issuance, or 70 percent of the
‘qualified tax credit rate’, which is set periodically. QECBs may be attractive for local
government renewable energy projects, as these bonds can allow for borrowing large sums of
money at lower interest rates than traditional bonds.
138 W. Shiplett, Personal Communication. March 2015. 139 Maryland Clean Energy Center. (2014). MCEC Maryland Clean Energy Capital Financing Program FAQs.
Available at: www.mdcleanenergy.org/maryland-clean-energy-capital-financing-program-FAQs 140 W. Shiplett, Personal Communication. March 2015. 141 Energy Programs Consortium. (2014) Qualified Energy Conservation Bonds (QECBs). Available at:
www.energyprograms.org/wp-content/uploads/2015/01/FINAL-QECB-Paper-December-2014-.pdf

49
In 2009, Congress allocated $58,445,000 in bond authority to the State of Maryland. As of
December 2014, only 18 percent ($10,665,000) of this had been used: $6.5 million to finance
capital improvements at St. Mary’s County Public Schools and $4.165 million to finance an
equipment lease-purchase for Montgomery County.142 The majority of the bond authority
earmarked for the State was allocated to large local governments with a population of 100,000 or
greater (Table 14). However, much of this has gone unused due barriers including budget
concerns, relatively small sub-allocation amounts to local governments, and difficulty navigating
the QECB application process.
Table 14. Remaining Maryland QECB Sub-Allocations
Local Government Amount
Anne Arundel County $5,324,796
Baltimore City $6,659,180
Baltimore County $8,188,030
Carroll County $1,761,908
Charles County $1,463,345
Frederick County $2,340,341
Harford County $2,499,895
Howard County $2,850,689
Montgomery County $9,793,890
Prince George’s County $8,662,178
St. Mary’s County $1,044,425
Washington County $1,508,357
Balance to State $6,347,968
Small sub-allocations are a common problem because small allocations often mean smaller-sized
projects, and therefore a higher ratio of transaction costs (which remain relatively fixed
regardless of issuance size) to capital raised.143 As a result, many local governments in Maryland
hold on to their allocations without completing any qualified projects, and furthermore, are often
hesitant to direct their allocations back to the state because of the perceived loss of funds without
any beneficial gains in return.144 Strategies for overcoming this barrier include bundling QECBs
with issuances of other bonds or pooling allocations with other jurisdictions, both of which can
help spread transaction costs over a larger amount of project capital.145
Another common barrier for local governments is the lengthy and often difficult QECB
application process, and many municipalities simply choose other projects that have easier and
more streamlined application processes over school energy projects.146 In addition, local
142 Ibid. 143 Ibid. 144 D. Bresette. Personal Communication. January 21, 2015. 145 Ibid. 146 Ibid.

50
governments may have budget concerns or wish to avoid what they perceive as risky or
unfamiliar projects like solar installations.
However, these barriers should not discourage Maryland public school counties from using
QECBs to fund solar projects. In 2011 and 2012, solar installations at six California high schools
came online in Oxnard Union High School District, financed largely with QECBs. In 2010, the
district began looking for relief from its $1.3 million electricity bill in the face of a decreasing
general fund, as well as for ways to reduce the district’s reliance on fossil fuels.147 The
installations were financed with $19 million in QECBs, along with $6 million in Measure H
General Obligation Bond funds. The project was also eligible for an additional $6 million in
California Solar Initiative rebates, payable for five years after the project's completion.148 While
the solar energy policies in California were certainly different than those found in Maryland, one
cannot ignore the opportunity for public school districts to take advantage of QECBs to finance a
solar energy system, especially in conjunction with other financing mechanisms.
Getting Started with a Qualified Energy Conservation Bond
A good first step in financing solar using QECB’s is to review the Energy Programs
Consortium’s (EPC) biannual Qualified Energy Conservation Bonds report on the current status
of QECBs.149 This resource lays out the details of QECBs, as well as common barriers and
solutions to QECB issuances in communities around the nation. The report also lists case studies
of various completed projects, new projects that have since come online from the last published
report, and the remaining QECB amount for project allocation in each state.
Solar Renewable Energy Certificates (SRECs)
Maryland’s Renewable Energy Portfolio Standard (RPS) requires 20 percent of the state’s
electricity to be generated from renewable energy by 2022 and every year thereafter, including
two percent for solar energy by 2020. This two percent solar ‘carve-out’ gave rise to a market for
Solar Renewable Energy Certificates (SRECs), which provide solar customers (including
schools) another financing method to recoup costs following project completion. Certificates are
created for every megawatt-hour (MWh) of solar energy generated, and traded in the open
market per the state's RPS. School districts can sell SRECs to retail electricity suppliers or
investor-owned utilities, who are required to retire a certain number of these certificates to be in
compliance with the law. In late May 2015, Maryland SRECs were selling for $170 per MWh,
with the current theoretical price ceiling, or Solar Alternative Compliance Payment (SACP), at
$350 per MWh.150 This price ceiling is expected to decline steadily through 2023, when it will
be set at $50 per MWh permanently thereafter.151
147 Zoltak, J. (2011, October 21). Nearly $4 million solar field opens behind Oxnard High. Ventura County Star.
Retrieved from: www.vcstar.com/news/education/new-4-million-solar-field-opens-behind-oxnard 148 Ibid. 149 Energy Programs Consortium. (2014) Qualified Energy Conservation Bonds (QECBs). Available at:
www.energyprograms.org/wp-content/uploads/2015/01/FINAL-QECB-Paper-December-2014-.pdf 150 Based on latest MD SREC bid prices published by SRECTrade at www.srectrade.com/srec_markets/maryland 151 North Carolina Clean Energy Technology Center. (2015). “Solar Renewable Energy Certificates.” Available at:
http://programs.dsireusa.org/system/program/detail/5688

51
Although SRECs can be used as a financing mechanism for solar school projects, school districts
may be hesitant to completely rely on SRECs due to fluctuating trading prices that are difficult to
predict over time. Should actual SREC prices prove to be lower than those included in the solar
contractor’s financial analysis, actual system cost savings may be lower than anticipated. Though
SREC markets in some states have experienced some volatility in recent years (such as New
Jersey, which saw prices plummet from over $600 to less than $200 in just a few months in
2011),152 Maryland has enjoyed a fairly stable SREC market over the past several years, with
prices consistently in the $120-140 range until very recently, when the beginning of 2015 saw a
sharp uptick in prices.153 In fact, SRECTrade, a leading SREC transaction and management firm,
notes that the Maryland SREC market has been “relatively stable since its inception in 2008.”154
Getting Started with Solar Renewable Energy Certificates
More information on SRECs can be found in NREL's Solar Renewable Energy Certificate
(SREC) Markets: Status and Trends,155 as well as through SRECTrade156 or Flett Exchange.157
Solar installations in Maryland will only begin producing SRECs once the system has been
certified by the Maryland Public Service Commission158 and is registered under the PJM-EIS
Generation Attribute Tracking System.159
Solar Collaborative Procurement
Although not a financing mechanism in itself, school districts have the option to collaboratively
purchase solar together. Solar collaborative purchasing addresses the issues of high transaction
costs, a potentially long procurement learning curve, and fragmented solar demand among many
individual sites.160 One of the main benefits of collaborative purchasing is the ability for one or
more school districts to lower overall costs through economies of scale, as larger projects have
smaller transaction costs per watt installed. Bundled projects also allow for collaboration
between individuals with diverse experiences in the solar energy industry, and access to a larger
pool of resources from different stakeholders in the project, and as a result lower overall project
risk.
152 SRECTrade. (2011, September 14). New Jersey looks to address SREC volatility, but does it know where to
look? [Blog Post]. Retrieved from: www.srectrade.com/blog/srec-markets/new-jersey/new-jersey-looks-to-address-
srec-volatility 153 SRECTrade. (2015, May 19). PA, NJ, and MD Solar REC Update. [Blog Post]. Retrieved from:
www.srectrade.com/blog/srec/srec-markets/maryland 154 SRECTrade. Maryland. Available at: www.srectrade.com/srec_markets/maryland 155 Bird, L., Heeter, J., and Kreycik, C. (2011). Solar Renewable Energy Certificate (SREC) Markets: Status and
Trends (NREL/TP-6A20-52868). Available at: www.nrel.gov/docs/fy12osti/52868.pdf 156 SRECTrade. (2015). Available at: www.srectrade.com 157 Flett Exchange. (2015). Available at: www.flettexchange.com/ 158 Maryland Public Service Commission. (2015). Renewable Portfolio Standard Documents. Available at:
http://webapp.psc.state.md.us/intranet/electricinfo/home_new.cfm 159 PJM Environmental Information Services (EIS). (2015). Available at: http://www.pjm-eis.com/ 160 Goodward, J., Massaro, R., Foster, B., and Judy, C. (2011). Purchasing Power: Best Practices Guide to
Collaborative Solar Procurement. Retrieved from the World Resources Institute website:
www.wri.org/sites/default/files/pdf/purchasing_power.pdf
52
In 2010, the U.S. Environmental Protection Agency (EPA), the Metropolitan Washington
Council of Governments (MWCOG) and Optony, Inc. launched an initiative to collaborative
procure a large number of solar projects in the metro Washington, DC area (including
neighboring areas in Maryland and Virginia). This effort ultimately identified four organizations
(three in Washington D.C., and one in Montgomery County, MD) that are suitable for solar, and
these organizations are currently soliciting proposals for project developers for a number of sites,
including a bid for nearly 30 Washington D.C. public school buildings.161 As another example, in
2011 the San Ramon Valley Unified School District in Alameda County, California joined five
schools together to install solar carports designed to meet two-thirds of the district's electricity
needs and save over $11.6 million over 20 years. The district leveraged $25 million in Qualified
School Contraction Bond (QSCB), and contracted with SunPower for the design and
construction of the 3.3 MW system.162
Getting Started with Collaborative Procurement
Solar collaborative purchasing may be difficult for schools because multiple school districts need
to agree to pool resources together for the development of multiple solar schools project, which
may span across different regions of the state. However, numerous resources exist for those
interested in working with other school districts, including Purchasing Power: Best Practices
Guide to Collaborative Solar Procurement from the World Resources Institute.163
Community Shared Solar
Community shared solar allows multiple community members, organizations, or companies to
pool investments and resources to share one local energy system. Community shared solar is
particularly important to those unable to install solar energy systems on their own sites, which
may have too much shade or otherwise be inadequate sites for solar, may be rented as opposed to
owned properties, or may have owners unable to afford the cost of a full system. Currently, there
are 13 states and the District of Columbia with enacted shared solar and renewable policies, with
three other states currently with active campaigns proposing such policies.164 Solar schools have
also been financed with community solar, such as Sidwell Friends School in Washington, D.C.
The school installed a 120 panel system on the Lower School, with funding provided by the
School's alumni who can purchase "solar bonds" in $5,000 increments and receive a three
percent annual return for an estimated of ten years. Through community solar, Sidwell Friends
School had no upfront costs to install the system, and after the investors are paid off, will receive
free and clean renewable energy for the 30 year expected lifetime of the project.165
161 District of Columbia, Department of General Services. (2015, March 25). Request For Proposals On-Site Solar
Power Purchasing Agreement. Solicitation Number: DCAM-14-CS-0123. Available at: http://dgs.dc.gov/ 162 San Ramon Valley Unified School District. (2015). Solar Overview. Available at: www.srvusd.net/solar 163 Goodward, J., Massaro, R., Foster, B., and Judy, C. (2011). Purchasing Power: Best Practices Guide to
Collaborative Solar Procurement. Retrieved from the World Resources Institute website:
www.wri.org/sites/default/files/pdf/purchasing_power.pdf 164 Shared Renewables HQ. (2015). USA Shared Energy Map. Available at:
www.sharedrenewables.org/community-energy-projects/ 165 Sidwell Lower School. (2010). New “Solar Bonds” to Pay for Lower School’s Solar Panels. Available at:
www.sidwell.edu/news/article/index.aspx?pageaction=ViewSinglePublic&LinkID=20449&ModuleID=640

53
Getting Started with Community Shared Solar
On May 12, 2015, Maryland enacted legislation to create a three-year community shared solar
pilot program. The Maryland Public Service Commission will soon begin developing and
adopting regulations governing the program, after which applications can be made for
interconnection and operation of community shared solar projects.166
Conclusion
The potential for additional Maryland K-12 schools to go solar is significant. Fully tapping this
potential by installing solar on the more than 1,200 public schools that can go solar cost-
effectively would add nearly 123 MW of new solar capacity across the state – a figure equal to
just over 50 percent of all the solar capacity installed in Maryland to date. As this report has
demonstrated, such solar growth would deliver significant economic, environmental,
educational, and other benefits to schools and the surrounding communities. The 142,500 MWh
of electricity that would be produced by these systems each year – enough to power around
12,000 average Maryland homes – would be valued at $15.8 million annually and offset over
98,000 metric tons of carbon dioxide. This new source of demand for solar would also support
construction and operations and maintenance jobs across the state, resulting in a total of $270
million in economic activity. Finally, the integration of solar energy systems on K-12 schools
into STEM curricula can also help increase student performance or interest in these subjects.
Because school and district resources are limited, this report has attempted to more narrowly
target solar deployment to counties and school districts where the benefits of solar would be
most felt. And while it is certain that not all these public schools will deploy solar immediately,
or even over the next five years due to roof age or other physical limitations, the start of a solar
schools conversation in Maryland is necessary. Given the significant benefits of solar schools, as
well as the many public and private financing options available to schools to overcome the high
upfront costs of solar systems, the local governments and school officials should consider a plan
to most appropriately bring solar to K-12 schools in Maryland.
Following the release of this report, The Solar Foundation will complete an educational
roadshow, traveling to a number of counties and offering school district members, city officials,
and community members the opportunity to hear about the solar school opportunities in their
county. Furthermore, through the Department of Energy's SunShot Solar Outreach Partnership,
The Solar Foundation will offer technical assistance support for local governments looking to
deploy solar at their schools.
166 General Assembly of Maryland. HB1087 – 2015 Regular Session. Available at:
http://mgaleg.maryland.gov/webmga/frmMain.aspx?pid=billpage&stab=01&id=hb1087&tab=subject3&ys=2015RS

54
Appendix
Solar Schools Financed with Power Purchase Agreements – Press Releases
This list includes a number of press releases from various news outlets identifying public schools
who have used, to some extent, power purchase agreements to finance their solar installations.
Caroline County – North Caroline High School
PPA with Washington Gas Energy Services, Inc. (WGES)
http://www.wglholdings.com/releasedetail.cfm?ReleaseID=687243
Cecil County Public Schools
PPA with Standard Solar, Inc.
http://standardsolar.com/about-us/news/press-releases/4805
Dorchester County – Mace’s Lane Middle School
PPA with Washington Gas Energy Services, Inc. (WGES)
http://www.wglholdings.com/releasedetail.cfm?ReleaseID=711359
Harford County Public Schools
PPA with SunEdison
http://andrewcassilly.com/downloads/Solar-panels-activated-at-six-local-schools_Aegis_6-17-
2011.pdf
Kent County – Kent County High School
PPA with Washington Gas Energy Services, Inc. (WGES)
http://www.wges.com/page/press_detail.php?p=99
Montgomery County Public Schools
PPA with SunEdison
http://www.montgomeryschoolsmd.org/press/index.aspx?pagetype=showrelease&id=2742&type
=archive&startYear=2009&pageNumber=3&mode
St. Mary’s County – George Washington Carver Elementary School
PPA with Standard Solar, Inc.
http://www.businesswire.com/news/home/20101201005488/en/St.-Mary%E2%80%99s-County-
Public-Schools-Solar-Perpetual#.VXCqbc9VhBc


