Download - BSA Antenna Theory 11_03
1DECIBEL® Base Station Antennas
Antenna TheoryBasic Principles for Daily Applications
November 2003
2DECIBEL® Base Station Antennas
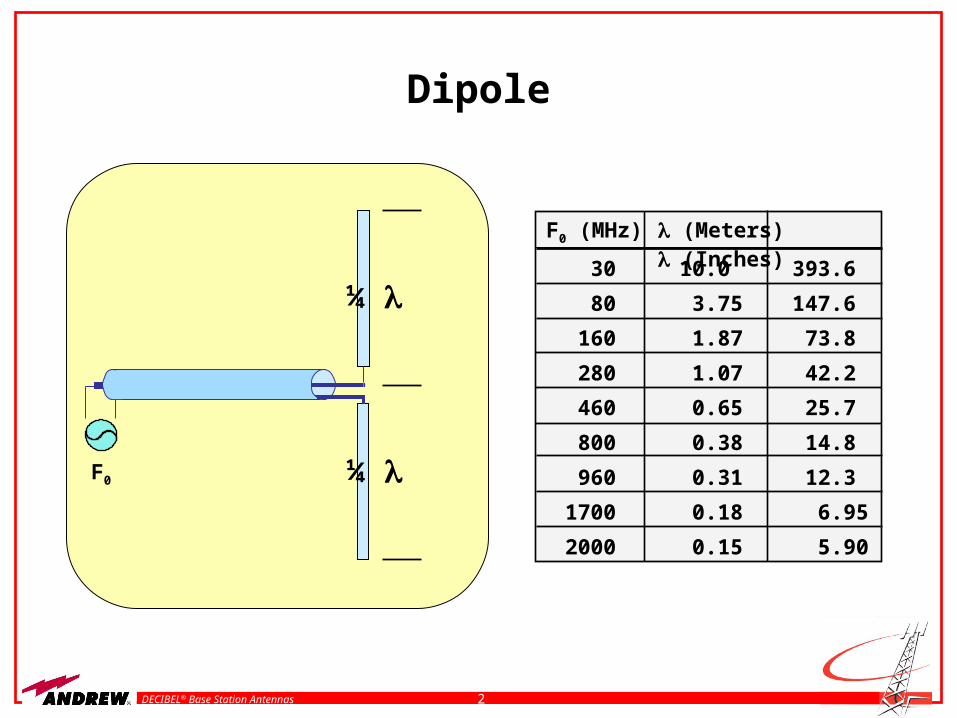
F0 (MHz) (Meters) (Inches)
30 10.0 393.6
80 3.75 147.6
160 1.87 73.8
280 1.07 42.2
460 0.65 25.7
800 0.38 14.8
960 0.31 12.3
1700 0.18 6.95
2000 0.15 5.90
F0 ¼
¼
Dipole
3DECIBEL® Base Station Antennas
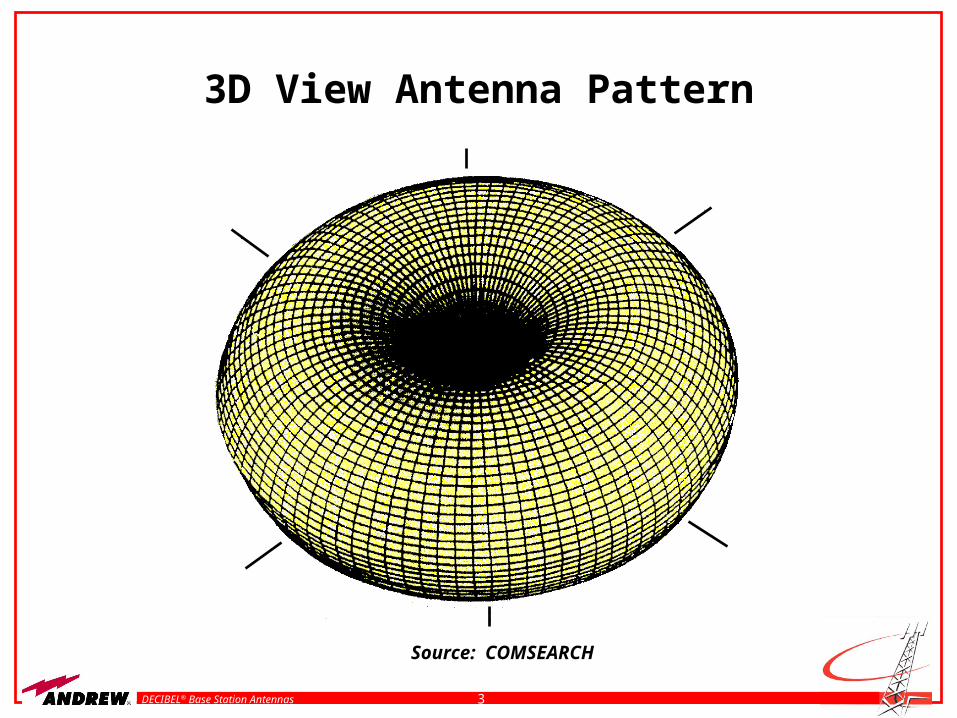
3D View Antenna Pattern
Source: COMSEARCH
4DECIBEL® Base Station Antennas
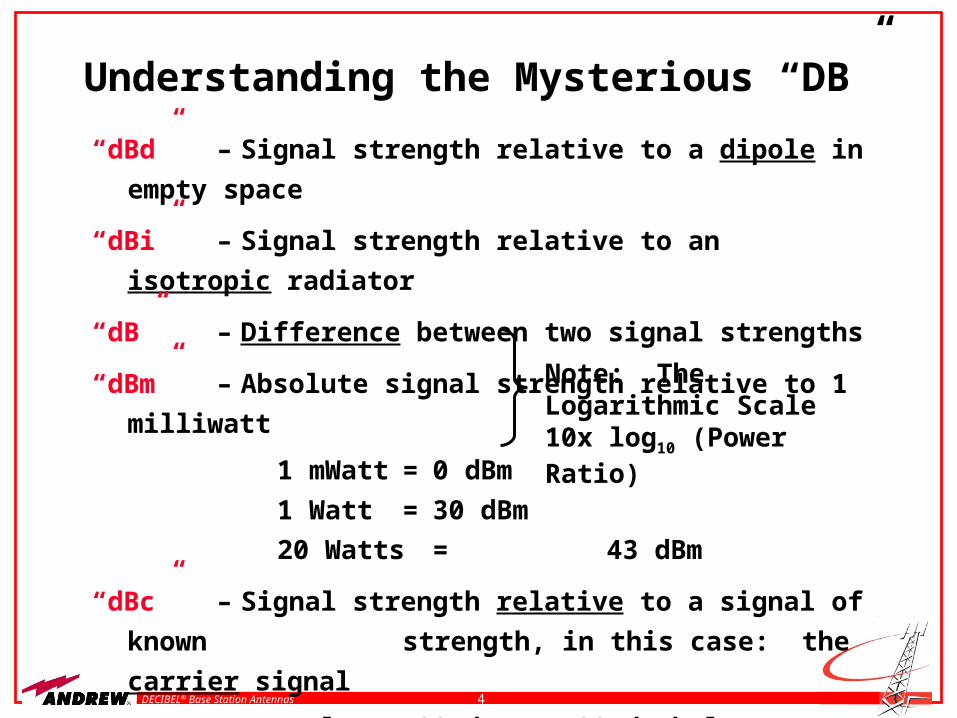
Understanding the Mysterious “DB”
“dBd” – Signal strength relative to a dipole in empty
space
“dBi” – Signal strength relative to an isotropic radiator
“dB” – Difference between two signal strengths
“dBm” – Absolute signal strength relative to 1 milliwatt
1 mWatt = 0 dBm
1 Watt = 30 dBm
20 Watts = 43 dBm
“dBc” – Signal strength relative to a signal of known
strength, in this case: the carrier signal
Example: -100 dBc = 100 dB below carrier signal
If carrier is 100 Watt = 50 dBm
-100 dBc = -50 dBm or 0.00001 mWatt
Note: TheLogarithmic Scale10x log10 (Power Ratio)
5DECIBEL® Base Station Antennas
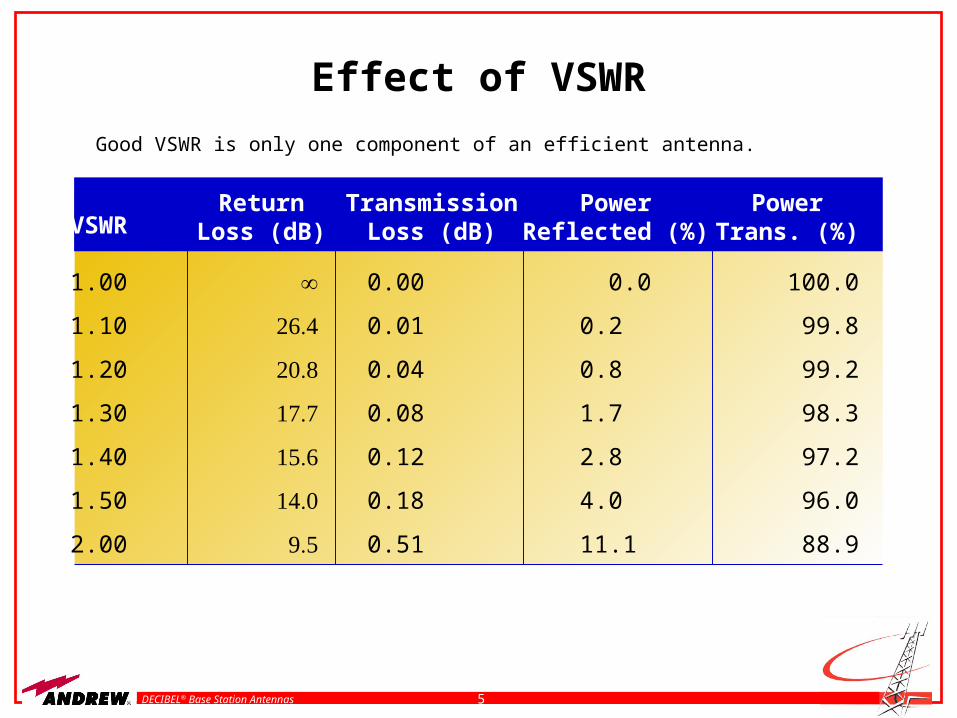
Effect of VSWR
VSWRReturn
Loss (dB)Transmission
Loss (dB)Power
Reflected (%)Power
Trans. (%)
1.00
1.10
1.20
1.30
1.40
1.50
2.00
0.00
0.01
0.04
0.08
0.12
0.18
0.51
0.0
0.2
0.8
1.7
2.8
4.0
11.1
100.0
99.8
99.2
98.3
97.2
96.0
88.9
Good VSWR is only one component of an efficient antenna.
6DECIBEL® Base Station Antennas
Shaping Antenna Patterns
Vertical arrangement of properly phased
dipoles allows control of radiation patterns
at the horizon as well as above and below
the horizon. The more dipoles are stacked
vertically, the flatter the vertical pattern is
and the higher the antenna coverage or
“gain” in the general direction of the
horizon.
7DECIBEL® Base Station Antennas
Shaping Antenna Patterns (cont . . .)
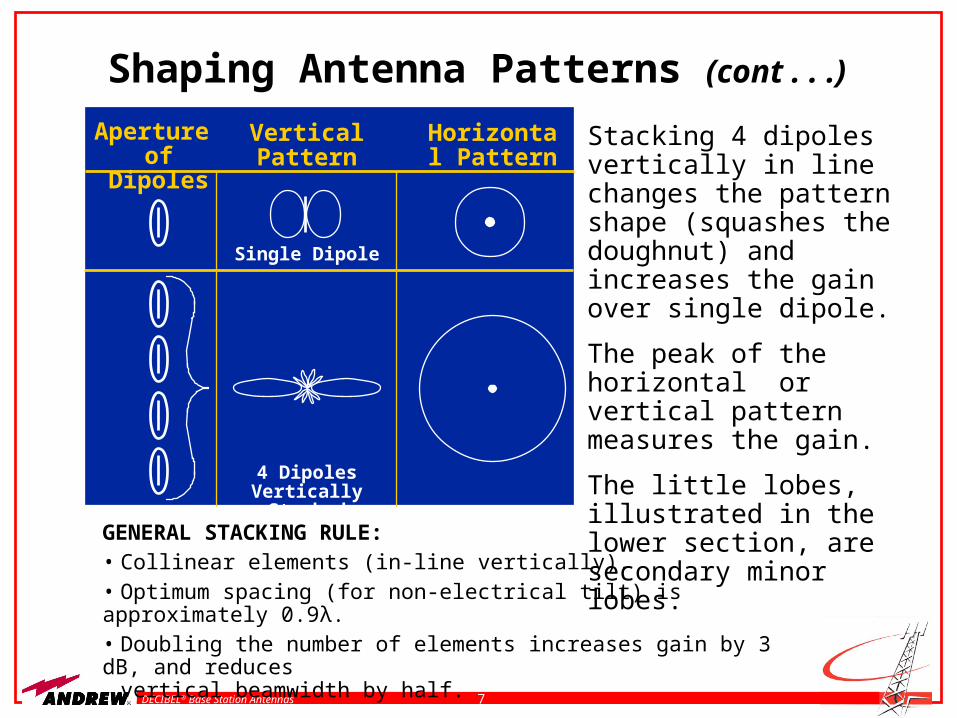
Stacking 4 dipoles vertically in line changes the pattern shape (squashes the doughnut) and increases the gain over single dipole.
The peak of the horizontal or vertical pattern measures the gain.
The little lobes, illustrated in the lower section, are secondary minor lobes.
Aperture of Dipoles
Vertical Pattern
Horizontal Pattern
4 Dipoles Vertically Stacked
Single Dipole
GENERAL STACKING RULE:• Collinear elements (in-line vertically).• Optimum spacing (for non-electrical tilt) is approximately 0.9λ.• Doubling the number of elements increases gain by 3 dB, and reduces
vertical beamwidth by half.
8DECIBEL® Base Station Antennas
Gain
What is it?Antenna gain is a comparison of the power/field characteristics of a device under test (DUT) to a specified gain standard.
Why is it useful?Gain can be associated with coverage distance and/or obstacle penetration (buildings, foliage, etc).
How is it measured?It is measured using data collected from antenna range testing. The reference gain standard must always be specified.
What is Andrew standard?Andrew conforms to the industry standard of +/-1 dB accuracy.
9DECIBEL® Base Station Antennas
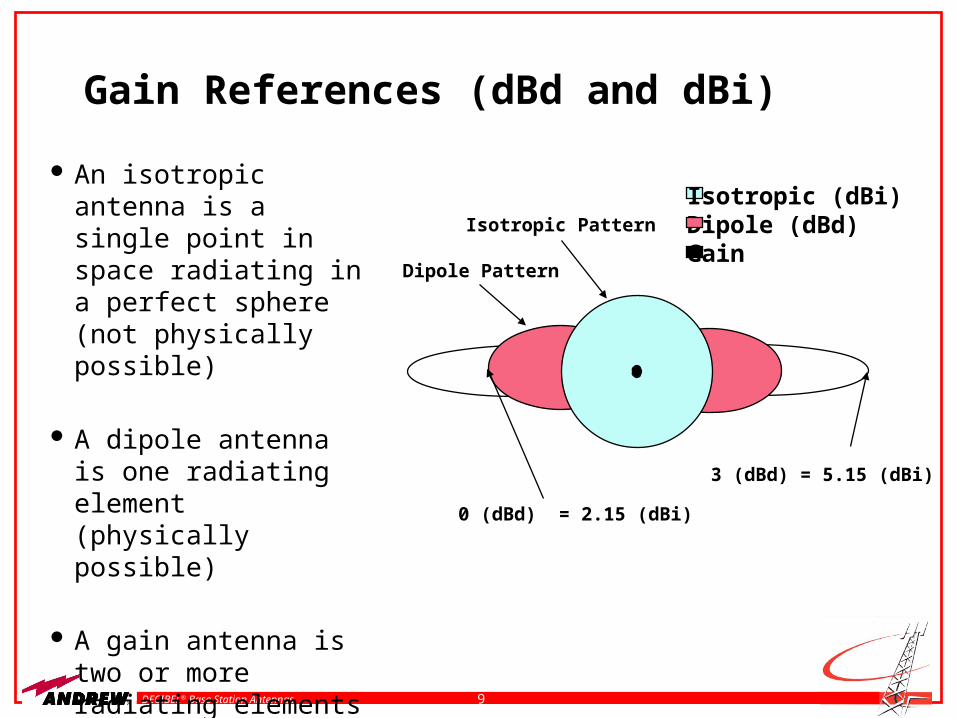
Gain References (dBd and dBi)
An isotropic antenna is a single point in space radiating in a perfect sphere (not physically possible)
A dipole antenna is one radiating element (physically possible)
A gain antenna is two or more radiating elements phased together
0 (dBd) = 2.15 (dBi)
Isotropic (dBi)Dipole (dBd)Gain
Isotropic Pattern
3 (dBd) = 5.15 (dBi)
Dipole Pattern
10DECIBEL® Base Station Antennas
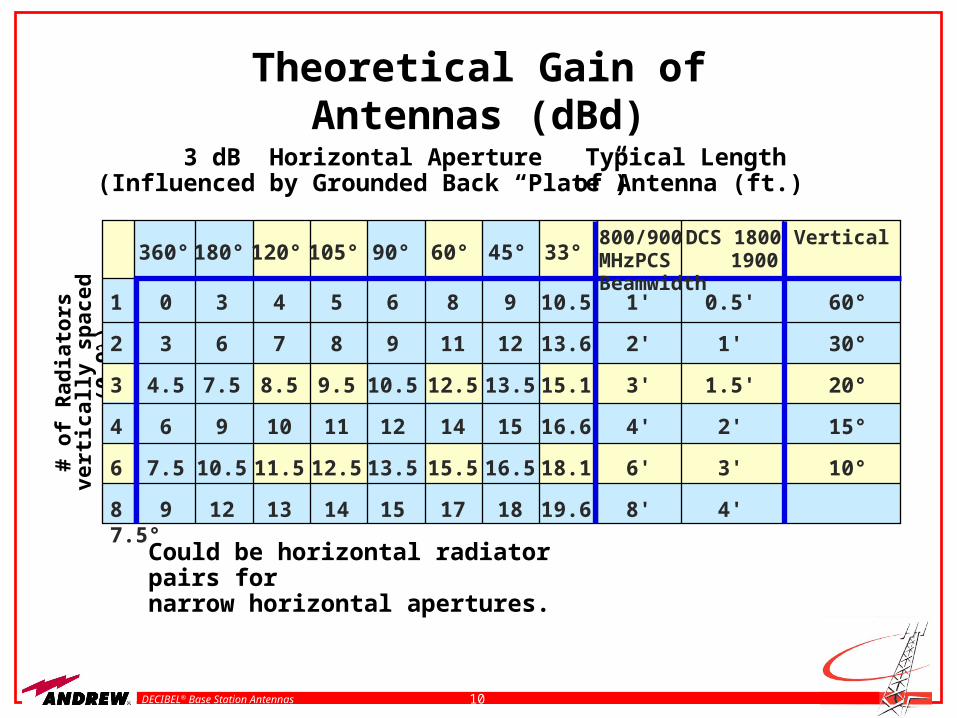
Theoretical Gain of Antennas (dBd)
Could be horizontal radiator pairs fornarrow horizontal apertures.
3 dB Horizontal Aperture(Influenced by Grounded Back “Plate”)
Typical Lengthof Antenna (ft.)
# o
f R
adia
tors
vert
ical
ly s
pac
ed (
0.9
)
800/900DCS 1800VerticalMHzPCS 1900 Beamwidth
360°180°120°105° 90° 60° 45° 33°
1 0 3 4 5 6 8 9 10.5 1' 0.5' 60°
2 3 6 7 8 9 11 12 13.6 2' 1' 30°
3 4.5 7.5 8.5 9.5 10.5 12.5 13.515.1 3' 1.5' 20°
4 6 9 10 11 12 14 15 16.6 4' 2' 15°
6 7.5 10.5 11.5 12.513.5 15.5 16.518.1 6' 3' 10°
8 9 12 13 14 15 17 18 19.6 8' 4'7.5°
11DECIBEL® Base Station Antennas
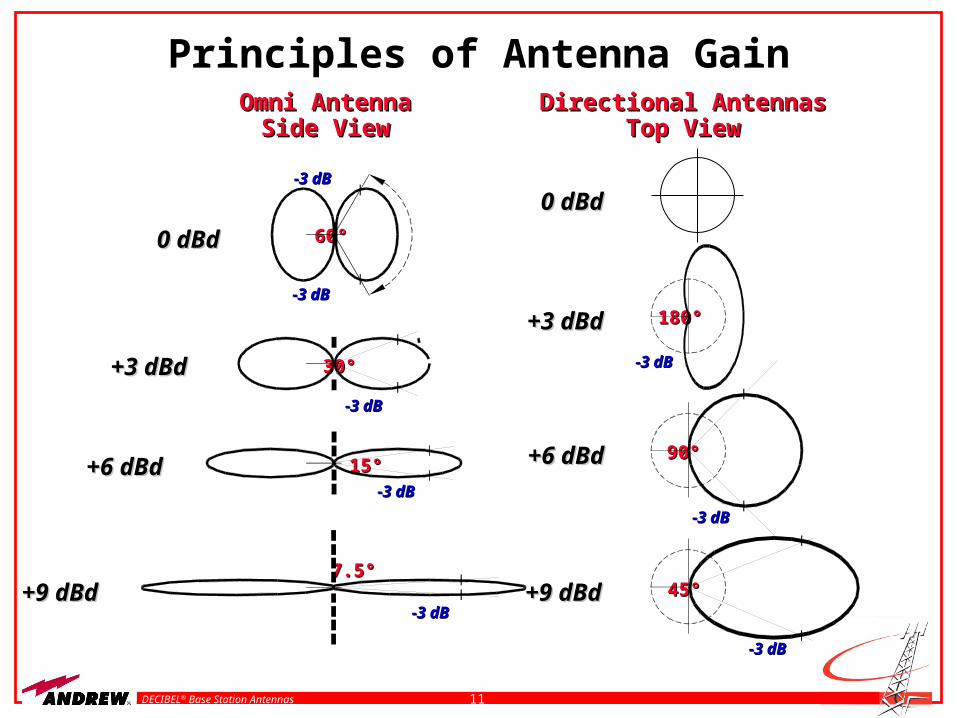
Principles of Antenna GainDirectional AntennasDirectional Antennas
Top ViewTop View
0 dBd0 dBd
+3 dBd+3 dBd
+6 dBd+6 dBd
+9 dBd+9 dBd
-3 dB-3 dB
180°180°
90°90°
-3 dB-3 dB
45°45°
-3 dB-3 dB
Omni AntennaOmni AntennaSide ViewSide View
0 dBd0 dBd
+3 dBd+3 dBd
+6 dBd+6 dBd
+9 dBd+9 dBd
60°60°
-3 dB-3 dB
-3 dB-3 dB
30°30°
-3 dB-3 dB
7.5°7.5°
-3 dB-3 dB
15°15°-3 dB-3 dB
12DECIBEL® Base Station Antennas
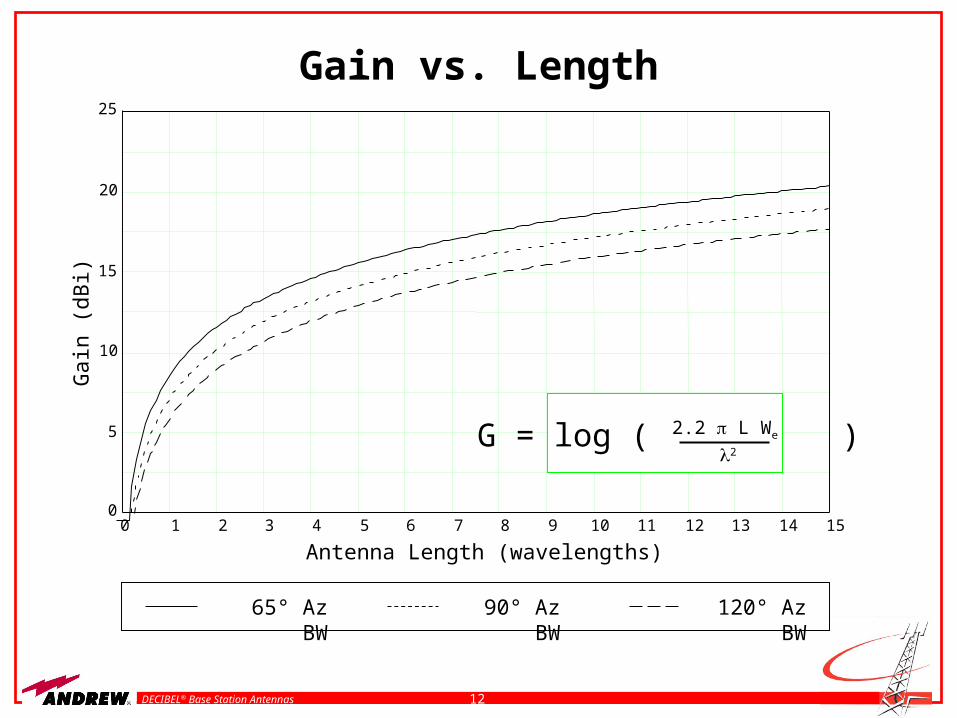
Gain vs. Length
65° Az BW 90° Az BW 120° Az BW
Antenna Length (wavelengths)
Gai
n (d
Bi)
0 1 2 3 4 5 6 7 8 9 10 11 12 13 14 150
5
10
15
20
25
G = log ( )2.2 L We
2
13DECIBEL® Base Station Antennas
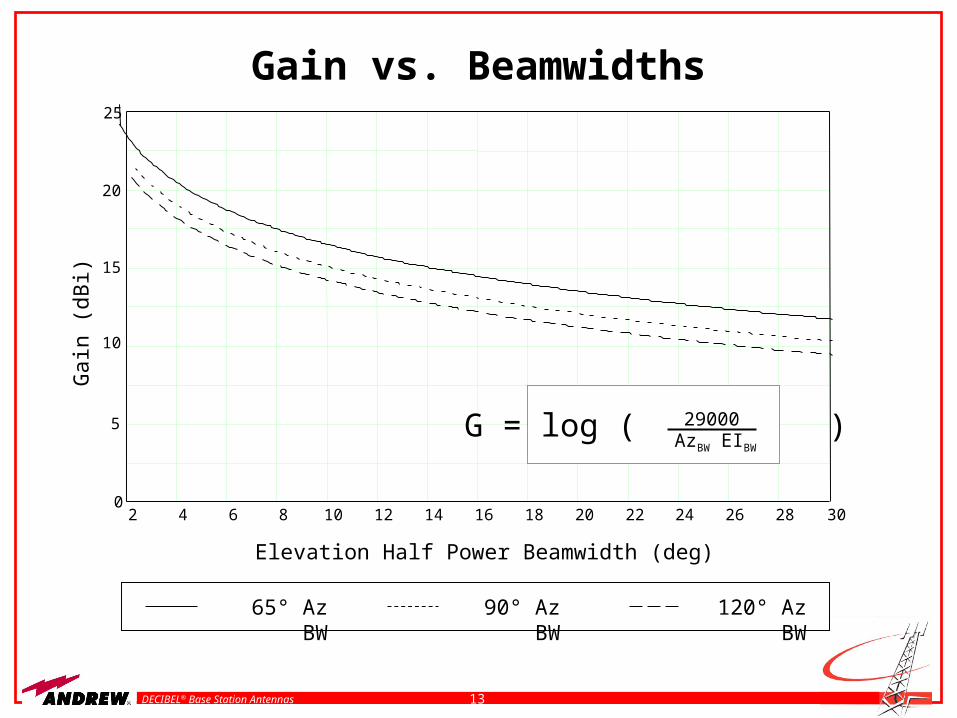
Gain vs. Beamwidths
65° Az BW 90° Az BW 120° Az BW
Elevation Half Power Beamwidth (deg)
Gai
n (d
Bi)
2 4 6 8 10 12 14 16 18 20 22 24 26 28 300
5
10
15
20
25
G = log ( )29000AzBW EIBW
14DECIBEL® Base Station Antennas
Antenna Gain
Gain (dBi) = Directivity (dBi) – Losses (dB)
Losses: Conductor
Dielectric
Impedance
Polarization
Measure Using ‘Gain by Comparison’
15DECIBEL® Base Station Antennas
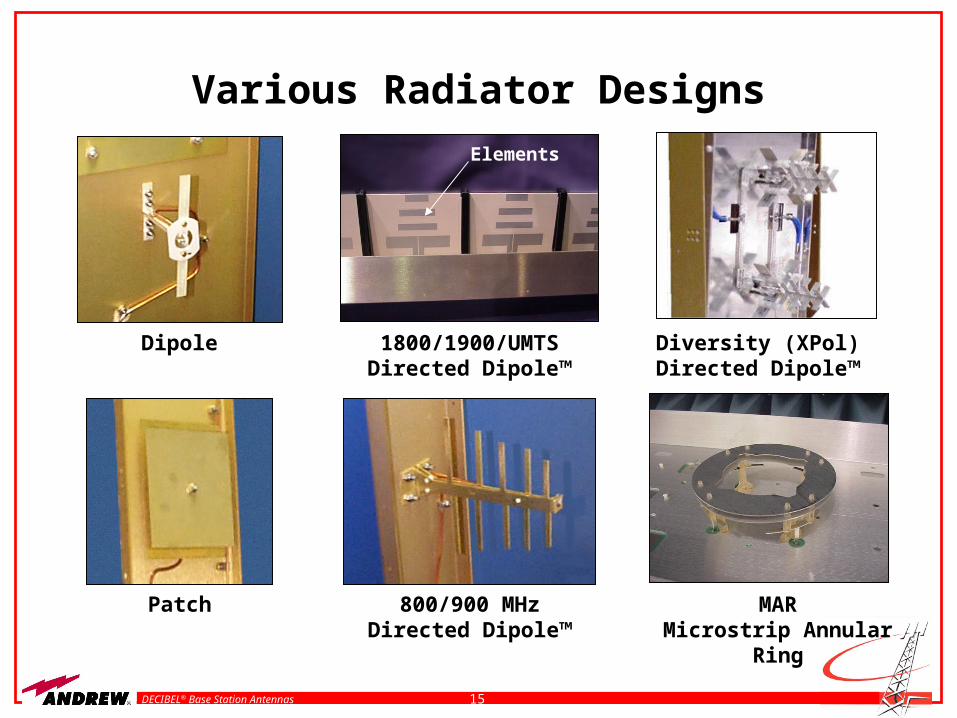
Various Radiator Designs
Patch 800/900 MHzDirected Dipole™
MARMicrostrip Annular Ring
Dipole 1800/1900/UMTSDirected Dipole™
Diversity (XPol)Directed Dipole™
Elements
16DECIBEL® Base Station Antennas
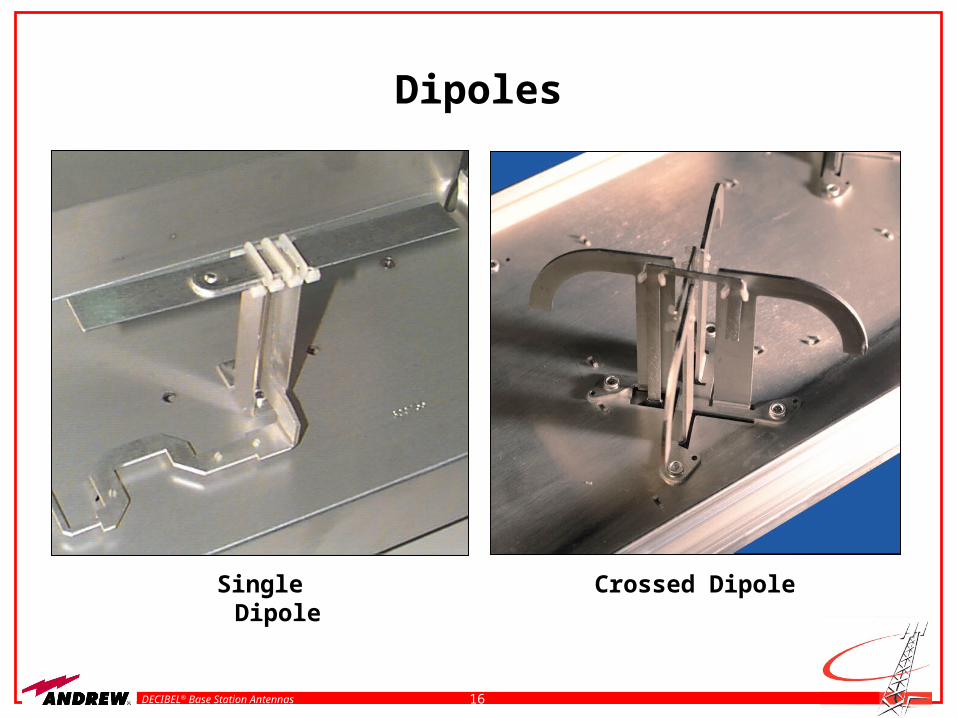
Dipoles
Single Dipole Crossed Dipole
17DECIBEL® Base Station Antennas
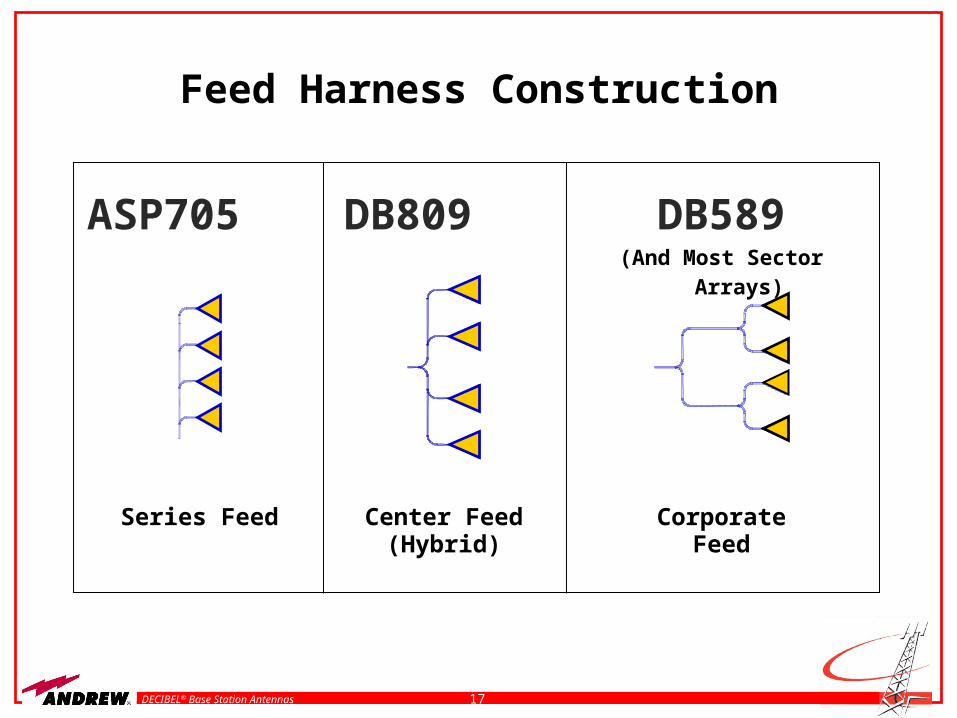
Feed Harness Construction
Series Feed
ASP705
Center Feed(Hybrid)
DB809
CorporateFeed
DB589(And Most Sector Arrays)
18DECIBEL® Base Station Antennas
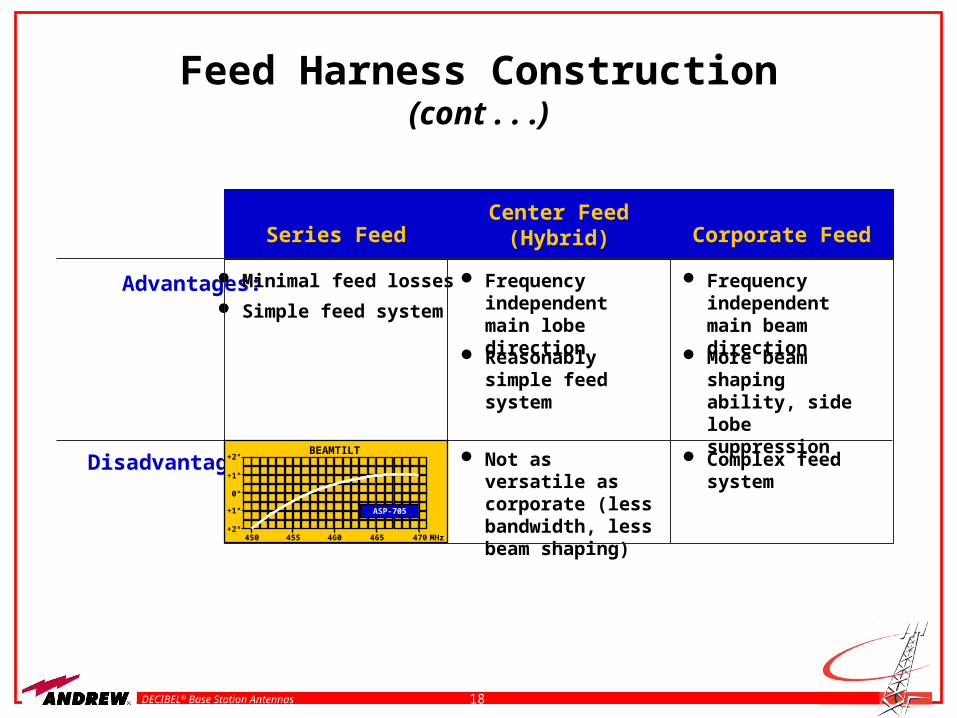
Feed Harness Construction (cont . . .)
Advantages:
Disadvantages:
Center Feed(Hybrid)
Frequency independent main lobe direction
Reasonably simple feed system
Not as versatile as corporate (less bandwidth, less beam shaping)
Corporate Feed
Frequency independent main beam direction
More beam shaping ability, side lobe suppression
Complex feed system
Series Feed
Minimal feed losses
Simple feed system
BEAMTILT
450 455 460 465 470 MHz+2°
+1°
0°
+1°
+2°
ASP-705
19DECIBEL® Base Station Antennas
Feed Networks
Cable
Microstripline, Corporate Feeds
– Dielectric Substrate
– Air Substrate
TOX
T-Line Feed and Radiator
20DECIBEL® Base Station Antennas
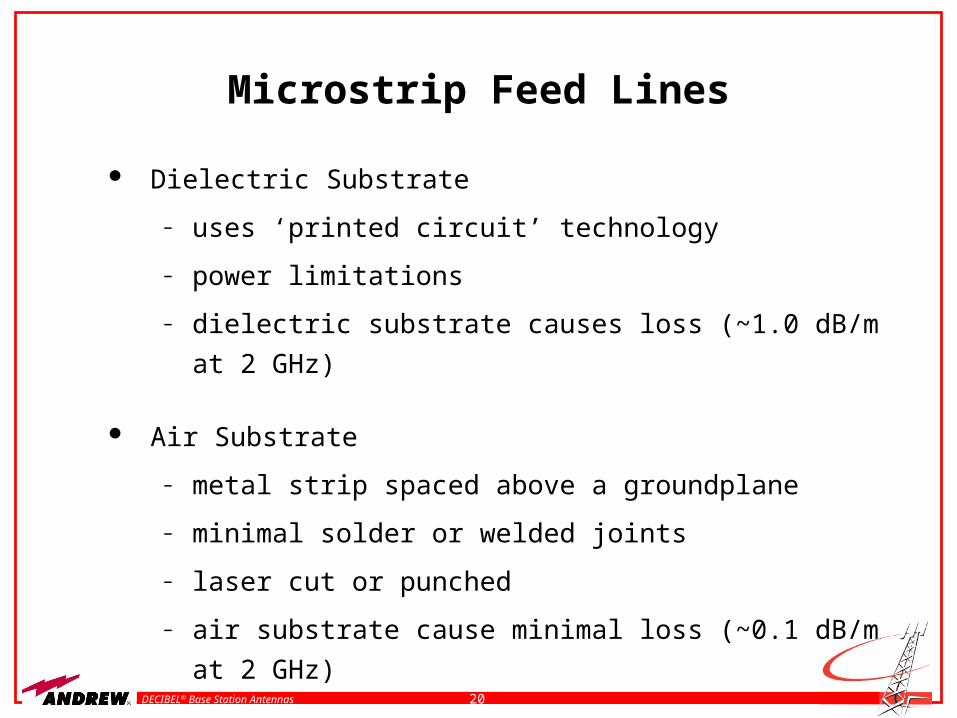
Microstrip Feed Lines
Dielectric Substrate
– uses ‘printed circuit’ technology
– power limitations
– dielectric substrate causes loss (~1.0 dB/m at 2 GHz)
Air Substrate
– metal strip spaced above a groundplane
– minimal solder or welded joints
– laser cut or punched
– air substrate cause minimal loss (~0.1 dB/m at 2 GHz)
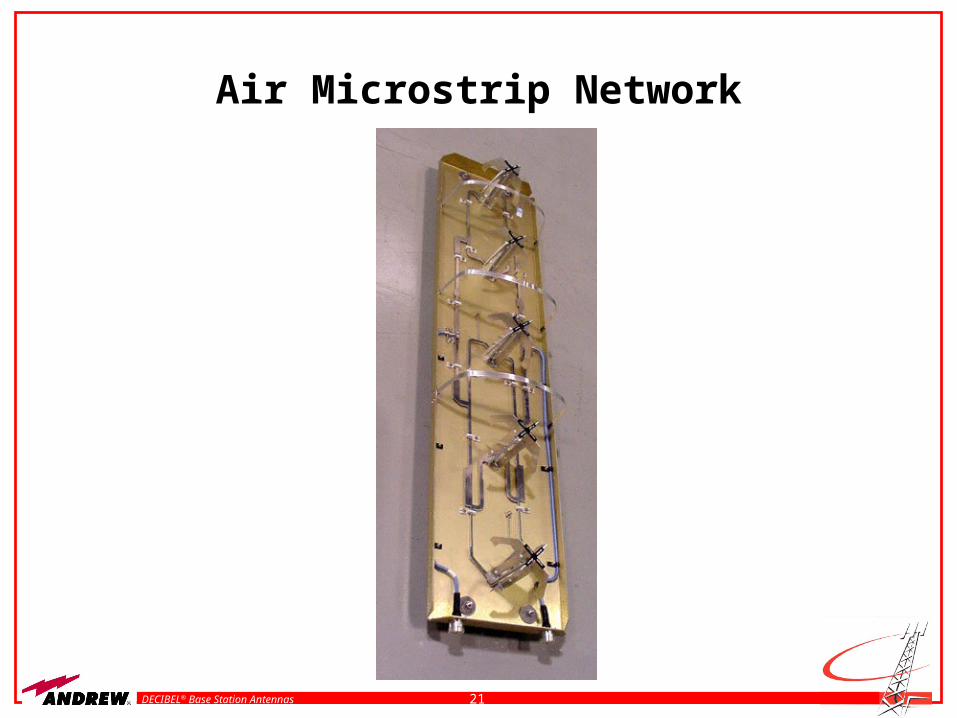
21DECIBEL® Base Station Antennas
Air Microstrip Network
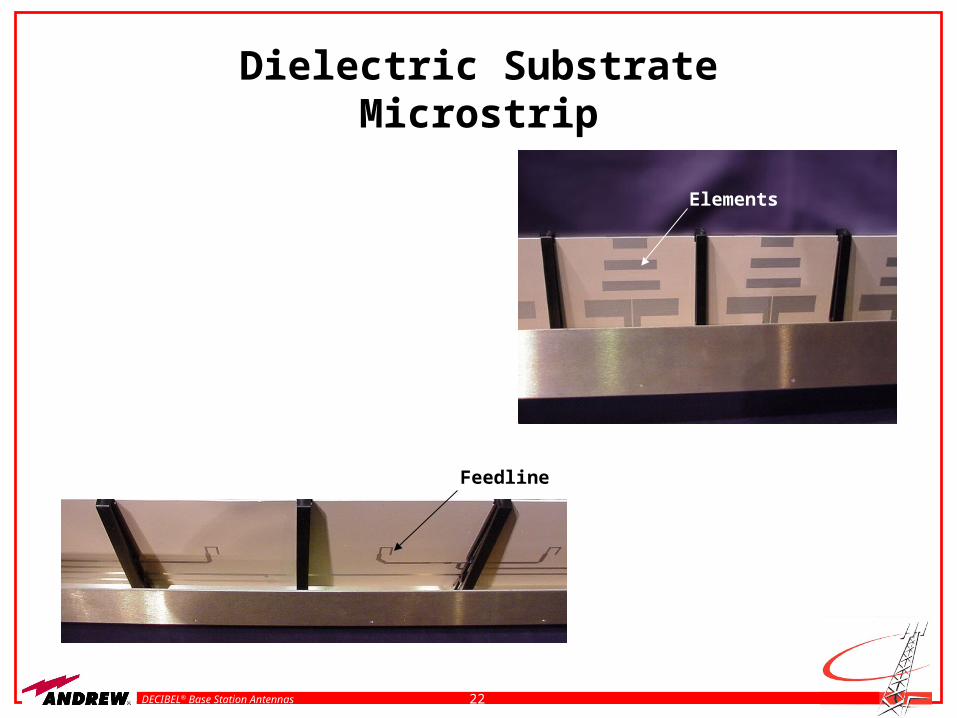
22DECIBEL® Base Station Antennas
Dielectric Substrate Microstrip
Feedline
Elements
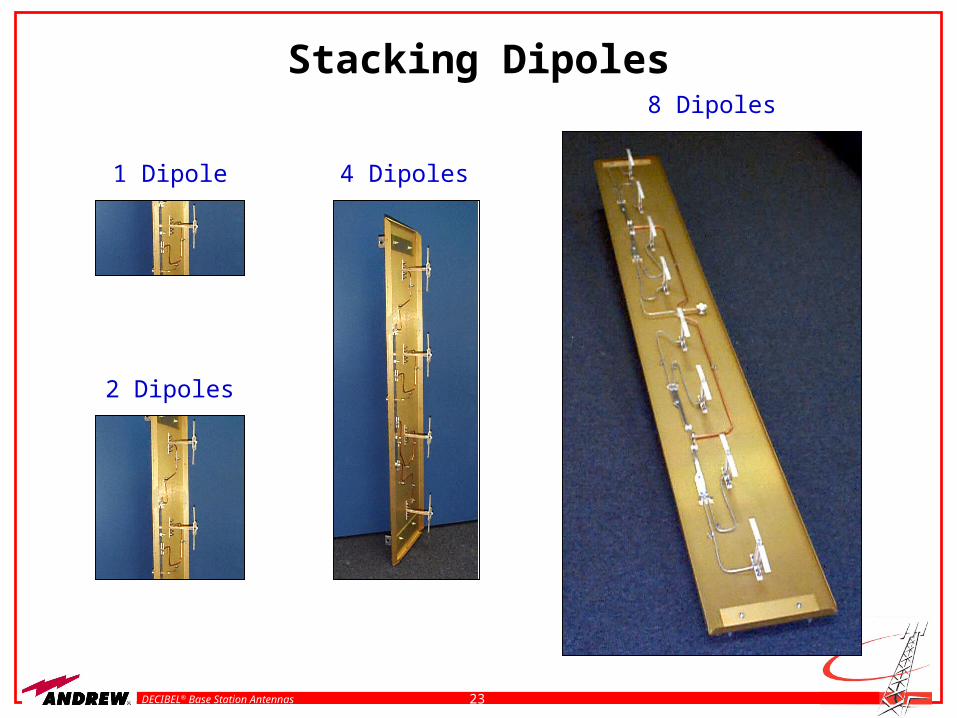
23DECIBEL® Base Station Antennas
Stacking Dipoles
4 Dipoles
8 Dipoles
1 Dipole
2 Dipoles
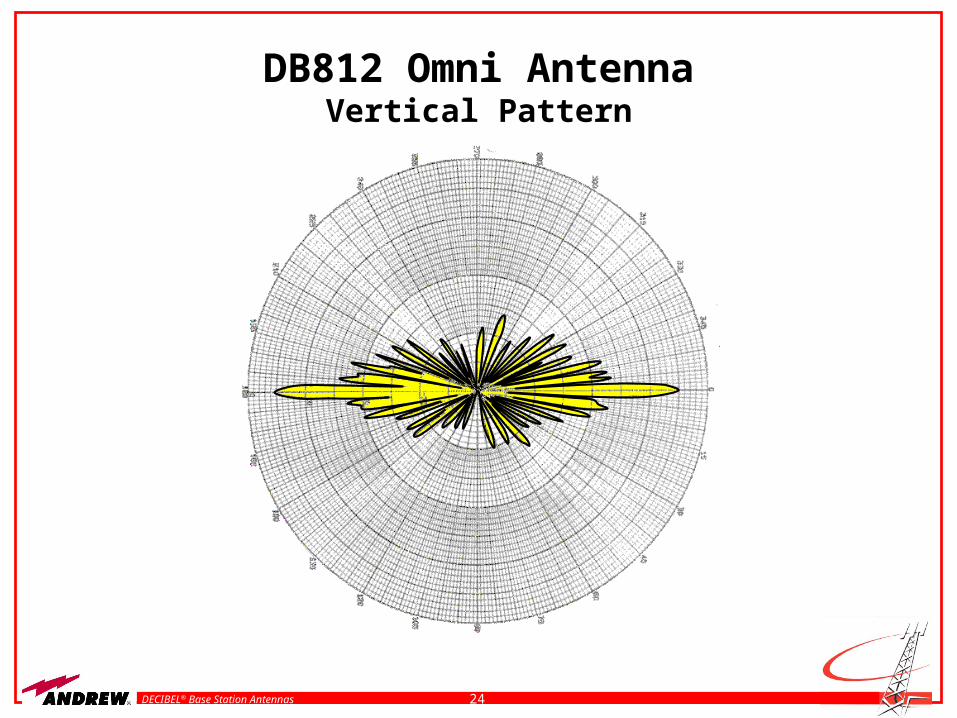
24DECIBEL® Base Station Antennas
DB812 Omni AntennaVertical Pattern
25DECIBEL® Base Station Antennas
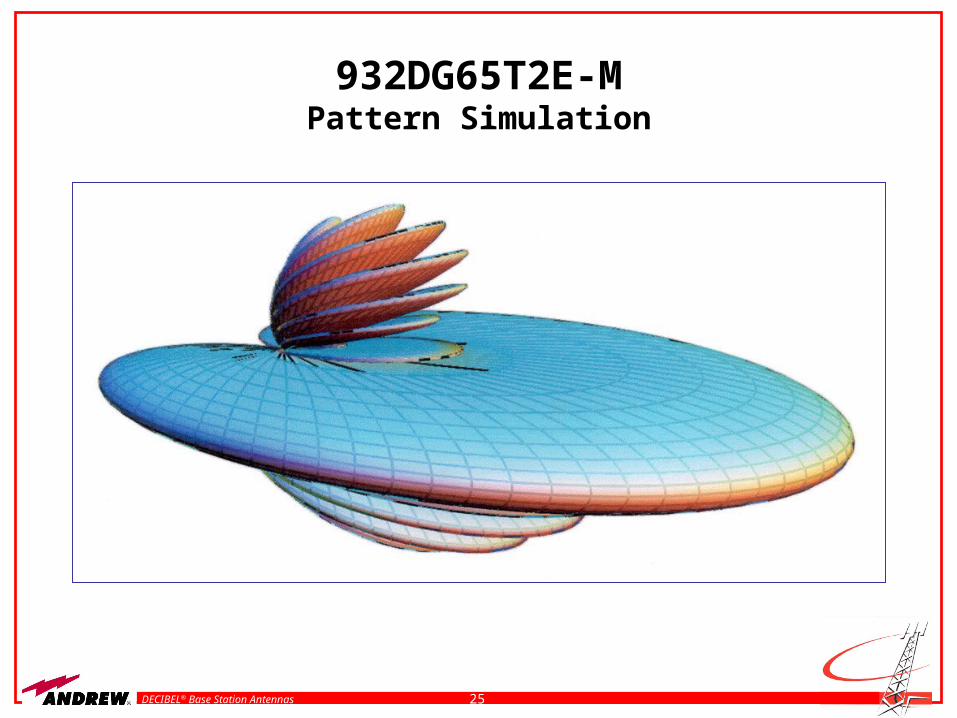
932DG65T2E-MPattern Simulation
26DECIBEL® Base Station Antennas
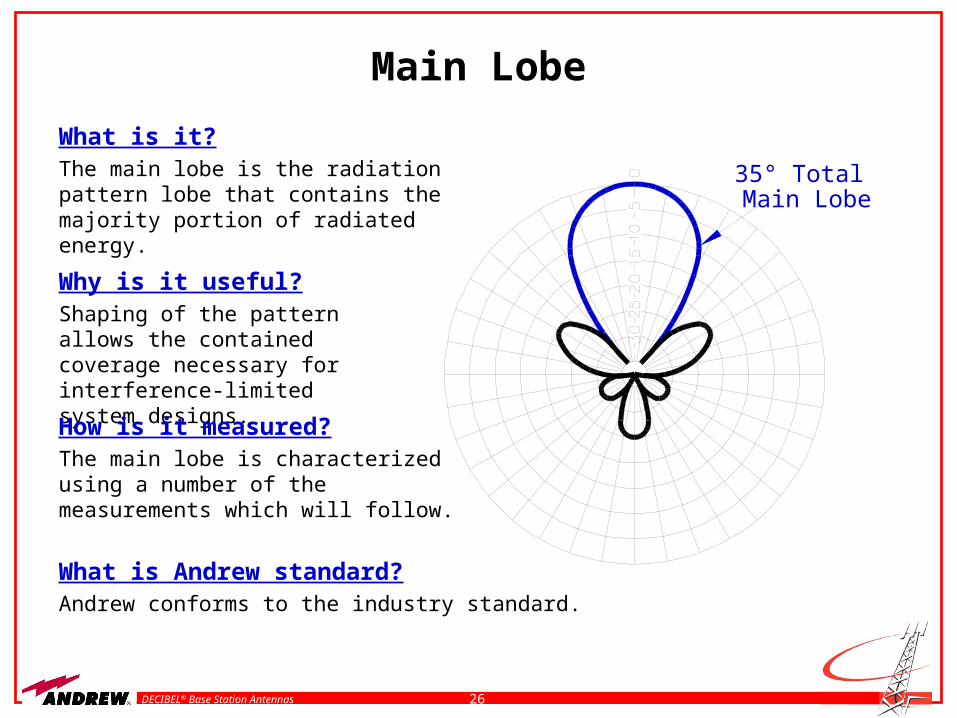
Main Lobe
What is it?The main lobe is the radiation pattern lobe that contains the majority portion of radiated energy.
Why is it useful?Shaping of the pattern allows the contained coverage necessary for interference-limited system designs.
How is it measured?The main lobe is characterized using a number of the measurements which will follow.
What is Andrew standard?Andrew conforms to the industry standard.
35° TotalMain Lobe
27DECIBEL® Base Station Antennas
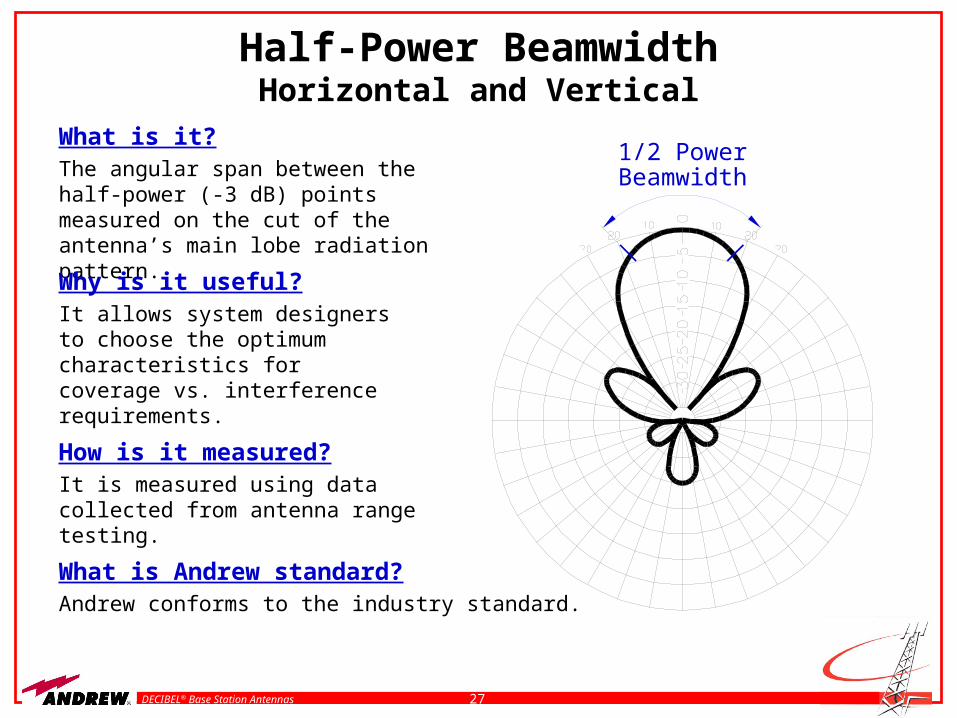
Half-Power BeamwidthHorizontal and Vertical
What is it?The angular span between the half-power (-3 dB) points measured on the cut of the antenna’s main lobe radiation pattern.
Why is it useful?It allows system designers to choose the optimum characteristics for coverage vs. interference requirements.
How is it measured?It is measured using data collected from antenna range testing.
What is Andrew standard?Andrew conforms to the industry standard.
1/2 PowerBeamwidth
28DECIBEL® Base Station Antennas
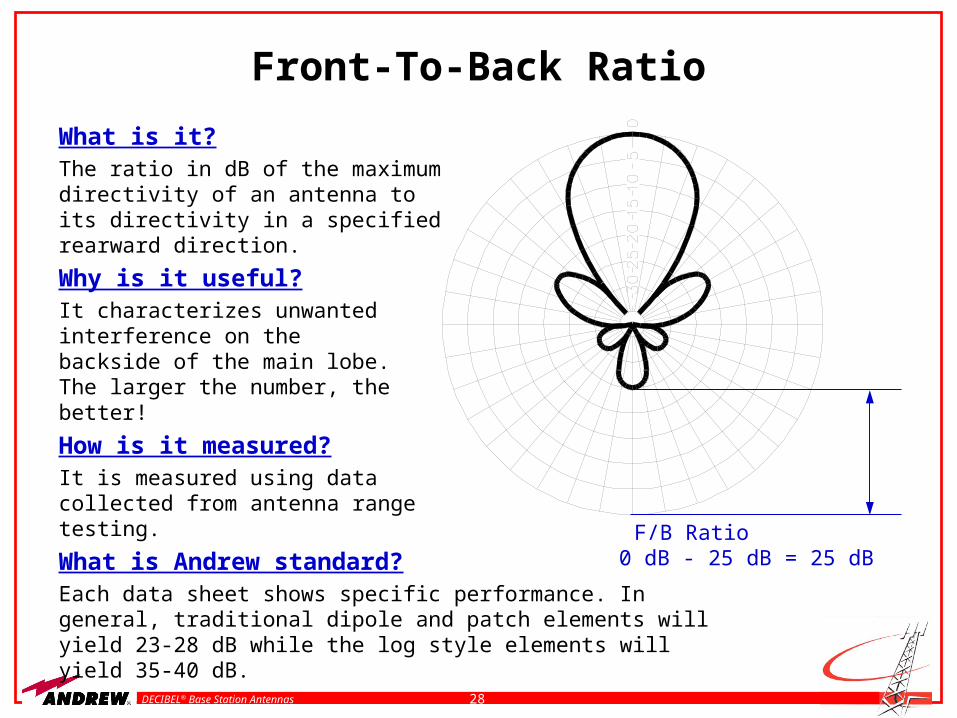
Front-To-Back Ratio
What is it?The ratio in dB of the maximum directivity of an antenna to its directivity in a specified rearward direction.
Why is it useful?It characterizes unwanted interference on the backside of the main lobe. The larger the number, the better!
How is it measured?It is measured using data collected from antenna range testing.
What is Andrew standard?Each data sheet shows specific performance. In general, traditional dipole and patch elements will yield 23-28 dB while the log style elements will yield 35-40 dB.
F/B Ratio0 dB - 25 dB = 25 dB
29DECIBEL® Base Station Antennas
Sidelobe Level
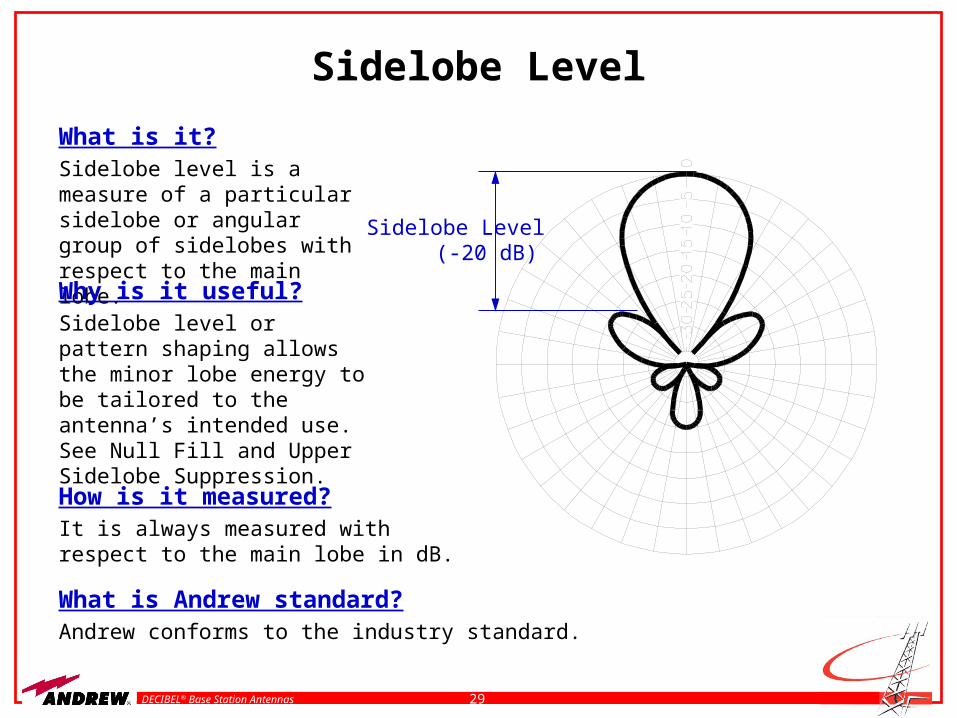
What is it?Sidelobe level is a measure of a particular sidelobe or angular group of sidelobes with respect to the main lobe.
Why is it useful?Sidelobe level or pattern shaping allows the minor lobe energy to be tailored to the antenna’s intended use. See Null Fill and Upper Sidelobe Suppression.
How is it measured?It is always measured with respect to the main lobe in dB.
What is Andrew standard?Andrew conforms to the industry standard.
Sidelobe Level(-20 dB)
30DECIBEL® Base Station Antennas
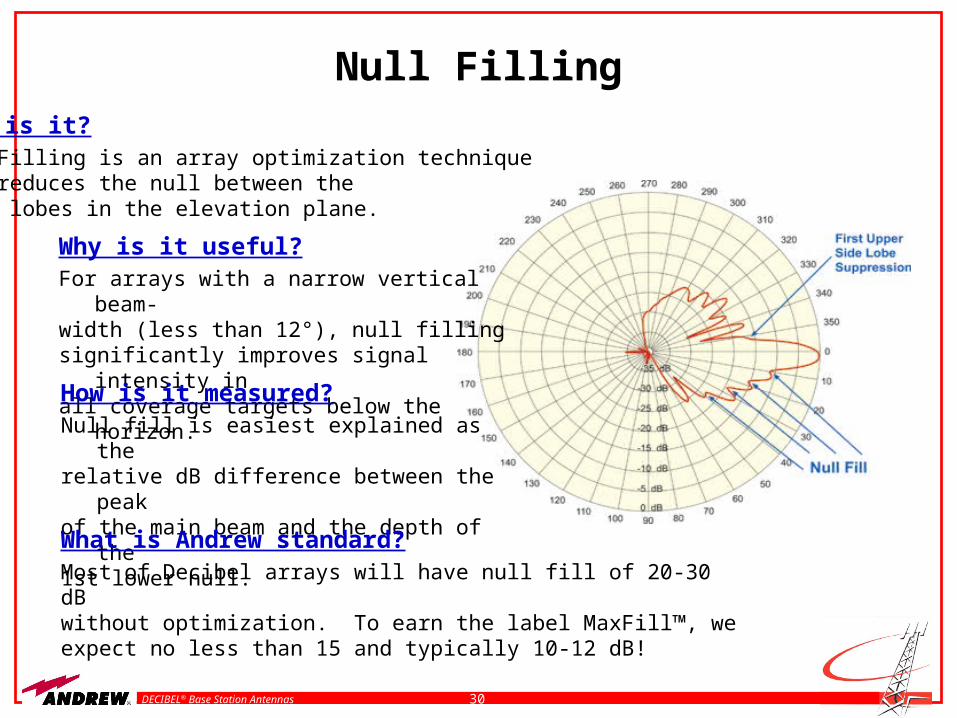
Null FillingWhat is it?Null Filling is an array optimization techniquethat reduces the null between the lower lobes in the elevation plane.
Why is it useful?For arrays with a narrow vertical beam-width (less than 12°), null filling significantly improves signal intensity in all coverage targets below the horizon.
How is it measured?Null fill is easiest explained as the relative dB difference between the peakof the main beam and the depth of the 1st lower null.
What is Andrew standard?Most of Decibel arrays will have null fill of 20-30 dBwithout optimization. To earn the label MaxFill™, we expect no less than 15 and typically 10-12 dB!
31DECIBEL® Base Station Antennas
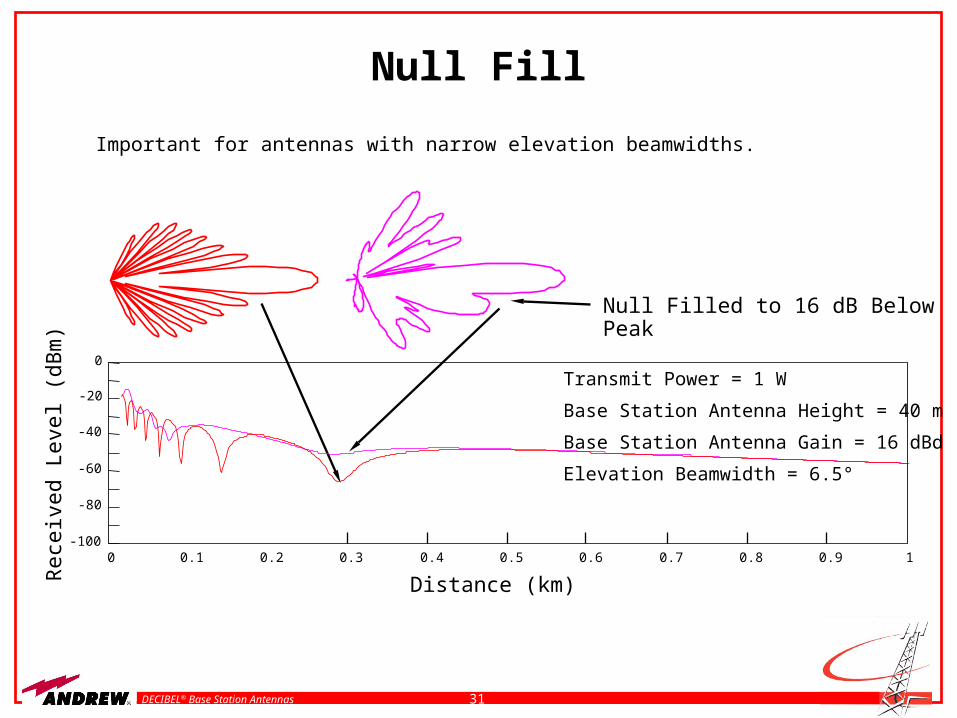
Null Fill
Important for antennas with narrow elevation beamwidths.
Null Filled to 16 dB Below Peak
0 0.1 0.2 0.3 0.4 0.5 0.6 0.7 0.8 0.9 1-100
-80
-60
-40
-20
0
Distance (km)
Rec
eive
d Le
vel (
dBm
)
Transmit Power = 1 W
Base Station Antenna Height = 40 m
Base Station Antenna Gain = 16 dBd
Elevation Beamwidth = 6.5°
32DECIBEL® Base Station Antennas
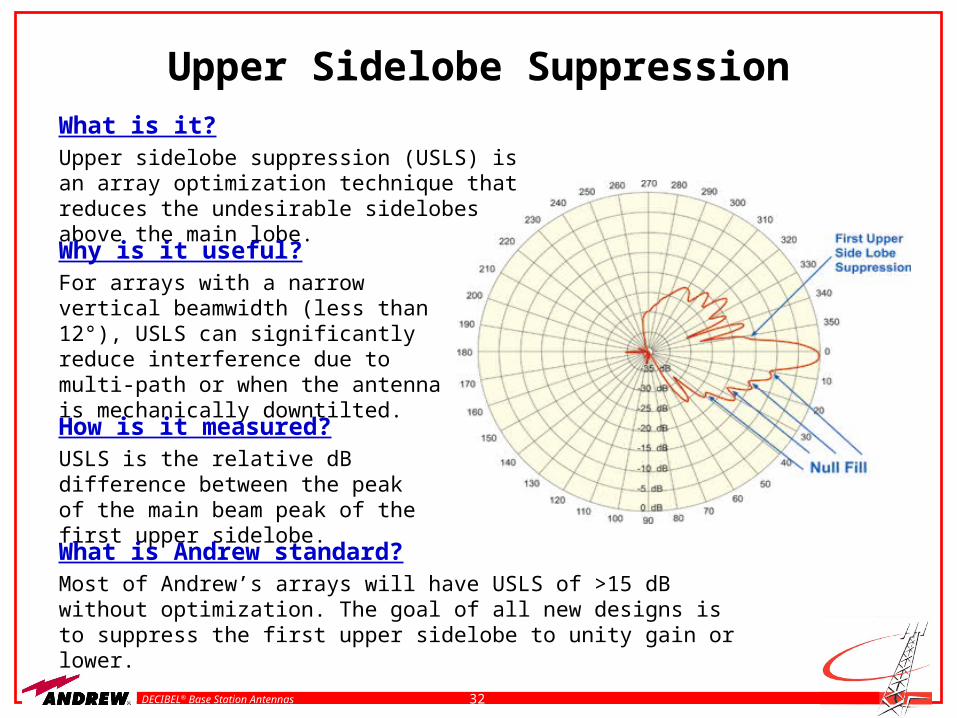
Upper Sidelobe SuppressionWhat is it?Upper sidelobe suppression (USLS) is an array optimization technique that reduces the undesirable sidelobes above the main lobe.
Why is it useful?For arrays with a narrow vertical beamwidth (less than 12°), USLS can significantly reduce interference due to multi-path or when the antenna is mechanically downtilted.
How is it measured?USLS is the relative dB difference between the peak of the main beam peak of the first upper sidelobe.
What is Andrew standard?Most of Andrew’s arrays will have USLS of >15 dB without optimization. The goal of all new designs is to suppress the first upper sidelobe to unity gain or lower.
33DECIBEL® Base Station Antennas
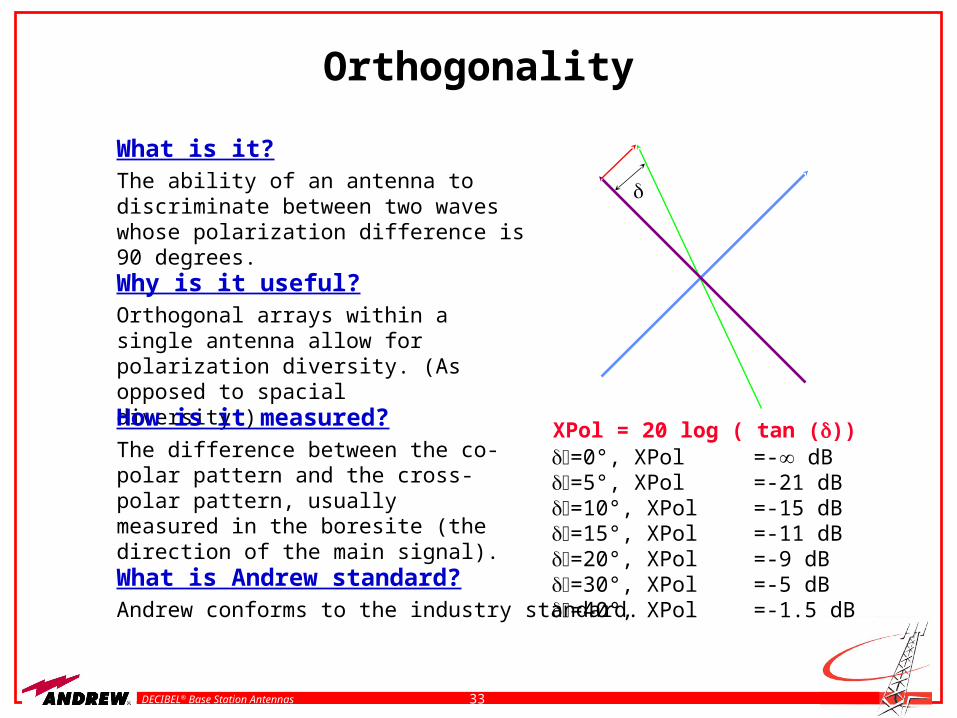
Orthogonality
What is it?The ability of an antenna to discriminate between two waves whose polarization difference is 90 degrees.
Why is it useful?Orthogonal arrays within a single antenna allow for polarization diversity. (As opposed to spacial diversity.)
How is it measured?The difference between the co-polar pattern and the cross-polar pattern, usually measured in the boresite (the direction of the main signal).
What is Andrew standard?Andrew conforms to the industry standard.
= 0°, XPol = - dB= 5°, XPol = -21 dB=10°, XPol = -15 dB=15°, XPol = -11 dB=20°, XPol = -9 dB=30°, XPol = -5 dB=40°, XPol =-1.5 dB
XPol = 20 log ( tan ())
34DECIBEL® Base Station Antennas
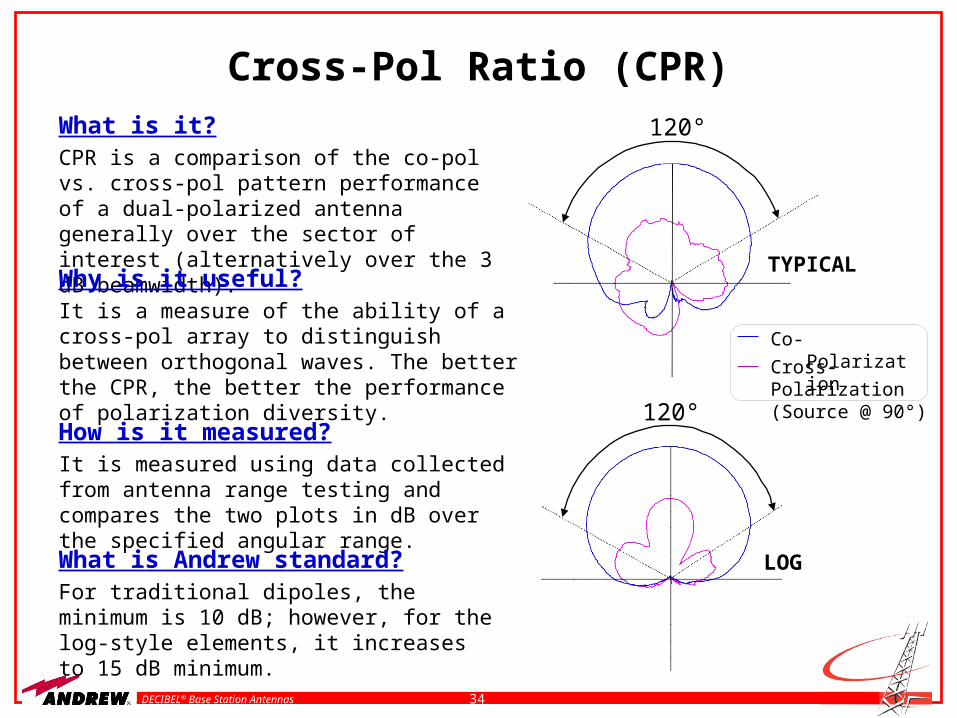
Cross-Pol Ratio (CPR)What is it?CPR is a comparison of the co-pol vs. cross-pol pattern performance of a dual-polarized antenna generally over the sector of interest (alternatively over the 3 dB beamwidth).
Why is it useful?It is a measure of the ability of a cross-pol array to distinguish between orthogonal waves. The better the CPR, the better the performance of polarization diversity.
How is it measured?It is measured using data collected from antenna range testing and compares the two plots in dB over the specified angular range.
What is Andrew standard?For traditional dipoles, the minimum is 10 dB; however, for the log-style elements, it increases to 15 dB minimum.
120°
TYPICAL
120°
LOG
Co-Polarization
Cross-Polarization (Source @ 90°)
35DECIBEL® Base Station Antennas
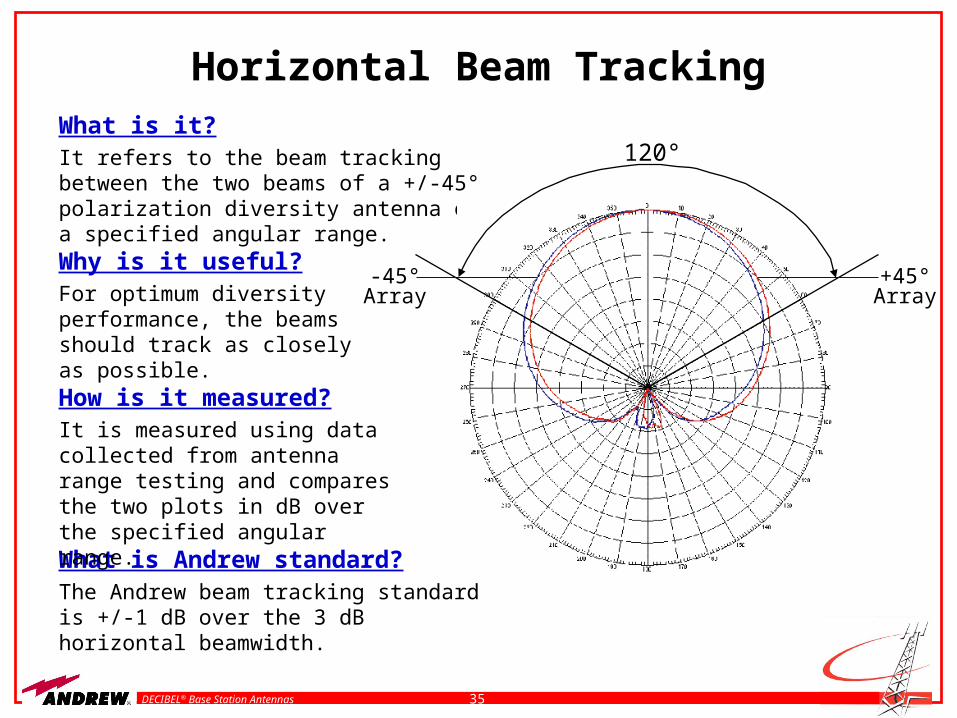
Horizontal Beam Tracking
What is Andrew standard?The Andrew beam tracking standard is +/-1 dB over the 3 dB horizontal beamwidth.
What is it?It refers to the beam tracking between the two beams of a +/-45° polarization diversity antenna over a specified angular range.
Why is it useful?For optimum diversity performance, the beams should track as closely as possible.
How is it measured?It is measured using data collected from antenna range testing and compares the two plots in dB over the specified angular range.
120°
+45°-45°Array Array
36DECIBEL® Base Station Antennas
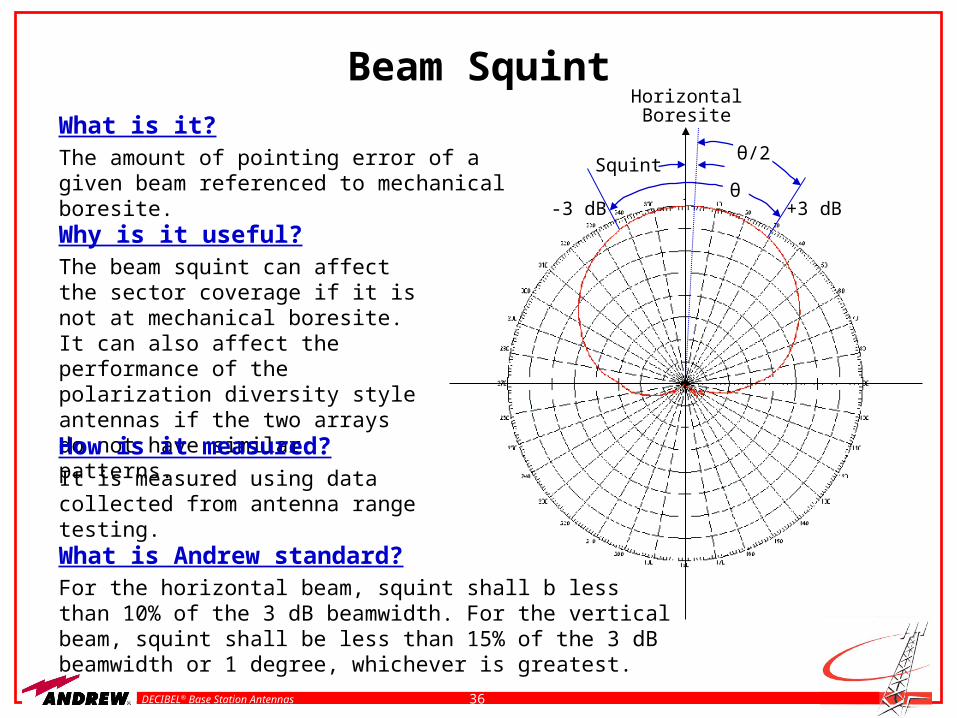
Beam SquintWhat is it?The amount of pointing error of a given beam referenced to mechanical boresite.
Why is it useful?The beam squint can affect the sector coverage if it is not at mechanical boresite. It can also affect the performance of the polarization diversity style antennas if the two arrays do not have similar patterns.
How is it measured?It is measured using data collected from antenna range testing.
What is Andrew standard?For the horizontal beam, squint shall b less than 10% of the 3 dB beamwidth. For the vertical beam, squint shall be less than 15% of the 3 dB beamwidth or 1 degree, whichever is greatest.
-3 dB +3 dB
Squintθ/2
θ
HorizontalBoresite
37DECIBEL® Base Station Antennas
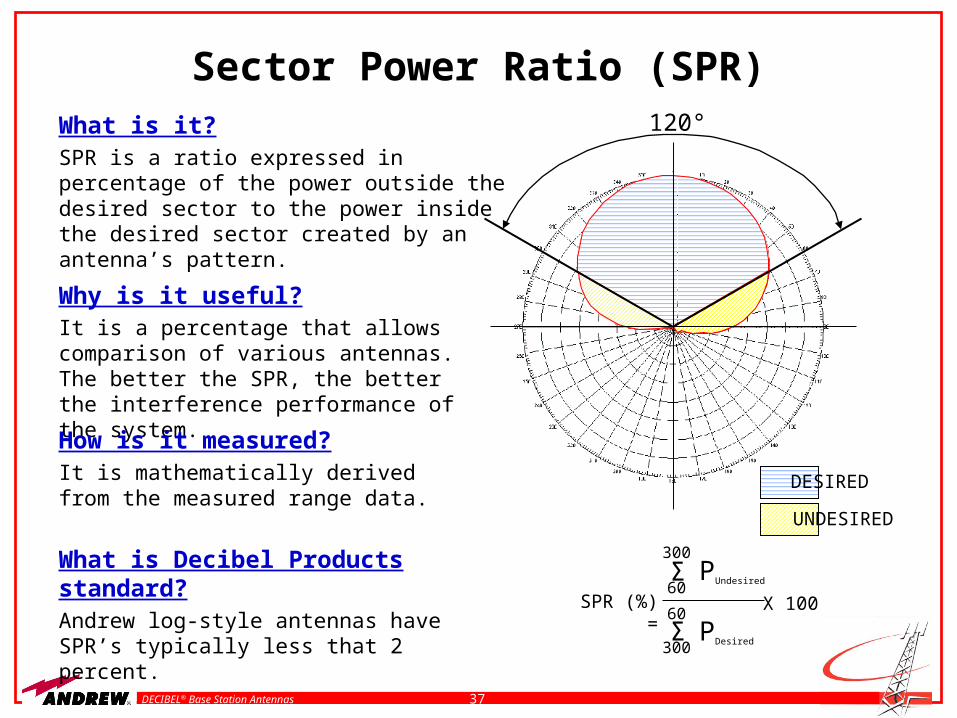
Sector Power Ratio (SPR)What is it?SPR is a ratio expressed in percentage of the power outside the desired sector to the power inside the desired sector created by an antenna’s pattern.
Why is it useful?It is a percentage that allows comparison of various antennas. The better the SPR, the better the interference performance of the system.
How is it measured?It is mathematically derived from the measured range data.
What is Decibel Products standard?Andrew log-style antennas have SPR’s typically less that 2 percent.
PUndesired
SPR (%) = X 100
PDesired
300
60Σ
60
300Σ
120°
DESIRED
UNDESIRED
38DECIBEL® Base Station Antennas
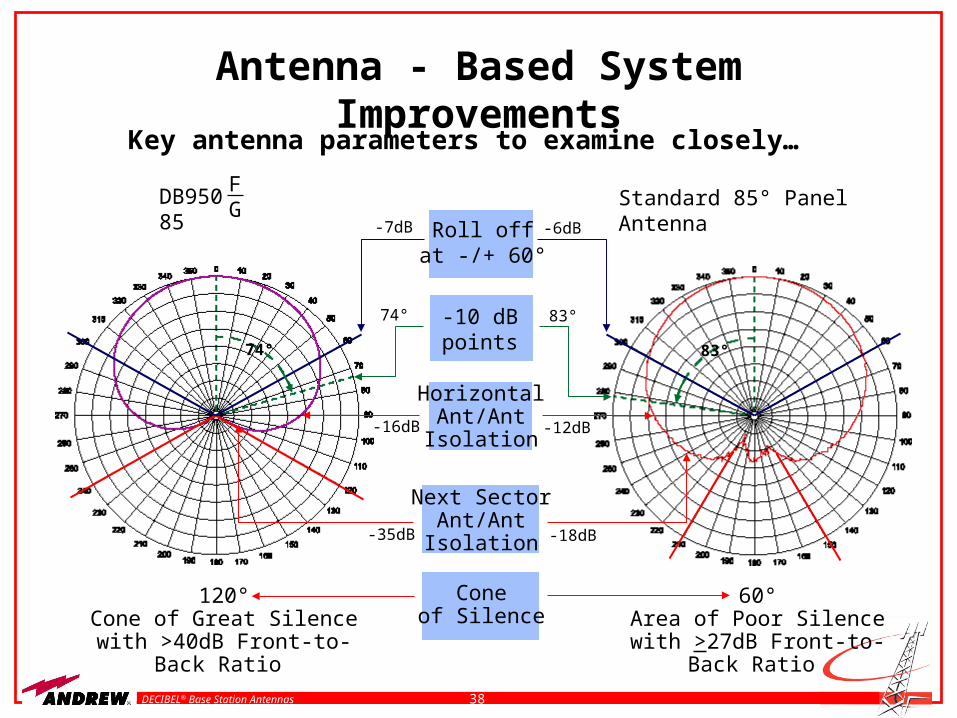
Key antenna parameters to examine closely…
Antenna - Based System Improvements
Roll offat -/+ 60°
-10 dBpoints
HorizontalAnt/AntIsolation
-16dB -12dB
-7dB -6dB
120°Cone of Great Silence with >40dB Front-to-Back Ratio
60°Area of Poor Silence with
>27dB Front-to-Back Ratio
Standard 85° Panel AntennaDB950 85FG
74° 83°
74° 83°
Next SectorAnt/AntIsolation-35dB -18dB
Coneof Silence
39DECIBEL® Base Station Antennas
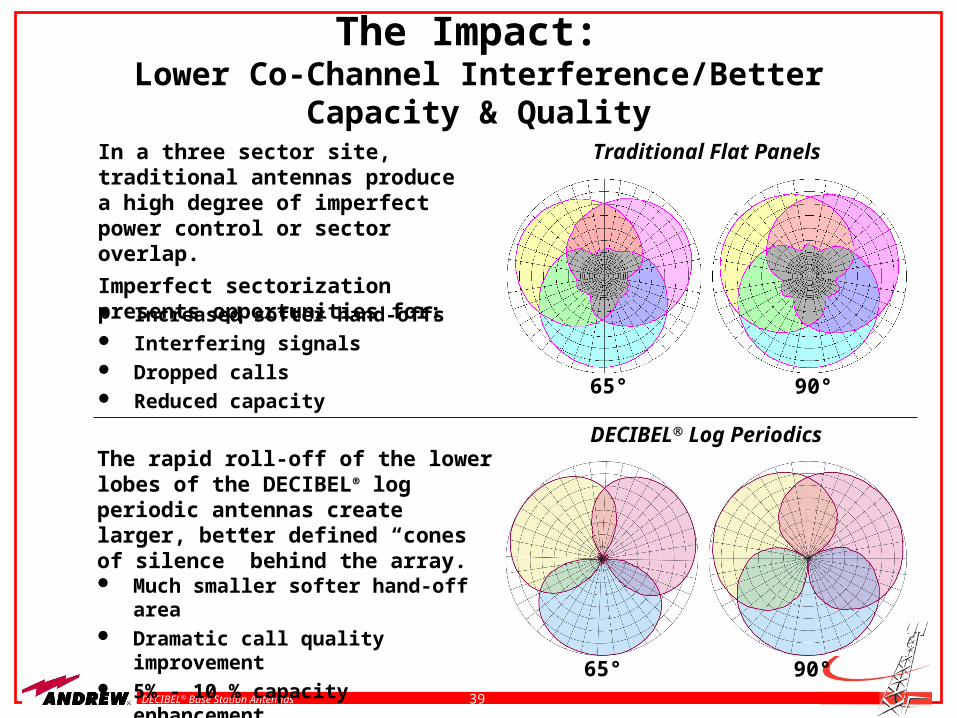
The Impact: Lower Co-Channel Interference/Better Capacity & Quality
The rapid roll-off of the lower lobes of the DECIBEL® log periodic antennas create larger, better defined “cones of silence” behind the array.
Much smaller softer hand-off area Dramatic call quality improvement 5% - 10 % capacity enhancement
DECIBEL® Log Periodics
In a three sector site, traditional antennas produce a high degree of imperfect power control or sector overlap.
Imperfect sectorization presents opportunities for: Increased softer hand-offs Interfering signals Dropped calls Reduced capacity
Traditional Flat Panels
65° 90°
65° 90°
40DECIBEL® Base Station Antennas
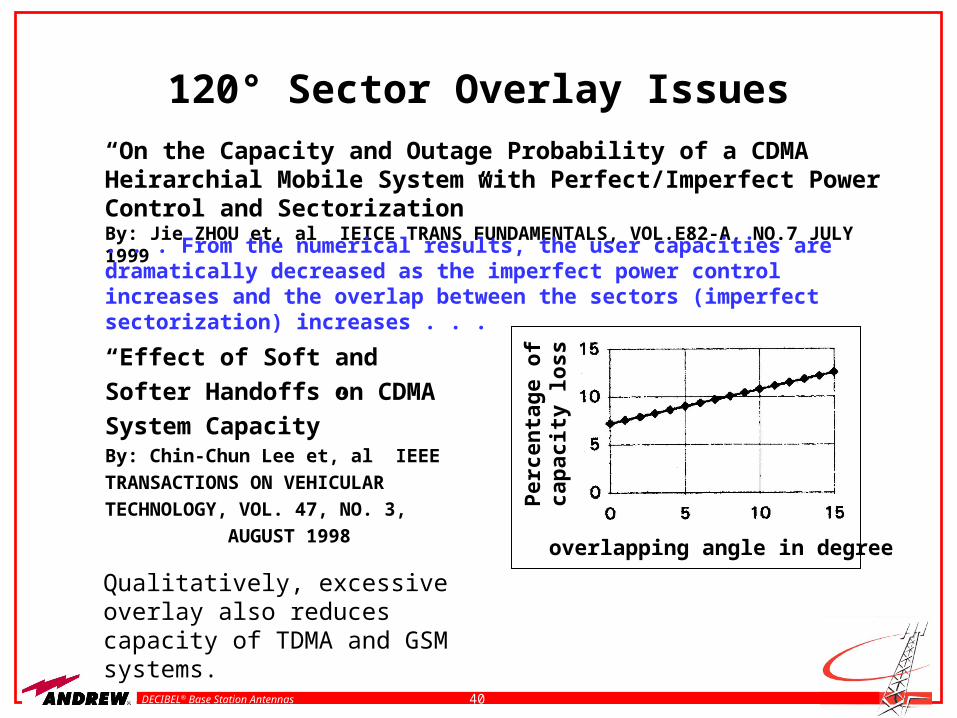
Per
cen
tage
of
cap
acit
y lo
ssoverlapping angle in degree
“On the Capacity and Outage Probability of a CDMA Heirarchial Mobile System with Perfect/Imperfect Power Control and Sectorization”By: Jie ZHOU et, al IEICE TRANS FUNDAMENTALS, VOL.E82-A, NO.7 JULY 1999
. . . From the numerical results, the user capacities are dramatically decreased as the imperfect power control increases and the overlap between the sectors (imperfect sectorization) increases . . .
“Effect of Soft and Softer Handoffs
on CDMA System Capacity”By: Chin-Chun Lee et, al IEEE
TRANSACTIONS ON VEHICULAR
TECHNOLOGY, VOL. 47, NO. 3,
AUGUST 1998
120° Sector Overlay Issues
Qualitatively, excessive overlay also reduces capacity of TDMA and GSM systems.

41DECIBEL® Base Station Antennas
System Issues
Choosing sector antennas
Downtilt – electrical vs. mechanical
RET optimization
Passive intermodulation (PIM)
Return loss through coax
Pattern distortion
Antenna isolation
42DECIBEL® Base Station Antennas
Choosing Sector Antennas
For 3 sector cell sites, what performance differences can
be expected from the use of antennas with different
horizontal apertures?
Criteria:Criteria: Area of service indifference between adjacent sectors
(“ping-pong” area).
For comparison, use 6 dB differentials.
Antenna gain and overall sector coverage.
43DECIBEL® Base Station Antennas
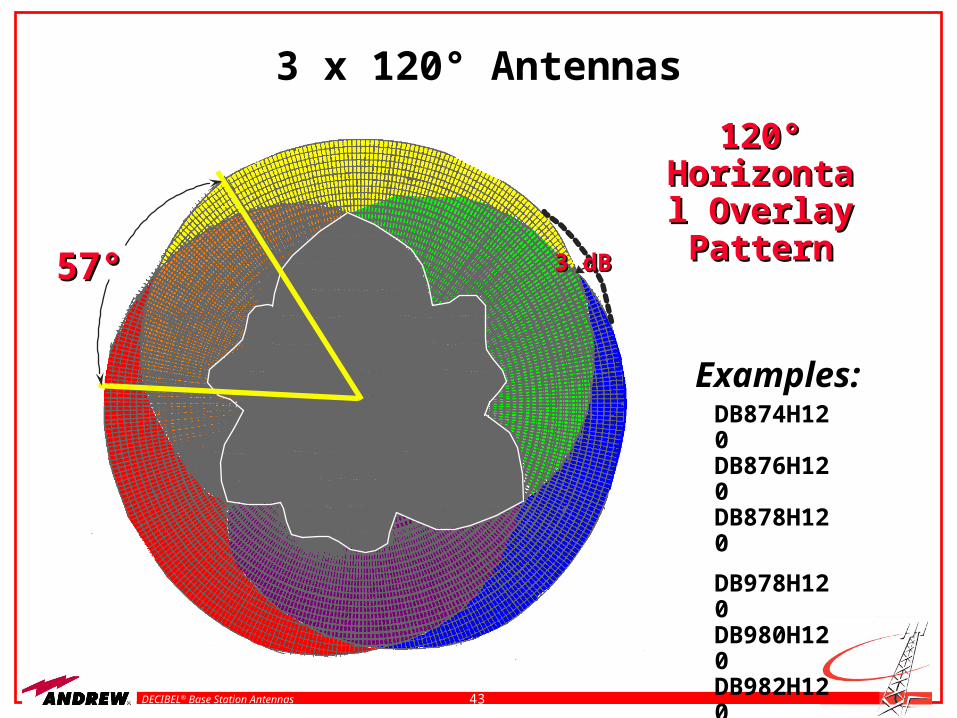
3 x 120° Antennas
120° 120° Horizontal Horizontal
Overlay Overlay PatternPattern3 dB3 dB57°57°
DB874H120DB876H120DB878H120
DB978H120DB980H120DB982H120
Examples:
44DECIBEL® Base Station Antennas
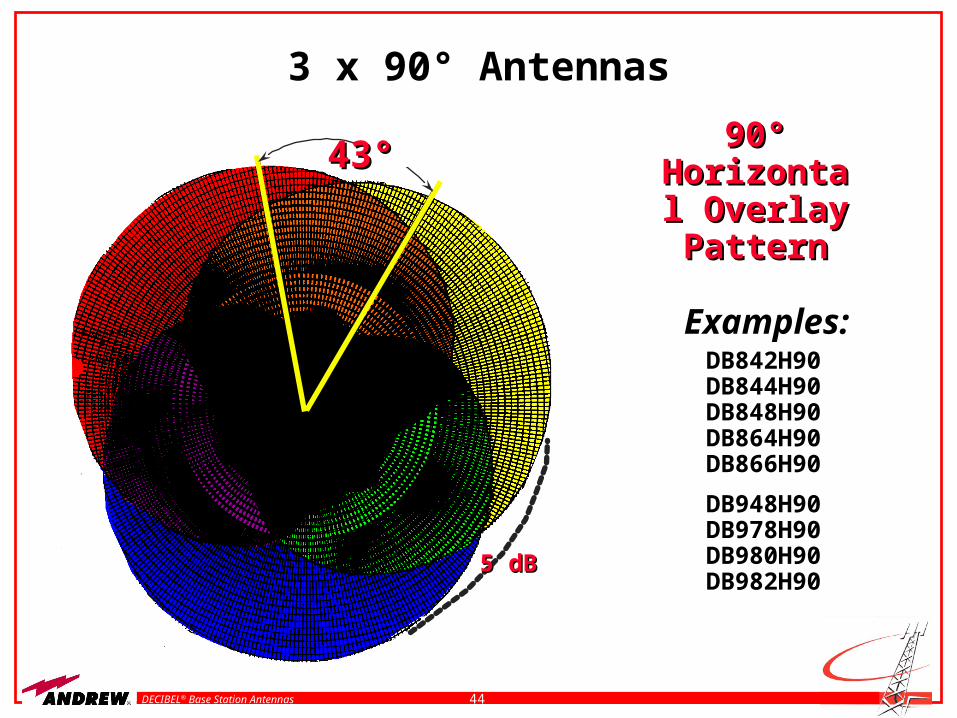
3 x 90° Antennas
5 dB5 dB
43°43° 90° 90° Horizontal Horizontal
Overlay Overlay PatternPattern
DB842H90DB844H90DB848H90DB864H90DB866H90
DB948H90DB978H90DB980H90DB982H90
Examples:
45DECIBEL® Base Station Antennas
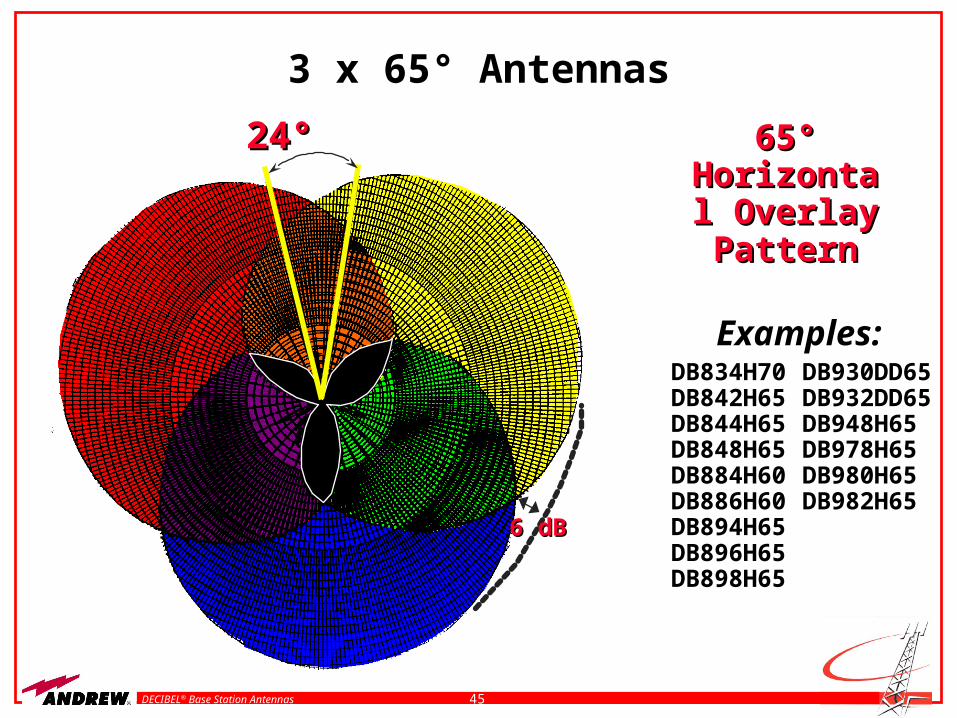
3 x 65° Antennas
24°24°
6 dB6 dB
65° 65° Horizontal Horizontal
Overlay Overlay PatternPattern
DB834H70 DB930DD65DB842H65 DB932DD65DB844H65 DB948H65DB848H65 DB978H65DB884H60 DB980H65DB886H60 DB982H65DB894H65DB896H65DB898H65
Examples:
46DECIBEL® Base Station Antennas
Beam Downtilt
In urban areas, service and frequency utilization are
frequently improved by directing maximum radiation power
at an area below the horizon.
ThisThis Technique:Technique: Improves coverage of open areas close
to the base station.
Allows more effective penetration of nearby buildings, particular high-traffic lower levels and garages.
Permits the use of adjacent frequencies in the same general region.
47DECIBEL® Base Station Antennas
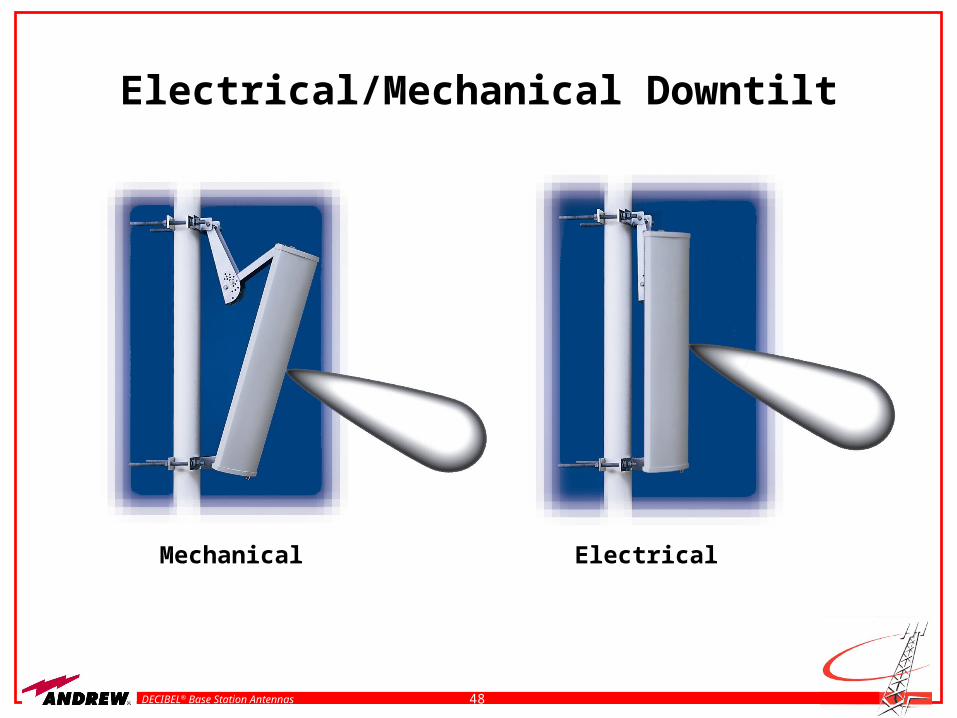
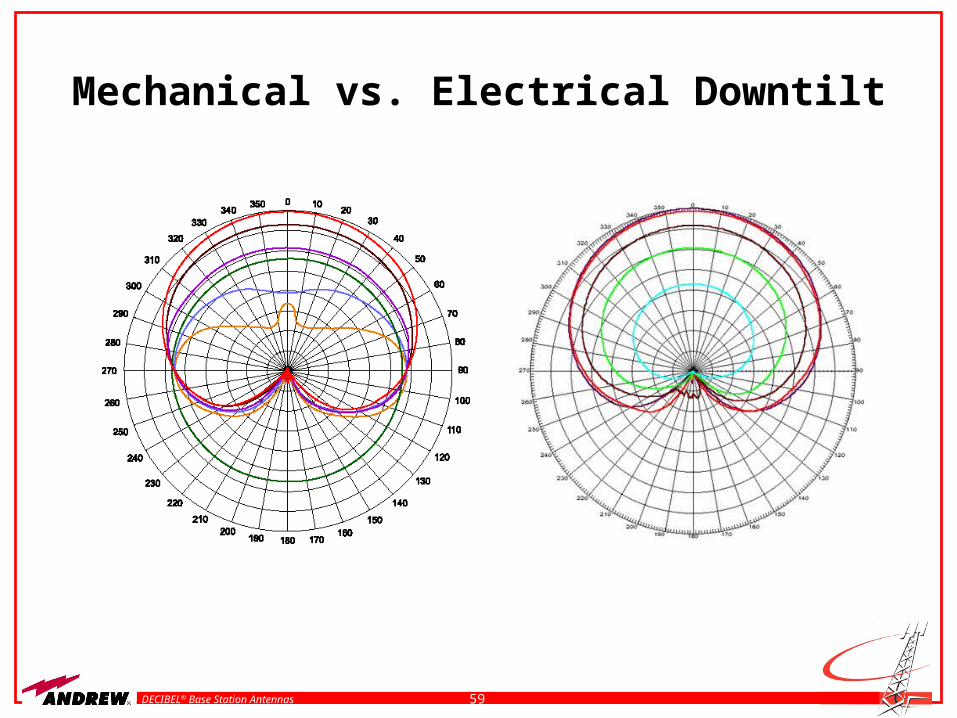
Electrical/Mechanical Downtilt
Mechanical downtilt lowers main beam, raises back lobe.
Electrical downtilt lowers main beam and lowers back lobe.
A combination of equal electrical and mechanical downtilts lowers main beam and brings back lobe onto the horizon!
48DECIBEL® Base Station Antennas
Electrical/Mechanical Downtilt
Mechanical Electrical
49DECIBEL® Base Station Antennas
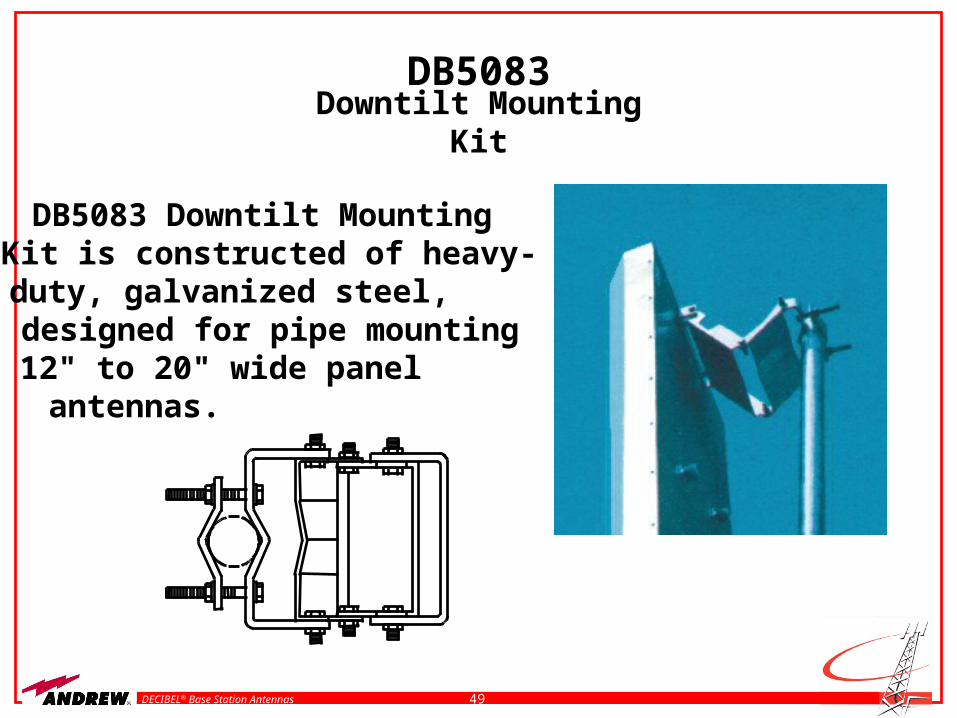
DB5083Downtilt Mounting Kit
DB5083 Downtilt MountingKit is constructed of heavy-duty, galvanized steel,designed for pipe mounting12" to 20" wide panelantennas.
50DECIBEL® Base Station Antennas
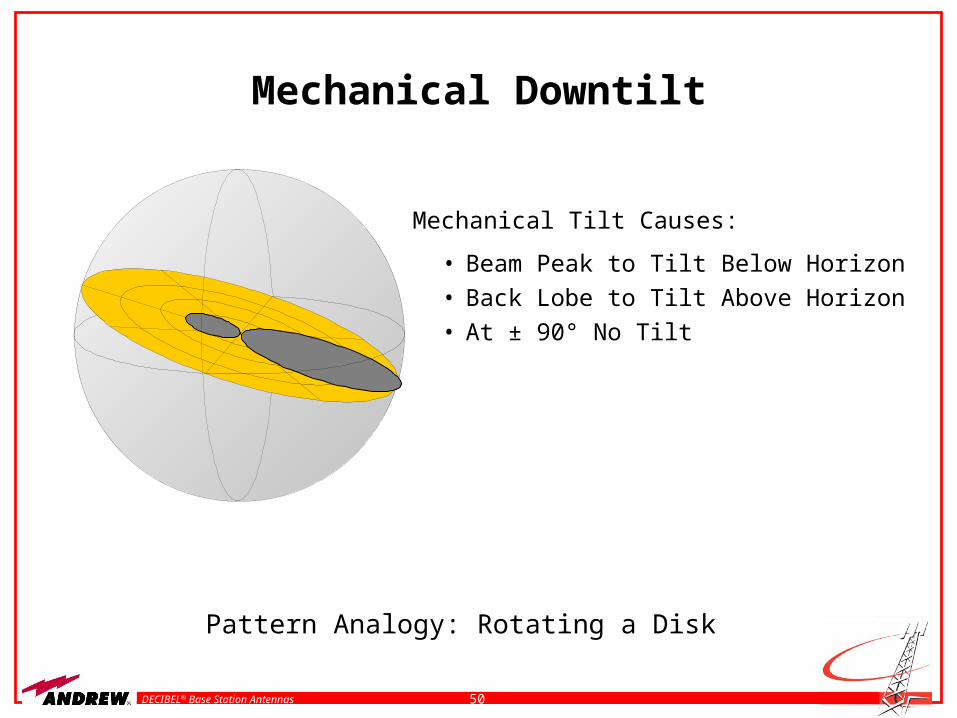
Mechanical Downtilt
Pattern Analogy: Rotating a Disk
Mechanical Tilt Causes:
• Beam Peak to Tilt Below Horizon
• Back Lobe to Tilt Above Horizon
• At ± 90° No Tilt
51DECIBEL® Base Station Antennas
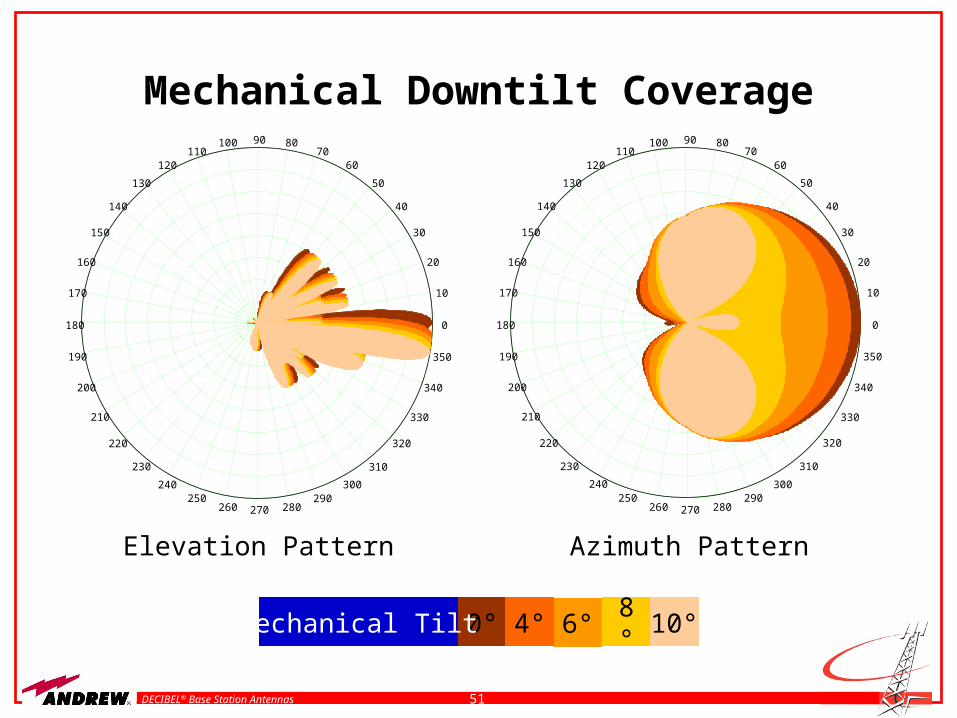
Mechanical Downtilt Coverage
0
10
20
30
40
50
6070
8090100110
120
130
140
150
160
170
180
190
200
210
220
230
240250
260 270 280290
300
310
320
330
340
350
0
10
20
30
40
50
6070
8090100110
120
130
140
150
160
170
180
190
200
210
220
230
240250
260 270 280290
300
310
320
330
340
350
8°0° 10°6°4°Mechanical Tilt
Elevation Pattern Azimuth Pattern
52DECIBEL® Base Station Antennas
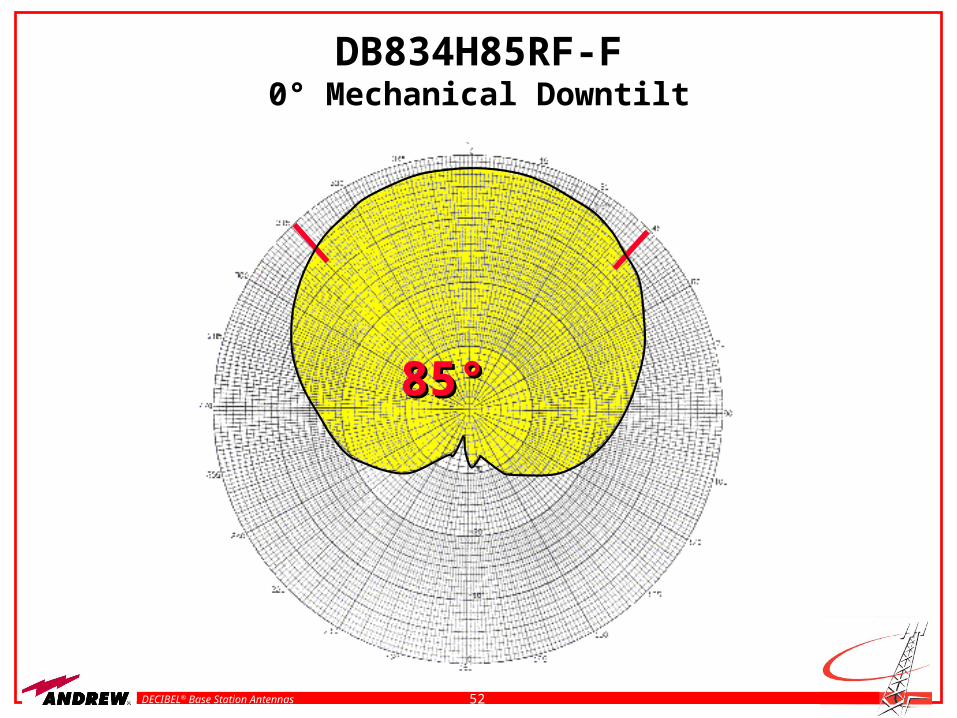
DB834H85RF-F0° Mechanical Downtilt
85°85°
53DECIBEL® Base Station Antennas
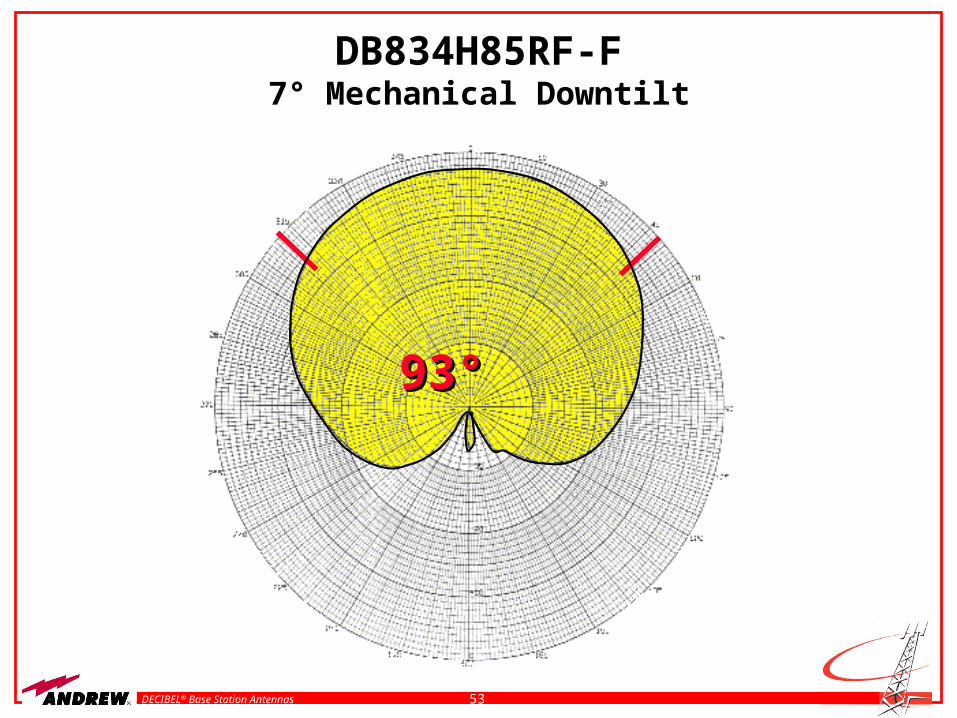
DB834H85RF-F7° Mechanical Downtilt
93°93°
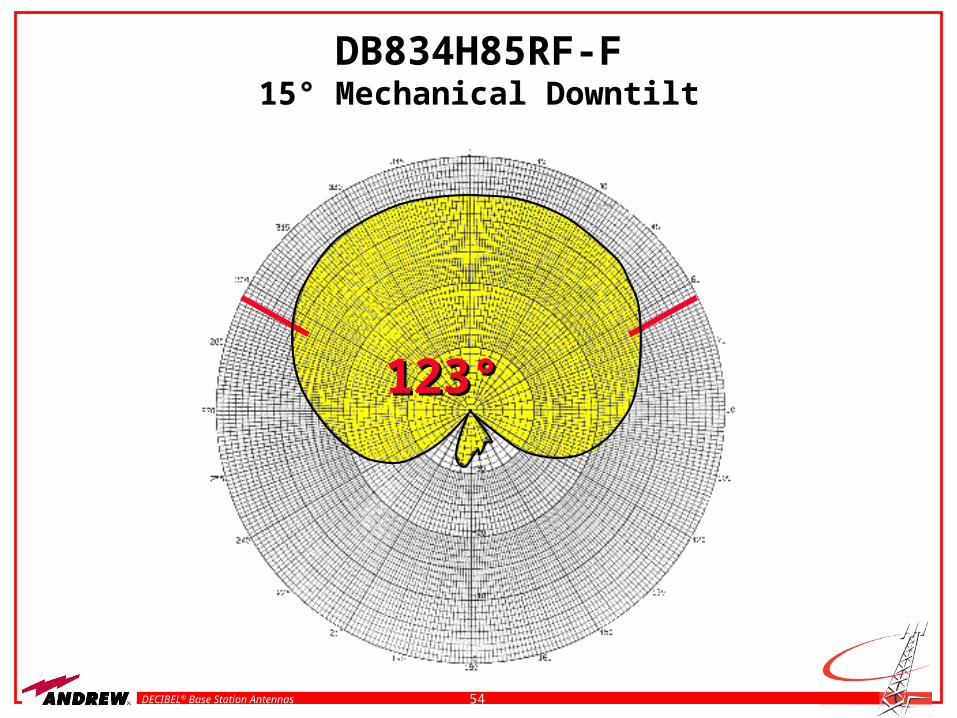
54DECIBEL® Base Station Antennas
DB834H85RF-F15° Mechanical Downtilt
123°123°
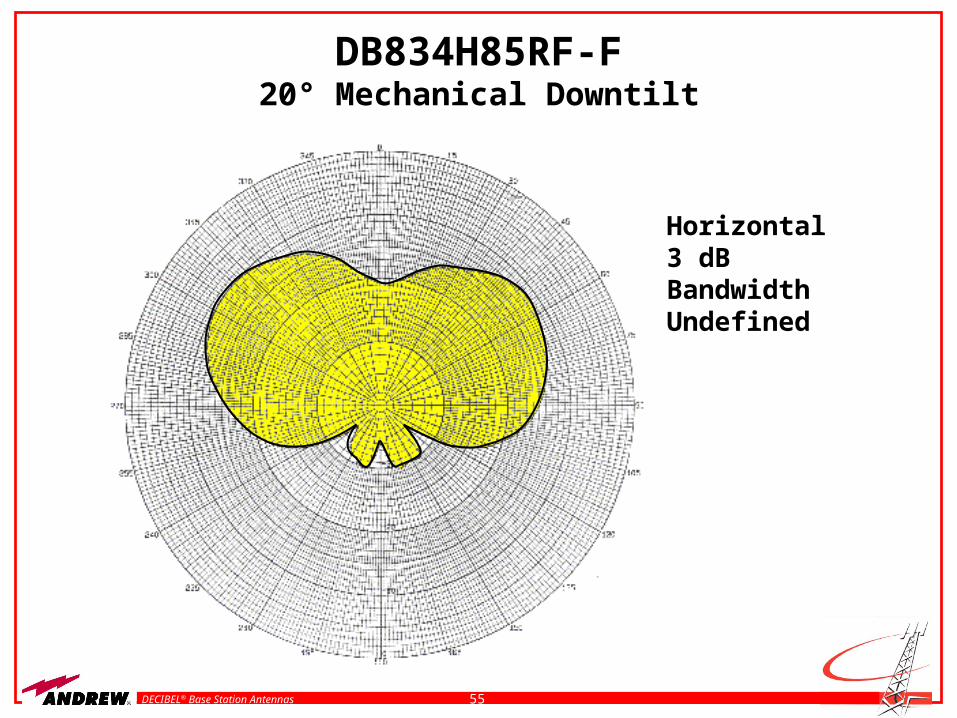
55DECIBEL® Base Station Antennas
DB834H85RF-F20° Mechanical Downtilt
Horizontal3 dB Bandwidth Undefined
56DECIBEL® Base Station Antennas
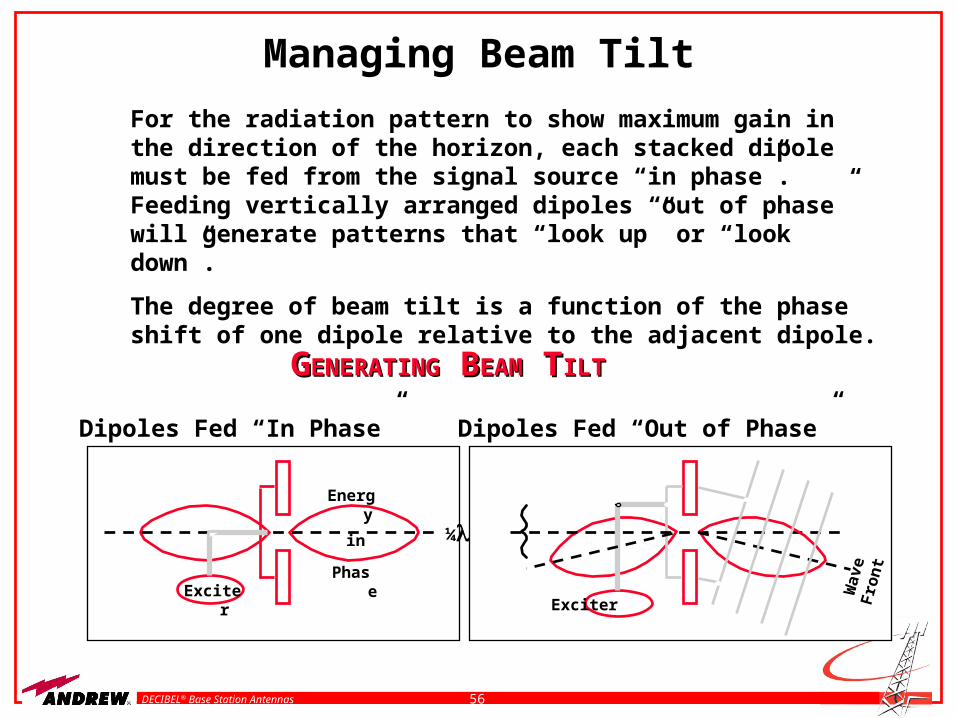
Managing Beam Tilt
For the radiation pattern to show maximum gain in the direction of the horizon, each stacked dipole must be fed from the signal source “in phase”. Feeding vertically arranged dipoles “out of phase” will generate patterns that “look up” or “look down”.
The degree of beam tilt is a function of the phase shift of one dipole relative to the adjacent dipole.
GGENERATINGENERATING B BEAMEAM T TILTILT
Dipoles Fed “In Phase” Dipoles Fed “Out of Phase”
Exciter
Phase
Energy
in
Wave
Fro
nt
Exciter
¼
57DECIBEL® Base Station Antennas
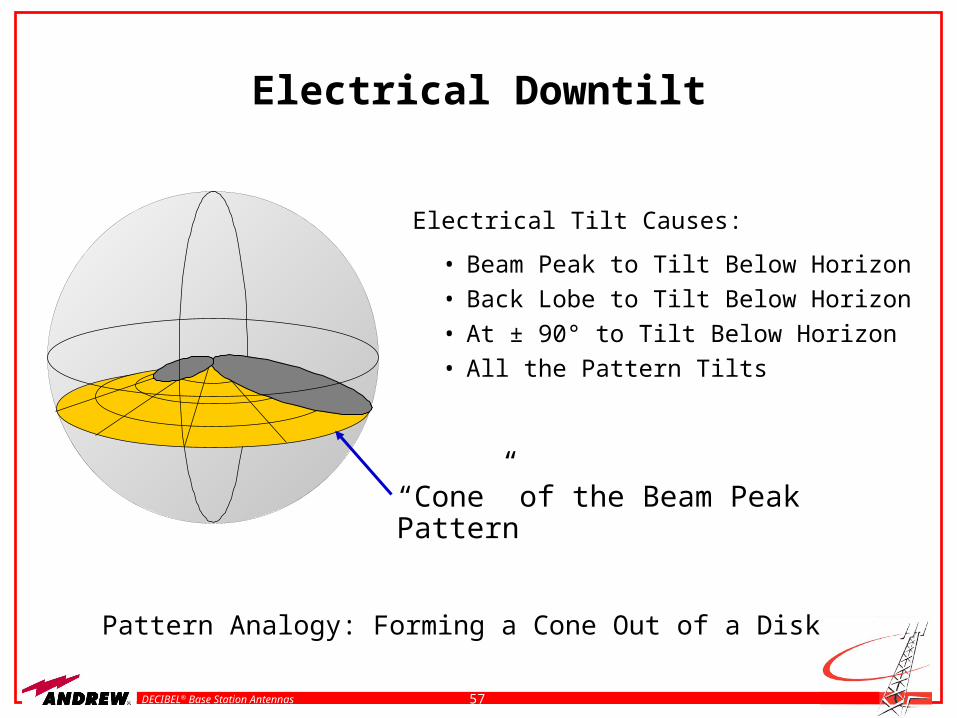
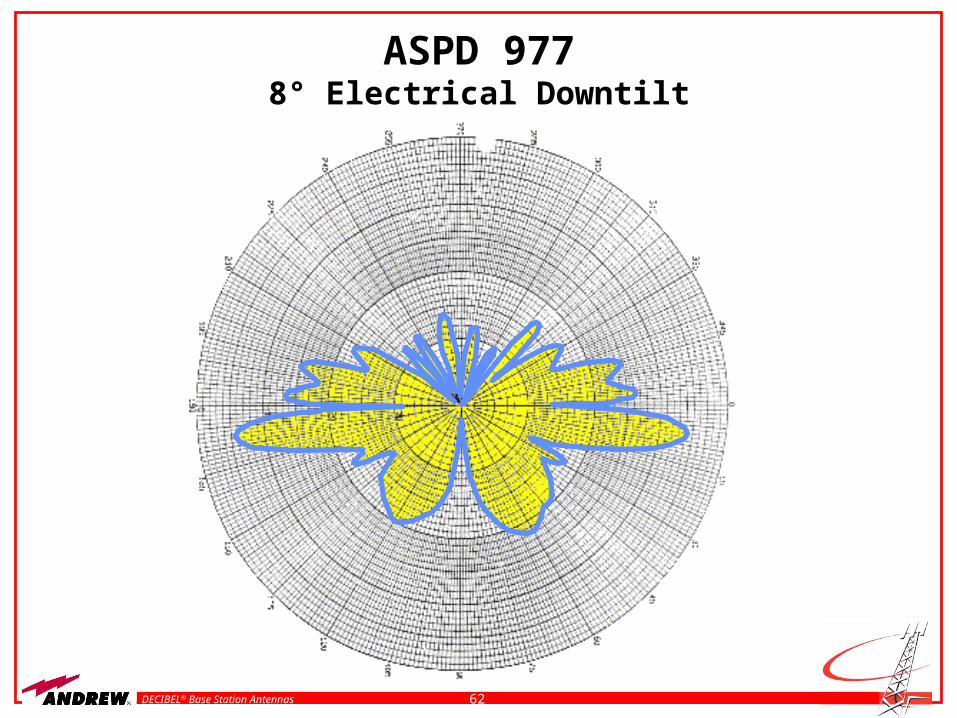
Electrical Downtilt
Pattern Analogy: Forming a Cone Out of a Disk
Electrical Tilt Causes:
• Beam Peak to Tilt Below Horizon
• Back Lobe to Tilt Below Horizon
• At ± 90° to Tilt Below Horizon
• All the Pattern Tilts
“Cone” of the Beam Peak Pattern
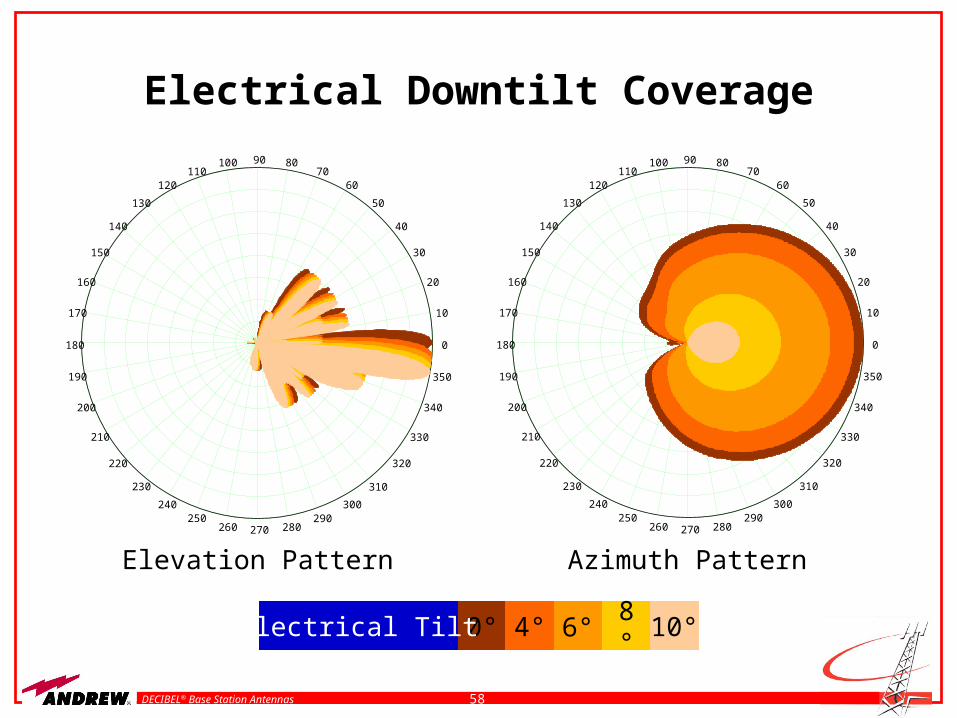
58DECIBEL® Base Station Antennas
Electrical Downtilt Coverage
0
10
20
30
40
50
6070
8090100110
120
130
140
150
160
170
180
190
200
210
220
230
240250
260 270 280290
300
310
320
330
340
350
8°0° 10°6°4°Electrical Tilt
0
10
20
30
40
50
6070
8090100110
120
130
140
150
160
170
180
190
200
210
220
230
240250
260 270 280290
300
310
320
330
340
350
Elevation Pattern Azimuth Pattern
59DECIBEL® Base Station Antennas
Mechanical vs. Electrical Downtilt
60DECIBEL® Base Station Antennas
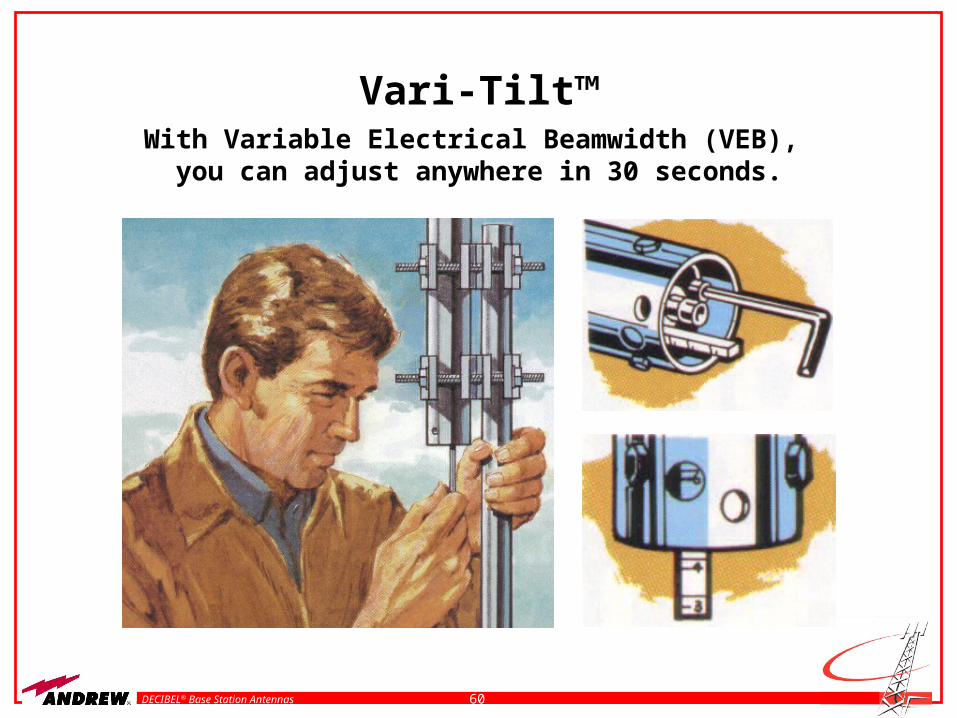
Vari-Tilt™With Variable Electrical Beamwidth (VEB),
you can adjust anywhere in 30 seconds.
61DECIBEL® Base Station Antennas
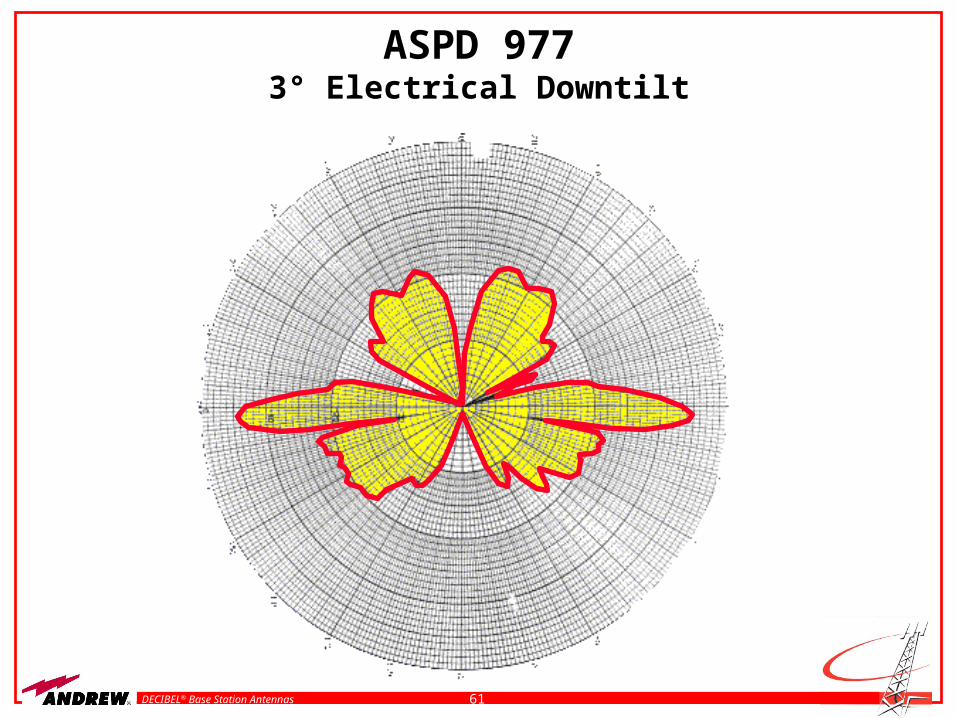
ASPD 9773° Electrical Downtilt
62DECIBEL® Base Station Antennas
ASPD 9778° Electrical Downtilt
63DECIBEL® Base Station Antennas
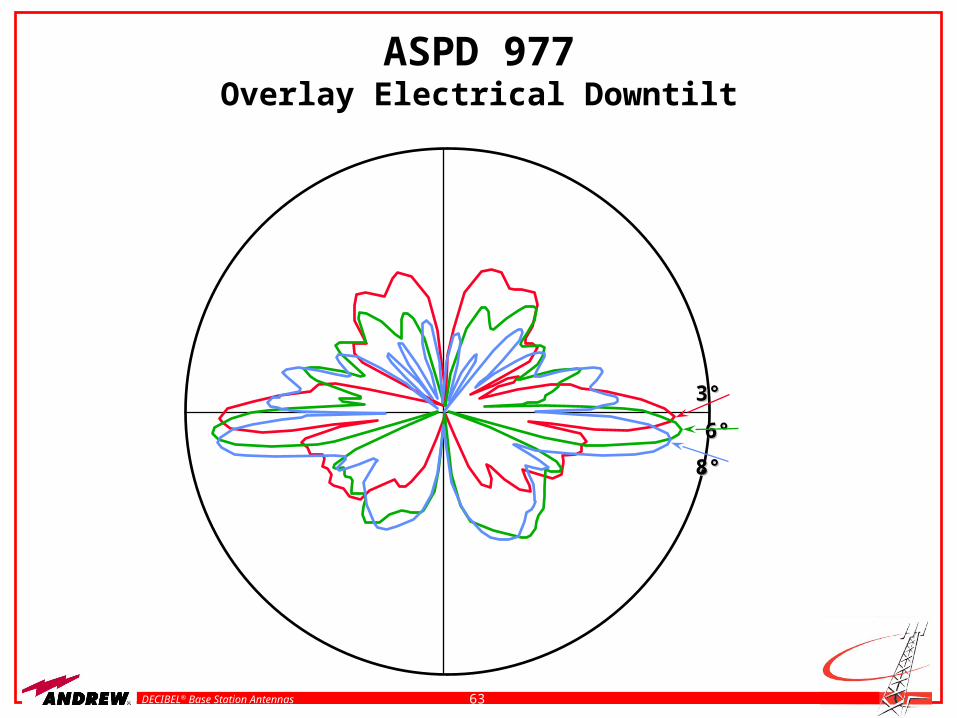
ASPD 977Overlay Electrical Downtilt
3°3°
6°6°
8°8°
64DECIBEL® Base Station Antennas
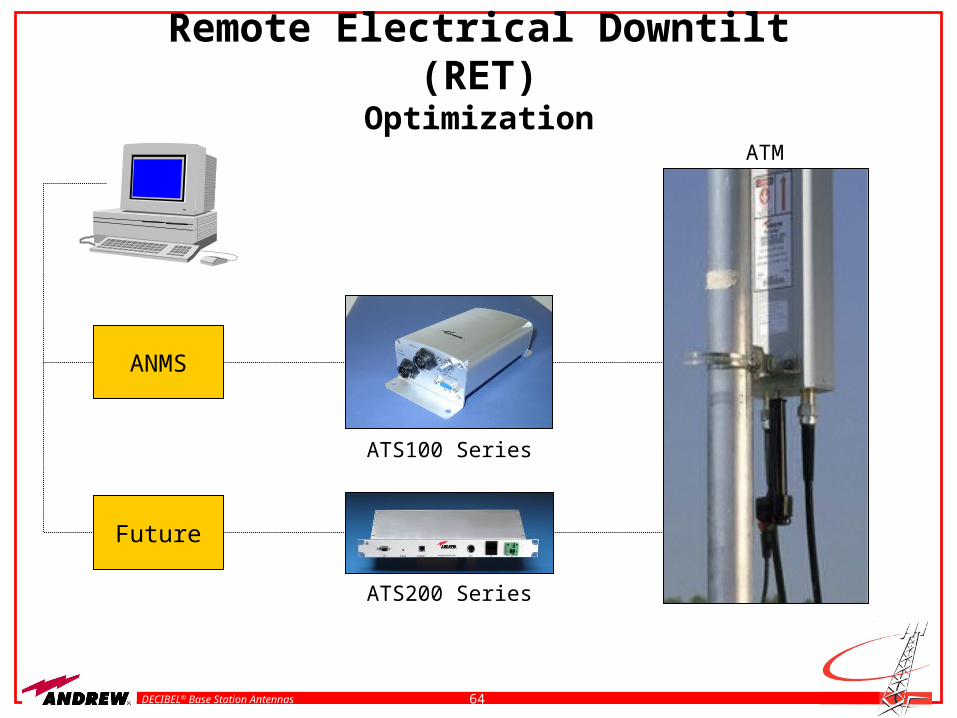
Remote Electrical Downtilt (RET)Optimization
ANMS
Future
ATS100 Series
ATS200 Series
ATM
65DECIBEL® Base Station Antennas
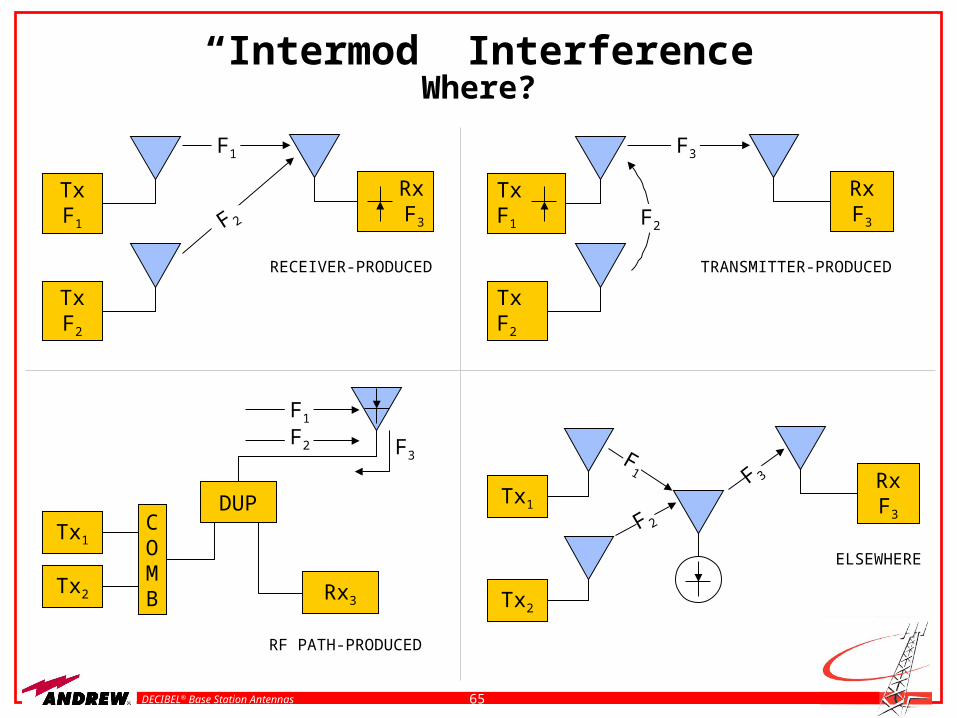
“Intermod” InterferenceWhere?
F1
TxF1
TxF2
RxF3
RECEIVER-PRODUCED
F 2
F3
TxF1
TxF2
RxF3
TRANSMITTER-PRODUCED
F2
F1
Rx3
RF PATH-PRODUCED
DUP
F2
Tx1
Tx2
COMB
F3
RxF3
ELSEWHERE
Tx1
Tx2
F1
F 2
F 3
66DECIBEL® Base Station Antennas
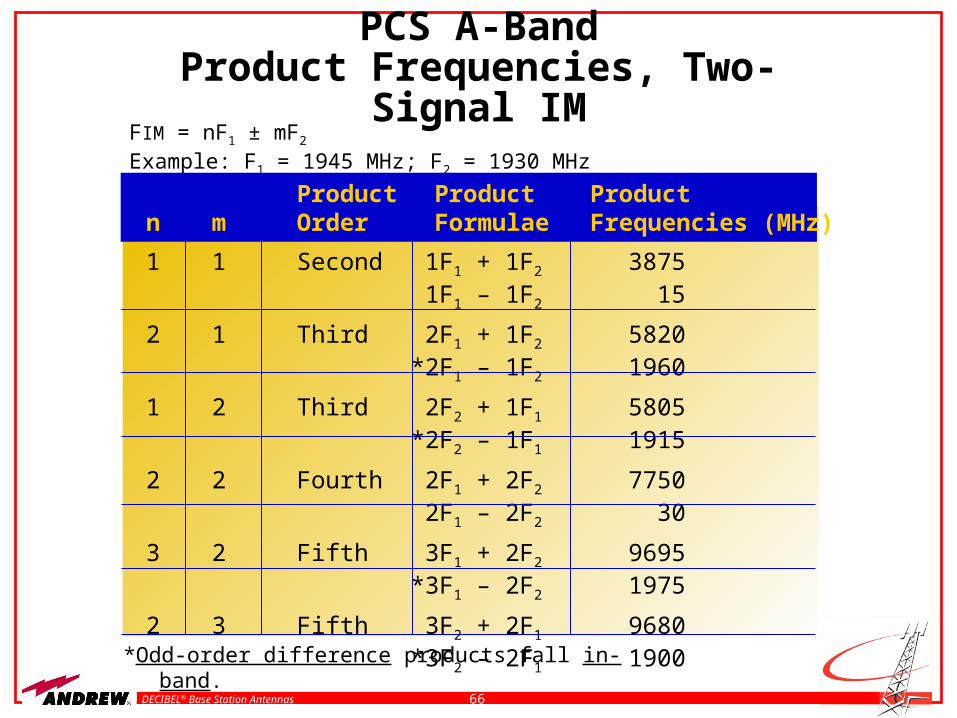
PCS A-BandProduct Frequencies, Two-Signal IM
FIM = nF1 ± mF2
Example: F1 = 1945 MHz; F2 = 1930 MHz
1 1 Second 1F1 + 1F2 38751F1 – 1F2 15
2 1 Third 2F1 + 1F2 5820*2F1 – 1F2 1960
1 2 Third 2F2 + 1F1 5805*2F2 – 1F1 1915
2 2 Fourth 2F1 + 2F2 77502F1 – 2F2 30
3 2 Fifth 3F1 + 2F2 9695*3F1 – 2F2 1975
2 3 Fifth 3F2 + 2F1 9680*3F2 – 2F1 1900
Product Product Productn m Order Formulae Frequencies (MHz)
*Odd-order difference products fall in-band.
67DECIBEL® Base Station Antennas
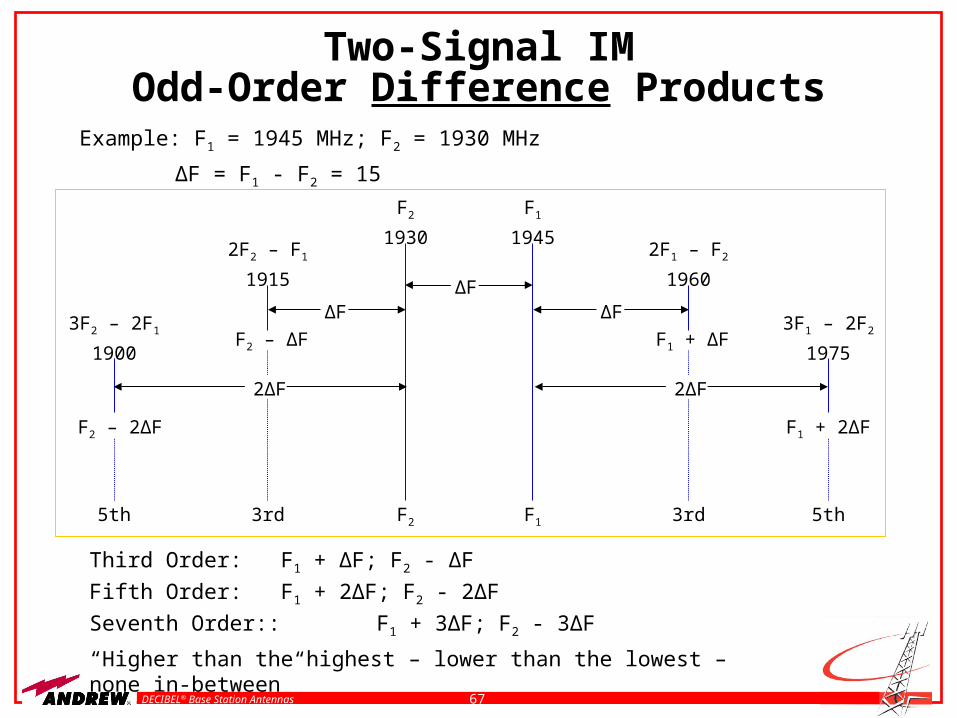
Two-Signal IMOdd-Order Difference Products
Example: F1 = 1945 MHz; F2 = 1930 MHz
ΔF = F1 - F2 = 15
Third Order: F1 + ΔF; F2 - ΔF
Fifth Order: F1 + 2ΔF; F2 - 2ΔF
Seventh Order:: F1 + 3ΔF; F2 - 3ΔF
“Higher than the highest – lower than the lowest – none in-between”
ΔF
5th
F2 – 2ΔF
3F2 – 2F1
1900
F2
F2
1930
F1
F1
1945
3rd
2F1 – F2
1960
F1 + ΔF
5th
F1 + 2ΔF
3F1 – 2F2
1975
3rd
2ΔF
2F2 – F1
1915
F2 – ΔF
2ΔF
ΔF ΔF
68DECIBEL® Base Station Antennas
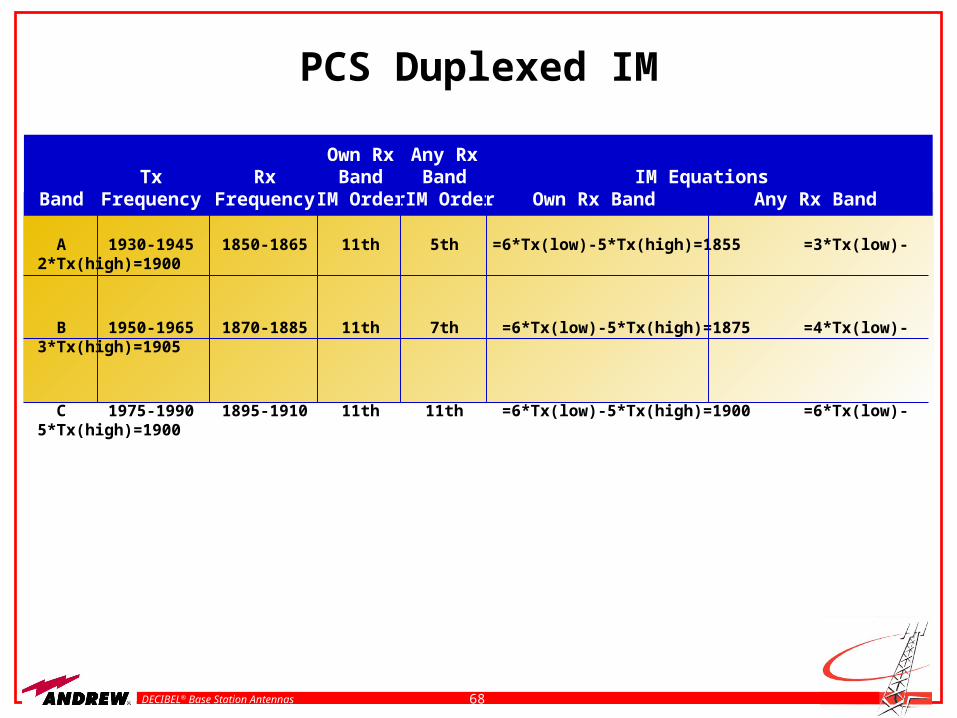
PCS Duplexed IM
Own Rx Any RxTx Rx Band Band IM Equations
Band Frequency Frequency IM Order IM Order Own Rx Band Any Rx Band
A 1930-1945 1850-1865 11th 5th =6*Tx(low)-5*Tx(high)=1855 =3*Tx(low)-2*Tx(high)=1900
B 1950-1965 1870-1885 11th 7th =6*Tx(low)-5*Tx(high)=1875 =4*Tx(low)-3*Tx(high)=1905
C 1975-1990 1895-1910 11th 11th =6*Tx(low)-5*Tx(high)=1900 =6*Tx(low)-5*Tx(high)=1900
69DECIBEL® Base Station Antennas
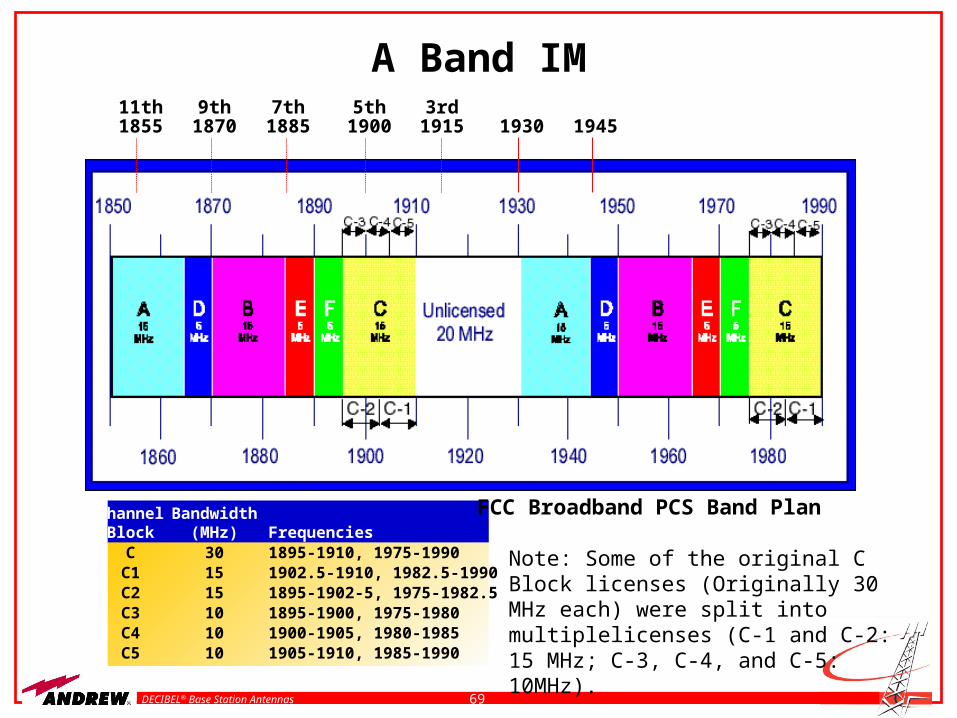
A Band IM11th1855
9th1870
7th1885
5th1900
3rd1915 1930 1945
Channel BandwidthBlock (MHz) Frequencies
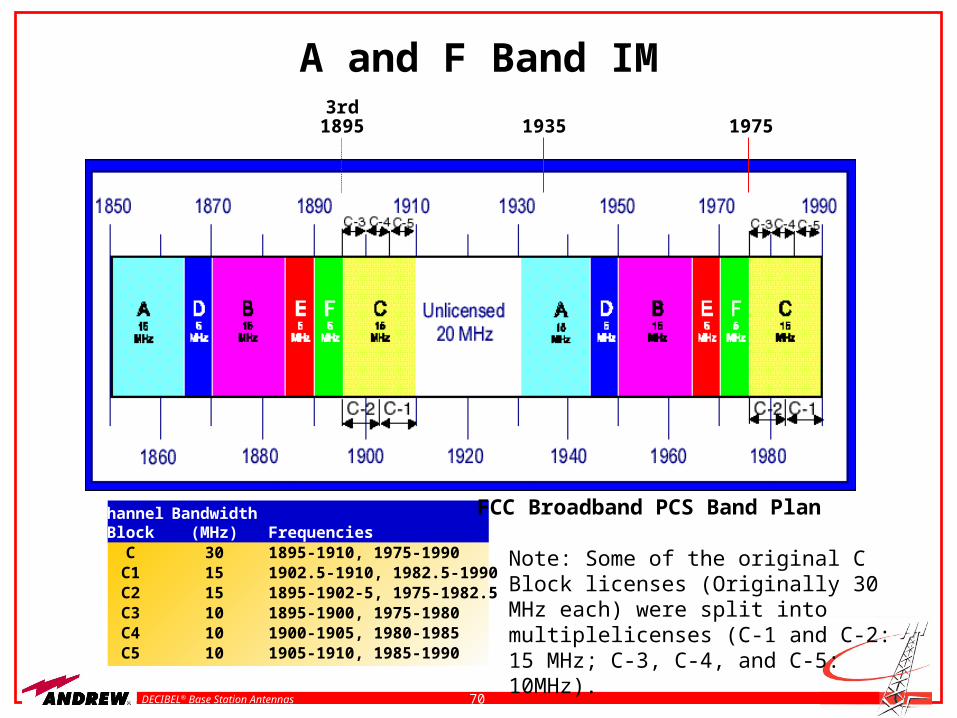
C 30 1895-1910, 1975-1990C1 15 1902.5-1910, 1982.5-1990C2 15 1895-1902-5, 1975-1982.5C3 10 1895-1900, 1975-1980C4 10 1900-1905, 1980-1985C5 10 1905-1910, 1985-1990
Note: Some of the original C Block licenses (Originally 30 MHz each) were split into multiplelicenses (C-1 and C-2: 15 MHz; C-3, C-4, and C-5: 10MHz).
FCC Broadband PCS Band Plan
70DECIBEL® Base Station Antennas
A and F Band IM3rd
1895 1935 1975
Channel BandwidthBlock (MHz) Frequencies
C 30 1895-1910, 1975-1990C1 15 1902.5-1910, 1982.5-1990C2 15 1895-1902-5, 1975-1982.5C3 10 1895-1900, 1975-1980C4 10 1900-1905, 1980-1985C5 10 1905-1910, 1985-1990
Note: Some of the original C Block licenses (Originally 30 MHz each) were split into multiplelicenses (C-1 and C-2: 15 MHz; C-3, C-4, and C-5: 10MHz).
FCC Broadband PCS Band Plan
71DECIBEL® Base Station Antennas
Causes of IMD
Ferromagnetic materials in the current path:
– Steel
– Nickel Plating or Underplating
Current Disruption:
– Loosely Contacting Surfaces
– Non-Conductive Oxide Layers Between Contact Surfaces
72DECIBEL® Base Station Antennas
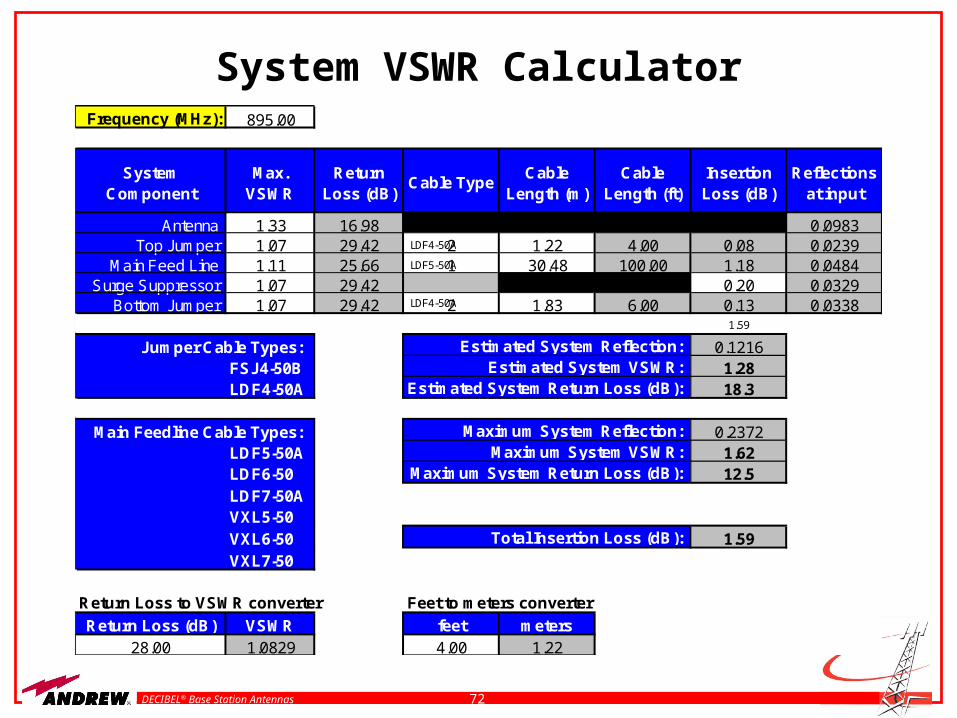
System VSWR CalculatorFrequency (MHz): 895.00
System Component
Max. VSWR
Return Loss (dB)
Cable TypeCable
Length (m)Cable
Length (ft)Insertion Loss (dB)
Reflections at input
Antenna 1.33 16.98 0.0983Top Jumper 1.07 29.42 2 1.22 4.00 0.08 0.0239
Main Feed Line 1.11 25.66 1 30.48 100.00 1.18 0.0484Surge Suppressor 1.07 29.42 0.20 0.0329
Bottom Jumper 1.07 29.42 2 1.83 6.00 0.13 0.03381.59
Jumper Cable Types: 0.1216FSJ4-50B 1.28LDF4-50A 18.3
Main Feedline Cable Types: 0.2372LDF5-50A 1.62LDF6-50 12.5LDF7-50AVXL5-50VXL6-50 1.59VXL7-50
Return Loss (dB) VSWR feet meters28.00 1.0829 4.00 1.22
Estimated System Reflection: Estimated System VSWR:
Estimated System Return Loss (dB):
Return Loss to VSWR converter Feet to meters converter
Maximum System Reflection: Maximum System VSWR:
Maximum System Return Loss (dB):
Total Insertion Loss (dB):
LDF4-50A
LDF5-50A
LDF4-50A
73DECIBEL® Base Station Antennas
Pattern Distortions
Conductive (metallic) obstruction in the path of transmit and/or receive antennas may distort antenna radiation patterns in a way that causes systems coverage problems and degradation of communications services.
A few basic precautions will prevent pattern distortions.
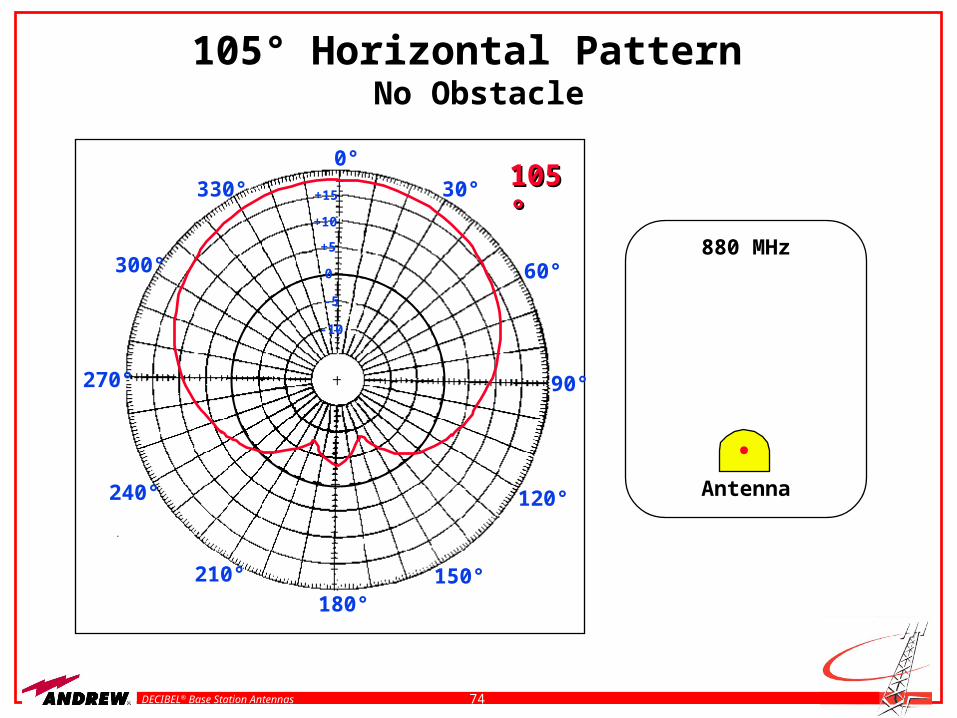
74DECIBEL® Base Station Antennas
105° Horizontal Pattern No Obstacle
Antenna
880 MHz300°
105°105°330°
270°
240°
210°
180°150°
120°
60°
30°
0°
90°
-5
0
+5
+10
+15
-10
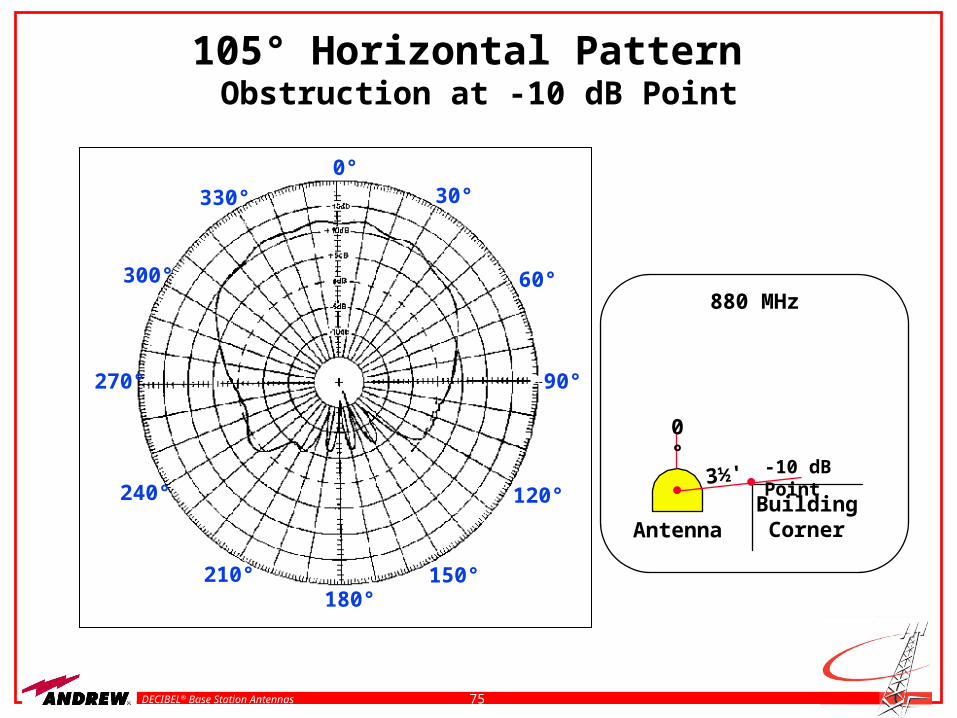
75DECIBEL® Base Station Antennas
105° Horizontal Pattern Obstruction at -10 dB Point
330°
300°
270°
240°
210°180°
150°
120°
90°
60°
30°0°
Antenna
880 MHz
0°
3½' -10 dB Point
BuildingCorner
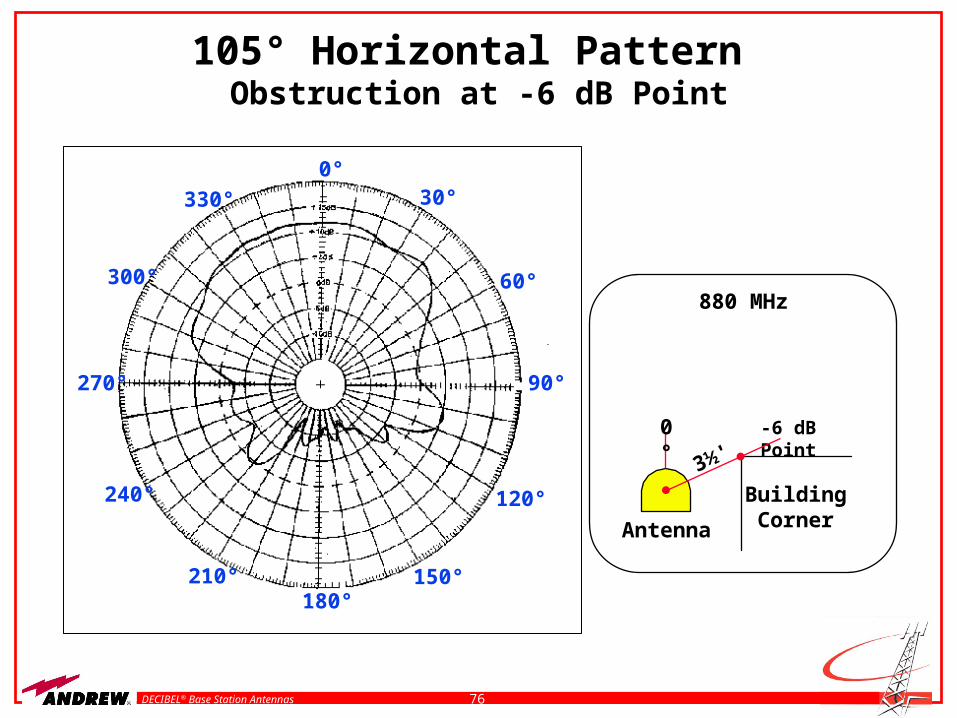
76DECIBEL® Base Station Antennas
105° Horizontal Pattern Obstruction at -6 dB Point
330°
300°
270°
240°
210°180°
150°
120°
90°
60°
30°0°
880 MHz
Antenna
0°
3½'-6 dB Point
BuildingCorner
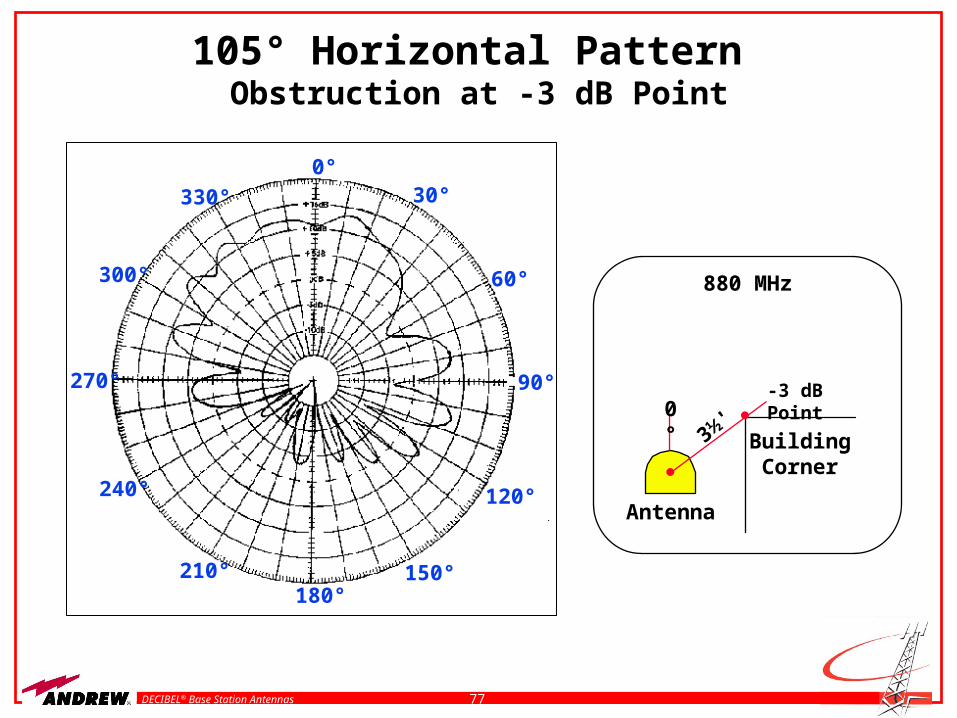
77DECIBEL® Base Station Antennas
105° Horizontal Pattern Obstruction at -3 dB Point
330°
300°
270°
240°
210°180°
150°
120°
90°
60°
30°0°
880 MHz
Antenna
0°3½'
-3 dB Point
BuildingCorner
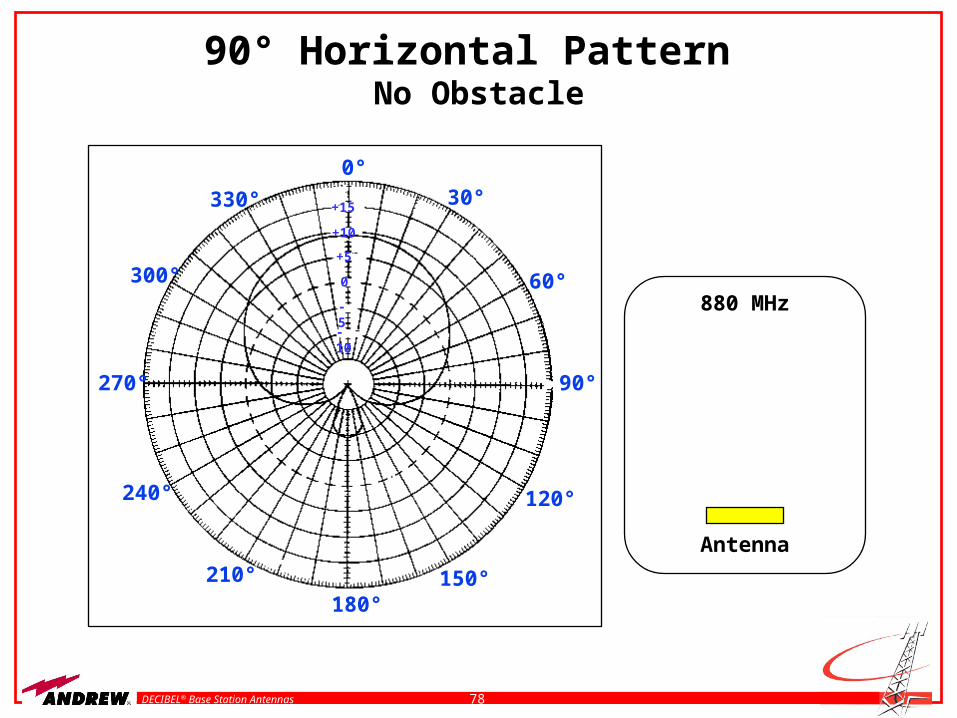
78DECIBEL® Base Station Antennas
90° Horizontal Pattern No Obstacle
Antenna
880 MHz
330°
300°
270°
240°
210°
180°150°
120°
90°
60°
30°
0°
-5
0
+5
+10
+15
-10
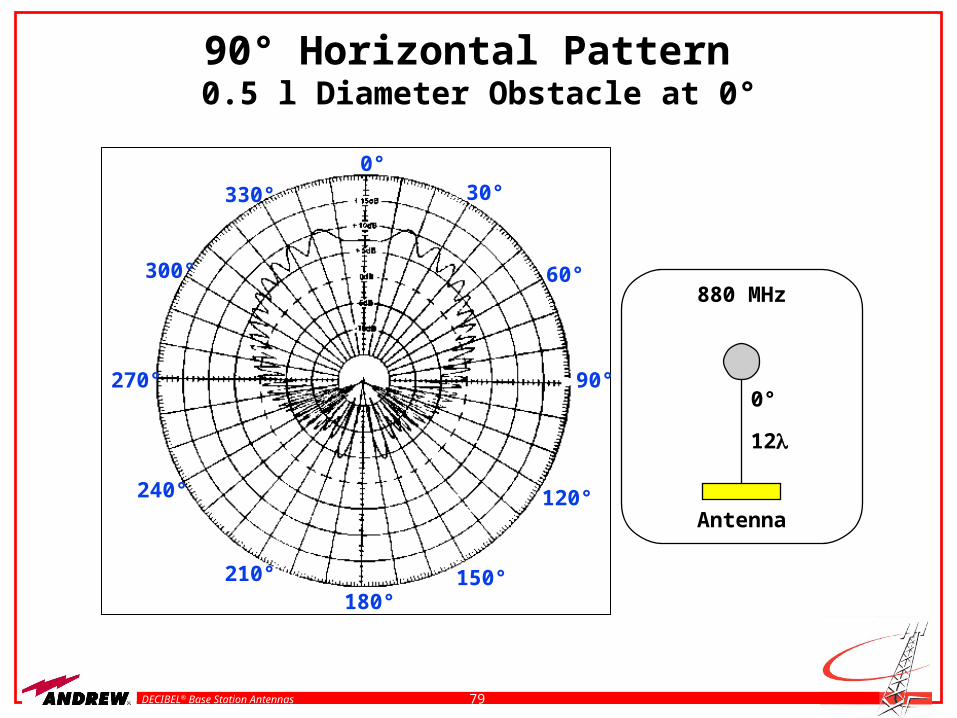
79DECIBEL® Base Station Antennas
90° Horizontal Pattern 0.5 l Diameter Obstacle at 0°
330°
300°
270°
240°
210°180°
150°
120°
90°
60°
30°0°
880 MHz
Antenna
0°
12
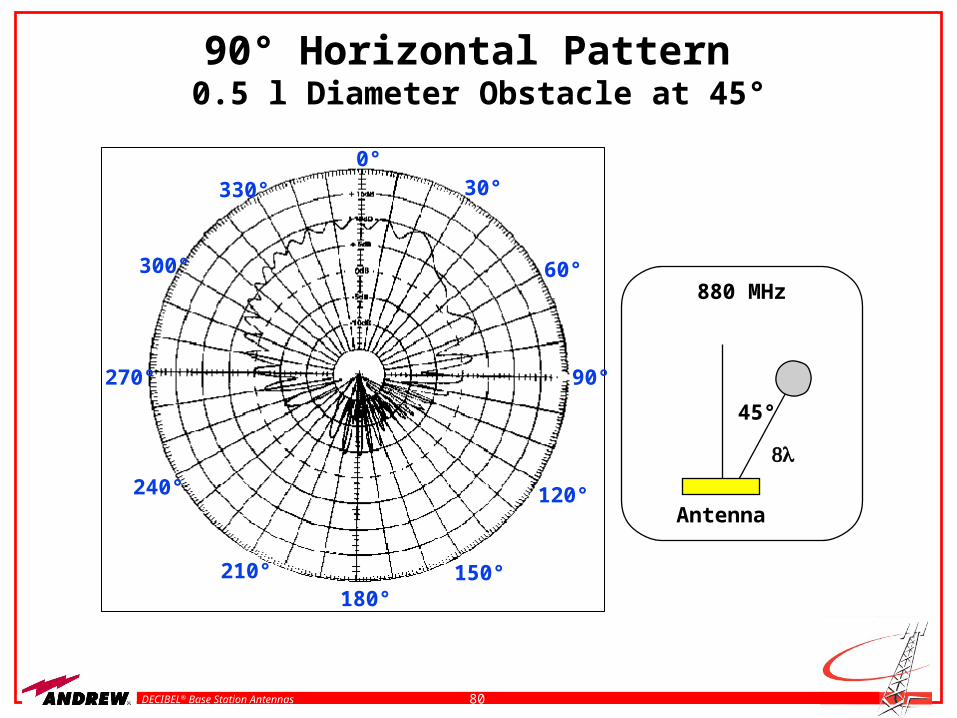
80DECIBEL® Base Station Antennas
90° Horizontal Pattern 0.5 l Diameter Obstacle at 45°
330°
300°
270°
240°
210°180°
150°
120°
90°
60°
30°0°
880 MHz
Antenna
45°
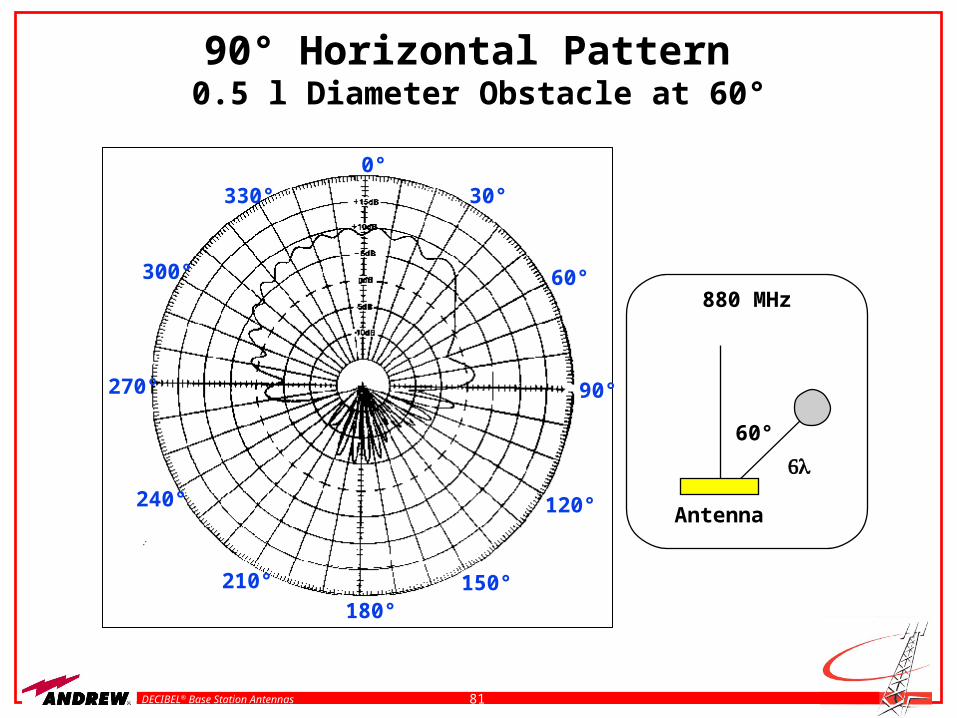
81DECIBEL® Base Station Antennas
90° Horizontal Pattern 0.5 l Diameter Obstacle at 60°
330°
300°
270°
240°
210°
180°150°
120°
60°
30°
0°
90°
880 MHz
Antenna
60°
82DECIBEL® Base Station Antennas
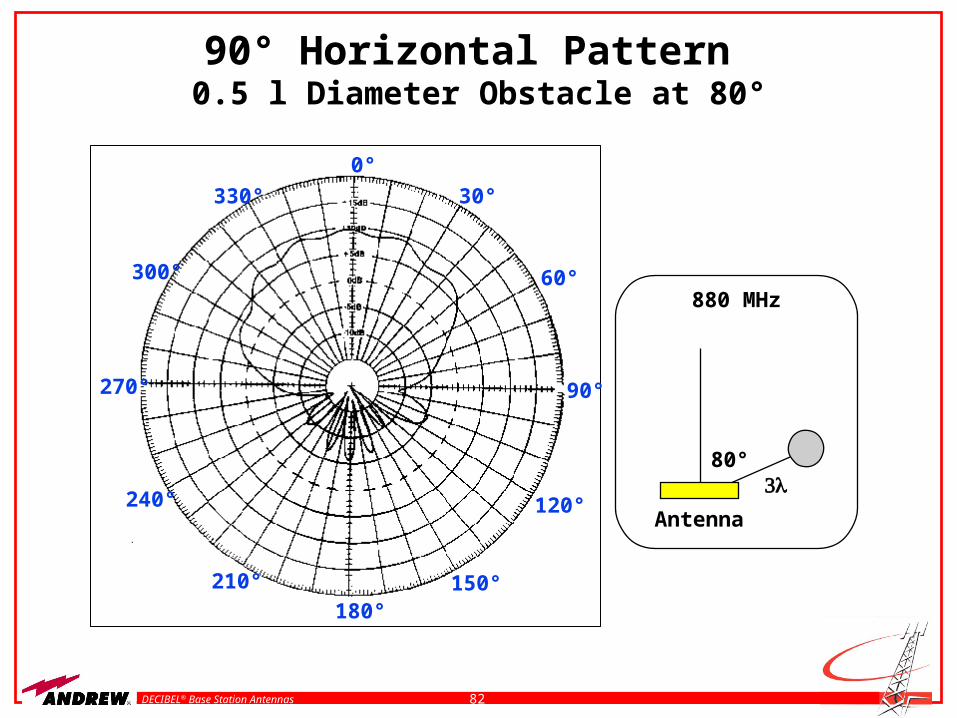
90° Horizontal Pattern 0.5 l Diameter Obstacle at 80°
330°
300°
270°
240°
210°
180°150°
120°
60°
30°
0°
90°
880 MHz
Antenna
80°
83DECIBEL® Base Station Antennas
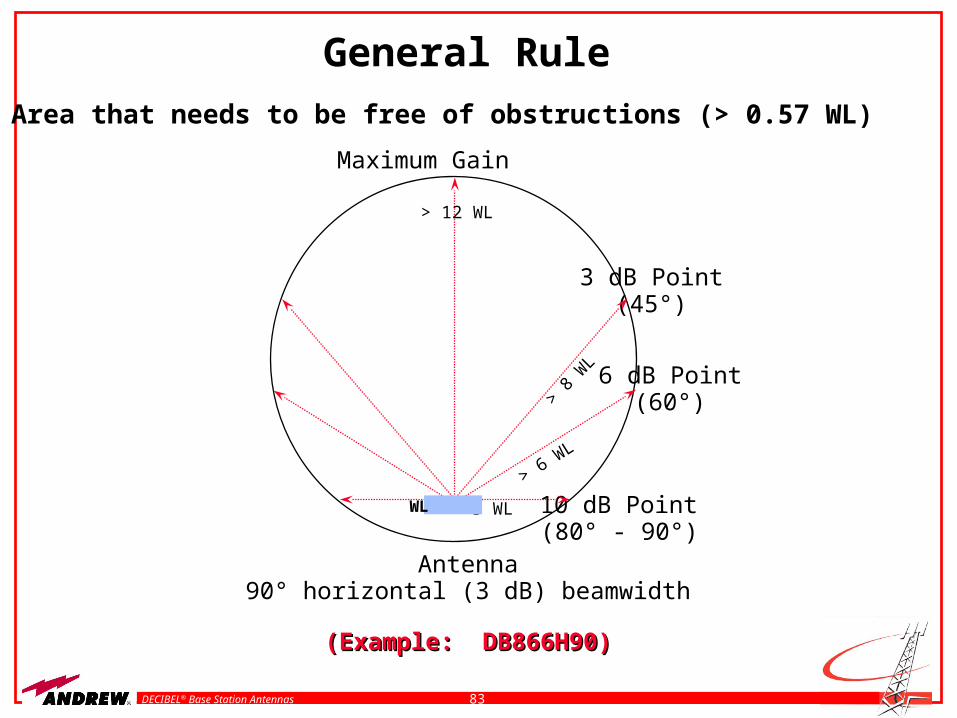
General Rule
Area that needs to be free of obstructions (> 0.57 WL)
(Example: DB866H90)(Example: DB866H90)
Antenna90° horizontal (3 dB) beamwidth
Maximum Gain
3 dB Point(45°)
6 dB Point(60°)
10 dB Point(80° - 90°)
> 12 WL
> 8
WL
> 6 WL
> 3 WLWL
84DECIBEL® Base Station Antennas
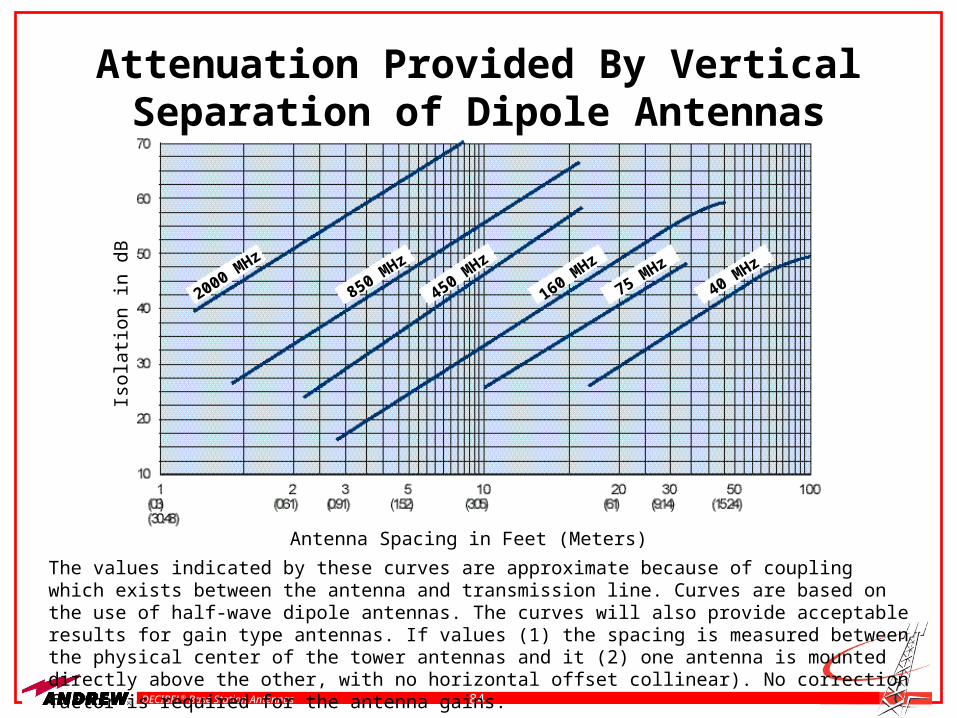
Antenna Spacing in Feet (Meters)
The values indicated by these curves are approximate because of coupling which exists between the antenna and transmission line. Curves are based on the use of half-wave dipole antennas. The curves will also provide acceptable results for gain type antennas. If values (1) the spacing is measured between the physical center of the tower antennas and it (2) one antenna is mounted directly above the other, with no horizontal offset collinear). No correction factor is required for the antenna gains.
Iso
latio
n in
dB
2000 MHz
850 MHz
450 MHz
160 MHz
75 MHz
40 MHz
Attenuation Provided By VerticalSeparation of Dipole Antennas

85DECIBEL® Base Station Antennas
Attenuation Provided By HorizontalSeparation of Dipole Antennas
Antenna Spacing in Feet (Meters)
Curves are based on the use of half-wave dipole antennas. The curves will also provide acceptable results for gain type antennas if (1) the indicated isolation is reduced by the sum of the antenna gains and (2) the spacing between the gain antennas is at least 50 ft. (15.24 m) (approximately the far field).
Iso
latio
n in
dB
2000 MHz
850 MHz
450 MHz
150 MHz
70 MHz
30 MHz50 MHz

86DECIBEL® Base Station Antennas
Pattern Distortions
tan a =
d = D * tan atan 1° = 0.01745
for 0° a 10° : tan a = a * tan 1°
Note: tan 10° = 0.1763 10 * 0.01745 = 0.1745
dD
a
87DECIBEL® Base Station Antennas
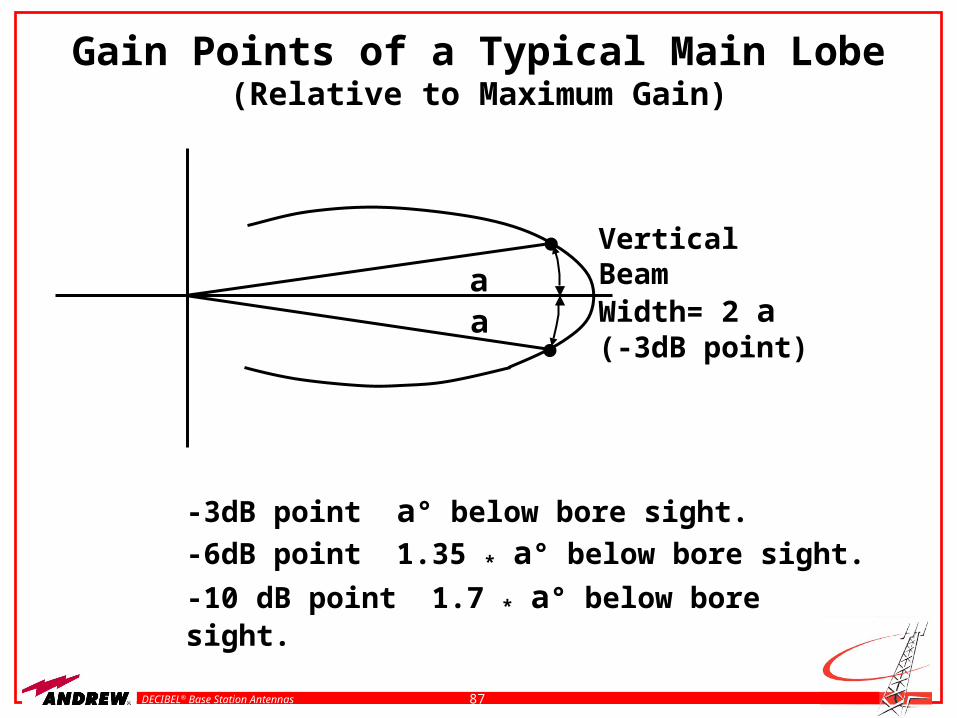
Gain Points of a Typical Main Lobe(Relative to Maximum Gain)
-3dB point a° below bore sight.
-6dB point 1.35 * a° below bore sight.
-10 dB point 1.7 * a° below bore sight.
Vertical BeamWidth= 2 a(-3dB point)
aa
88DECIBEL® Base Station Antennas
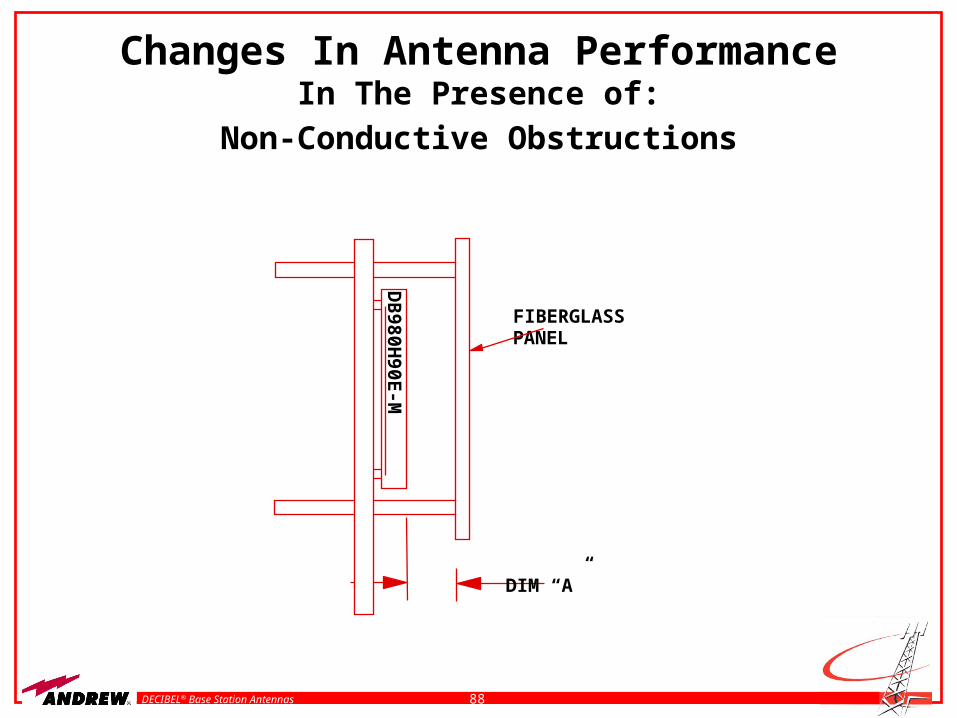
Changes In Antenna PerformanceIn The Presence of:
Non-Conductive Obstructions
FIBERGLASSPANEL
DB
980H
90E
-MDIM “A”
89DECIBEL® Base Station Antennas
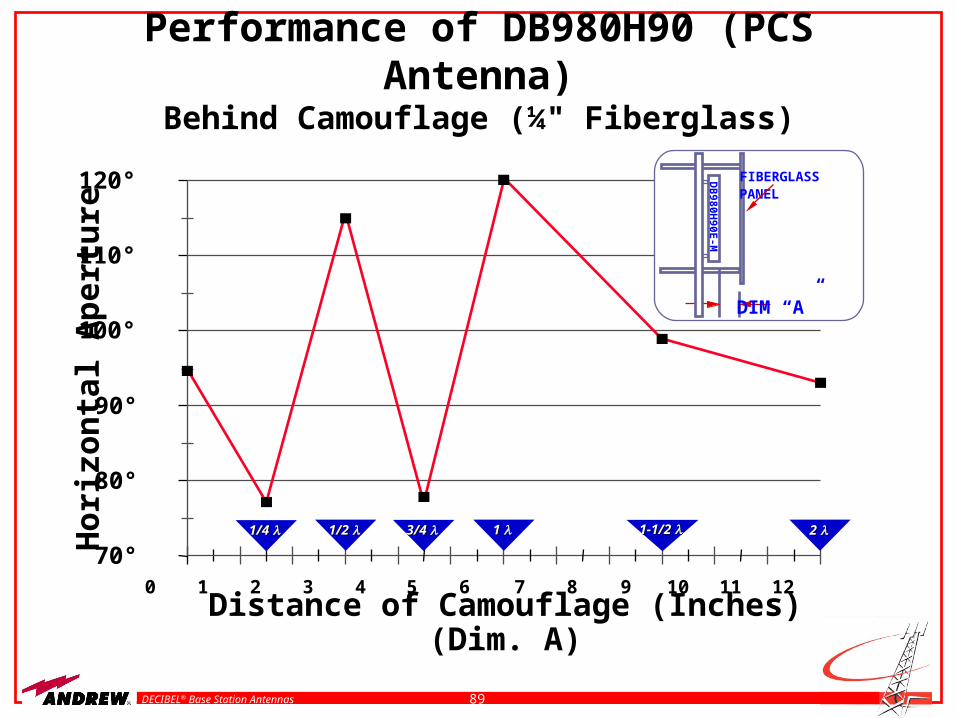
Performance of DB980H90 (PCS Antenna)Behind Camouflage (¼" Fiberglass)
70°
80°
90°
100°
110°
120°
10 2 3 4 5 6 7 8 9 10 11 12
1/4 1/4 1/2 1/2 1 1 2 2 1-1/2 1-1/2 3/4 3/4
Distance of Camouflage (Inches) (Dim. A)
Hor
izon
tal A
per
ture
FIBERGLASSPANEL
DIM “A”
DB
980H90E
-M
90DECIBEL® Base Station Antennas
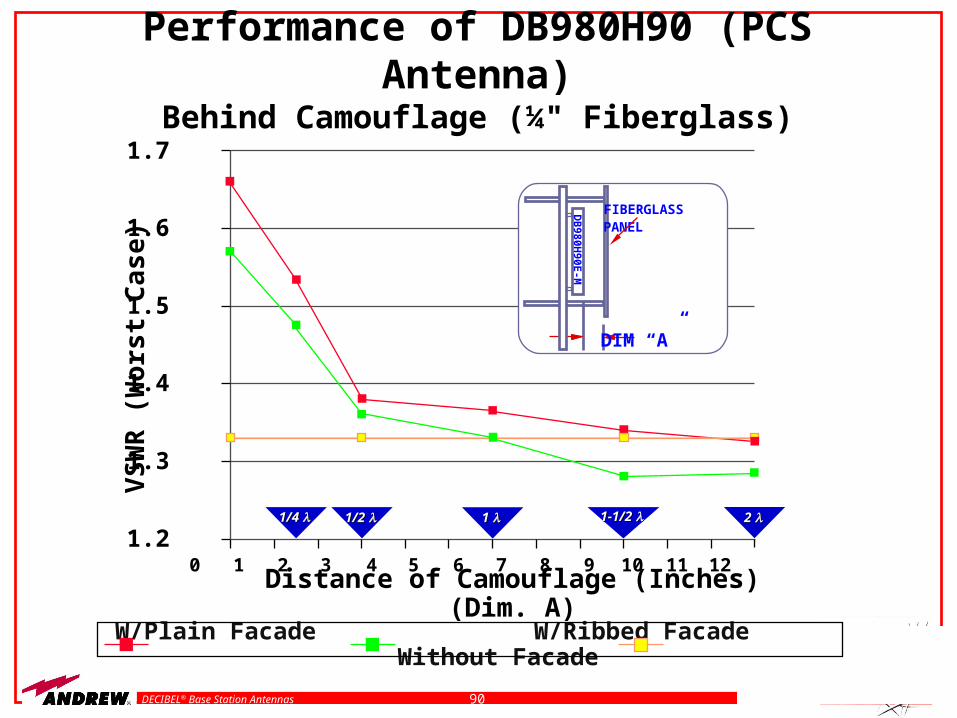
1.2
1.3
1.4
1.5
1.6
1.7
10 2 3 4 5 6 7 8 9 10 11 12
Distance of Camouflage (Inches) (Dim. A)
VS
WR
(W
orst
Cas
e)
W/Plain Facade W/Ribbed Facade Without Facade
Performance of DB980H90 (PCS Antenna)Behind Camouflage (¼" Fiberglass)
FIBERGLASSPANEL
DIM “A”
DB
980H90E
-M
1/4 1/4 1/2 1/2 1 1 2 2 1-1/2 1-1/2
91DECIBEL® Base Station Antennas
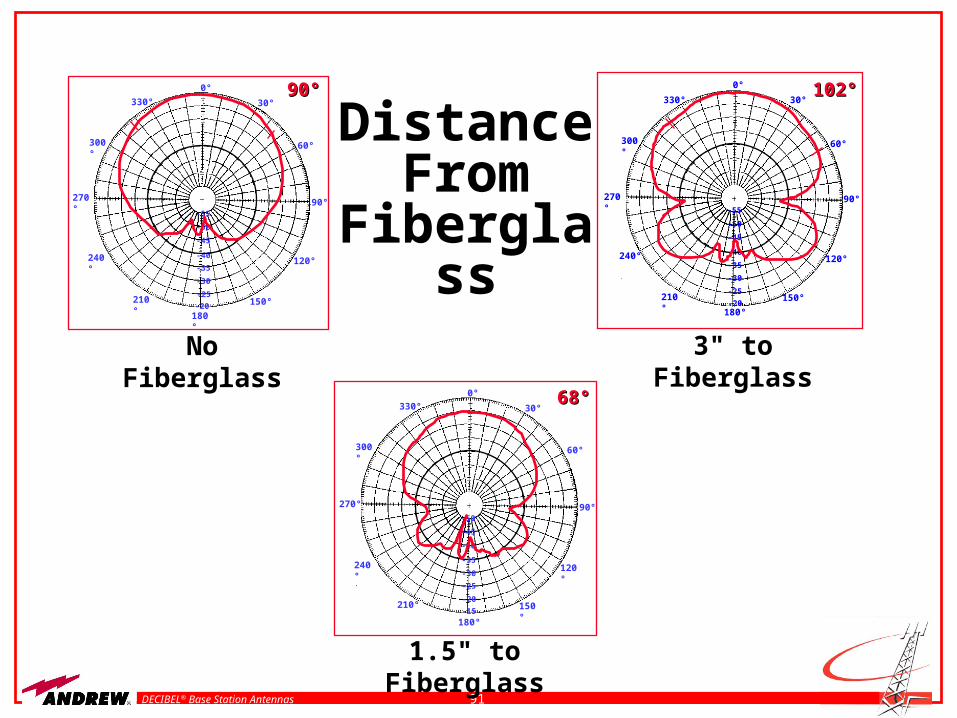
Distance From
Fiberglass
No Fiberglass
330°
300°
270°
240°
210°
180°
150°
120°
60°
30°
0°
90°
90°90°
-20
-25
-30
-35
-40
-45
-50
-55
330°
300°
270°
240°
210°
180°
150°
120°
60°
30°
0° 68°68°
90°
-20
-25
-30
-35
-40
-45
-50
-15
1.5" to Fiberglass
3" to Fiberglass
330°
300°
270°
240°
210°
180°
150°
120°
60°
30°
0° 102°102°
90°
-25
-30
-35
-40
-45
-50
-55
-20
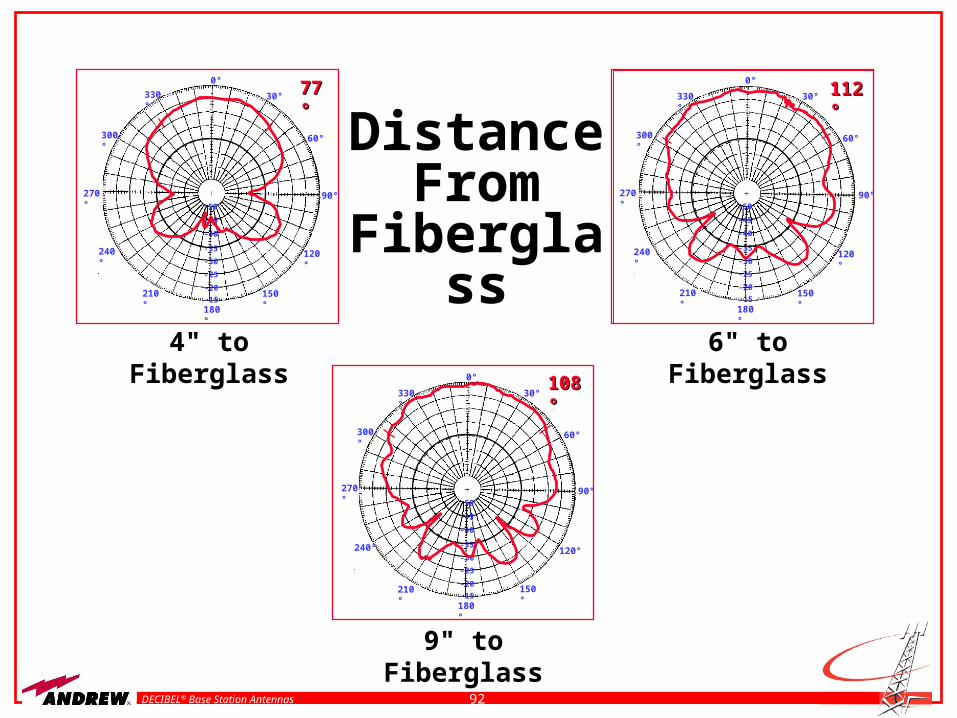
92DECIBEL® Base Station Antennas
Distance From
Fiberglass6" to Fiberglass
330°
300°
270°
240°
210°
180°
150°
120°
60°
30°
0°112°112°
-20
-25
-30
-35
-40
-45
-50
-15
90°
4" to Fiberglass
330°
300°
270°
240°
210°
180°
150°
120°
60°
30°
0°77°77°
90°
-20
-25
-30
-35
-40
-45
-50
-15
9" to Fiberglass
330°
300°
270°
240°
210°
180°
150°
120°
60°
30°
0° 108°108°
90°
-20
-25
-30
-35
-40
-45
-50
-15


