Building Capacity for Environmental Management and Emissions Trading in
Taiyuan, China
Alan KrupnickResources for the Future
International Perspectives on Air QualityJanuary 31 - February 1, 2005
National Institute for Public HealthSala de Seminarios
Cuernavaca, Mexico
Overall Objectives
• Establish a workable emissions trading system in Taiyuan
• Extensive system design and capacity building in advance of actual trading
• Trades should occur during a demonstration period

Background
• Supported by Asian Development Bank
• Technical assistance provided by RFF, CRAES, NILU, others
• EPA helps provide training and software

Taiyuan, China
Background(Continued)
• Heavy coal production and consumption in Taiyuan
• One of the most polluted large cities in China– High SO2 concentrations: 200 ug/m3 (2000)– Significant annual SO2 emissions: 258,000
tons (2000)
Background(Continued)
• Government goal to reduce emissions to 50% below 2000 levels in 2005– Ambitious goal, (that will clearly not be met)– Government interested in using emissions
trading to lower costs, improve management system

Institutional Issues Going In
Too many agencies; unclear areas of authority Weak EPB and environmental mgmt system Limited emissions, public health information Weak enforcement and focus on pollutant concentrations, not mass emissions Manual (stack) monitoring vs CEMs

Approach
Funding for local participation Many workshops and meetings plus papers to define good environmental management and steps for emissions trading program Detailed examination of environmental management system Software development Seven training sessions for government and industry managers


Milestones
Established scope Established facility-specific emissions caps Issuance of ET Regulation by Taiyuan Development of Emissions Tracking System Development of Allowance Tracking System Capacity Building through workshops Demonstration
– Lanxin Chemical Co bought 47 tons SO2 from Jinxi Machinery Co. @ 1500 yuan/t for one year)

Further Progress
7 ambient monitoring stations connected to central station
19 sources installed CEMs connected to central station
EPB says, “We will implement SO2 trading in TY, and ask the new enterprises to buy allowances from the existing ones.”
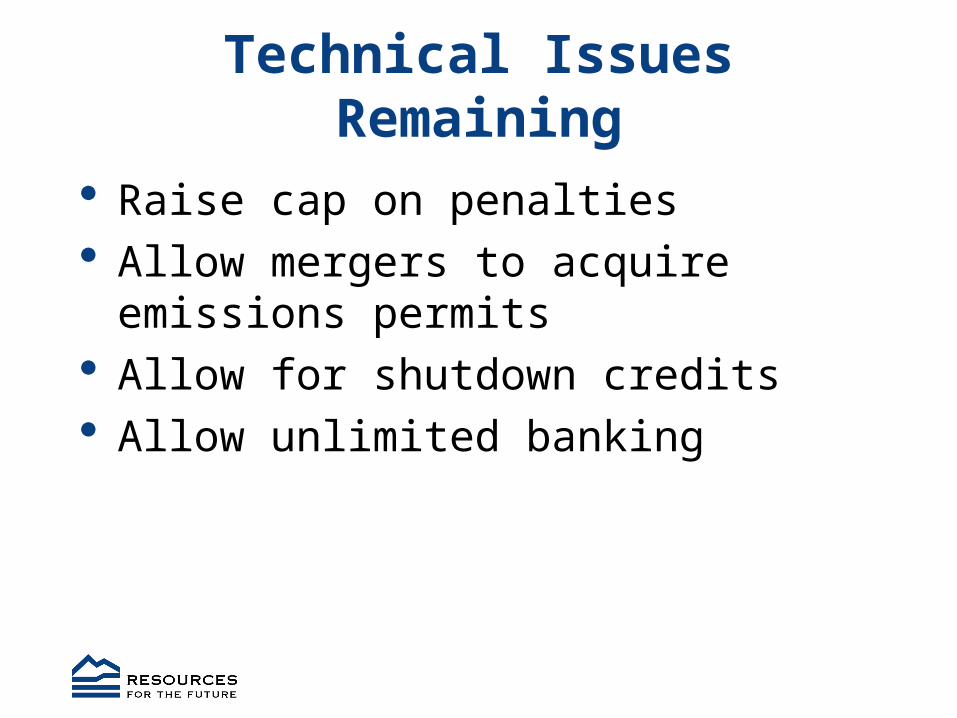
Technical Issues Remaining
Raise cap on penalties Allow mergers to acquire emissions permits Allow for shutdown credits Allow unlimited banking
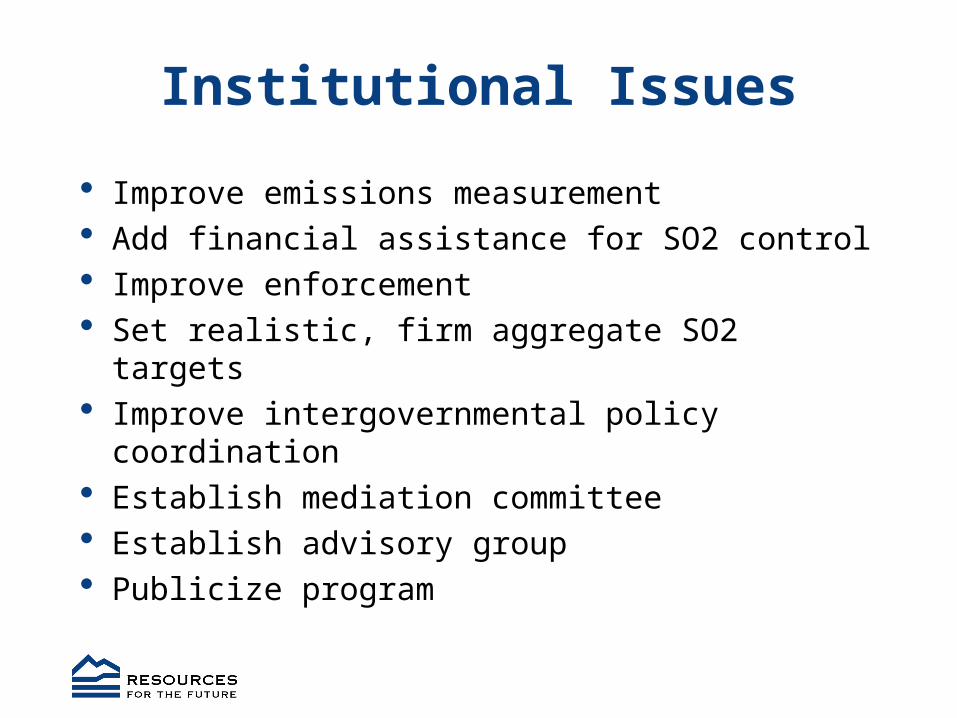
Institutional Issues
Improve emissions measurement Add financial assistance for SO2 control Improve enforcement Set realistic, firm aggregate SO2 targets Improve intergovernmental policy coordination Establish mediation committee Establish advisory group Publicize program

Lessons Learned Understand what it takes to build capacity
– Software, audit, meetings, trainings, leadership buy-in and participation, legal foundation
Need attention to big picture and details Use lending/grant institutions for money and
leverage Need to fix environmental management system
first Consider other policies Urban trading largely untested

STOP here
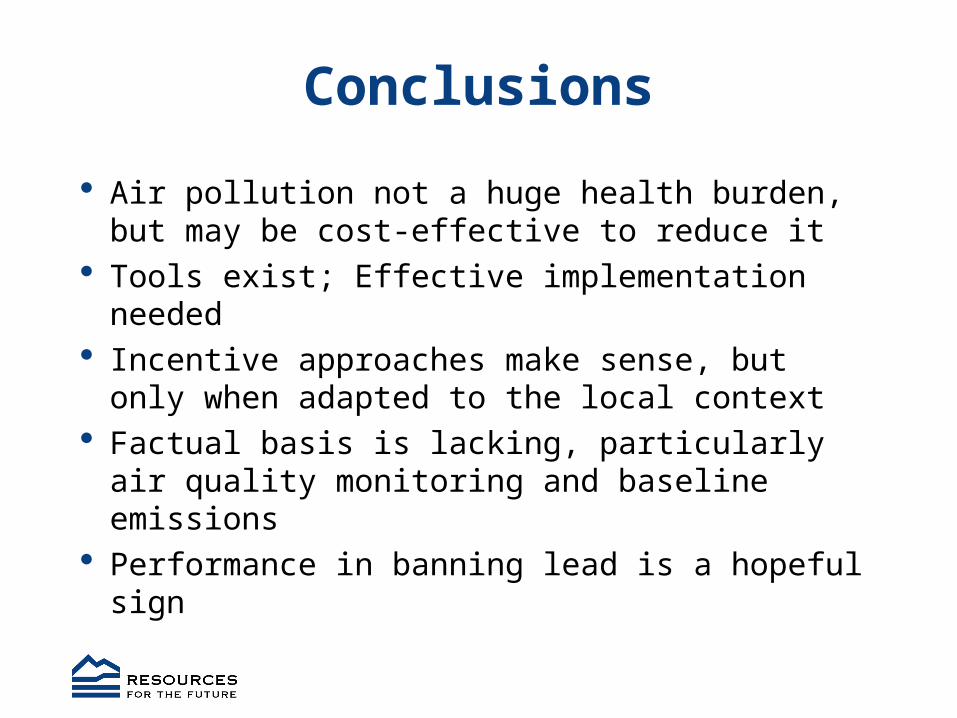
Conclusions
Air pollution not a huge health burden, but may be cost-effective to reduce it
Tools exist; Effective implementation needed Incentive approaches make sense, but only
when adapted to the local context Factual basis is lacking, particularly air quality
monitoring and baseline emissions Performance in banning lead is a hopeful sign

Table 2. Air Pollution Change by Income
Pollutant by country income category*
Average for 1993-2000
Reduction in average from 1986-92 to 1993-
2000**
# cities w/data in both periods
Sulfur Dioxide Annual Mean (µg/m3)
A (low income) 15 3 10 B (lower middle income) 61 16 26 C (upper middle income) 25 13 14 D (high income) 16 13 46
Nitrogen Dioxide Annual Mean (µg/m3) A (low income) 26 0 10 B (lower middle income) 62 -15 12 C (upper middle income) 42 2 14 D (high income) 42 5 42
PM10 Annual Mean (µg/m3) A (low income) 127 -26 10 B (lower middle income) 66 20 8 C (upper middle income) 61 4 1 D (high income) 34 13 14 Lead Annual Ambient Mean (µg/m3) A (low income) 0.14 0.05 10 B (lower middle income) 0.37 0.05 8 C (upper middle income) 0.29 0.20 11 D (high income) 0.10 0.13 30
Ozone Annual Mean (µg/m3) A (low income) 79 - 0 B (lower middle income) 48 -11 3 C (upper middle income) 48 5 3
D (high income) 38 -3 35

Pollutant by country income category*
Average for 1993-2000
Reduction in average from 1986-92 to 1993-
2000**
# cities w/data in both periods
SO2 # days guideline exceeded A (low income) 2 1 7 B (lower middle income) 9 2 5 C (upper middle income) 4 16 3 D (high income) 2 7 32
NO2 # days guideline exceeded A (low income) 2 0 8 B (lower middle income) 25 -15 4 C (upper middle income) 11 -17 2 D (high income) 4 3 29 Ozone # days guideline exceeded A (low income) 90 - 0 B (lower middle income) 9 -1 2 C (upper middle income) 28 -13 2
D (high income) 18 5 24
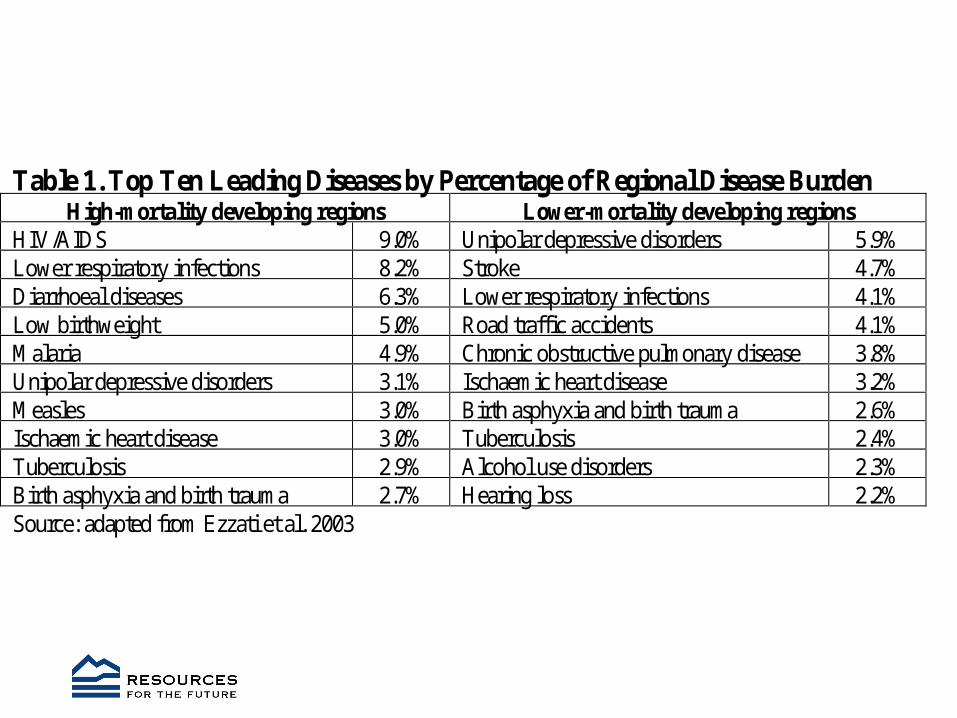
Table 1. Top Ten Leading Diseases by Percentage of Regional Disease Burden
High-mortality developing regions Lower-mortality developing regions HIV/AIDS 9.0% Unipolar depressive disorders 5.9% Lower respiratory infections 8.2% Stroke 4.7% Diarrhoeal diseases 6.3% Lower respiratory infections 4.1% Low birthweight 5.0% Road traffic accidents 4.1% Malaria 4.9% Chronic obstructive pulmonary disease 3.8% Unipolar depressive disorders 3.1% Ischaemic heart disease 3.2% Measles 3.0% Birth asphyxia and birth trauma 2.6% Ischaemic heart disease 3.0% Tuberculosis 2.4% Tuberculosis 2.9% Alcohol use disorders 2.3% Birth asphyxia and birth trauma 2.7% Hearing loss 2.2% Source: adapted from Ezzati et al. 2003
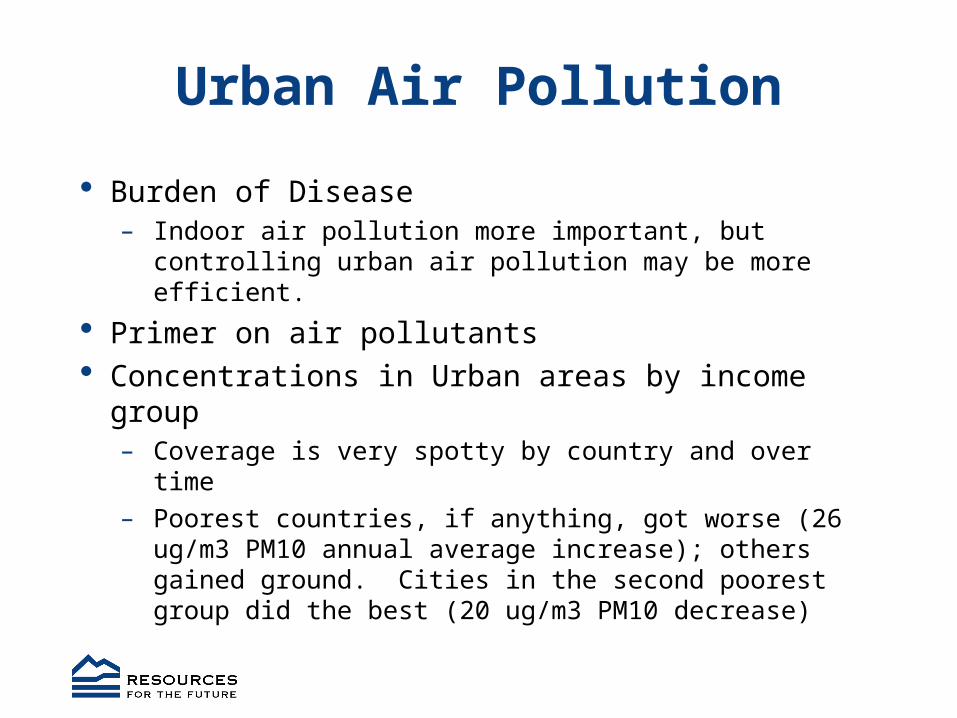
Urban Air Pollution
Burden of Disease– Indoor air pollution more important, but controlling
urban air pollution may be more efficient.
Primer on air pollutants Concentrations in Urban areas by income group
– Coverage is very spotty by country and over time
– Poorest countries, if anything, got worse (26 ug/m3 PM10 annual average increase); others gained ground. Cities in the second poorest group did the best (20 ug/m3 PM10 decrease)
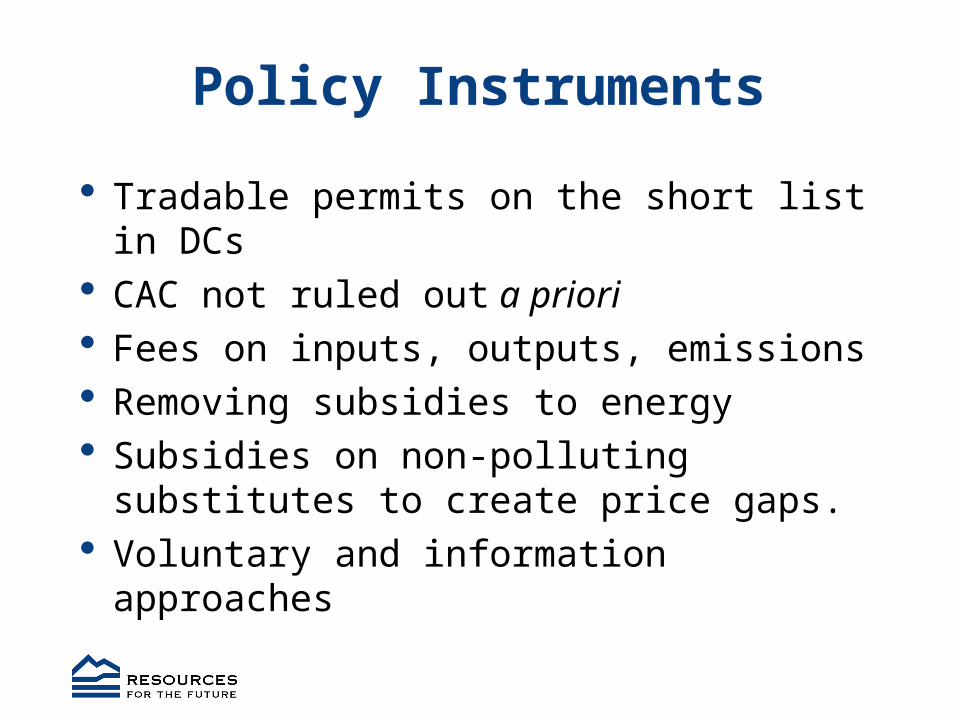
Policy Instruments
Tradable permits on the short list in DCs CAC not ruled out a priori Fees on inputs, outputs, emissions Removing subsidies to energy Subsidies on non-polluting substitutes to
create price gaps. Voluntary and information approaches

Stationary Sources
Can’t export DC instruments to LDCs Stylized facts and implications
– Priority on constraining costs favors price instruments
– Low baseline control/cheap labor favors low tech, labor intensive abatement
– Subsidy removal– Create capacity, economize on infrastructure
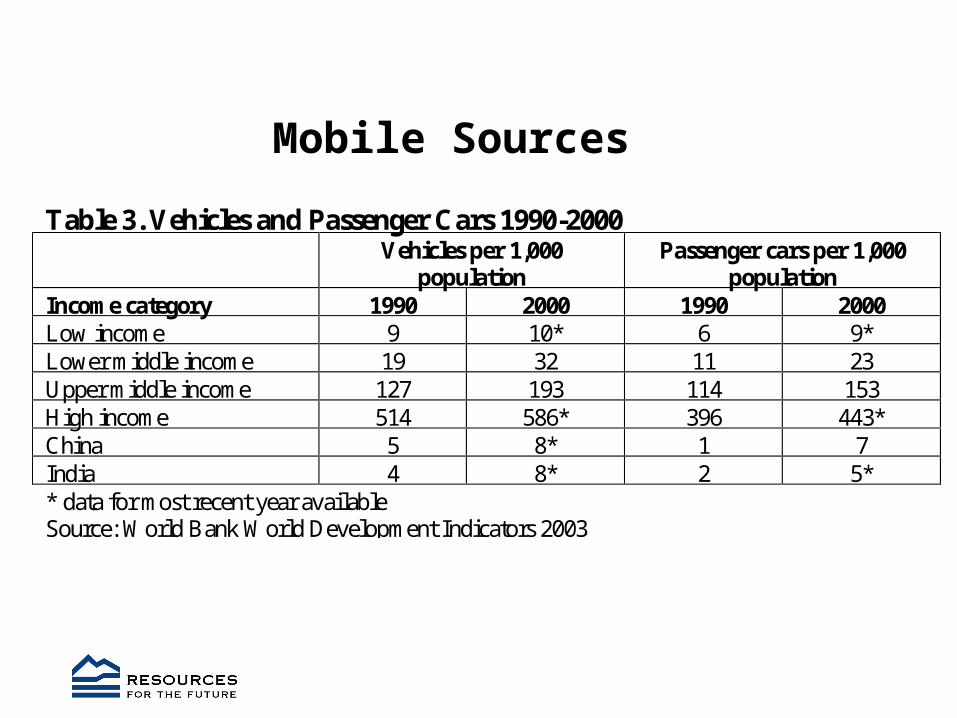
Table 3. Vehicles and Passenger Cars 1990-2000 Vehicles per 1,000
population Passenger cars per 1,000
population Income category 1990 2000 1990 2000 Low income 9 10* 6 9* Lower middle income 19 32 11 23 Upper middle income 127 193 114 153 High income 514 586* 396 443* China 5 8* 1 7 India 4 8* 2 5* * data for most recent year available Source: World Bank World Development Indicators 2003
Mobile Sources

Stylized facts and implications
Lead used more in LDCs: Get it out Buses more important in LDCs and
declining: arrest decline; no big ticket investments, reduce diesel use and improve quality
Vehicles older and less well maintained: remove tax breaks, encourage scrappage and engine replacement. Can IM work?

CNG Buses in Delhi
Delhi in Top 20 for use of public transit But diesel buses highly polluting Supreme Court required conversion to CNG
in 1998, ending a process started in 1985 Phase-out complete in 2002 Many objections and issues
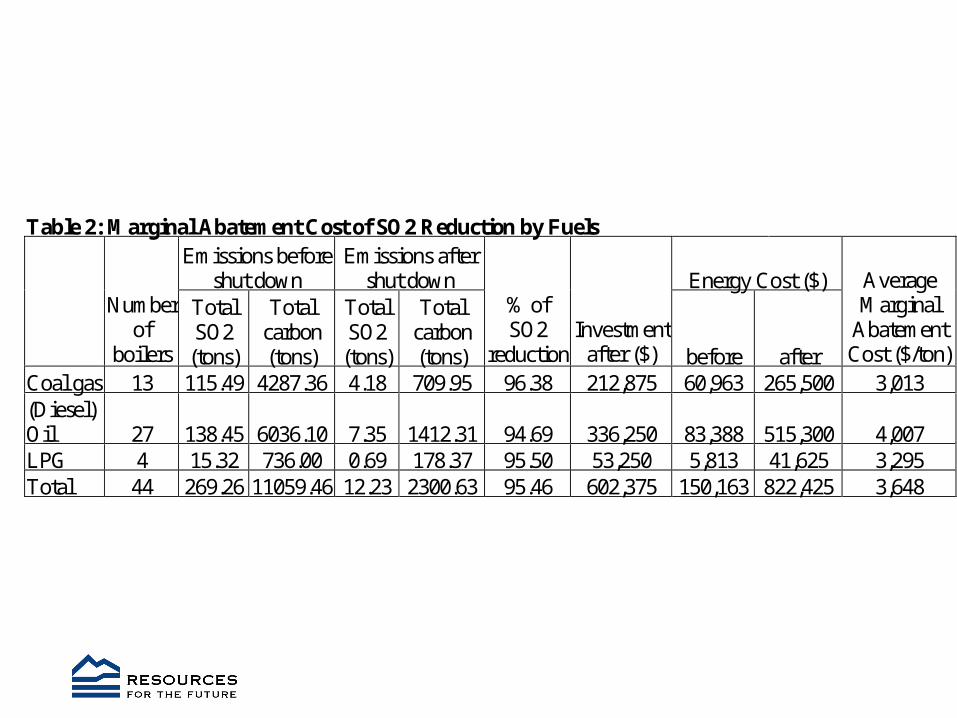
Table 2: Marginal Abatement Cost of SO2 Reduction by Fuels Emissions before
shut down Emissions after
shut down Energy Cost ($)
Number of
boilers
Total SO2
(tons)
Total carbon (tons)
Total SO2
(tons)
Total carbon (tons)
% of SO2
reduction Investment
after ($) before after
Average Marginal
Abatement Cost ($/ton)
Coal gas 13 115.49 4287.36 4.18 709.95 96.38 212,875 60,963 265,500 3,013 (Diesel) Oil 27 138.45 6036.10 7.35 1412.31 94.69 336,250 83,388 515,300 4,007 LPG 4 15.32 736.00 0.69 178.37 95.50 53,250 5,813 41,625 3,295 Total 44 269.26 11059.46 12.23 2300.63 95.46 602,375 150,163 822,425 3,648


