Download - CALIFORNIA MOBILITY INVESTMENT OPPORTUNITIES

CALIFORNIA MOBILITY
INVESTMENT OPPORTUNITIES

Report Contributors
This report was prepared for the Commission in partnership with the organizations listed below. Without their contributions this report would not have been possible.
Alpine County Local Transportation Commission Amador County Transportation Commission Association of Monterey Bay Area Governments Calaveras Council of Governments California Association of Councils of Government California Department of Transportation California State Association of Counties California Transit Association County of San Benito Council of Governments Del Norte Local Transportation Commission Fresno Council of Governments Humboldt County Association of Governments Imperial County Transportation Commission Inyo County Local Transportation Commission Kern Council of Governments Kings County Association of Governments Lake County/City Area Planning Council League of California Cities Los Angeles County Metropolitan Transportation Authority Madera County Transportation Commission Mendocino Council of Governments Merced County Association of Governments Metropolitan Transportation Commission Modoc County Transportation Commission Mono County Local Transportation Commission Nevada County Transportation Commission North State Super-Region Orange County Transportation Authority Riverside County Transportation Commission Sacramento Area Council of Governments San Bernardino County Transportation Authority San Diego Association of Governments San Joaquin Council of Governments San Luis Obispo Council of Governments Santa Barbara County Association of Governments Santa Cruz County Regional Transportation Commission Shasta Regional Transportation Agency Southern California Association of Governments Stanislaus Council of Governments Tehama County Transportation Commission Transportation Agency for Monterey County Tulare County Association of Governments Tuolumne County Transportation Council Ventura County Transportation Commission

CALIFORNIA MOBILITY
INVESTMENT OPPORTUNITIES
JULY 2017
i
CALIFORNIA TRANSPORTATION COMMISSION
TABLE OF CONTENTS
TABLE OF CONTENTS
EXECUTIVE SUMMARY............................................................................................................................................................................... vi
Chapter 1 – Introduction..................................................................................................................................................... 1
Road Repair and Accountability Act of 2017.............................................................................................................. 3
Chapter 2 – State of the Existing Transportation System ............................................................................................... 4
State Highway System ....................................................................................................................................................... 4
Locally Administered Streets & Roads and Active Transportation Facilities ................................................ 6
Transit and Intercity Passenger Rail Systems .............................................................................................................7
Goods Movement Infrastructure and Ports of Entry..............................................................................................11
Chapter 3 – Addressing Unfunded Investment Needs ................................................................................................... 12
State Highway System .....................................................................................................................................................12
Local Streets and Roads ..................................................................................................................................................13
Active Transportation Facilities ....................................................................................................................................13
Intercity Passenger Rail ..................................................................................................................................................14
Transit ....................................................................................................................................................................................14
Goods Movement...............................................................................................................................................................15
SUPER-REGION SUMMARIES ............................................................................................................................................ 16
Chapter 4 – Central Coast........................................................................................................................................................................17
Chapter 5 – Central Sierra .......................................................................................................................................................................19
Chapter 6 – North State ...........................................................................................................................................................................21
Chapter 7 – Sacramento Area.................................................................................................................................................................25
Chapter 8 – San Diego..............................................................................................................................................................................29
Chapter 9 – San Francisco Bay Area.....................................................................................................................................................32
Chapter 10 – San Joaquin Valley...........................................................................................................................................................38
Chapter 11 – Southern California .........................................................................................................................................................41
APPENDIX OVERVIEW........................................................................................................................................................ 52
A – Statewide ......................................................................................................................................................................53
B – Central Coast................................................................................................................................................................56
C – Central Sierra ...............................................................................................................................................................59
D – North State...................................................................................................................................................................60
E – Sacramento Area ........................................................................................................................................................61
F – San Diego......................................................................................................................................................................63
G – San Francisco Bay Area ............................................................................................................................................65
H – San Joaquin Valley .....................................................................................................................................................67
I – Southern California.....................................................................................................................................................69
ii

TABLE OF CONTENTS
UNFUNDED TRANSPORTATION INVESTMENT PRIORITIES
FIGURES AND TABLES
FIGURES
Figure 1 Annual SHOPP Needs Grow as Necessary Funding Lags....................................................................................... 5 Figure 2 Generalized Pavement Life Cycle Curve ...................................................................................................................... 6 Figure 3 Distribution of Transit Assets by Value......................................................................................................................... 8 Figure 4 Condition Distribution of Transit Assets (2015) ........................................................................................................ 8 Figure 5 Delays on San Diego Freeways During A.M. Commute Periods (2014)...........................................................30 Figure 6 Delays on San Diego Freeways During P.M. Commute Periods (2014) ...........................................................30 Figure 7 Pavement Life Cycle Chart .............................................................................................................................................34 Figure 8 Southern California Total State Highway System Distressed Lane Miles by County .................................42 Figure 9 Southern California Percent State Highway System Distressed Lane Miles by County.............................42 Figure 10 Southern California Bridge Conditions by County..................................................................................................43 Figure 11 Southern California Percent Non-Recurrent Congestion by County (2011) ..................................................45 Figure 12 Southern California Multi-Modal System Preservation and Maintenance Needs .....................................46 Figure 13 Southern California Capital Improvement Unmet Needs....................................................................................47 Figure 14 Cost Effectiveness of Pavement Treatment ..............................................................................................................48
TABLES
Table 1 Statewide Average 2016 PCI by Road Type ................................................................................................................ 6 Table 2 Active Transportation Program Through FY 2015-16..............................................................................................7 Table 3 TERM Condition Ratings – Condition Description ................................................................................................... 8 Table 4 State-Supported Intercity Passenger Rail Systems.................................................................................................. 9 Table 5 California’s Intercity Rail Fleet ......................................................................................................................................10 Table 6 Super-Region Counties ....................................................................................................................................................16 Table 7 Sacramento Area 2016 PCI by County........................................................................................................................25 Table 8 Sacramento Area Bridge Sufficiency Ratings by County ......................................................................................25 Table 9 Bay Area’s Most Congested Freeway Segments by Weekday Vehicle Hours of Delay................................33 Table 10 Bay Area Local Streets and Roads Ten Year Funding Scenarios and Performance Outcomes ................34 Table 11 Bay Area Transit Capital Ten Year Funding Scenarios and Performance Outcomes ...................................35 Table 12 San Joaquin Valley 2016 Average PCI by County ....................................................................................................39
iii
iv CALIFORNIA TRANSPORTATION COMMISSION
EXECUTIVE SUMMARY
Executive Summary
Over the past decade, the California Transportation Commission (Commission) has urged the Legislature and Administration to address the need for reliable and sustainable funding to preserve and expand the state’s transportation system.
Proposals arose from both the Legislature and the Administration in previous legislative sessions to provide for the transportation funding shortfall through a comprehensive framework of both revenue and reforms to address California’s transportation needs. In April of 2017, the Legislature passed Senate Bill (SB) 1 (Beall), also known as the Road Repair and Accountability Act of 2017, which provides significant resources and accountability measures toward addressing the state’s challenge.
This report includes important aspects related to the former transportation funding crisis and recent solution. First, this report describes the existence and condition of public transportation infrastructure and how critical it is to the state’s economic health and every individual’s quality of life. Due to a variety of factors, the condition of California’s transportation infrastructure has deteriorated to a point that requires the type of immediate, significant attention that SB 1 provides in order to avoid increased future costs and decreased safety and mobility.
Second, chapters 4-11 of this report identify specific consequences of the existing funding shortfall in every corner of the state. The diminishing condition of the local road system, as well as the transit infrastructure and the state highways, is impacting the lives of Californians in every region. Each region has identified specific projects that could become reality with the availability of new resources, and has described some of the benefits these investments might achieve.
The Road Repair and Accountability Act of 2017 is the largest transportation infrastructure investment in California history. The Act places California in an opportune position to address the transportation funding crisis. The benefits of addressing the problem today are significant, and this report describes specific examples of those benefits. Without SB 1, Californians would continue to face detrimental impacts to the quality of life they have come to expect from the public sector, namely:
• Deceleration of the state’s economy;
• Reduction of social equity and accessibility;
• Deterioration of our shared environment.

1
Introduction - CHAPTER 1
UNFUNDED TRANSPORTATION INVESTMENT PRIORITIES
Chapter 1 – Introduction
Over the past decade, the Commission has urged the
Legislature and Administration to address the need for reliable
and sustainable funding to preserve and expand the state’s
transportation system. Recognizing the growing pressure on
California’s transportation system, the Commission launched
an effort in 2010 to develop a statewide multi-modal
transportation needs assessment report.That report detailed
a comprehensive list of needs for California’s transportation
system in cooperation with various transportation agencies and
stakeholder groups to make the case to decision makers about
the importance of transportation and the backlog of needs.
In October 2011, the Commission released the final report titled “The 2011 Statewide Transportation Needs Assessment”
(2011 Needs Assessment). Through collaboration with
metropolitan planning organizations, urban and rural regional
transportation planning agencies, the California Department
of Transportation (Caltrans), transit agencies, rail, ports and
airports, the 2011 Needs Assessment identified a staggering amount of transportation need for the state.
Since the release of the 2011 Needs Assessment, the state
has struggled to develop a comprehensive solution to
address the identified shortfall, and therefore the condition of the state’s transportation system has only grown worse.
With this in mind, the Commission requested a report on
unfunded transportation investment needs to be prepared
in collaboration with the state’s transportation agencies and
stakeholders.
In April 2017, the Legislature passed Senate Bill (SB) 1 (Beall),
also known as the Road Repair and Accountability Act of 2017
(summarized on page 3). SB 1 raises transportation revenue
for state, regional, and local agencies to address deferred
needs on the transportation system. The bill also makes a
multitude of reforms regarding funding structures, processes,
and oversight.
As a result, Commission staff and stakeholders worked
together to provide information through the development of
this 2017 Mobility Investment Opportunities Report.
Specifically, this report accomplishes two goals. First, the report generally describes both the state’s transportation
system, its needs, and why the system is so important to
California’s economy and the quality of life for each individual.
Second, the report includes a discussion from each of the
state’s super-regions in which staff from those regional
transportation entities have described a) the condition of the
transportation system today, b) the real life consequences
of the funding shortfall, and c) their region’s unfunded
investment needs. These super-regional summaries are
intended to generally describe a summary of key unfunded
needs of each region and the corresponding benefits constituents might expect from additional resources applied
to those needs. This report does not identify each and every
project that will be pursued by the state or through revenues generated by SB 1. Therefore the projects identified must be considered for illustrative purposes only.
Why Is Infrastructure Important And What Does It Do? Throughout the recent efforts to address California’s
transportation funding challenges, there has been much
discussion about various options for crafting a solution. There
appears to be less discussion concerning why the needs of our
transportation system must be addressed, and how the failure to
find a solution would affect every Californian moving forward.
Generally speaking, public infrastructure is developed
and exists to directly benefit the community it serves. In
California, that service must be aimed at supporting the
state’s aspirations, expectations, and needs. Citizens enter
into a contract with their government – the people allow the
government to exist and provide it with necessary resources,
while the government provides to the people the desired
services they expect. The resources provided by the people,
primarily through taxes and fees, fund a multitude of public
services, from public safety and education, to public libraries,
parks, and open spaces. These resources also pay for the
infrastructure necessary to deliver those public services. One
of the largest public infrastructure investments in California
is the transportation system – our roads, highways, transit,
rail, and ports.

2 CALIFORNIA TRANSPORTATION COMMISSION
CHAPTER 1 - Introduction
Californians expect, first and foremost, that the public sector
will maintain, and when possible, improve quality of life. A
focus on quality of life means pursuing the following broad
aspirations:
• Growth of the state economy.
• Promotion of social equity and accessibility.
• Protection of the environment.
It follows that infrastructure policy decision-making at
all levels should be aimed at supporting these shared
aspirations. Although external pressures may emerge
that challenge Californians’ quality of life, the state must
remain committed to ensuring that decisions made now
and in the future maximize the prospects for maintaining
and enhancing the high quality of life enjoyed by most
Californians today.
Transportation infrastructure is a critical engine of the state’s
and the nation’s economy and is integral to every person’s
quality of life. Investments in the national transportation
network over the last 60 years have been instrumental in
developing one of the world’s largest economies and most
mobile societies. In addition, the state’s transportation system
is fundamental to providing opportunity for all Californians.
Finally, as a significant contributor to the emission of greenhouse gases and other pollutants, strategic investment in
the transportation sector is increasingly critical to the state’s
fight against global warming and resulting climate change.
Transportation is the thread that knits California together
by providing the mobility that is such an important part
of overall quality of life. Highways, transit, and local road
systems provide critical access to jobs, recreation, education, health care, and the many other activities that sustain and
enrich the lives of all Californians.
Unfortunately, investments to preserve the state’s transportation systems simply have not kept pace with the demands on them, and this underfunding has led to the decay of one of California’s greatest assets.
Prior to SB 1, California’s transportation system was in
jeopardy. The state’s aging infrastructure includes, but is
not limited to, roads, highways, bridges, transit vehicles and
facilities, passenger and freight rail, airports, harbors, and
international ports of entry. Streets and highways carry huge
amounts of traffic and absorb continual wear from heavy
trucks and other vehicles. Deteriorating roads also serve
as a barrier to safe active transportation for bicyclists and
pedestrians.
Other transportation infrastructure is called upon to satisfy
increasing demands for public transit and to move people
and goods by air and sea, along rail lines, and across borders
at United States ports of entry. At the same time, the costs to
preserve the infrastructure that serves these needs are soaring
because these facilities are aging and government had failed
to properly fund the regular maintenance of much of this
infrastructure. Ongoing budget shortfalls forced agencies to
defer maintenance, leading to roads and bridges that are in
disrepair, requiring costly rehabilitation, a situation that could
have been avoided with adequate funding, in prior years.
The ultimate and unfortunate outcome of inadequate funding
is that as the transportation system grows increasingly
unreliable, the state becomes less attractive to businesses,
residents, and tourists, which exacerbates our revenue
problems at a time when we can least afford it.
However, the passage of SB 1 mitigates this potentially
devastating outcome, and the Commission applauds the
Legislature and Governor for their hard work in securing a
solution to the state’s transportation funding crisis.
What Might Tomorrow’s Transportation Landscape Look Like?
For over a century and a half, California has been a land of
boundless opportunity; a place that looks to the future and
pushes the rest of the country toward a brighter tomorrow. A
thoughtfully conceived future transportation network, with
an underlying backbone consisting of a well-maintained
existing system and technological solutions to aid in tackling
the state’s growing transportation challenges, will enable
California to continue to grow, lead, and flourish.
With the passage of SB 1, California is now positioned to
address the most immediate needs of the existing system
and prevent its further descent into disrepair; expand the
system to accommodate the state’s growing population
and economic pressures; and institute reforms that enable
technology and innovations to develop. SB 1 will make it
possible for California to address these and other unrelenting
challenges.

3
Introduction - CHAPTER 1
UNFUNDED TRANSPORTATION INVESTMENT PRIORITIES
ROAD REPAIR AND ACCOUNTABILITY ACT OF 2017
A brief summary of SB 1 can be found below:
Funding Increases To Local Agencies
The revenues estimated to be available to local agencies over the next ten years:
• $15 billion to local street and road maintenance.
• $7.5 billion for transit operations and capital.
• $2 billion for the local partnership program.
• $1 billion for the Active Transportation Program.
• $250 million for local planning grants.
Funding Increases To The State
The revenues estimated to be available to the state over the next ten years:
• $19 billion for state highway, bridge, and culvert maintenance and rehabilitation.
• $3 billion for high-priority freight corridors.
• $2.5 billion for congested corridor relief.
• $800 million for parks, off-highway vehicles, boating, and agricultural programs.
• $1.1 billion for the interregional share of the STIP.
• $250 million for freeway service patrols.
• $70 million for transportation research at the University of California and California State University.
Transportation Reforms
In addition to various funding increases and programs, SB 1 also implements a number of reforms
to improve transportation processes, coordination, and oversight. The following are examples:
• Creation of the Independent Office of Audits and Investigations headed by a Governor appointed Inspector General.
• Assigns to the Commission additional oversight of Caltrans.
• Establishes an Advance Mitigation Program.
• Establishes the Solutions for Congested Corridors Program.
• Updates the Highway Design Manual to incorporate “complete streets” design concepts.

4 CALIFORNIA TRANSPORTATION COMMISSION
CHAPTER 2 - State of the Existing Transportation System
Chapter 2 – State of the Existing Transportation System
California’s transportation system is large, complex, and
integrally tied to the physical shape and vitality of the state’s
communities. Californians rely enormously on the state’s
roads, rails, ports, and transit systems in order to work and
live, while businesses depend on a reliable transportation
network to effectively offer their products and services at a
reasonable cost.
As a result, huge demands are placed on California’s
transportation systems. For example:
• As of 2015, there are over 34 million vehicles registered in California, more than any state in the nation.
• As of 2014, California experiences 335 billion vehicle miles traveled every year, more than any state in the nation.
• As of 2015, California transit operators served 1.80 billion annual transit trips.
• The Inrix Global Congestion Ranking ranks Los Angeles at the top of their list for the most gridlocked cities. In 2016 drivers spent 104 hours in congestion annually at a total individual cost of $2,408 per year.
• As of 2015, Ports of Los Angeles, Long Beach, and Oakland ranked as some of the busiest containership ports in the nation, handling 47 percent of the containerized seaborne cargo that arrives in the nation.
• Annually, $2.8 trillion in goods are shipped to and from sites in California, mostly by truck.
• As of 2015, the aggregate number of personal vehicles crossing all California land ports of entry from Mexico was 30 million northbound.
• As of 2015, Los Angeles, Sacramento, and San Diego are in the top 10 Amtrak stations in the nation for the number of passengers handled annually.
Preserving the functionality of these systems is vital to the
continued mobility and prosperity of the state.
Every aspect of the state’s transportation system is important
and has become increasingly stressed from chronic
underfunding. These components – the state highway system,
local streets and roads, the state’s transit systems, bicycle and
pedestrian facilities, and freight mobility and ports – were
selected for inclusion in this report because SB 1 focuses
on addressing these needs in particular. Other system
components, such as airports, are also critical and may be
addressed in a future comprehensive update to the 2011
Needs Assessment.
STATE HIGHWAY SYSTEM
Highways have been, and will continue to be, vital for the
state’s economy and the movement of its people and goods.
Despite increases in other modes of transportation, nearly
80 percent of commuters in California travel to work in
single occupancy vehicles. Many alternatives to auto travel
rely on these road systems as well, from buses to active
transportation options such as bicycling.
The state highway system is expansive and complex with
a distance of over 15,000 centerline miles comprising over
50,000 lane miles of pavement. This system includes over
13,000 bridges, as well as over 205,000 culverts and drainage
facilities, 87 roadside rest areas, and over 29,000 acres of
roadside landscaping. California’s highway system has a value
of more than $1.2 trillion.
Most of the system was originally constructed in the
period from post-World War II through the 1970s. Despite
California’s efforts to maintain and efficiently operate its
existing highway system, the condition of highway pavement
is currently among the worst in the nation.
Condition of the State Highway System In many places, the transportation system is in need of
upgrades to better reflect new concepts in the design and
technology of transportation infrastructure and in other
areas, capacity expansion is needed to accommodate the
doubling of the state’s population since 1968. Throughout the
system, there is a vital need for infrastructure maintenance,
repair and reconstruction. Like previous generations, the
current residents and businesses of California must invest
in the transportation system to help sustain California’s
remarkable success. It is necessary to not only invest in the
expansion of the transportation system to accommodate
increasing population, expanding economy, and changing
technology, but to also invest in the preservation of existing
transportation system assets, such as bridges and pavement.

5
State of the Existing Transportation System - CHAPTER 2
UNFUNDED TRANSPORTATION INVESTMENT PRIORITIES
Caltrans carries out management, preservation, and safety
improvements for the state highway system through the
four-year State Highway Operation and Protection Program
(SHOPP). In order to anticipate and schedule future needs
over a ten-year period, Caltrans develops a Ten-Year SHOPP
Plan that identifies goal-based needs over a ten-year period, updated every two years. Caltrans’ 2015 Ten-Year SHOPP
Plan identified approximately $8 billion in goal-based needs
for each year of the ten year plan. Prior to the passage of
SB 1, Caltrans expected resources of $2.3 billion per year,
creating a funding shortfall of approximately $5.7 billion per
year. With the passage of SB 1, Caltrans will now have more
resources to address this funding shortfall.
The funding shortfall for the preservation and rehabilitation
of the state highway system has occurred annually for years,
and as a result, the unfunded annual need tends to increase
over time as the system continues to deteriorate and the
cost of preservation and rehabilitation escalates. Figure 1
demonstrates this growing trend over the last decade. The
recent action taken by the Legislature and the Governor to
provide additional resources for transportation will serve to
reduce the annual unfunded need and therefore positively
impact this trend.
As the state highway system continues to age, the demand of
vehicle and truck traffic accelerates the deterioration of these
assets. The increased demands and deferred rehabilitation
and restoration results in lower operational performance,
higher user operating costs, and ultimately requires a higher
overall investment when needed repairs to the system are
undertaken. By passing SB 1 this year, the state is providing
resources to stop this downward spiral and avoid the higher
future costs by investing in the infrastructure today.
In addition to maintaining what currently exists, there are
significant capacity needs throughout the state. The state’s
primary funding mechanism for new capacity is the five- year
State Transportation Improvement Program (STIP). The
STIP is a key planning document for funding future state
highway, intercity rail, transit, and pedestrian improvements
throughout California. Its primary funding source is the price-
based excise tax paid by drivers at the gas pump which, until
the passage of SB 1, has been highly volatile.
This volatility forced the Commission in 2016 to adopt a STIP
that cut $754 million and delayed another $755 million in
highway, rail, transit, bicycle and pedestrian project spending. This was the largest funding reduction in the program since
the STIP transportation funding structure was adopted 20
years ago.
The passage of SB 1 addressed the volatility in this revenue
structure by pegging the annual adjustment to the growth in the consumer price index instead of on the price of gas. With this
change, the state and regional agencies will be able to better
forecast expected transportation revenues and more reliably
plan for the necessary delivery of transportation improvements.
FIGURE 1 – Annual SHOPP Needs Grow As Necessary Funding Lags
$10.0 $8.2 $8.0
2004 2006 2008 2010 2012 2014 2016 SHOPP SHOPP SHOPP SHOPP SHOPP SHOPP SHOPP
Available SHOPP Funds (Billions) SHOPP Funds Necessary to Meet Goals
$1.8 $2.6 $2.1 $1.7 $2.0 $2.3 $2.3 $2.8 $3.9
$5.5 $6.3 $7.4
$0.0
$2.0
$4.0
$6.0
$8.0
6 CALIFORNIA TRANSPORTATION COMMISSION
CHAPTER 2 - State of the Existing Transportation System
–
-
-
LOCALLY ADMINISTERED STREETS & ROADS AND
ACTIVE TRANSPORTATION FACILITIES
Similar to the state highway system, but at a different scale,
California has a vast network of local roads and streets.
California’s 58 counties and 482 cities own and maintain
a network of over 143,000 centerline miles of local streets
and roads and more than 12,000 local bridges. Local roads
account for 81 percent of the state’s total publicly maintained
centerline miles, and are conservatively valued at $168
billion.
Local transportation systems often serve shorter, regional
trips that are accomplished on local roads, streets, and bike
and pedestrian facilities. These trips may stay local or feed
into the larger transportation system and account for many of
the daily trips on the transportation system. Each year, about
146.4 billion vehicle miles – approximately 45 percent of the
state’s total vehicle miles – are traveled on this local street
network.
Many trips are also completed by active forms of
transportation such as walking or biking. Jurisdictions
throughout California have seen an increase in demand for
active forms of transportation infrastructure.
Local rural roads serve an important function in
connecting the state’s natural resources, agricultural,
and recreational destinations. Virtually all of the
nation’s natural wealth and basic food production – the
abundance found in its farms, forests, mines, and other
resources – is located outside of the major metropolitan
areas and is therefore dependent on local road systems.
Condition of Existing Local Streets and Roads/Active Transportation Facilities Every two years since 2008, the League of California
Cities and the California State Association of Counties
have contracted for the development of a Local Streets
and Roads Needs Assessment. Based on the results of
the most recent report, the current (as of April 2016)
Pav
emen
t Con
ditio
n
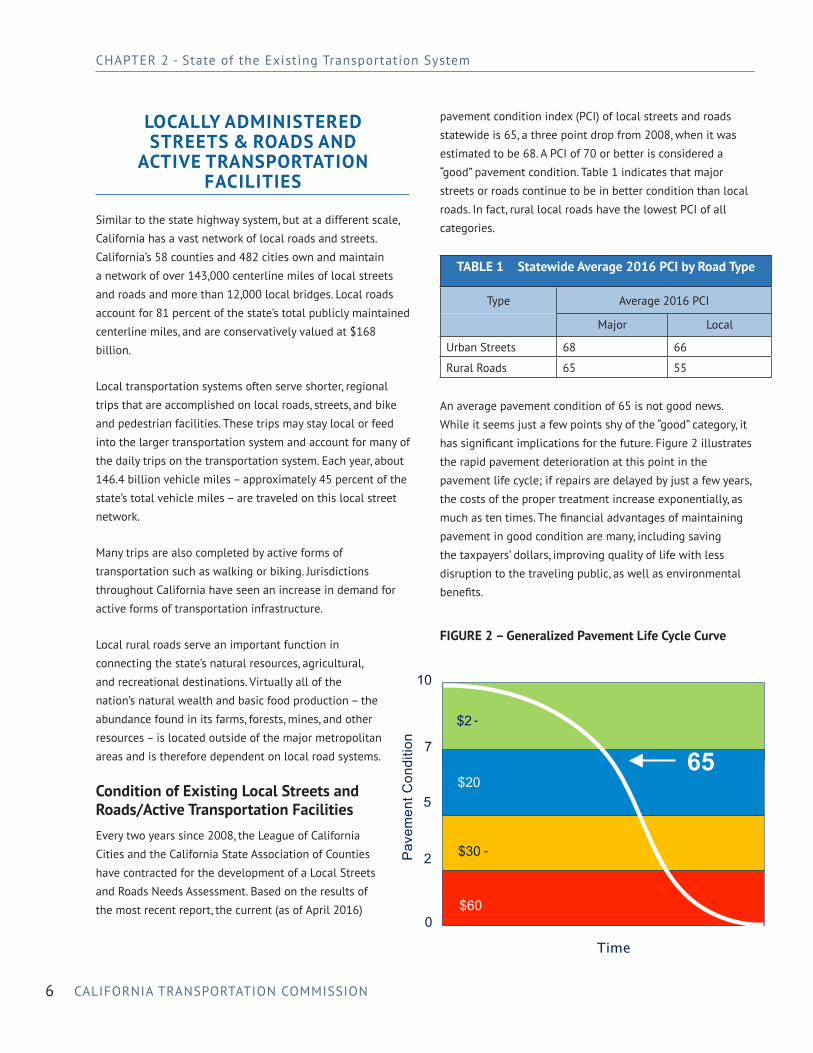
pavement condition index (PCI) of local streets and roads
statewide is 65, a three point drop from 2008, when it was
estimated to be 68. A PCI of 70 or better is considered a
“good” pavement condition. Table 1 indicates that major
streets or roads continue to be in better condition than local
roads. In fact, rural local roads have the lowest PCI of all
categories.
TABLE 1 Statewide Average 2016 PCI by Road Type
Type Average 2016 PCI
Major Local
Urban Streets 68 66
Rural Roads 65 55
An average pavement condition of 65 is not good news.
While it seems just a few points shy of the “good” category, it
has significant implications for the future. Figure 2 illustrates
the rapid pavement deterioration at this point in the
pavement life cycle; if repairs are delayed by just a few years, the costs of the proper treatment increase exponentially, as
much as ten times. The financial advantages of maintaining
pavement in good condition are many, including saving
the taxpayers’ dollars, improving quality of life with less
disruption to the traveling public, as well as environmental
benefits.
FIGURE 2 – Generalized Pavement Life Cycle Curve
10
7
5
2
0
$2 -
65 $20
$30 -
$60
Time

7
State of the Existing Transportation System - CHAPTER 2
UNFUNDED TRANSPORTATION INVESTMENT PRIORITIES
–
Many factors contribute to rapid deterioration in the providing additional funding in the amount of $15 billion pavement condition (PC) of the local streets and roads over the next ten years for local street and road maintenance system, including: needs.
• More traffic and heavier vehicles.
• More transit vehicles and more frequent bus trips, including heavier buses.
• Heavier and more garbage collection trucks (recycling and green waste trucks are new weekly additions to the traditional weekly garbage truck).
• More street sweeping to comply with federal requirements.
• More freight and delivery trucks when the economy is thriving.
Considering these factors, the Local Streets and Roads Needs
Assessment warns that a PCI of 65 should be viewed with
caution. Fortunately, SB 1 addresses this critical need by
An important consideration in effectively maintaining local
streets and roads is the significant demand for safe bicycle
and pedestrian facilities. While a full statewide needs
analysis for this type of infrastructure is not available, a
fair representation of the demand for bike and pedestrian
infrastructure is the oversubscription of the Commission’s
Active Transportation Program (ATP). Through three cycles,
the Commission received over 1,800 applications requesting
$3 billion but were only able to fund 588 projects with the
roughly $990 million available for the program. Table 2
describes the continued demand for funding through the ATP.
SB 1 contributes an additional $1 billion over the next ten
years to the ATP for these important local projects.
TABLE 2 Active Transportation Program Through FY 2015-16 Cycle 1 Cycle 2 Cycle 3
Number of Applications Submitted 771 617 456
Total ATP Funds Requested $1,018,235,000 $1,060,308,000 $976,768,000
Number of Projects Programmed 265 207 116
Total Funds Programmed $367,890,000 $359,043,000 $263,522,000
TRANSIT AND INTERCITY PASSENGER RAIL SYSTEMS
Public Transit Systems According to the California Transit Association, there are 166
transit agencies operating in California, providing more than
1.44 billion unlinked passenger trips per year. Though urban
bus transit is the bulk of services provided, these agencies
also provide a myriad of other critical transportation services
including:
• ferry boat operations.
• local, regional, and interregional commuter rail services.
• light rail services.
• paratransit services for persons with special mobility needs.
• transit services in non-urbanized and rural areas, and the often-isolated tribal communities.
Condition of Existing Transit Assets
Every two years, the Federal Transit Administration (FTA) and
the Federal Highway Administration (FHWA) jointly issue a
report to the United States Congress on the condition and
performance of the nation’s surface transportation capital
assets. The report (known as the “C&P report”) provides a
comprehensive assessment of the physical condition and
reinvestment needs for all public transportation capital
assets nationwide.
For transit assets, this assessment is developed based on
output from FTA’s Transit Economic Requirements Model
(TERM), a federal-level needs assessment decision support
tool. FTA’s TERM uses a detailed asset inventory derived
from the National Transit Database along with a set of
empirically derived asset decay curves and a detailed listing
of the nation’s transit assets to estimate the current physical
condition of the nation’s bus and rail transit asset capital
assets. Table 3 illustrates TERM’s “condition” ratings.

8 CALIFORNIA TRANSPORTATION COMMISSION
CHAPTER 2 - State of the Existing Transportation System
-TABLE 3 TERM Condition Ratings Condition Description
Excellent New or like new asset; no visible defects
Good Asset showing minimal signs of wear; some moderately defective or deteriorated component(s)
Adequate Asset has reached its mid-life; some moderately defective of deteriorated component(s)
Marginal Asset reaching or just past its useful life; increasing number of deteriorated component(s)
Poor Asset past its useful life; in need of replacement; may have critical damage to component(s)
A report, commissioned by the California Transit Association Conditions and Performance”) to profile the condition of
in 2016, disaggregated the findings of the 2015 C&P report California’s transit assets. A summary of the report findings
(“2015 Status of the Nation’s Highways, Bridges, and Transit: are presented in Figures 3 and 4.
FIGURE 3 – Distribution of Transit Assets by Value
(Total Value = $91.2B in 2015)
Vehicles 16%
Systems 13%
Stations 14%
Facilities 18%
Guideway Elements
39%
FIGURE 4 – Condition Distribution of Transit Assets (2015) Condition Distribution (2015) $40
Bill
ions
$30
$20
$10
$0 Facilities Guideway Stations Systems Vehicles
Elements
1. Poor 2. Marginal 3. Adequate 4. Good

9
State of the Existing Transportation System - CHAPTER 2
UNFUNDED TRANSPORTATION INVESTMENT PRIORITIES
–
Overall, the study found that, of California’s $91.2 billion
in transit assets, 2.37 percent are in “Poor” condition, 40.19
percent are in “Marginal” condition, 39.09 percent are in
“Adequate” condition, 12.46 percent are in “Good” condition
and 5.89 percent are in “Excellent” condition.
A report commissioned by the California Transit Association
in 2013 documented state, local, and federal funding sources
while highlighting the following:
• The total level of investment in transit assets required to reach and maintain a state of good repair.
• The total level of investment in transit assets anticipated based on growth in California’s capital funding.
• The total level of investment in transit assets required to maintain the current value of California’s state of good repair backlog.
In all, based on this 2013 report, California faced a total
funding shortfall for transit capital and operations of
approximately $72 billion over ten years.
Without additional revenue from SB 1, the condition of
California’s transit assets would continue to worsen as
transit agencies struggle to meet their replacement and
modernization needs.
Qualitatively, a funding shortfall would also have impacted
the condition of assets, increasing rehabilitation costs and
posing safety and reliability issues. The rate of deterioration
of existing assets would have accelerated with continued
deferred maintenance, significantly increasing the cost to
reduce the current asset backlog and bring the transit system
into a state of good repair. Further, delayed maintenance
of the transit system leads to even costlier rehabilitation
or early replacement requirements. SB 1 addresses these
challenges by contributing an estimated $7.5 billion over the
next ten years to transit operations and capital needs.
The deterioration of transit assets is important because
transit riders depend on well-maintained vehicles, stations,
and trackways in order to ensure system reliability, safety,
and performance. As the quantity of transit assets past their
useful life increases, the probability of vehicle breakdowns
and system wide delays also increases, impacting transit
service reliability, safety, and impairing service levels. These
phenomena also impede a transit agency’s efforts to boost
ridership, and the state’s efforts to curb greenhouse gas
emissions.
Intercity Passenger Rail Systems In addition to the state’s local and regional public
transportation providers, California has three state-supported
intercity passenger rail corridors as shown in Table 4 each
operated by its own joint powers authority. These corridors
span 887 miles, connecting the state’s major urban regions
and serving rural communities. Each of these routes serve
regular commuter passengers, particularly the Capitol
Corridor and the Pacific Surfliner, providing benefits for both
regional and interregional mobility in congested corridors.
Caltrans intercity rail passenger service operates over a
shared passenger and freight rail infrastructure that is
mostly owned by Class I freight railroads, with some lines in
urban areas that are owned by various commuter railroads
and public agencies. All three rail corridors are supported
by a network of connecting Amtrak Thruway Bus routes that
expand access to the passenger rail system statewide and
connect each corridor to each other where gaps between
services exist.
TABLE 4 State-Supported Intercity Passenger Rail Systems
System Name Location/Area Served
Capitol Corridor Auburn, Sacramento, Oakland, and San Jose
Pacific Surfliner San Diego, Los Angeles, and San Luis Obispo
San Joaquin Bakersfield to Oakland (five trains), with some trains serving Sacramento (two trains)
Condition of Existing Intercity Passenger Rail Assets
Local speed restrictions on trains that come about as a
result of poor track conditions, interference between freight
and passenger trains on single track railroad systems, and
conflicts with vehicular traffic at local grade crossings all
have an impact on the operating efficiency of the system. Proper maintenance, carefully coordinated schedules, and
coordination with public and private railroad partners to
develop track infrastructure schedules that are developed

CALIFORNIA TRANSPORTATION COMMISSION
CHAPTER 2 - State of the Existing Transportation System
–
jointly between Caltrans and the private freight railroad
companies. Once Caltrans has an approved schedule, or
operating plan, the freight railroad will run a simulation to
see that it will not be impacted by the revised passenger
schedules or increased frequencies. Once it is determined
that capital improvements are necessary, the state must fund
this work to keep the railroad company whole.
Table 5 represents the state’s current intercity rail fleet. Typically locomotives and rail cars have a useful life of 20
and 30 years, respectively, before a complete overhaul/
rebuild is necessary. As the delivery dates suggest, many of
these vehicles are approaching the end of their useful life.
SB 1 increases revenue for California’s intercity passenger
rail systems to address issues related to safety, scheduling,
maintenance, and equipment.
TABLE 5 California’s Intercity Rail Fleet Equipment Type Sub Type Quantity Delivery
Dates Location
Locomotive N/A 9 1994 Oakland
Locomotive N/A 6 2001 Oakland
Locomotive N/A 2 1991 Oakland
Passenger Cars Coach 32 1995-97 Oakland
Passenger Cars Cab-Baggage 14 1995-97 Oakland
Passenger Cars Food Service 14 1995-97 Oakland
Passenger Cars Coach-Baggage 6 1995-97 Oakland
Passenger Cars Coach 3 2001 Los Angeles
Passenger Cars Coach 5 2001 Oakland
Passenger Cars Cab-Baggage 3 2001 Los Angeles
Passenger Cars Cab-Baggage 5 2001 Oakland
Passenger Cars Food Service 2 2001 Los Angeles
Passenger Cars Food Service 2 2001 Oakland
Passenger Cars Pacific Business 2 2001 Los Angeles
Passenger Cars Coach 14 2013-14 Oakland
10
11
State of the Existing Transportation System - CHAPTER 2
UNFUNDED TRANSPORTATION INVESTMENT PRIORITIES
GOODS MOVEMENT INFRASTRUCTURE AND PORTS OF
ENTRY
California has the most extensive, complex, and
interconnected freight system in the nation. This far-reaching
system is multi-modal and includes highways, seaports,
airports with air cargo operations, class I railroads, short
line railroads, border ports of entry with Mexico, pipelines,
warehousing and distribution centers, and local connector
roads. California’s freight transportation system not only
links the state to the national and global economies, but also
serves as the nation’s primary gateway to the Pacific Rim. This
system is the pillar of the state’s economy, supporting over
1.3 million freight-specific jobs, boosting California’s status
to the 6th largest economy in the world in 2015. California
businesses annually export approximately $162 billion worth
of goods to over 225 countries.
California is home to some of the busiest seaports in the
world. This system of seaports extends along the California
coast from Humboldt in the north, to San Diego in the south,
including two inland ports. These ports are the linchpin of
international trade, acting as gateways to global markets
for goods departing to and arriving from overseas locations,
creating hundreds of thousands of jobs, and generating over
$40 billion in annual economic activity.
Another critical component of the state’s freight network
is the movement of goods and people at California’s seven
international land ports of entry with Mexico. In 2015, more
than 70 million individuals and over 30 million vehicles
crossed the border northbound into California. Otay Mesa is
the third busiest commercial (truck) crossing by trade value
on the United States–Mexico border and San Ysidro is one of
the busiest land ports of entry in the world for passengers.
In 2015, the Calexico East port of entry processed $6.5
billion in exports and $9.7 billion in imports, ranking 8th in
United States truck crossings. The most recent port of entry,
a terminal with a cross-border passenger connection to the
Tijuana International Airport, was completed in 2015. An
eighth port of entry is planned at Otay Mesa East. This new
port of entry will help reduce freight and passenger traffic congestion at other border sites, as well as provide additional
capacity for future growth in trade.
Condition of Existing Goods Movement Infrastructure Caltrans released the 2014 California Freight Mobility Plan
(CFMP) in response to Assembly Bill (AB) 14 (Lowenthal,
Chapter 233, Statutes of 2013) and federal law encouraging
each state to develop a comprehensive state freight plan
outlining immediate and long-range plans for goods
movement-related transportation investments. According to
the CFMP, its foundational strategy is to obtain substantial,
predictable, long-term freight funding. Without a reliable
funding source there are few options to fund freight projects. Projects must compete for traditional passenger funding, compete for very limited federal freight funding, wait for
another state bond program, or just not be built. This funding
uncertainty potentially increases costs for freight shipments.
Obtaining new, dedicated, permanent state and federal
freight funding is the highest priority need identified by the
CFMP. The CFMP calls for new funding to apply to all freight
modes and to mitigate impacts from the freight industry,
including meeting air quality and greenhouse gas goals..
The CFMP further states that the sheer magnitude of
California’s freight system necessitates an enormous
investment in maintenance and preservation. While the
Class 1 railroads, seaports, and airports do an admirable job
of maintaining and preserving their facilities, highway and
local road facilities that support both passenger and freight
transportation, especially those handling the highest volumes
of truck traffic, are in vital need of additional funding for
maintenance and preservation.
The outlook for addressing the state’s goods movement
needs has improved with the passage of SB 1. The bill
dedicates $3 billion over ten years in additional funding
toward the state’s high-priority freight corridors. This new
dedicated revenue will provide the means to fund critical
freight projects.
12 CALIFORNIA TRANSPORTATION COMMISSION
CHAPTER 3 - Benefits of Addressing Unfunded Investment Priorities Now
Chapter 3 - Benefits of Addressing Unfunded Investment Priorities Now
The statewide consequences of the growing transportation
funding shortfall are dramatic and far-reaching. The state
highway system is increasingly deteriorating as it ages and
accommodates a growing population, affecting mobility, goods
movement, the environment, and the economy. Local streets
and roads are suffering the same fate, as are transit systems
around the state. The passage of SB 1 will provide much-
needed resources to address these issues.
Taking steps toward addressing the state’s transportation
funding crisis through SB 1 benefits the state’s economy, environment, and the quality of life for residents today. But
most importantly, taking immediate action helps mitigate
costs that future generations will have to pay in order to
address the inevitable further deterioration of the system.
The purpose of this chapter is to identify the benefits of
addressing unfunded investment priorities in a timely
manner – both at the statewide and regional level. Specific regional examples are provided to illustrate how targeted
investments can yield vital near-term benefits in different
parts of the state. More detailed and comprehensive regional
summaries and information are available in Chapters 4-11.
STATE HIGHWAY SYSTEM
The state needs to adequately and strategically fund
investments to improve the flow of traffic. A portion of the projects cut or delayed in the 2016 STIP were high-priority interregional highway projects administered by the state. According to Caltrans, with the cuts and additional high
priority needs, over $4 billion in projects are necessary to improve interregional connectivity of the state highway
system. However, targeted investment of smaller sums could
have dramatic effects on safety and mobility. SB 1 addresses
the shortfall and stabilizes funding in the STIP.
For example, for less than $500 million invested in the San
Joaquin Valley, nearly all of the remaining four-lane segments
of State Route (SR) 99 could be widened for a continuous
six-lane interregional freeway. SR 99 is a critical goods
movement corridor for the vast agricultural commodities
produced in the state. Completing the effort that began
with a $1 billion investment in the corridor from the 2006
Proposition 1B bond program would have dramatic impacts
for both the state’s economy and the quality of life of Valley
residents.
Another example, highlighted in both the Central Coast’s
super-regional summary as well as on the state’s high
priority project list, is closing a critical gap by adding one
High Occupancy Vehicle (HOV) lane in each direction of US
101 between the City of Carpinteria and the City of Santa
Barbara. This is one of the most congested four-lane freeway
segments in California. Failing level of service conditions
in this segment currently occur for two to four hours daily.
Without this project, congested, stop-and-go conditions are
expected to occur 11 hours per day in this corridor by 2040.
Other benefits expected from this project include:
• Reduction of over 13,500 passenger hours of delay daily.
• Reduced travel time and improved trip reliability for buses, interregional travelers, and high occupancy users.
• Improved goods movement and interregional travel between the Los Angeles basin and the San Francisco Bay Area.
• A coordinated rehabilitation strategy within the project limits to install long-life (40+ year) pavement on all lanes, reducing future maintenance and construction needs in the corridor.
Santa Barbara County has $140 million set aside from its
local sales tax measure for this project. Another $28 million
in state gas tax funds have been programmed to date. The
cost of this 10-mile long HOV project is $356 million in
current year dollars. It will be designed and constructed
in several phases. An initial construction phase has been
programmed from the southern 2.5 miles which is slated
to begin by 2019. Local sales tax dollars will be used to
leverage funds from the state to deliver this segment. Local
sales tax dollars will also be used to apply for up to $188
million in unidentified non-local funding for the remaining
segments of the corridor.

13
Benefits of Addressing Unfunded Investment Priorities Now - CHAPTER 3
UNFUNDED TRANSPORTATION INVESTMENT PRIORITIES
LOCAL STREETS AND ROADS
The 2016 Local Streets and Roads Needs Assessment notes
that, in order to use taxpayer money wisely, it makes more
sense to preserve and maintain roads in good condition than
to let them crumble further and cost more to fix. The costs developed in that report are based on achieving a roadway
pavement condition called Best Management Practices (BMP).
At this condition level, preventive maintenance treatments (i.e.,
slurry seals, chip seals, thin overlays) are most cost-effective.
Preventive maintenance interferes less with commerce and
the public’s mobility and is more environmentally friendly than
rehabilitation and reconstruction.
The importance of this approach is significant. As roadway pavement conditions deteriorate, the cost of repair increases
exponentially. For example, it costs as much as fourteen
times more to reconstruct pavement than to preserve it
when it is in good condition. Even a modest resurfacing is
four times more expensive than maintenance in the BMP
condition. Or to put it another way, employing maintenance
practices consistent with BMP results in treating as much as
fourteen times more road area for the same cost.
By bringing the local roadway system to BMP conditions,
cities and counties will be able to maintain streets and roads
at the most cost-effective level. It is a goal that is not only
optimal, but also necessary. The 2016 Local Streets and Roads
Need Assessment examined the following three funding
scenarios (depicted in constant 2016 dollars) in order to
determine their impacts on the condition of the roads over
the next decade:
1. Existing funding levels ($1.98 billion/year) – this is the current funding level available to cities and counties from federal, state and local sources.
2. Funding to maintain existing conditions ($3.5 billion/ year) – this is roughly $1.5 billion more than existing funding levels each year, and the funding level required to maintain the pavement conditions at its current PCI of 65.
3. Funding required to reach BMP ($7.0 billion/year) – the optimal scenario to bring all pavements into a state of good repair so that best management practices can prevail. To reach BMP levels, $70 billion is needed over the next ten years. This is an estimated funding shortfall of $50.2 billion. With this investment, it will only require $2.5 billion a year to maintain the pavements at that level.
Based on this assessment, while an annual $5 billion
investment in the local system would be optimal, an additional
$1.5 billion annual investment is critical to keep from allowing
the system to erode further with higher future costs and
increased system failure. SB 1 provides that crucial $1.5 billion
to enable local governments to maintain their systems.
Allowing the continual decline in funding combined with
increasing costs of maintenance and operation of the local
street and road system was threatening the very substantial
infrastructure investment made by past generations. As is the
case everywhere in the state, limited funding in the Central
Sierra region has caused unnecessary conflicts between
modes of transportation as the need to minimally maintain
the road system resulted in less funding for safety projects, safe routes to school, transit improvements, bike lanes,
operational and congestion relief projects, as well as efforts
to reduce carbon emissions consistent with AB 32 (Nuñez,
Chapter 488, Statutes of 2006) and the Governor’s Executive
Orders. Further, current funding levels within the region have
resulted in staff reductions in areas of field maintenance
crews, project delivery staff, and administrative oversight. Because the Central Sierra region is so sparsely populated,
state funds for local streets and roads are the primary source
of funding for transportation services, leaving these areas
with no alternatives to address the diminishing condition
of their systems. SB 1 provides funding to address these
problems
ACTIVE TRANSPORTATION FACILITIES
The regions are also prioritizing active transportation
facilities. For example, the Sacramento region describes
how it values complete streets, creating areas and corridors
where all modes can safely and conveniently travel. Noting
that there are 22,000 lane miles of existing collector and
local streets in the Sacramento region, there are only 1,100
miles of bike lanes (Class II) on these facilities. Further,
the region points out that it expects that investments in
maintaining roads in a good state of repair will also result
in much needed improvements for walking and bicycling.
The Sacramento Area Council of Governments (SACOG) has
identified 2,300 capital bike/pedestrian projects—such as

14 CALIFORNIA TRANSPORTATION COMMISSION
CHAPTER 3 - Benefits of Addressing Unfunded Investment Priorities Now
sidewalks, freeway overcrossings, bridges, multi-use paths,
and separated bikeways—needed in the region to develop
an interconnected system of streets, bikeways, and walkways.
In addition, local agencies in the Sacramento region have
identified 800 projects needed to further strengthen their
active transportation networks, should funding become
available to continue the development of those projects.
TRANSIT
Another report, commissioned by the California Transit
Association in 2016, found that increased funding totaling
$2 billion annually for ten years, all applied to preservation,
would keep the current state of good repair backlog roughly
the same size between FY 2015 and FY 2025. This need
is addressed by SB 1. As stated in their regional summary,
the San Francisco Bay Area region recognizes the need for
strategic transit expansion to support the Bay Area’s growth
and ensure economic competitiveness. For example, the
region supported $75 million in federal funds for AC Transit’s
Bus Rapid Transit on San Pablo Avenue, which extends
high-quality bus service paralleling the busy I-80 corridor
in the East Bay. This project will provide service similar in
speed and convenience to light rail, but at a fraction of the
cost, moving thousands of people a day. At the same time,
this project will reduce demand on I-80 by redirecting
those drivers to transit, resulting in lower greenhouse gas
emissions and improved mobility.
Transit needs are not only limited to large urban areas of
California. As the North State regional summary describes, the
northern third of California is essentially cut off from the rest
of the state with respect to public transportation connections.
The region’s proposed North State Express Connect project
would implement a brand new intercity transit express route
that will form the backbone of an integrated rural transit
network between Redding and Sacramento with feeder
routes linking much of the rural North State. With funding,
this transformative project could create new economic opportunity and mobility for the region’s residents, who do
not currently have access to timely and convenient public
transportation to Sacramento and points beyond.
INTERCITY PASSENGER RAIL
Caltrans is developing the California State Rail Plan (CSRP),
which must be completed by June 2018 and prepared
every four years thereafter to respond to state and federal
requirements, which include the creation of a short-term four
year capital investment plan, an interim 10 year capital plan,
and a long term capital plan described at a corridor level with
at least a 20 year time horizon. State law (AB 528) also directs
that the CSRP identify a statewide plan for integrating the
passenger rail systems in the state, including High Speed Rail,
conventional intercity passenger rail (service below 125 mph),
and regional commuter rail systems.
The CSRP establishes a vision for prioritizing state
investment in passenger and freight improvements that
serve to integrate the passenger rail network and support
goods movement to better serve California’s ports and
major industries. This vision can be achieved in phases with
different levels of integration activated as improvements
are delivered over time – the CSRP provides a framework
for incremental service planning and capital investment
decision-making with an ultimate network vision in mind.
The CSRP vision for a statewide network is designed to
maximize the performance potential of intercity passenger
rail as a mobility solution that provides the equivalent of
additional lanes of highway capacity. The CSRP identifies a
state interest in service and connectivity goals for different
corridors, tailored to market demand, with coordinated
schedules between services allowing timed transfers at hub
stations on a network, which also allow for connections to
transit and urban rail systems.
According to Caltrans, the state’s high-priority capital projects in the ten-year planning horizon being established in the
next CSRP require a roughly $5 billion investment. While
this seems like a large sum when considered in isolation,
the potential benefits of these projects are enormous. For example, the reliability and flexibility promised by operating 20 intercity trains per day between Sacramento and Roseville
could provide significant congestion relief for the I-80 corridor during busy commute times as drivers choose rail
15
Benefits of Addressing Unfunded Investment Priorities Now - CHAPTER 3
UNFUNDED TRANSPORTATION INVESTMENT PRIORITIES
over sitting in traffic every day. SB 1 provides funding for Intercity Passenger Rail improvements, which will help
address a number of the state’s passenger rail needs and
address congestion on parallel highway corridors.
GOODS MOVEMENT
While the state’s and regions’ goods movement needs are
significant, strategic investment in projects across the state
would yield significant benefits. For example, the Kramer
Junction Gap Closure on SR 58 in San Bernardino County
in the Southern California region is a bottleneck project
along a key freight corridor that was recently eliminated
because of the cuts to the STIP. The Kramer Junction Gap
Project is a nationally significant project and is the final
gap in an otherwise uninterrupted 4-lane expressway that
begins at US 101 in San Luis Obispo County near the Pacific Coast, traveling east, connecting with Interstate 5 and SR
99 in the San Joaquin Valley, and ending at the junction
of I-15 and I-40 in Barstow. The project would essentially provide a westerly extension of I-40, a major cross-country highway and an important goods movement route, to the
San Joaquin Valley and Central Coast. Over 50 percent of the
vehicle traffic on this route is comprised of truck traffic. This
project is needed to reduce traffic congestion, improve safety, reduce the accident rate, improve operational efficiency by separating slow-moving vehicles, and improve reliability of
goods movement.
In the San Diego region, investments in the ports of entry
from Mexico could have a profound economic impact
on the state. Recent studies have found that inadequate
infrastructure capacity at the border crossings between San
Diego County and Baja California currently creates travel
delays for cross-border personal trips and freight movements
that cost the U.S. and Mexican economies billions in foregone
gross output each year.

DEL NORTE
SISKIYOU
SHASTA
TEHAMA
GLENN MENDOCINO
COLUSA
LAKE
YOLO
SOLANO
PLACER
NEVADA
SIERRA
PLUMAS
LASSEN
CONTRA COSTA
ALAMEDA
NAPA SONOMA
MARIN
SAN FRANCISCO
TRINITY HUMBOLDT
MODOC
SAN BERNARDINO
LOS ANGELES VENTURA
KERN
TULARE
KINGS
FRESNO
MERCED
MARIPOSA
STANISLAUS
SAN JOAQUIN
SAN BENITO
SANTA CLARA
MADERA
MONTEREY
INYO
SANTA BARBARA
SAN LUIS OBISPO
EL DORADO
AMA-DOR
ALPINE
MONO
CALAVERAS
TUOLUMNE
BUTTE
SUTTERYUBA
SACRA-MENTO
IMPERIALIMPERIAL SAN DIEGOSAN DIEGO
SOUTHERN CALIFORNIA
SAN JOAQUIN VALLEY
SAN FRANCISCO BAY AREA
SAN DIEGO
SACRAMENTO
NORTH STATE
CENTRAL SIERRA
CENTRAL COAST
RIVERSIDERIVERSIDE
ORANGE
SANTA CRUZ
SAN MATEO
16 CALIFORNIA TRANSPORTATION COMMISSION
SUPER REGION SUMMARY
–
Super-Region Summaries The following sections of this report represent information provided by each of the state’s super-regions. For purposes of this
report, the eight super-regions are defined in Table 6 below:
TABLE 6 Super-Region Counties Super-Regions Counties
Central Coast Monterey, San Benito, San Luis Obispo, Santa Barbara, Santa Cruz
Central Sierra Alpine, Amador, Calaveras, Inyo, Mariposa, Mono, Tuolumne
North State Butte, Colusa, Del Norte, Glenn, Humboldt, Lake, Lassen, Mendocino, Modoc, Nevada, Plumas, Shasta, Sierra, Siskiyou, Tehama, Trinity
Sacramento Area El Dorado, Placer, Sacramento, Sutter, Yolo, Yuba
San Diego San Diego
San Francisco Bay Area Alameda, Contra Costa, Marin, Napa, San Francisco, San Mateo , Santa Clara, Solano, Sonoma,
San Joaquin Valley Fresno, Kern, Kings, Madera, Merced, San Joaquin, Stanislaus, Tulare
Southern California Imperial, Los Angeles, Orange, Riverside, San Bernardino, Ventura Super-Regions
Regional transportation entity staff from each of the super-regions
compiled the information presented in this section for purposes of
presenting representative information for all super-regional areas.
Regional transportation entity staff provided information for the following:
• The condition of the transportation system today.
• The real life consequences of the funding shortfall.
• The examples of projects that might be funded with additional revenues from SB 1.
Due to the political sensitivity of working as super-regional
consortia, the Commission did not request that these summaries
describe exactly what would be developed and constructed
with additional funds. Instead, these super-regional
summaries are intended to be illustrative of the critical
transportation needs each region faces. As regional
staff note, the passage of SB 1 will warrant
additional policy discussions at the local
and regional level to determine exactly
which priorities to address with the
new revenues.

17
CENTRAL COAST - CHAPTER 4
UNFUNDED TRANSPORTATION INVESTMENT PRIORITIES
CE
NT
RA
L C
OA
ST
Chapter 4 – Central Coast Monterey, San Benito, San Luis Obispo, Santa Barbara, and Santa Cruz Counties
INTRODUCTION
Condition of Existing Infrastructure Local roadways in the Central Coast region have crumbled
faster than cities and counties can keep up without adequate
sources of funding to support the backlog of maintenance
needs. The local streets and roads in the Central Coast have
deteriorated, with an extremely low PCI: San Benito County
(46), Monterey County (50) and Santa Cruz County (50). San
Luis Obispo and Santa Barbara Counties also have a low PCI
rating of 63. Best management practices call for a PCI of at
least in the 70s.
Level of Congestion Currently the Central Coast region is experiencing congestion
and delay in key commuter and freight corridors affecting
not only passenger and freight vehicles but also transit
vehicles. Severely congested corridors in the Central Coast
region include US 101, SR 1, SR 17, SR 25, SR 46, SR 68 and
SR 152, as well as many local roads. Additionally, key safety
improvements are needed throughout the Central Coast
Super-Region. The significant safety concerns and traffic congestion stifle the economy and make it more difficult
for our vulnerable populations – the elderly, children and
the disabled – to get around. SB 1 will help provide funding
needed to implement investments to ease congestion,
increase accessibility and mobility, as well as reduce
greenhouse gas emissions.
CONSEQUENCES OF THE PRIOR FUNDING SHORTFALL
Prior to the passage of SB 1, insufficient funding for
maintenance of transportation infrastructure was a statewide
concern as well as a growing concern for the Central Coast
region. Without continued investments by the federal and
state government, the ability to meet the demand on our
network would have only declined. It is critical for the
Central Coast to have reliable resources available to deliver
transportation priorities that will improve the economic
vitality of the region.
Potential Effect on Maintenance and Operation of Transportation Systems, Including Transit The consequences of not sufficiently funding maintenance
and operations of transportation systems on the Central
Coast would be dire. The backlog of necessary improvements
continued to grow as revenues had not been keeping up
with demand. Central Coast agencies had been experiencing
a degrading system of roads, bridges and transportation
facilities leading to a decline in system efficiency.
Effect of Neglected Infrastructure On the Economy Neglecting the Central Coast’s infrastructure has a negative
impact on the regional, state, national and global economies.
The Central Coast, like other regions, relies upon our
infrastructure for the movement of people and goods in a
timely manner. Neglected infrastructure has led to increased
travel times for employees and delays with getting high
value agricultural goods to markets outside the Central Coast.
WHERE ADDITIONAL FUNDING FROM SB 1 COULD BE SPENT
Even with three of the five counties in the region having
local sales tax measures, additional state funding was
needed to help deliver priorities identified by the super-
region. To highlight this, the 2016 Statewide Local Streets
& Roads Needs Assessment alone identified $3.7 billion in
needs for local streets and roads maintenance in the Central
Coast Super-Region.
While the Central Coast has developed a comprehensive
transportation network, there remain areas needing travel
lanes to increase capacity or improve safety and traffic flow, including critical improvements on US 101 as well as
east-west connections. The priority projects in Appendix B
reflect priority projects included in Regional Transportation
Plans and voter approved sales tax measures that require

18 CALIFORNIA TRANSPORTATION COMMISSION
CHAPTER 4 - CENTRAL COASTC
EN
TR
AL
CO
AS
T
additional funds from state sources. These strategic capacity
improvements will help improve safety, reduce congestion,
improve air quality and ensure the efficient movement of
goods and people.
Goods Movement The Central Coast region is one of the most important
agricultural production areas in the country and is known
for its fresh produce and wine grape production. The region’s
industries include agriculture, manufacturing, food processing
and other freight-related business clusters which are critical
to the region’s economy. Growth in Central Coast population
centers related to the region’s proximity to the Silicon Valley
in the north and the Los Angeles Metro area in the south
has resulted in increased demand for products shipped via
freight modes concurrently with an increase in demand for
Central Coast products from outside of the region. Many of
the capacity improvements (listed in Appendix B) to US 101,
SR 25, SR 46, SR 129 and SR 152 will also facilitate freight
travel.
Specifically, the Central Coast relies on US 101 as the primary transportation artery for the region and the area’s major truck route. A priority list of 25 projects on US 101 was developed
containing:
• Eight Interchange/Intersection Improvement Projects.
• Seven Capacity Expansion/New Road Projects.
• Five Rail Projects including new sidings, track realignment, and track upgrades.
• Four Operational Improvement Projects including truck climbing lanes and Intelligent Transportation Systems improvements.
• One Transload Project.
Delivering these projects would have a profound impact on
goods movement in the super-region and thus on the state’s
overall economy.
Active Transportation Non-motorized transportation facilities are an integral part
of the Central Coast’s transportation network. The Central
Coast Mediterranean climate and relative flat terrain in its
urbanized areas make it ideal for bicycle and pedestrian
commuting and recreational travel. The Central Coast is
home to several bicycle and pedestrian facilities, including
long stretches of the very popular California Coastal Trail.
While an extensive and robust network has been developed
on the Central Coast, there remains a need to deliver
additional facilities to expand the network. Future efforts
to improve the network will focus on safety, infill of missing
links, and responding to demographic shifts and changes
in development patterns. Improvements to the active
transportation environment yield benefits to the economy, environment, and public health, among other aspects
of life. As many residents in the region’s economically
disadvantaged communities have limited or no access
to vehicles or transit, a well-developed non-motorized
transportation system is critical to meeting their basic needs.
The Central Coast Regional Agencies and local jurisdictions
have identified continued needs as vetted by adopted Active
Transportation and Safe Routes to School plans.
A short list of project needs can be found in Appendix B.
Prepared By
~ Association of Monterey Bay Area Governments
~ Transportation Agency for Monterey County
~ County of San Benito Council of Governments
~ Santa Cruz County Regional Transportation Commission
~ Santa Barbara County Association of Governments
~ San Luis Obispo Council of Governments

19
CENTRAL SIERRA - CHAPTER 5
UNFUNDED TRANSPORTATION INVESTMENT PRIORITIES
CE
NT
RA
L
SI
ER
RA
Chapter 5 – Central Sierra Alpine, Amador, Calaveras, Inyo, Mariposa, Mono, and Tuolumne Counties
INTRODUCTION
Local governments in Central Sierra counties have
historically been struggling with reduced gas tax revenues,
the end of the local streets and roads funds from Proposition
1B, and the marked decline in funding for the STIP. County
road departments have been operating at a deficit for several
years. Manpower levels within county road crews have been
greatly reduced. The average PCI ratings of the Central Sierra
Counties is 54 and declining. Though the region does not
have an adopted standard, a PCI of 70 is typically considered
to be the minimally acceptable score for the “good” category.
Tuolumne and Amador Counties’ roads are among those in
the worst conditions in the state with poor overall ratings.
Many local roads have deteriorated to a condition that they
are barely passable for emergency access. Some subdivisions
lack adequate secondary emergency access posing a threat to
public safety.
County road department fleets in the Central Sierra Super-
Region are in fair condition and some agencies report
decades old equipment with no planned replacement
purchases given a lack of funding. There has been minimal
funding for crack sealing, fixing potholes, striping and
maintaining shoulders. The region has had little to no
funding available for road paving overlays or chip sealing.
The small population and rural nature of the Central Sierra
counties make it such that it is difficult to complete major
improvement projects on the state highway system. Yet high
volumes of regional and tourist traffic on the state highway system require safety upgrades and system expansion
to accommodate the growing need. Most STIP- funded
projects have been delayed or deleted due to funding
shortfalls, while some regions are unable to start new
STIP projects for several funding cycles. In the past, efforts
to work collaboratively with neighboring regions to pool
resources facilitated timely delivery of projects on the state
highway system. However, some regions report reductions
in funding that have led to the collapse of project delivery memorandums of understanding.
The only reliable transportation funding is from state base
fuel excise taxes, revenues from Local Transportation Funds,
and federal Regional Surface Transportation Program State
Exchange funding. This funding has been barely enough
to operate a minimum road crew resulting in minimal
maintenance. Rural mountain counties used to receive Secure
Rural Schools and Community Self-Determination Act federal
funding, but that funding source is no longer available. The
loss of this funding has reduced some county road funds by
approximately 25 percent.
CONSEQUENCES OF THE PRIOR FUNDING SHORTFALL
The continual decline in funding, combined with increasing
costs of maintenance and operation of the road system,
threatens the very substantial infrastructure investment made
by past generations. Inadequate funding to preventative
maintenance programs causes roadways to slip into higher
cost-per-mile rehabilitation and replacement categories.
Limited funding causes unnecessary conflicts between modes
of transportation for scarce resources. The need to minimally
maintain the road system results in less funding for safety
projects, safe routes to school, transit improvements, bike
lanes, operational and congestion relief projects as well as
efforts to reduce carbon emissions consistent with state law
and the Governor’s recent Executive Orders. Often these types
of projects are left to compete for statewide grants such
as through the ATP, Highway Safety Improvement Program
or for Cap and Trade funds. Very rarely are projects in the
Central Sierra region successful in obtaining funds from
these sources, leaving critical needs in our communities
unaddressed.
Transit in rural communities can be difficult to efficiently provide due to the sparse populations spread over large
areas. Low income groups often reside in lower cost,
extremely rural areas. Lack of flexible transportation funding
can leave vulnerable populations without access to critical
services.

20 CALIFORNIA TRANSPORTATION COMMISSION
CHAPTER 5 - CENTRAL SIERRAC
EN
TR
AL
S
IE
RR
A
Major highways in the Central Sierra region continue to see
growth in traffic volumes resulting from residents in distant
urban areas seeking recreation in our rural communities.
Reductions in the STIP have caused delays in highway
improvements to accommodate tourist traffic. Additionally, efforts to stem the negative effects of population decline
through growing the job-creating economy have been
hampered by lack of funding to support infrastructure
investments.
Current funding levels within each county have resulted in
staff reductions in areas of field maintenance crews, project
delivery staff and administrative oversight. Positions left
by retirees are often not filled, jeopardizing the ability to
deliver projects. Local match funds used to leverage large
Federal grants have been greatly diminished. Private sector
businesses and construction firms are impacted by a lack of
government contracts for goods and services.
WHERE ADDITIONAL FUNDING FROM SB 1 COULD BE SPENT
SB 1 addresses the most immediate and long term need
of counties within the Central Sierras by providing a major
increase in funding of road maintenance programs. Hundreds
of miles of pavement overlay projects combined with
drainage and shoulder widening are clearly the highest
priority. The need for sidewalk projects within established
communities is additionally needed. Several counties in
the region identified high priority goods movement and
congestion relief projects. Safety and operational projects to
reduce injuries and fatalities from traffic accidents, including
pedestrians and cyclists, need to be funded. Finally, each
county in the region noted the need to construct local and
regional bike lanes.
A short list of project needs can be found in Appendix C.
Prepared By
~ Alpine County Local Transportation Commission
~ Amador County Transportation Commission
~ Calaveras Council of Governments
~ Inyo County Local Transportation Commission
~ Mono County Local Transportation Commission
~ Tuolumne County Transportation Council

21
NORTH STATE - CHAPTER 6
UNFUNDED TRANSPORTATION INVESTMENT PRIORITIES
NO
RT
H
ST
AT
E
Chapter 6 – North State Butte, Colusa, Del Norte, Glenn, Humboldt, Lake, Lassen, Mendocino, Modoc, Nevada, Plumas, Shasta, Sierra, Siskiyou, Tehama, and Trinity Counties
INTRODUCTION
Background The North State Super-Region is an alliance of 16 Northern
California regional transportation planning agencies working
together to identify common transportation, growth, and
land use issues and formulate unified strategies that can
be advocated to implementing agencies and the public.
The super-region includes 26% of the state’s land area, 37%
of California’s state and federally owned roads, and has a
population of over one million residents.
Condition of Existing Infrastructure The condition of existing infrastructure in most of the region
is poor. Decades of under-investment in roads and bridges
has resulted in a substantial backlog of needs on the local
highway system. Furthermore, this backlog has increased as
available revenues have continued to decline. The passage of
SB 1 will now provide a means to address this backlog.
Essential infrastructure components associated with the local
roadway system are also generally in a state of disrepair due
to extended deferred maintenance. These are items such as
storm drains, sidewalks, curbs and gutters, traffic signals and
signs, bicycle facilities and street lights
Public transit throughout the super-region is generally
limited to the larger cities and surrounding areas. Those
routes that extend into the more rural areas tend to be
“lifeline” services which link remote areas to essential
services found in the larger communities.
Local airports connect the super-region to urban California
as well as other states. Although passenger service is very
limited, the small airports provide vital service to remote
areas and are especially important in times of emergency
such as flooding and wildfires. Counties and cities that
own and operate these facilities struggle to maintain them,
contributing to a growing maintenance backlog.
Level of Congestion Though important major projects have been completed, there are a number of unfunded projects that remain. This constrains not only the local area, but interregional
goods movement and interstate travel. In general, capacity-
increasing projects to mitigate congestion remain essential
in some areas of the North State Super-Region because
low population density limits transit options that would
otherwise be considered in urban areas in California. Urban
congestion, in various degrees, occurs in the major cities
and towns throughout the region. Congestion-related
improvements are needed on local streets and roads in
and around the largest cities of Redding, Chico, and Eureka
as well as several smaller communities where the State
highway is “main street.”
CONSEQUENCES OF THE PRIOR FUNDING SHORTFALL
The prolonged consequences of deferred pavement
maintenance is well documented. The most recent analysis,
the 2016 California Statewide Local Streets and Roads Needs
Assessment, indicates that nearly all of the North State
Super-Region counties suffer overall pavement conditions in
the “poor” and “at risk” categories. Only Plumas County falls
into the “good” category.
Pavement should be consistently maintained in the
“excellent” or “good” condition categories. This is much less
costly than improving pavement condition from “poor” to
“excellent,” which can be twenty or more times the cost
to maintain pavement in the “excellent” category. As more
streets deteriorate, the cost to improve them increase
dramatically. This has created a downward spiral in which
many more streets and roads have reached a critical state
of disrepair and each project costs much more. Some county agencies have chosen to let certain roads deteriorate to
gravel, and without the needed influx of SB 1 funding, this
choice may be the only option in the future.

22 CALIFORNIA TRANSPORTATION COMMISSION
CHAPTER 6 - NORTH STATEN
OR
TH
S
TA
TE
Pavement degradation leads to increased costs for the
traveling public. The frequency of vehicle and tire repair
needs increases as potholes multiply. A lack of public
investment in communities discourages private investment.
Those communities with poor infrastructure, including
essential components (sidewalks, curbs, drainage, sign,
signals, lighting, etc.) are not likely to attract private
investment to create jobs, increase the tax base and
otherwise stimulate the local economy. Delaying, suspending
and/or deleting new capacity, goods movement, and safety
projects will have an additional negative effect on the local
and regional economy.
As available locally-raised revenues (sales tax is the primary
source) decline, local agencies must also make choices about
transit service. Typical choices include increases in passenger
fares, reduction of service hours, reduction of trip lengths,
eliminating entire routes, and, in some cases where service is
already marginal, elimination of all service.
WHERE ADDITIONAL FUNDING FROM SB 1 COULD BE SPENT
Local Streets and Roads As in most other parts of California, addressing the decline in
pavement condition is a top concern in the North State Super
Region. Among the 16 agencies the pavement condition
index ranges from 35 to 72, with an average of only 58 on
a scale of 100. It is very likely that the additional funding
provided by SB 1 and distributed to the cities and counties
will be prioritized to addressing the backlog of pavement
needs that is approximately $6.5 billion over ten years.
State Highway System With over one quarter of the state’s land area, the state
highway system binds the Super Region together, as well
as with the rest of California and neighboring Oregon and
Nevada. By far, most of these highways are two-lane facilities
and many of these traverse rugged terrain. Many also
function as a “main street” when the go through towns and
cities. The 50% of funding from the Road Maintenance and
Rehabilitation Account that will be directed to the SHOPP
will improve safety and operations on the interregional
highway network that is vital to the region.
Within the North State Super-Region, there remain
congestion concerns that cannot be addressed by conversion
to other transportation modes. Many locations become
congested where through traffic on the state highway mixes
with local traffic on “Main Street.” This occurs in locations
such as Eureka (US 101), Weaverville (SR 299), and Nevada
City/Grass Valley (SR 49) and can be significant during peak periods.
Operational improvements such as curve corrections, shoulder
widening, and realignments can result in significant safety, mobility, and goods movement benefits. Such is the case on US 199 in Del Norte County, a highway that is constrained by
the Smith River Canyon. Operational improvements to US 199
have long been sought by the Del Norte Local Transportation
Commission. This route is the most direct link to the I-5
corridor (at Grants Pass, Oregon) and functions as the
preferable freight corridor for the county. US 199 also serves
as an important evacuation route and economic link should
the historic landslide at Last Chance Grade on US 101 worsen,
isolating Crescent City (and other points north of the slide
area) from the rest of California.
The highway system remains incomplete in other areas
of this extensive region. Often this is a result of a gradual
increase in volume on an interregional corridor that is
constrained by topography. As the volumes increased
through the years, the mix of trucks and automobiles has
led to capacity and safety issues. However, since the highway
system is remote and lies in a rural area and costs are high,
addressing the issue is problematic. Although operational
improvements can sometimes address these problems, more
often sub-standard highways need to be widened.
Stabilization of funding sources thorough the Price Based
Excise Tax Reset will ensure a certain level of stability in the
STIP. Increased Regional Improvement Program (RIP) shares
may provide the opportunity for several agencies to program
smaller but high priority local projects. The programming
of major state highway projects needed in the North State
are identified on the “Statewide High Priority Interregional
Highway Needs” list identified in Appendix A.

23
NORTH STATE - CHAPTER 6
UNFUNDED TRANSPORTATION INVESTMENT PRIORITIES
NO
RT
H
ST
AT
E
Principal Arterial Corridor through Lake County
In 1989 the Lake County/City Area Planning Council and
Caltrans agreed that widening of SR 20 along the north
shore of Clear Lake was infeasible due to topographical and
development constraints. The principal arterial route through
Lake County was adjusted to a southerly route utilizing
a 32-mile segment of SR 29 from Upper Lake to Lower
Lake. Although longer, this southerly route around Clear
Lake avoids the constraints of the north shore and takes
advantage of an existing freeway segment near Lakeport.
The final environmental document for the entire project was
completed in November 2016, and the project was planned
for construction in three segments. The first segment is
funded at $68 million and is scheduled to begin in 2019. It
will have been 30 years since the decision was made to focus
capacity improvements along SR 29 on the priority segment.
Segments 2 and 3 of this project are as of yet unfunded. Future construction funding to complete the remaining two
segments could $175 million. Local shares available even in
a “good” STIP cycle will provide only a small percentage of
the funding needed.
The Lake 29 Expressway Project remains an illustration of
the difficulty of developing large state highway improvement
projects in rural areas. This was previously demonstrated over
the decades by efforts to improve SR 299 in the Buckhorn
Summit area of Shasta and Trinity counties and the Willits
Bypass on US 101. Caltrans recognized the need to construct
them and there was demonstrated local commitment, but
costs were high in comparison to the availability of local STIP
shares, and of course, the overwhelming needs of California’s
urban areas. These two projects were completed in 2016, but the Lake 29 Expressway Project fits the same profile and
segments 2 and 3 remain unfunded.
Freight, Trade Corridors, and Goods Movement The North State has traditionally relied upon extractive
industries for a large sector of its economy and freight
movement has long been important to the North State
Super-Region. Even though timber harvesting and
wood processing has sharply declined over the decades,
agricultural production remains important and approximately
10% of the economy is now based on manufacturing. The rail
route through the Sacramento Valley and the Sacramento
River Canyon to Oregon is a vital component of the national
network. The North State Super-Region’s only seaport at
Humboldt Bay occupies an advantageous location to capture
a share of the Trans-Pacific shipping market, but lacks a rail
connection to the national system.
The current Union Pacific Railroad (UPRR) is an important
freight partner, but its overcrossing in Anderson does not
meet vertical and horizontal clearance standards needed
for safe operations and expansion of the UPRR I-5 Corridor
Line. The lack of a new overcrossing is also delaying other
transportation improvements within the project vicinity. A proposed project has innovatively brought together non-
traditional partners in both support and funding for the
project to ensure its success and maintain the continued
integrity of the I-5 corridor. The project will also increase
the interstate highway from four to six lanes, eliminating
an 8.9 mile bottleneck that becomes routinely congested by
heavy trucks during heavy snowfall events, often shutting
down the Interstate and access to Oregon and Washington.
The project will significantly improve the efficiency and
reliability of both truck and rail access on I-5 and the UPRR
line. These are primary highway freight corridors that support
agriculture and manufacturing throughout California and the
Pacific Northwest. The increased funding from SB 1 provides
an opportunity to improve goods movement along I-5 in the
Redding area as well as on important two-lane freight routes
such as SR 299/44/36 and SR 20.
Active Transportation In recent years there has been increased emphasis in
improving and expanding pedestrian and bicycle facilities
throughout the state. There are needs for many such facilities
throughout the North State Super-Region. In rural areas, local
communities often prioritize projects along school routes
and those which close long-existing pedestrian gaps. It is
difficult for rural communities to compete for funding in the
statewide ATP. This is because the program has historically
had insufficient funds and projects in rural communities
generally have a higher cost to benefit ratio than in urban
areas. Though the needs are pervasive, the ability to respond
to these needs also remain dependent on local and regional
agency staffing size and capability. For smaller agencies
with few resources to devote to competitive programs,

24 CALIFORNIA TRANSPORTATION COMMISSION
CHAPTER 6 - NORTH STATEN
OR
TH
S
TA
TE
more funding available to the ATP through SB 1 may be of
marginal benefit to the North State Super Region. Other
funding, such as that through Local Transportation Planning
Grants, may help prepare smaller rural agencies to be in a
more competitive position.
Local Bridges and Culverts Highway bridges represent an important part of the
local agency infrastructure in the region. The high cost of
rehabilitation and replacement of county and city bridges has
been somewhat relieved due to the federal Highway Bridge
Program (HBP). This program, coupled with the ability to use
toll credits for the federal match, has softened the blow of
high cost bridge projects on local agency budgets. However, few agencies have staffing to handle the management
and construction of several bridge projects at once. In
addition, since rural bridge projects are constructed in
environmentally-sensitive areas, the time frame for work can
be restricted. New roadway alignments further complicate
replacement of obsolete bridges. With thousands of bridges
and culverts on state highways and local roads, additional
funding provided by SB 1 is welcomed for these components
that are essential in keeping roadways operational in a
region where much of the state’s rainfall typically occurs.
In Mendocino County, the unfunded Garcia River Bridge
project is for a new permanent bridge where none had
existed before to provide an everyday local connection for
tribal members residing on both sides of the river and serve
as an emergency bypass when periodic flooding closes a
nearby section of SR 1. The bridge would be located on
Mendocino County’s South Coast between the communities
of Point Arena and Manchester. The project would provide
improved local circulation for residents of the Manchester
Rancheria as well as residents in nearby Manchester and
Point Arena. The project is consistent with the District 1
Climate Change Vulnerability Assessment and Pilot Studies
report.
Local Transit State Transit Assistance (STA) funding available to entities
in the North State Super Region has been unreliable in
recent years. The infusion of funding from SB 1 will stabilize
this funding source and permit transit agencies to replace
aging transit vehicles as well as supplement local funding
for continued operations. Since most operational funding
is provided by local sales taxes provided through the
Transportation Development Act, the prolonged recovery
from “The Great Recession” has had a major effect on small
rural transit operations.
North State Express Connect
The North State Super-Region has cooperated to develop a
public transit system option to link Redding with Sacramento
International Airport and downtown Sacramento. The North
State Express Connect will benefit the counties of Shasta, Modoc, Siskiyou, Lassen, Butte, Trinity, Tehama, Glenn, Lake,
Colusa, and Sacramento by meaningfully connecting them
to California’s intercity public transportation system. The
northern third of California is essentially cut off from the rest
of the state in regards to public transportation connections.
The service would enhance bus transit as a mode choice for
rural North State citizens to access Sacramento International
Airport, downtown Sacramento, and the Amtrak Sacramento
Valley Station for connections to the Capital Corridor, Coast
Starlight, San Joaquin and eventual California High Speed
Rail lines. The program would improve air quality by reducing
the overall number of automobile trips and provide an
environmentally friendly intercity transportation option to
commuters and recreational travelers. This important project
remains unfunded due to the aforementioned shortfall in
available transit funding
A short list of important projects can be found in Appendix D.
Prepared By
~ Del Norte Local Transportation Commission
~ Humboldt County Association of Governments
~ Lake County/City Area Planning Council
~ Mendocino Council of Governments
~ Modoc County Transportation Commission
~ Nevada County Transportation Commission
~ Shasta Regional Transportation Agency
~ Tehama County Transportation Commission

25
SACRAMENTO AREA - CHAPTER 7
UNFUNDED TRANSPORTATION INVESTMENT PRIORITIES
SA
CR
AM
EN
TO
AR
EA
–
–
Chapter 7 – Sacramento Area El Dorado, Placer, Sacramento, Sutter, Yolo, and Yuba Counties
INTRODUCTION
The Sacramento Area Council of Governments (SACOG) is the
Metropolitan Planning Organization responsible for regional
transportation planning in coordination with Sacramento,
Yolo, Yuba, Sutter, El Dorado and Placer counties and the 22
cities within those counties (excluding the Tahoe Basin).
Condition of Existing Infrastructure Overall, the Sacramento region’s roads are in poor condition.
On a scale of zero (failed) to 100 (excellent), the region’s
roads average 63 PCI, which is considered within the “At Risk”
range. The 2016 PCI by county is illustrated in Table 7. The
10-year need to bring the region’s roads into a good state of
repair is $5.6 billion. Without the passage of SB 1, the SACOG
region could have been facing a $3 to $4 billion shortfall to
bring all of its roads up to a PCI of 80 or better over the next
ten years.
TABLE 7 Sacramento Area 2016 PCI by County County 2016 PCI
El Dorado 62 - At Risk
Placer 68 - At Risk
Sacramento 62 - At Risk
Sutter 70 - At Risk
Yolo 55 - At Risk
Yuba 60 - At Risk
Region 63 - At Risk*
* Weighted Average
Bridges are an integral part of the transportation system.
The Sacramento region contains 953 local agency bridges.
Although the average sufficiency rating of the 953 local
agency bridges in the region is healthy, at 80 percent,
more than one third of the bridges (386) are in need of
rehabilitation, repair, or replacement. Twenty percent of those
bridges (88) have a sufficiency rating equal to or below 50, requiring replacement. Bridge sufficiency ratings by county are displayed in Table 8.
TABLE 8 Sacramento Area Bridge Sufficiency Ratings by County
County # of Bridges
Avg Sufficiency Rating, SR
Bridges with SR ≤80
Bridges with SR ≤50
El Dorado 86 68% 47 14
Placer 177 79% 51 23
Sacramento 403 85% 87 21
Sutter 90 79% 35 8
Yolo 123 77% 49 12
Yuba 74 74% 29 10
Region 953 80%* 298 88
* Weighted Average
Public transit system operations require a significant
financial commitment. In 2012, the 14 transit services in the
region spent about $187 million to operate fixed route and
dial-a-ride services. These operating costs include drivers,
mechanics, dispatching, fuel, parts, supplies, services, and
administration. The Great Recession resulted in significant
cuts to transit services to account for the lost revenues. The
drop in operating revenues corresponds to a 14 percent
reduction in annual vehicle service hours.
Level of Congestion SACOG defines congested vehicle miles traveled (CVMT) as
VMT occurring on roadways at or near generalized hourly
capacity. The region had 2.25 million miles total CVMT in
2012 (0.99 CVMT per capita). The total cost of congestion in
2012 was estimated at $834 million in the region. Even with
anticipated transportation investments, SACOG forecasts an
increase of 33 percent to 3.26 million miles of CVMT by 2020
(1.32 CVMT per capita).

26 CALIFORNIA TRANSPORTATION COMMISSION
CHAPTER 7 - SACRAMENTO AREAS
AC
RA
ME
NT
O A
RE
A
New funding is also needed to improve other performance
outcomes in the SACOG region. For example, according to
the Transportation for America report, “Dangerous by Design”,
the Sacramento Metropolitan Statistical Area experienced an
uptick in pedestrian fatalities between the 2014 report and
the 2016 report—an increase of 1.66 pedestrian fatalities
per 100,000 people to 1.77 pedestrian fatalities per 100,000.
The area also was determined to be more dangerous for
pedestrians in the 2016 analysis.
CONSEQUENCES OF THE PRIOR FUNDING SHORTFALL
The Sacramento region faced several key financial
stewardship challenges including how to fund the growing
need for road maintenance and rehabilitation, how to
pay for transit operations and replacement of worn-out
transit equipment, and how to make strategic operational
improvements to gain more system efficiency and reduce the
need for high-cost new capacity. If these problems were not
addressed by SB 1, road and transit conditions would have
continued to deteriorate and maintenance backlogs would
have continued to grow, exacerbating the problem.
Potential Effect on Maintenance and Operation of Transportation Systems, including Transit Prior to SB 1, the need for increased road maintenance faced
a backlog of $3-4 billion over 10 years. Lack of sufficient
funding for maintenance leads to much more expensive
reconstruction needs as pavements fail. The difference in
cost between routine maintenance, at $20-$40K per mile, and
full reconstruction, at $400-$700K+ per mile, exacerbates
the problem of falling behind. In addition, 90 percent of
the region’s bus fleet will be past useful life in the next 10
years. Half of the light rail fleet was built in the 1980s and
1990s and is in need of replacement. Needs for bus and light
rail vehicles over the next 10 years exceeds $400 million.
Without sufficient funding, vehicles can become unsafe or
unusable. At a minimum, neglected light rail vehicles make
transit less of a viable transportation option for choice riders.
Effect of Neglected Infrastructure on the Economy Negative economic impacts from poor infrastructure
are being felt across the Sacramento region. Roadway
maintenance costs are a heavy burden in rural areas which
account for 48 percent of the road miles in the region, but
only 13 percent of the population. Lack of maintenance
and improvement dollars to keep rural roadways safe and
operating efficiently reduces the ability to maintain the
economic viability of our rural economies and the region’s $2
billion agricultural economy.
A 2013 study undertaken by SACOG and the San Joaquin
Council of Governments found pervasive use of larger
STAA1 trucks but that “Local STAA routes in the study region
are incomplete... and inadequate to support the region’s
transportation needs.” Neglecting facility upgrades to meet
STAA design standards inhibits STAA truck activity, which
is critical to shipping, receiving and business vitality, and
further damages roadways not meant for their use.
In the Sacramento region, more than 25,000 employees use
transit to commute to work. This is significant because most
of the over 90 light rail vehicles belonging to the Sacramento
Regional Transit District are reaching 30 years of age.
Funding is needed for replacement or upgrades to safer and
more accessible low floor vehicles, the region is in a tough
position. Aging and deteriorating transit vehicles contribute
to a downward spiral of lower ridership, higher operating
costs, reduced fair box recovery, and reduced service shifting
riders into driving alone.
Fifty percent of the region’s mature suburbs were built
between 1950 and 1979, and are home to 45 percent of the
region’s households. The lower economic resources of these
mature suburbs, combined with rising costs and lack of funds
for maintaining and upgrading their older infrastructure,
results in significant challenges to business attraction, infill, revitalization, and economic growth.
1 The Surface Transportation Assistance Act of 1982 allows large trucks, referred to as STAA trucks, to operate on routes that are part of the National Network. FHWA provides standards for STAA trucks based on the Code of Federal Regulations Title 23 Part 658.
27
SACRAMENTO AREA - CHAPTER 7
UNFUNDED TRANSPORTATION INVESTMENT PRIORITIES
SA
CR
AM
EN
TO
AR
EA
WHERE ADDITIONAL FUNDING FROM SB 1 COULD BE SPENT
Maintenance and Operations Roughly $5.6 billion is needed over 10 years for local road
and highway maintenance to avoid or reduce expanding
backlogs. Prior to the passage of SB 1, this left a significant
funding shortfall without new revenue of $3 to $4 billion. In
addition, SACOG could spend $400 to $500 million for new
transit vehicles over 10 years to replace vehicles that have
exceeded their useful lives.
Goods Movement Trucking: In the SACOG region, I-80 is part of a national
freight corridor, carrying $4.7 million an hour in goods
movement; US 50 is a nationwide corridor, traversing the
nation from West Sacramento to Ocean City, Maryland; and
I-5 functions as a key north-south goods movement corridor.
According to a recent Goods Movement study conducted by
Caltrans District 3, corridors with elevated freight volumes,
such as I-5 and I-80, have high truck pavement damage
impacts requiring more repair/maintenance.
Freight Rail Route/Operations/Logistics: The Union Pacific Railroad is the primary Class 1 railroad in the area. The
largest rail facility on the West Coast, J. R. Davis Rail Yard, is
located in Roseville and moves over 1,100 cars per day. A
modification project identified in the 2007 State Rail Plan
is double-tracking of the section between Sacramento and
Roseville. As with other areas nationwide, more mainline
track miles are needed to keep up with anticipated demand,
but rail infrastructure is expensive to build and maintain.
Ports: The Port of West Sacramento specializes in bulk,
break-bulk, agriculture, and construction cargo. In 2010,
exports totaled $145.2 million by value and imports totaled
$3.7 million. Rice handling brings in about $2 million
annually. Major infrastructure improvements are needed to
make the Port more competitive, including increasing the
channel depth from 30 to 35 feet, and initiating a barge
service between the Ports of West Sacramento, Oakland, and
Stockton.
Non-Motorized Transportation Jurisdictions across the SACOG region value complete streets
that support corridors where all modes can safely and
conveniently travel. Although there are 22,000 lane miles of
existing collector and local streets in the region, there are
only 1,100 miles of bike lanes (Class II) on these facilities.
The region also has 300 miles of sharrows (Class III) and
480 miles of multi-use paths (Class I). SACOG acknowledges
that preserving the existing road and highway system is a
top priority for local agencies, and pursues opportunities
to leverage road rehabilitation to achieve complete streets
objectives, such as the expansion and improvement of
bicycle and pedestrian facilities. Therefore, investments in
maintaining roads in a good state of repair also result in
much needed improvements for walking and bicycling.
SACOG has also identified 2,300 capital bike/pedestrian
projects—such as sidewalks, freeway overcrossings, bridges, multi-use paths, and separated bikeways—needed in the
region to develop an interconnected system of streets,
bikeways, and walkways. This program of projects has a total
sum cost equal to $2 billion. In addition, local agencies have
identified 800 more projects needed to further strengthen
their active transportation networks, should funding become
available to continue the development of those projects.
Technology - Smart Cities & Implementation of ITS Master Plan SACOG plays a coordinating role in the Sacramento region
for intelligent transportation systems (ITS) and related
transportation technology efforts. Increasing the amount
of investment in ITS-related strategies would provide
significant benefits to increasing the productivity and
efficiency of the existing transportation system. Investment
needs include the following:
• Upgrading and coordinating traffic signals to promote a smoother flow of traffic.
• Roadway cameras.
• Automated highway message signs.
• Crosswalk signals with pedestrian countdown timers.
• Real-time train or bus arrival time message signs (such as those seen at RT light rail stations).

28 CALIFORNIA TRANSPORTATION COMMISSION
CHAPTER 7 - SACRAMENTO AREAS
AC
RA
ME
NT
O A
RE
A
• Prepaid transit fare machines.
• Traffic signal preemption for emergency and limited-stop transit vehicles to improve emergency response
times and the on-time performance of public transit.
In support of ITS, Caltrans District 3 has established a
transportation management center (TMC), as have several
larger cities and counties. Additionally, Caltrans and local
agencies have deployed field monitoring (loops, closed circuit
TV) and controls (meters & signals under TMC control). New
funding to the SACOG region would support significant
expansion of the field monitoring and control equipment, as
well as expansion of STARNET, a communications network
connecting traffic operation centers. Through its Integrated
Corridor Management approach, Caltrans, SACOG and local
agency partners across the region have begun planning for
corridor management on major freeway corridors.
Funding needs also include improvements to smart fare
media, a form of ITS, for the SACOG region. The Connect Card
currently being deployed improves fare collection and ease
of payment for people who use public transit. The Connect
Card will allow transit users to transfer seamlessly across
multiple transit operators and routes.
A short list of important projects can be found in Appendix E.
Prepared By
~ El Dorado County Transportation Commission
~ Placer County Transportation Planning Agency
~ Sacramento Area Council of Governments
~ California Department of Transportation District 3

29
SAN DIEGO - CHAPTER 8
UNFUNDED TRANSPORTATION INVESTMENT PRIORITIES
SA
N
DI
EG
O
Chapter 8 – San Diego San Diego County
INTRODUCTION
The San Diego Region contains 18 cities plus unincorporated
areas under the jurisdiction of the County of San Diego, and
has a population of over 3 million. Additionally, the region
is situated on the international US-Mexico border, hosts one
of the most travelled border-crossings in the world, is home
to the largest concentration of military forces in the country,
encompasses 18 Native American reservations represented by
17 tribal governments (the most in any county in the United
States), boasts a multi-cultural and multi-lingual workforce,
houses 3 major public universities and a growing number of
high-tech research and software engineering companies, is a
seaport destination, and supports an extraordinary range of
species and habitats in areas designated for permanent open
space preservation.
Level Of Travel Delay San Diego Association of Governments (SANDAG) tracks
the performance of its planned transportation networks in
a variety of ways, including various performance measures
included in its Regional Plan. These measures help to chart
the value of future transportation projects while responding
to changes in land use patterns and future growth. The
performance measures specifically assess how the various
transportation projects work together to help people in the
region access jobs, schools and services, ensure an equitable
distribution of investments, improve air quality, reduce
greenhouse gas emissions, and improve safety. SANDAG also
publishes the “State of the Commute Report” which focuses
on regional travel trends, key system performance indicators,
and corridor-level performance indicators.
Based on the most recent analysis, total weekday freeway
travel increased from 9.3 billion vehicle miles in 2013 to
9.5 billion vehicle miles in 2014, an increase of more than
2 percent. Overall, per capita weekday freeway travel grew
slightly to approximately 11.9 vehicle miles traveled per
person. This growth in freeway travel reflects the steady economic recovery that has taken place in the region since
2009. At the same time, the region’s population has grown to
3.19 million, or more than 4 percent. In 2014, employment
in San Diego County was approximately 8 percent higher
than the lowest employment level observed in 2009. In
terms of the transit analysis, the State of the Commute
shows that transit has seen gains in ridership throughout
the years, similar to the increases in freeway travel. Transit
passenger miles traveled in 2014 increased by approximately
4.5 percent compared to the previous year, increasing faster
than both population (1.3%) and employment (2.4%). Transit
revenue miles are an indication of the amount of transit
service available to the public in the region. Between 2010
and 2014, transit revenue miles increased by 5 percent,
reflecting investment made as part of Regional Plan
implementation.
Additionally, after the recession, peak hour travel began
to steadily increase on the region’s roadways. In 2014,
commuters in the San Diego region experienced their fourth
consecutive year of growth in freeway delay during peak
commute periods. In 2014, annual delay on the region’s most
congested freeway segments reached up to 15,000 vehicle
hours per lane mile. I-805 and I-5 were home to the most
persistent congestion points in 2014. Most of the increases
in delay observed occurred in a few specific freeway corridors
and the top contributors included I-5, I-805, and SR 78.
From an overall perspective, drivers on the region’s freeway
system experienced nearly 6.4 million vehicle hours of delay
during peak commute periods in 2014. That is an overall
increase of approximately 23 percent compared to 2013.
Percentage of total delay by freeway corridor is shown on the
following page in Figure 5 (a.m.) and Figure 6. (p.m.)

30 CALIFORNIA TRANSPORTATION COMMISSION
CHAPTER 8 - SAN DIEGOS
AN
D
IE
GO
FIGURE 5 – Delay on San Diego Freeways During A.M. Commute Periods (2014)
I-8 SR-94 8% 7% SR-52
I-5 23%
I-15 12%
5% SR-78
5%
Other 8%
I-805 32%
I-15 13% I-8
4%
4% SR-52
I-805 23% I-5
34%
The San Diego-Baja California region has three land ports of
entry:
• San Ysidro-Puerta Mexico-El Chaparral.
• Otay Mesa-Mesa de Otay.
• Tecate-Tecate.
An additional port of entry, Otay Mesa East—Mesa de Otay II, is a new land border crossing under development. The
Otay Mesa point of entry is the busiest gateway for trade
between California and Mexico and ranks third in value of
trade along the entire US-Mexico border. In 2015, it handled
more than $42 billion in two-way trade by truck. From
Tijuana to San Diego, the San Diego points of entry processed
more than 23 million total vehicles, and nearly 51 million
individual crossings in 2015. As the 2007 SANDAG report,
“Economic Impacts of Border Wait Times,” states, inadequate
infrastructure capacity at the border crossings between San
Diego County and Baja California currently creates travel
delays for cross-border personal trips and freight movements
that cost the US and Mexican economies an estimated $7.2
billion in foregone gross output and more than 62,000 jobs
in 2007. The 2007 report estimated that with a delay of about
two hours per truck, San Diego County loses $455 million in
annual revenue from reduced freight activity. This translates
into more than 2,400 jobs or $131 million in lost labor
income per year.
FIGURE 6 – Delay on San Diego Freeways During P.M. Commute Periods (2014)
SR-78 SR-163 10% 5%
Other 7%
CONSEQUENCES OF THE PRIOR FUNDING SHORTFALL
Funding shortfalls create both uncertainty and curtail the
agency’s ability to be well positioned for various competitive
funding sources. In addition, shortfalls in operations and
maintenance funding increase the probability of costlier
capital replacement in the future and, in some cases, may
increase potential safety risks, not to mention the impacts to
the traveling public due to travel delay and service reliability.
As a result, an underfunding of transportation infrastructure
also could lead to a more rapid degradation of the existing
system’s infrastructure that is both over-used and under-
maintained. The passage of SB 1 alleviates this underfunding
and uncertainty.
Effect on Maintenance and Operation of Transportation Systems, including Transit Streets and highways carry huge amounts of traffic, and they absorb continual wear from heavy trucks and other vehicles.
The proposed 2016 SHOPP recognizes that there are more
needs than available dollars. SANDAG supports getting
projects “shovel-ready” in order to attract funding when
opportunities arise.

31
SAN DIEGO - CHAPTER 8
UNFUNDED TRANSPORTATION INVESTMENT PRIORITIES
SA
N
DI
EG
O
In years past, especially reeling from the 2008 economic
crisis, transit agencies in San Diego were forced to scale back
on bus service by either reducing frequency of service and/
or eliminating weekend service altogether. In doing so, this
directly impacted employment for transit agency service
operators/workers (drivers, maintenance workers, etc.), in
addition to, as stated earlier, reducing access to job centers
and schools for transit riders.
Fueling Our Economy Implementing the Regional Plan will result in big economic
benefits for the region. Many thousands of construction
jobs, and thousands more in supporting industries, will
be generated as projects are built. As those projects are
completed, economic benefits will continue as increased
connectivity saves time and money, leading to increased
productivity. Access to jobs, housing, and education will
strengthen the labor pool, and the increased flow of
commerce will benefit the operations of our business
community. The Plan’s economic analysis shows that its
benefits will outweigh the costs of putting it into action by a factor of almost two to one. For every dollar invested, San
Diegans will receive nearly two dollars of benefit.
The tangible economic benefits of the Regional Plan
will include a more efficient transportation network that will support more than 95,000 jobs throughout the
economy in perpetuity, starting with an increase of 10,000
construction-related jobs in 2015. On average over the next
35 years, the Plan will support 53,000 jobs in the region
annually. In the first few years of the Plan, the investment
in the transportation network will spur about $1 billion in
additional economic activity, increasing to $34 billion by
the end of the Plan. On average, the Plan will augment the
region’s economy by $13 billion per year, and will increase
personal income, raising overall earnings by about half a
billion dollars in the early years, with that number growing to
more than $13 billion by 2050. The average annual gain will
be nearly $6 billion region-wide.
WHERE ADDITIONAL FUNDING FROM SB 1 COULD BE SPENT
SANDAG has identified several corridors where funds from SB
1 could be prioritized. These corridors have been organized
by sub-region in order to illustrate the various needs around
the County of San Diego. Additionally, a set of region-wide
programs have been identified and are tallied separately. In total, the San Diego region has identified $10.6 billion in
corridor needs and $1.7 billion in program needs for a total
of $12.3 billion. It should be noted that approximately $9
billion in corridor needs and all $1.7 billion of the region-
wide programs represent major improvements that could be
scaled down as part of the initial phase of implementation to
reflect available funding.
A list of those projects and programs can be found in
Appendix F.
Prepared By
~ San Diego Association of Governments

32 CALIFORNIA TRANSPORTATION COMMISSION
CHAPTER 9 - SAN FRANCISCO BAY AREAS
AN
F
RA
NC
IS
CO
B
AY
AR
EA
Chapter 9 – San Francisco Bay Area Alameda, Contra Costa, Marin, Napa, San Francisco, San Mateo, Santa Clara, Solano, and Sonoma Counties
INTRODUCTION
The San Francisco Bay Area is the fourth largest metropolitan
region in the United States, with over 7.6 million people
residing in the nine-county, 7,000 square-mile region. In
recent years, the Bay Area economy has experienced record
employment levels amidst a booming technology sector
rivaling the “dot-com” era. The latest economic growth cycle
extended not only to the South Bay and Peninsula – the
traditional hubs of Silicon Valley – but also to neighborhoods
in San Francisco and the East Bay. The rapidly growing and
changing economy has created significant challenges for the
region’s transportation system, with record levels of freeway
congestion and historic crowding on transit systems. In many
cases, the infrastructure serving key employment centers was
designed and built for the travel patterns of another era.
With streets and roads managed by nine counties and 101
cities, transit service provided by more than 20 different
agencies, a state-owned highway system, a landmark
bridge owned and operated by a special district, and more
— finding sufficient resources to address the region’s many transportation needs is no easy task.
Condition of Existing Infrastructure The Bay Area’s local street and road network includes over
42,000 lane miles of roadway used by cars, buses, trucks,
bicycles, and pedestrians. Pavement on Bay Area streets and
roads is currently in “fair” condition with an overall PCI of
66. PCI has been relatively stable for the past decade and is
reflective of stagnation in performance gains over the past
few years. The passage of SB 1 will give a significant boost
to local governments working to improve their pavement
condition and aging infrastructure.
The percentage of Bay Area highway lane-miles with
pavement in distressed condition fell from about 29 percent
in 2011 to 21 percent in 2013, the lowest level registered in
at least 15 years. Much of the improvement is due to a series
of repaving projects along Interstate 80, US Highway 101 and
other major routes made possible by state funds delivered
through the 2006 Proposition 1B bond measure and the
2009 federal stimulus package. These funds have largely
been expended and the programs largely completed. SB 1
will allow the region to preserve these improvements and
make additional, much needed gains.
The Bay Area’s most recent transit asset data show that
approximately 29 percent of the region’s transit assets have
exceeded their useful life, including 37 percent of transit
vehicle assets. Bay Area Rapid Transit (BART) stands as a
primary example of the region’s aging transit infrastructure
with 49 percent of all BART infrastructure past its useful life,
including tracks, control systems, vehicles, and guideways.
According to the most recently available data, 15 percent of
Bay Area bridges and overpasses are considered structurally
deficient. Although this is the best performance since
1998, the Bay Area continues to have the greatest share of
structurally deficient bridges of any major metro area in the
country. In recent years there was a major Caltrans effort
around seismic retrofits (such as along Doyle Drive in San
Francisco), but there is still much more to do.
Level of Congestion Overall commute time is at the highest level on record, as
is time spent in congestion on a per-commuter basis. Across
the region, “congested delay,” which MTC defines as time
spent in traffic moving at speeds of 35 miles per hour or
less, surged 22 percent in 2015 to an average of 3.2 minutes
per commuter each weekday from 2.7 minutes in 2014. This
marks a nearly 70 percent increase over the 1.9-minutes-per-
commuter-per-day figure registered in 2010.
These delays are felt most acutely along critical freeway
routes. Table 9 shows MTC’s annual ranking of the Bay Area’s
most congested freeway segments by daily weekday vehicle
hours of delay in 2015. The afternoon drive on northbound
US 101 and eastbound I-80 in San Francisco are currently the
region’s most notorious traffic bottlenecks.

33
SAN FRANCISCO BAY AREA - CHAPTER 9
UNFUNDED TRANSPORTATION INVESTMENT PRIORITIES
SA
N
FR
AN
CI
SC
O
BA
Y A
RE
A
–TABLE 9 Bay Area’s Most Congested Freeway Segments by Weekday Vehicle Hours of Delay
2015
Rank
Location 2015 Daily (Weekday)
Vehicle Hours of Delay
2014
Rank
1 US 101, northbound/Interstate 80, eastbound p.m. – San Francisco County
I-280 to east of Treasure Island Tunnel
13,710 4
2 Interstate 80, westbound, all day – Alameda, Contra Costa, & San Francisco
Counties CA-4 to US-101
13,010 1
3 Interstate 680, southbound & Interstate 280 northbound, a.m.– Santa Clara
County South Jackson Avenue to Foothill Expressway
7,610 20
4 US 101, southbound, p.m. – Santa Clara County Fair Oaks Avenue to Oakland
Road
6,970 3
5 Interstate 80, eastbound, p.m.– Alameda County West Grand Avenue to Gilman
Street
6,140 7
6 Interstate 880, southbound, a.m.– Alameda County I-238 to SR-237 6,040 2
7 Interstate 680, northbound, p.m.– Alameda County SR-262/Mission Boulevard
to Calaveras Road
5,260 6
8 US-101, northbound, a.m.– Santa Clara County Silver Creek Valley Road to
North Fair Oaks Avenue
5,070 10
9 Interstate 880, northbound, p.m.– Alameda County Mowry Avenue to A Street 4,400 16
10 US-101, northbound, p.m.– San Mateo County SR-84/Woodside Road to East
Hillsdale Boulevard
4,400 12
The region is currently experiencing historic crowding on its
largest, most critical transit systems.
BART: Average weekday BART ridership is at the highest
level on record, having grown 34 percent from approximately
323,000 passengers to 433,400 from 2006 to 2016. Two out
of three BART trips now begin or end at the four downtown
San Francisco stations, with Montgomery and Embarcadero
stations approaching 90 to 100 percent station capacity
during peak periods. Peak direction, rush-hour trains exceed
BART’s standard maximum of 107 passengers per car,
sometimes reaching as high as 140 passengers per car, or
131 percent of capacity. BART projects that daily ridership
will increase by 25 percent to nearly 500,000 by 2025 and by
50 percent to 600,000 by 2040.
Caltrain: Caltrain’s daily ridership more than doubled in the
last ten years, from approximately 30,000 in 2006 to a record
62,400 in 2016. The ten highest-demand trains operated by
Caltrain now have ridership exceeding 100 percent of seated
capacity, with the busiest trains exceeding 120 percent of
seated capacity. Caltrain projects average weekday ridership
will grow by approximately a third by 2021, to 83,000.
Muni: Muni is the region’s most-used transit system and
ridership has grown by six percent in the last decade.
Morning peak-hour ridership in the Market Street tunnel has
grown by one-third in the last five years and several Muni
Metro lines are at capacity during peak travel times.
CONSEQUENCES OF THE PRIOR FUNDING SHORTFALL
Effect on Vehicle Infrastructure As shown in Table 10, to reach a state of good repair for
streets and roads, highways and bridges, the region will need
to spend an estimated $11.7 billion. Anticipated reliable
funding is estimated at only $2.9 billion, leaving a state
of good repair shortfall of approximately $8.8 billion. This
estimate of existing funding already includes new revenue
from tax measures passed in 2016 in Santa Clara County and
Oakland.

34 CALIFORNIA TRANSPORTATION COMMISSION
CHAPTER 9 - SAN FRANCISCO BAY AREAS
AN
F
RA
NC
IS
CO
B
AY
AR
EA
–TABLE 10 Bay Area Local Streets and Roads Ten Year Funding Scenarios and Performance Outcomes Local Streets and Roads
State of Good Repair
Existing Funding* State of Good Repair Shortfall
2017 Dollars $11.7 billion $2.9 billion $8.8 billion
PCI 85 56 N/A
*Includes revenue from 2016 measures in Santa Clara County and Oakland
MTC’s modelling predicts the region will need an additional
$2 billion over the next ten years just to maintain current conditions. Without additional funding, PCI on local streets and
roads will fall from its current “fair” rating of 66 to an expected
“at-risk” rating of 56. With SB 1 the region’s local streets
and roads will receive much needed attention. SB 1 funding
will help the region maintain our streets and roads at their
current PCI of 66. Deferring maintenance for roads, bridges
and highways saves money in the short term, but this practice
forces more costly future repairs, ultimately increasing costs in
the long term.
It is also important to note that while the region’s average
pavement condition is considered fair, as shown in Figure 7,
Figure 7 -Pavement Life Cycle Chart
the deterioration curve of a typical pavement is exponential,
and not linear. Pavements that are still in good condition (a
PCI of 70 or above) can be preventively maintained at a low
cost, whereas pavements that need significant rehabilitation
or reconstruction require five to 15 times the amount of
funding, as illustrated in the figure below. Once pavements
fall below a PCI of 60, users of the roadways begin to
experience increasing vehicle operating costs associated with
wear and tear on, or damage to their vehicles and additional
fuel costs. Maintaining pavement at a state of good repair not
only saves on increased rehabilitation costs in the future, but
also saves drivers car repair costs and reduces greenhouse
gas emissions.
PAVEMENT LIFE CYCLE
PAV
EM
EN
T C
ON
DIT
ION
Excellent
Good
Fair
Poor
Very Poor
Failed
YEARS
0 5 10 15 20
40% drop in quality
40% drop in quality
75% of life
12% of life
$1 for renovation here
Will cost $5 here
Time varies depending on traÿc, climate, pavement design, etc.

35
SAN FRANCISCO BAY AREA - CHAPTER 9
UNFUNDED TRANSPORTATION INVESTMENT PRIORITIES
SA
N
FR
AN
CI
SC
O
BA
Y A
RE
A
–
Effect on Transit As shown in Table 11, to reach a state of good repair for the
region’s transit capital assets, the region will need to spend
an estimated $23 billion. Prior to SB 1, anticipated reliable
funding was estimated at only $7.9 billion, leaving a state of
good repair shortfall of approximately $15.1 billion. The influx of additional reliable funding will help the region further
reduce the percent of assets exceeding their useful lives.
Effect on the Economy As previously noted, congestion delays and capacity
constraints are already at record levels. These congestion and
capacity challenges are already imposing significant costs
on the Bay Area in terms of environmental impacts and lost
productivity.
There are many planned improvements to help alleviate
transit crowding and improve overall transportation system
efficiency — including vehicle
TABLE 11 Bay Area Transit Capital Ten Year Funding Scenarios and Performance Outcomes
Transit State of Good Repair
Existing Funding
State of Good Repair Shortfall
Nominal dollars $23.0 billion $7.9 billion $15.1 billion
Percent of Assets Exceeding Useful Life
0% 22% N/A
Well-maintained transit vehicles, stations, trackways and
other key infrastructure are needed to deliver the reliable
performance that Bay Area transit riders are seeking, and to
ensure passenger safety and comfort. Aging infrastructure
causes increased maintenance issues, exacerbating crowding
on days when vehicles must be taken out of service or
infrastructure like tracks and wiring need emergency repairs.
These older assets result in lower reliability and higher repair
costs.
replacement and expansion, new
technologies and control systems,
new facilities and infrastructure,
new transit routes and services,
and new pricing and metering
technologies. SB 1 will fund these
improvements, accommodating
anticipated population and
employment growth that would be difficult to address
without additional transportation funds.
According to the Bay Area Economic Council Institute, more
efficient transportation networks can:
• Improve access to jobs.
• Increase attractiveness to new and expanding businesses.
• Extend the regional labor pool available to employees.
• Improve travel time reliability.
• Reduce carbon emissions.
• Provide opportunities for economic development
around new transportation hubs.
Conversely, the region would have experienced moves in the
opposite direction along all of these measures. Thanks to
the additional resources from SB 1, the Bay Area’s existing
transportation system can be better maintained in a state of
good repair and important regional efficiency and expansion
projects are expected to move ahead.

36 CALIFORNIA TRANSPORTATION COMMISSION
CHAPTER 9 - SAN FRANCISCO BAY AREAS
AN
F
RA
NC
IS
CO
B
AY
AR
EA
WHERE ADDITIONAL FUNDING FROM SB 1 COULD BE SPENT
Even with the passage of SB 1, the Bay Area’s transportation
funding needs will continue to exceed available resources.
The sections below describe the Metropolitan Transportation
Commission’s priorities for new funding and are reflective
of MTC’s long-range plan adopted in 2013 (Plan Bay Area)
and other investment policy deliberations and represent
potential program areas that could put funding to work in
the near- term should additional funding be available. The
influx of significant funding from SB 1, as with any new funding, warrants additional policy discussions, though most
of the funds are targeted at maintaining our local and state
roadways in a state of good repair, affording relatively limited
discretionary priority setting. The sections below illustrate
the region’s great transportation needs across modes and
highlight priority projects and programs.
Maintenance and Operations Plan Bay Area, the Bay Area’s Regional Transportation Plan/
Sustainable Communities Strategy, identifies maintaining
our existing infrastructure to be among the highest priorities
for new revenue. In fact, approximately three-quarters of the
region’s projected 24-year revenues are to be directed to
maintaining our streets, highways, and bridges, and ensuring
a state of good repair of our transit capital assets, such as
buses, railcars, ferries, and related infrastructure. A significant
portion of the new available revenues would likely be
directed towards bridging these funding gaps, in keeping
with MTC’s “Fix It First” policy.
New Capacity – State Transportation Improvement Program The traditional state funding source for new capacity is the
STIP. Due to the volatility of gasoline prices in recent years
and its effect on the variable price-based excise tax, STIP
revenues have drastically been reduced. The latest 2016 STIP
cut $754 million in existing funding from projects. In the Bay Area, over $115 million in state funds previously committed
to important expansion projects vanished, leaving cities, counties, and transit operators scrambling for alternative
funding or deferring needed projects. SB 1 stabilized the
STIP by eliminating the variable price-based excise tax and,
effective July 1, 2019, replaced it with an excise tax indexed
to inflation stabilizing transportation revenues and allowing
for more efficient planning and budgeting for project and
program delivery.
Many counties have policies outlining their priorities for
future STIP funds. For instance, earlier this decade, the San
Francisco County Transportation Authority identified large
capital projects such as the Central Subway, Presidio Parkway, Caltrain Electrification, and Transbay Terminal projects as
priorities for future STIP funds. While some of these projects
are completed or under construction, future phases remain
unfunded and will depend on STIP funds to move forward.
Transit MTC recognizes the need for strategic transit expansion
to support the Bay Area’s growth and ensure economic
competitiveness. MTC has prioritized a number of near-term
investments for future FTA funding. These projects already have substantial local funding, but require additional funds
in order to move to construction. For example, the region
prioritized the Transbay Transit Center, Phase 2 – Downtown
San Francisco Extension for roughly $1 billion in federal
funds. The Downtown Extension project would extend
Caltrain and California High-Speed Rail to the new Transbay
Terminal from its current terminus at 4th and King. Another
example is the BART Core Capacity project, prioritized for
$900 million in federal funds. The Core Capacity project
would construct improvements to support future ridership
growth. MTC also supports $75 million in federal funds for
AC Transit’s Bus Rapid Transit on San Pablo Avenue, which
extends high-quality bus service paralleling the busy I-80
corridor in the East Bay. In total, the region endorsed over
$4 billion worth of projects for federal or other types of new transit capital funding.
In 2016, MTC endorsed a number of ready-to-go projects for
various competitive funding programs, such as the federal
Transportation Investment Generating Economic Recovery
(TIGER) grant program, and the state Cap and Trade Transit
and Intercity Rail Capital Program (TIRCP). For the TIGER
program, MTC endorsed a list of seven projects for this
highly-competitive program in April 2016. Since then, two
37
SAN FRANCISCO BAY AREA - CHAPTER 9
UNFUNDED TRANSPORTATION INVESTMENT PRIORITIES
SA
N
FR
AN
CI
SC
O
BA
Y A
RE
A
projects have secured other funding. For the Cap and Trade
TIRCP, MTC endorsed a list of 11 projects totaling $450.8
million in April 2016. These projects fit into MTC’s Regional
Cap and Trade Framework for TICRP funds, also adopted in
2016. These projects are listed in Appendix G.
Goods Movement With the third-busiest container port in California located
in the Bay Area, MTC recognizes the importance of
improvements to the region’s goods movement network.
To that end, MTC adopted the Bay Area Regional Goods
Movement Plan in 2016, which provides a framework for
future investment in the region’s freight infrastructure.
The latest federal transportation authorization, the Fixing
America’s Surface Transportation (FAST) Act, includes two
programs that specifically support freight: the Fostering
Advancements in Shipping and Transportation for the
Long-term Achievement of National Efficiencies (FASTLANE)
competitive grant program, and the National Highway Freight
Program (NHFP) formula program. However, the funding
levels in these two federal programs are small: only about
$850 million in FASTLANE grants are available each year,
and only about $580 million is available statewide in NFHP
funds over the five-year FAST Act period. Still, MTC supported
several ready-to-go projects for the first cycle of the
FASTLANE competitive program in 2016. Projects are listed
in Appendix G; note that some segments may have since
received other funding, resulting in a range of estimated
remaining need. SB 1’s Trade Corridor programs will be an
important source of funding for these improvements.
Non-Motorized Transportation In 2013, California created the ATP, which combines
various fund sources into one cohesive program for active
transportation projects. So far, MTC adopted three cycles of
ATP, and in each cycle, MTC received far greater requests than
money available. For instance, in the latest cycle, adopted
by MTC in early 2017, the region had $22 million available
over two years. However, MTC received over $165 million in
project requests for ATP funds – or 7.5 times the amount of
available funding.
As part of each ATP cycle, MTC adopts a list of contingency
projects, which are listed in descending score order. If
there are project savings, failures, or additional funds, MTC would fund the projects on the list. SB 1’s $100 million
annual boost to the ATP program, along with making bicycle
and pedestrian improvements an eligible source of the
augmented local road funding, will address the demand for
active transportation improvements throughout the Bay Area.
Technology The Bay Area is the home of Silicon Valley and its innovation
and technology centers, and the region’s transportation
system should be no different. MTC has prioritized lower-cost
efficiency improvements to deliver effective congestion-
relieving improvements, rather than the high capital costs
of brand new infrastructure. These efficiency improvements
include intelligent transportation systems, ramp metering,
express Lanes, and other innovative measures.
In preparation for the region’s 2017 regional transportation
plan update, MTC is proposing nearly $7 billion worth of
efficiency projects using technology. Any increase in flexible
transportation dollars could go towards these projects.
A sampling of the types of projects submitted for Plan Bay Area 2040 is included in Appendix G.
Prepared By:
~ Metropolitan Transportation Commission

38 CALIFORNIA TRANSPORTATION COMMISSION
CHAPTER 10 - SAN JOAQUIN VALLEYS
AN
J
OA
QU
IN
VA
LL
EY
Chapter 10 – San Joaquin Valley Fresno, Kern, Kings, Madera, Merced, San Joaquin, Stanislaus, and Tulare Counties
INTRODUCTION
The San Joaquin Valley (SJV) is the state’s largest and one
of the world’s most important agricultural regions, home
to seven of the top ten agricultural producing counties in
the nation. The eight-county SJV Super-Region is roughly
40 to 60 miles wide and 250 miles long. It is bordered on
the west by the coastal mountain ranges, in the east by
the Sierra Nevada Mountains, in the north by Sacramento
County, and in the south by the Tehachapi Mountains. The
region includes eight urbanized areas, and each county has
a Regional Transportation Planning Agency/Metropolitan
Planning Organization. The SJV Super-Region consists of
62 incorporated cities, 27,000 square miles, 17.6 million
acres, and 31,000 miles of roadways. The population is
approximately 4 million, and is expected to grow to more
than 7 million residents by 2050. The region has wide-
ranging transportation needs that require innovative
solutions.
Existing Conditions The SJV Region has a large amount of interregional travel
that passes through or originates in the Valley and goes
to the Bay Area, Sacramento, Southern California, and
points east. The SJV area has a multi-modal and diversified
transportation system, including Interstate and state
highways, Class 1 and short line railroad facilities, intermodal
terminals and connections, regional and local transit
systems, inland ports and waterways, air cargo facilities,
and other infrastructure. The major transportation facilities
run generally north to south, and include Interstate 5 and
State Route 99 (recently rated as one of the most dangerous
highways in the nation), and the Union Pacific Railroad
and Burlington Northern & Santa Fe Railroads. Other main
highways include I-205, I-580, and State Routes 4, 14, 33,
41, 43, 46, 58, 65, 120, 132, 140, 178, 180, and 198. The SJV
contains the primary road and rail routes between the San
Francisco Bay and Sacramento Areas and Southern California,
including the Ports of Los Angeles and Long Beach. The San
Joaquin Intercity Rail Corridor includes passenger rail service
between Oakland and Bakersfield, and Sacramento and
Bakersfield. The San Joaquin Corridor boasts the fifth highest
ridership of an Amtrak service in the country. The San Joaquin
Regional Rail Commission operates the Altamont Corridor
Express service, which provides four commuter passenger
trains daily between Stockton and San Jose. In addition, the
SJV contains the Port of Stockton and air travel corridors.
There are fixed route transit systems throughout the region, with some inter-regional service provided by private and
public bus service providers.
CONSEQUENCES OF THE PRIOR FUNDING SHORTFALL
The entire SJV Super-Region experiences congestion issues
that create delays in critical freight goods movement and
overall mobility. The high levels of traffic congestion on the
region’s highway system and local roadway networks lead to
increased delays and poor mobility, accessibility, and safety
issues for the public. Increasing congestion and less efficient
freight traffic movement throughout the SJV has a negative
impact on the economy and environment. As an indication
of congestion, a number of intersections and highways
throughout the SJV Super-Region are operating at Level of
Service (LOS) E or F during the AM or PM peak hours. There
is also a critical need to separate at-grade rail crossings to
improve freight efficiency and to reduce related congestion
and safety issues.
Motor vehicle crashes have been on the rise, with increasing
numbers of serious injuries and deaths. Roadways
throughout the region and in cities are in critical need of
safety improvements, including providing safer access for
pedestrians and bicyclists. Anticipated climate change effects
may have negative impacts on SR 4, SR 12, the BNSF Railway,
as well as numerous state and local roads within or near the
primary and secondary flood zones throughout the Valley as
exemplified by recent storm damage.

39
SAN JOAQUIN VALLEY - CHAPTER 10
UNFUNDED TRANSPORTATION INVESTMENT PRIORITIES
SA
N
JO
AQ
UI
N V
AL
LE
Y
–
There is a critical need to improve east-west connectivity
throughout the SJV Region. The counties within the SJV
Region serve as a vital hub for the movement of agricultural
(farm to market) and other goods, both locally grown/
produced or those that pass through the region. The lack of
efficient and direct east/west travel routes between SR 99, I-5, SR 33 and other facilities in the SJV is a pressing concern
for the region. The percentage of trucks along major corridors
within the SJV Super-Region is high. Many state routes in the
SJV Super-Region contain truck traffic percentages greater
than 25 percent of the overall average annual daily traffic, with some of the highest truck counts occurring on SR 33,
SR 198, SR 46, and SR 58. High truck percentages can
contribute to slower traffic flow, decreased efficiency, decreased safety, and deterioration of infrastructure,
including on local roads.
Goods movement is critically important throughout the
SJV Super-Region. The San Joaquin Valley Goods Movement
Study has identified urgent corridor and first- and last-
mile connection issues. It is critical that improvements be
implemented on local street networks, in addition to major
goods movement routes. Local first- and last-mile street
networks connect freight generators and receivers, such
as manufacturing facilities and retail clusters, with major
transportation routes. Congestion relief, signal coordination,
signage, and pavement quality projects are critically needed
to improve goods movement.
Regional and local transit systems throughout the SJV
struggle to maintain current service levels. Transit funding
shortfalls will result in reduced transit service, fewer routes,
and less frequency, which all negatively affect people
dependent on public transit to meet their daily critical
needs. Transit systems are vital to reducing congestion
and providing transportation options for disadvantaged
populations. Anticipated federal and state transit funding
revenues over the next 10 years fall short of the amounts
needed to keep up with demand Throughout the SJV Super-
Region, inter-county and general rural transit options are
limited. There are vast rural areas throughout the region,
which create challenges in providing appropriate transit
services.
Bicycle and pedestrian access to the transportation system is
inadequate, with many areas in dire need of sidewalks, safer
street crossings, and improved bicycle facilities.
The SJV region has historically had a severe shortfall of
funding to adequately maintain the transportation networks.
Major pavement rehabilitation and reconstruction have been
deferred due to their high costs and the region’s limited
maintenance funding.
All communities have had difficulties funding pavement
preservation activities necessary to keep area roads from
further deterioration. According to the 2016 California
Statewide Local Streets and Roads Needs Assessment, and
as shown in Table 12, the PCI of roads throughout the region
are “Poor” and/or “At Risk.” There is a dire need to address
pavement maintenance and bridge rehabilitation efforts.
The passage of SB 1 will bring critically needed funding
to preserve roads and bridges, and to catch up on deferred
major maintenance and reconstruction projects.
TABLE 12 San Joaquin Valley 2016 Average PCI by County
County 2016 PCI
Fresno 64
Kern 63
Kings 59
Madera 46
Merced 66
San Joaquin 70
Stanislaus 55
Tulare 60
SJV Region 62-at risk*
*Weighted average using lane miles
40 CALIFORNIA TRANSPORTATION COMMISSION
CHAPTER 10 - SAN JOAQUIN VALLEYS
AN
J
OA
QU
IN
VA
LL
EY
WHERE ADDITIONAL FUNDING FROM SB 1 COULD BE SPENT
Prior to SB 1, the SJV Super-Region faced serious funding
shortfalls. Counties and cities were unable to keep up
with maintaining streets, roads, bridges, sidewalks, and
other critical components of the region’s transportation
infrastructure. As state and federal funding continued to
decline and the regional and local transportation systems
continued to deteriorate, additional revenue was needed to
not only maintain the current system, but also to meet the
urgent needs of a growing population.
Without the additional funding investments provided by
SB 1, area roadways would have continued to deteriorate,
congestion would have continued to increase, local road and
street maintenance would continue to suffer, and the SJV
Super-Region would continue to experience air quality issues.
Local, statewide, and national mobility would have continued
to be negatively impacted without additional revenue
to protect, maintain, and improve critical transportation
networks. The region’s economy and quality of life depends
upon these additional investments.
The SJV Super-Region has identified infrastructure
investments throughout the region that are needed
to maintain and improve the existing system, and to
help alleviate serious safety, congestion, accessibility,
connectivity, mobility, and air quality issues. The region has
identified critical multi-modal infrastructure improvements
required to address regional mobility, connectivity, safety,
and maintenance/preservation needs of the existing
transportation system. Major projects in the SJV not
only benefit the largest concentration of disadvantaged
communities in the state, but neighboring regions as well.
Please see the project list in Appendix H, which includes
a summary list of some (but not nearly all) of the region’s
most urgent needs, as found in existing planning documents
including Regional Transportation Plans.
Prepared By
~ Fresno Council of Governments
~ Kern Council of Governments
~ Kings County Association of Governments
~ Merced County Association of Governments
~ Madera County Transportation Commission
~ San Joaquin Council of Governments
~ Stanislaus Council of Governments
~ Tulare County Association of Governments

41
SOUTHERN CALIFORNIA - CHAPTER 11
UNFUNDED TRANSPORTATION INVESTMENT PRIORITIES
SO
UT
HE
RN
CA
LI
FO
RN
IA
Chapter 11 – Southern California Imperial, Los Angeles, Orange, Riverside, San Bernardino, and Ventura Counties
INTRODUCTION
The Southern California Super-Region encompasses six
counties and 191 cities in an area covering more than 38,000
square miles. Being the largest super-region in the state in
terms of population, the region is currently home to 18.9
million people, (about 5.9 percent of the U.S. population
and 48.3 percent of California’s population) and features 5.9
million households and 7.4 million jobs. Southern California
is also the second-largest metropolitan area in the country
after the New York metropolitan area. If it were a state, this
region would rank fifth in the U.S. in terms of the size of its
population, just behind New York and ahead of Illinois.
Over the past few decades, Southern California has been
experiencing significant demographic changes and this
trend is expected to continue well into the future. By 2040,
the region’s population is expected to grow by more than
20 percent to 22 million people—an increase of 3.8 million
people. The median age of the region’s overall population
is projected to rise as it approaches the middle of the
century. As the Baby Boomer generation continues to age,
the region will experience a significant increase in its senior
population—a trend expected nationwide. A key challenge
for the region will be to help seniors maintain their
independence in their homes and communities.
In the coming years, Millennials, born between 1980 and
2000, will have an increasingly greater impact on how and
where we live and how we travel. Millennials represent 22.4
percent of the region’s total population and rely less on
automobiles than previous generations; they are less apt to
acquire drivers’ licenses, drive fewer miles, and conduct fewer
overall trips. Research also shows that Millennials often
prefer to live in denser, mixed-use urban areas well served by
transit, rather than decentralized suburban areas. Millennials
also are more likely than other groups to embrace a range
of mobility options, including shared cars, biking, transit, and
walking. These evolving preferences for transportation and
housing are significant because Millennials will account
for a large part of Southern California’s overall population
in 2040. In the near term, their housing and transportation
preferences, when combined with the need of Baby Boomers
to maintain their independence, could significantly change
how the region develops.
Maintaining and enhancing a transportation system that
can tackle these, and all of the region’s challenges, will
require adequate funding secured through SB 1. The overall
transportation system is aging rapidly and deteriorating.
Deferring maintenance because of a lack of funding would
have continued to strain the system. As the region’s economy
grows, freight traffic will increase on the roadways, along
rail lines, and at the airports and seaports. This will place
new demands on general transportation infrastructure such
as highways and surface streets, as well as infrastructure
specific to international trade and domestic commerce. This growth in goods movement also will contribute to air
pollution, making it harder for the region to attain federal
standards for air quality and comply with new state rules for
lowering greenhouse gas emissions. Therefore, in light of
demographic shifts and changes in travel preferences, it is
essential that the region maintain and develop a sustainable
multi-modal transportation system for the years to come.
The passage of SB 1 will enable the region to address these
critical needs.
Existing Conditions Highways, Local Roads, and Bridges
The Southern California region’s highways and arterial
roadways continue to be the backbone of its overall
transportation network, and they are vital to moving people
and goods throughout the region. Across the Southern
California Super-Region, the highway and arterial system
covers about 70,000 roadway lane miles and accommodates
66 million trips per day. Its roadways are not only used by
automobiles and freight trucks, they are also used for transit
and by those who choose to walk, bike and use other forms
of active transportation. According to the Southern California
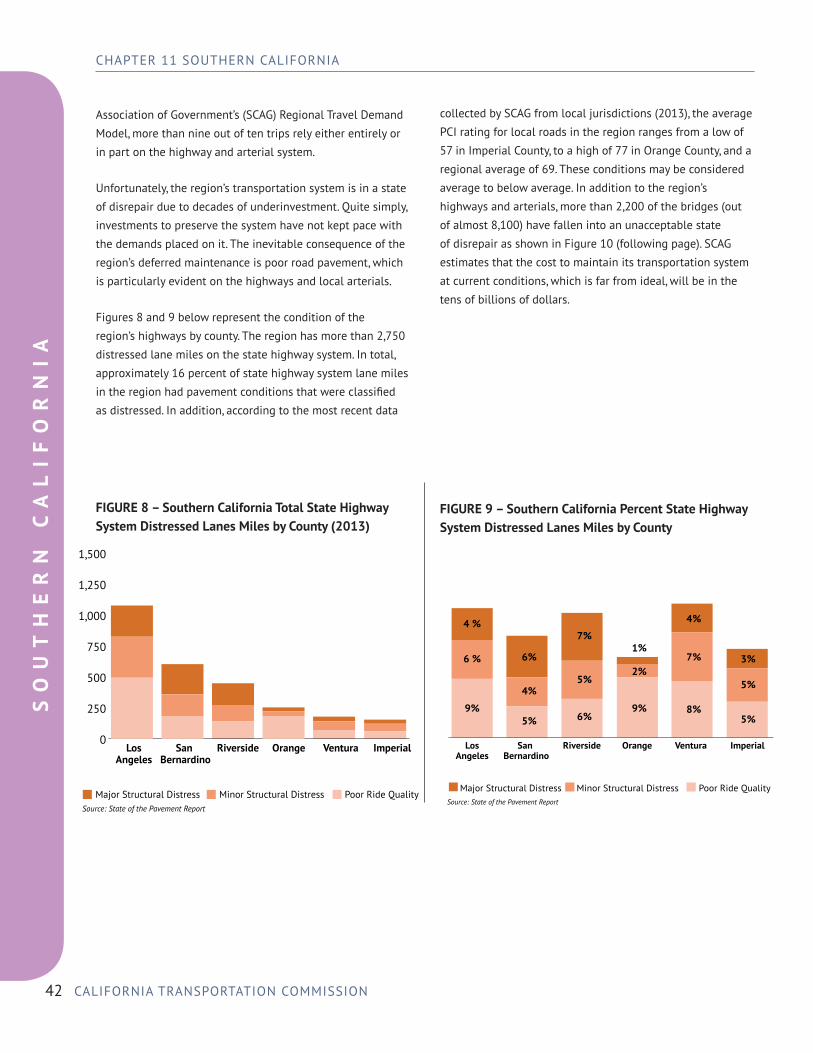
42 CALIFORNIA TRANSPORTATION COMMISSION
CHAPTER 11 SOUTHERN CALIFORNIAS
OU
TH
ER
N C
AL
IF
OR
NI
A
Association of Government’s (SCAG) Regional Travel Demand
Model, more than nine out of ten trips rely either entirely or
in part on the highway and arterial system.
Unfortunately, the region’s transportation system is in a state
of disrepair due to decades of underinvestment. Quite simply,
investments to preserve the system have not kept pace with
the demands placed on it. The inevitable consequence of the
region’s deferred maintenance is poor road pavement, which
is particularly evident on the highways and local arterials.
Figures 8 and 9 below represent the condition of the
region’s highways by county. The region has more than 2,750
distressed lane miles on the state highway system. In total,
approximately 16 percent of state highway system lane miles
in the region had pavement conditions that were classified
as distressed. In addition, according to the most recent data
FIGURE 8 – Southern California Total State Highway System Distressed Lanes Miles by County (2013)
1,500
1,250
1,000
750
500
250
0 Los San Riverside Orange Ventura Imperial
Angeles Bernardino
Major Structural Distress Minor Structural Distress Poor Ride Quality Source: State of the Pavement Report
collected by SCAG from local jurisdictions (2013), the average
PCI rating for local roads in the region ranges from a low of
57 in Imperial County, to a high of 77 in Orange County, and a
regional average of 69. These conditions may be considered
average to below average. In addition to the region’s
highways and arterials, more than 2,200 of the bridges (out
of almost 8,100) have fallen into an unacceptable state
of disrepair as shown in Figure 10 (following page). SCAG
estimates that the cost to maintain its transportation system
at current conditions, which is far from ideal, will be in the
tens of billions of dollars.
FIGURE 9 – Southern California Percent State Highway System Distressed Lanes Miles by County
4 %
6 %
9%
6%
4%
7%
8%
7%
5%
6%
4%
5%
1%
2%
9%
3%
5%
5%
Los San Riverside Orange Ventura Imperial Angeles Bernardino
Major Structural Distress Minor Structural Distress Poor Ride Quality Source: State of the Pavement Report

43
SOUTHERN CALIFORNIA - CHAPTER 11
UNFUNDED TRANSPORTATION INVESTMENT PRIORITIES
SO
UT
HE
RN
CA
LI
FO
RN
IA
FIGURE 10 – Southern California Bridge Conditions by County
10000
9000
8000
7000
6000
5000
4000
3000
2000
1000
0 Imperial Los Orange Riverside San Ventura SCAG
Angeles Bernardino Region
Non-Deficient Deficient*
*Non-Deficient - to be considered structurally non-deficient a bridge must meet a sufficiency rating of 80 or more. *Deficient - to be considered structurally non-deficient a bridge must meet a sufficiency rating of 80 or less. Source: Federal Highway Administration
Transit
Along with the region’s highways, local arterials, and bridges,
public transportation in the United States has also faced
long-term maintenance funding challenges. The US DOT’s
2010 “Status of the Nation’s Highways, Bridges and Transit:
Conditions and Performance Report to Congress” forecasted
a national transit maintenance shortfall of $116.5 billion
by 2028, with the share of assets in a maintenance backlog
increasing from 11.7 percent to 17.5 percent by 2028. Within
the next 40 years the strains of global climate change
including the potential ramifications of changes in storm
activity, sea levels, temperature and precipitation patterns
will create additional stresses on transit assets and services.
Providers of public transportation will need to develop
strategies to protect key assets and services from added wear
induced by climate.
A special area of focus within the region is demand response
transportation, which consists of the Americans with
Disabilities Act (ADA) mandated paratransit and local dial-a-
ride programs. One of the key findings of the 2016 Regional
Transportation Plan/Sustainable Communities Strategy (RTP/
SCS) was that demand response average trip length has
roughly doubled since the passage of the ADA. As the Baby
Boomer generation ages, new funds and innovative ways for
providing mobility to those who cannot drive will be required
to meet the increasing need for demand response transport
to a growing variety of destinations.
Active Transportation
Across the Southern California region today, many people
live and work in areas where trips are short enough to be
completed by walking or biking. Walking and biking as a
share of all trips is more than 18 percent in the most urban
areas where there are abundant nearby destinations/land
uses, yet still reaches 11 percent in rural areas where land
uses are less diverse. However, less than three percent of
transportation funding goes to active transportation. There is
a strong relationship between land use and travel behavior.
Land use characteristics play a key role in determining the
conditions for and feasibility of walking and biking in a
community, due to the sensitivity of these modes to trip
length.
44 CALIFORNIA TRANSPORTATION COMMISSION
CHAPTER 11 SOUTHERN CALIFORNIAS
OU
TH
ER
N C
AL
IF
OR
NI
A
The regional bike network within the Southern California
Super-Region is expanding, but remains fragmented. Nearly
500 additional miles of bikeways were built since SCAG’s
2012 RTP/SCS, but only 3,919 miles of bikeways exist region-
wide, of which 2,888 miles are bike paths/lanes. The lack of
connectivity acts as a barrier to increased bicycling for longer
trips, such as commuting.
Walking represents nearly 17 percent of all trips in the region,
with the largest share in Los Angeles County. It is how most
transit riders reach their station. Most walk trips (83 percent)
are less than one half mile; walkers are less likely to travel
further due to a lack of pedestrian friendly infrastructure.
Routes to stops and stations are often circuitous, obstructed,
or dilapidated, increasing the time it takes to complete a trip
by transit and therefore making the choice to use transit less
attractive. A study in Los Angeles County found that the most
common barriers to station access on foot or bicycle include:
• Long blocks.
• Highway over/underpasses.
• Concerns about safety and security, sidewalk maintenance.
• Legibility/lack of signage.
• Right-of-way constraints leading to limited space for safe walking and biking.
Currently, all six counties in the Southern California Super-
Region are pursuing first/last mile solutions to make transit
or border crossing stations more accommodating to active
transportation. Their efforts are aided by the Federal Transit
Administration (FTA), which has extended the “walk-shed”
(the area encircling a destination point) from transit stations
from a quarter mile to a half mile, enabling transit funding
to be used for larger areas around transit stations. The “bike-
shed,” as defined through FTA guidance, extends three miles
in all directions from a station.
Our Priority: System Preservation Moving forward, the region needs to continue to “Fix-it-First”
as a top priority— that is, focusing the necessary funds on preserving the existing transportation network while strategic
investments are made in system expansions. Failure to
adequately invest in the preservation of its roads, highways,
bridges, railways, bicycle and pedestrian facilities, and transit
infrastructure would have only lead to further deterioration,
which has the potential to worsen the region’s congestion
challenges. In addition, potholes and other imperfections in
the roadway come with real costs to motorists, estimated
by one study at more than $700 per driver each year. The
region’s transportation system represents billions of dollars of
investments that must be protected in order to serve current
and future generations. The loss of even a small fraction
of these assets could significantly compromise the region’s overall mobility.
Preservation of the region’s transit system, for example,
is more important than ever as Baby Boomers, one of the
fastest growing groups requiring transportation services,
age. The region needs to plan for this projected increase in
seniors with increased funding for transit and paratransit
operations and maintenance. Preserving infrastructure in a
manner that encourages walking and biking is also important
for maintaining mobility for those unable to or uninterested
in driving. It is also a cost-effective way to increase the
number of roadway users without increasing roadway
congestion.
Levels of Congestion
Maintaining the operational efficiency of the region’s
roadways is crucial if Southern California is to maintain
the mobility of it’s region. Unfortunately, traffic congestion
continues to adversely affect the highway and arterial
system every day. Based on SCAG’s Regional Travel Demand
Model, total-hours of delay within the region amounted to
3.6 million hours. Daily delay per capita amounted to 11.8
minutes and is expected to grow considerably, particularly in
the Inland Empire counties of Riverside and San Bernardino.
Estimates of the cost of congestion exceed $1,700 per driver
per year and result in the loss of over two work weeks a year
stuck in traffic. Traffic delays also inhibit job growth. Analysis
of Los Angeles metropolitan area employment growth
between 1990 and 2003 indicates that if additional mobility
improvement had been made to reduce congestion by 50
percent, job growth would have increased over 120 percent
of actual levels.
The efficient movement of goods in and out of the region, which is essential to the region’s economy, has also
experienced setbacks. Daily heavy duty truck delay on
highways and local arterials amounted to 193,000 hours of

45
SOUTHERN CALIFORNIA - CHAPTER 11
UNFUNDED TRANSPORTATION INVESTMENT PRIORITIES
SO
UT
HE
RN
CA
LI
FO
RN
IA
delay. The region is home to three of the top 50 worst truck
bottlenecks in the nation, which collectively cost the trucking
industry nearly $50 billion a year.
Recurring and non-recurring congestion continues to plague
the region’s roadways. Figure 11 shows the percentage of
highway congestion during a typical day (5:00 AM through
8:00 PM) during that year. The data is reported for each
county and for the region as a whole. In 2011, the estimated
average percentage of congestion that was due to collisions
or other incidents was about 48 percent. San Bernardino
County had less recurrent delay and is therefore more
susceptible to incident-causing congestion. The Performance
Measurement System indicates that up to 78 percent of all
congestion may be non-recurrent in the county. With that
said, the actual percentage may be exaggerated due to the
manner in which this system handles some data. In the more
urbanized Los Angeles County, the data reported that 44
percent of county-wide congestion was non-recurrent.
Although Southern California has made improvements in
recent years, the increasing travel demands that will come
with a growing population in coming years will lead to
increased congestion. This traffic congestion will not only make life difficult for commuters, it will also degrade the
region’s air quality and our overall quality of life. In addition,
an imbalance or mismatch between employment and
housing in a community is considered to be a key contributor
to local traffic congestion.
Providing jobs in areas where people live means less time
people spend driving resulting in less congestion. To address
congestion and to improve the transportation network’s
efficiency, the region has been investing in Transportation
Systems Management and Transportation Demand
Management projects. Still, more work is needed.
FIGURE 11 – Southern California Percent Non-Recurrent Congestion by County (2011)
78% 78%
44% 48%
59%
48%
Los Orange Riverside San Ventura Regional Angeles Bernardino Average

46 CALIFORNIA TRANSPORTATION COMMISSION
CHAPTER 11 SOUTHERN CALIFORNIAS
OU
TH
ER
N C
AL
IF
OR
NI
A
Funding
Prior to the passage of SB 1, the region’s most critical
challenge was securing funds for a transportation system
that promotes a more sustainable future. The cost of a multi-
modal transportation system that will serve the region’s
projected growth in population, employment, and demand
for travel surpasses the projected revenues expected from
the gas tax—our historic source of transportation funding. The purchasing power of the state’s gas tax revenues was
decreasing, continuing on a downward trajectory as tax rates (both state and federal) had not been adjusted in
more than two decades while transportation costs escalate,
fuel efficiency improves and the number of alternative-fuel
vehicles continues to grow. SB 1 addresses a critical need
to these shortcomings by incorporating an adjustment for
inflation in the state’s excise fuel tax.
Over the next ten years, a total of $68.9 billion (Figure 12) is
needed for system preservation and maintenance to bring the
Southern California region’s transit, passenger rail, regionally
significant local streets and roads, and the state highway system to a state of good repair. The gap between needs and
existing funding for the state highway system through 2026
is estimated at $10.2 billion. The cost to bring regionally
significant local streets and roads to a state of good repair is
estimated at $11.9 billion with a funding gap of $8.9 billion.
Public transportation in the region faces similar shortfalls
with an investment need of $46.8 billion over the next ten
years to achieve a state of good repair.
Looking beyond the region’s system preservation and
maintenance needs, capital improvements on the state
highways, local arterials, and transit system are also
critical in order to maximize the transportation network’s
operational efficiencies, and improve its overall connectivity and accessibility. These capital improvements include
everything from highway lane additions, railroad grade
separations, and replacement bridges to bicycle lanes and
new transit hubs. Based on SCAG’s 2016 RTP/SCS over the
next ten years, the total unmet need for the implementation
of capital improvements throughout the region amounts to
approximately $22.4 billion (year of expenditure). As shown
in Figure 13 (following page), total transit capital amounts
to approximately $6.8 billion (year of expenditure). The
unmet need for highway and arterial capital improvements is
similar, amounting to $6.7 billion. The unmet need for goods
movement improvements (e.g., grade separations) amounts
to approximately $8.1 billion (year of expenditure). Finally,
the unmet need for active transportation improvements
totals nearly a billion, $0.8 billion (year of expenditure). SB 1
will provide reliable, dedicated funding to the region that will
address many of these previously unfunded needs.
The total unmet need for the Southern California region,
including operations and maintenance and capital
improvements, amounts to approximately $91.3 billion
over the next 10 years. By failing to adequately invest in its
transportation assets in the near term, the current state of
the region’s transportation system would have been further
compromised.
FIGURE 12 – Southern California Multi-Modal System Preservation and Maintenance Needs (2016 -2026) in Billions
$68.9 $70.0
$60.0
$50.0
$40.0
$30.0
$20.0
$10.0
$0.0
$11.9 $10.2
$46.8
Transit/Passenger Rail Regionally Significant State Highways Total Local Streets & Roads

47
SOUTHERN CALIFORNIA - CHAPTER 11
UNFUNDED TRANSPORTATION INVESTMENT PRIORITIES
SO
UT
HE
RN
CA
LI
FO
RN
IA
FIGURE 13 – Southern California Capital Improvement Unmet Needs
(2016 -2026) in Billions $25.0
$20.0
$15.0
$10.0
$5.0
$6.7 $6.8
$0.0 Highways and
Arterials Transit/Passenger
Rail
To backfill limited state and federal gas tax funding, the
region had continued to rely on local revenues to meet
transportation needs. Prior to the passage of SB 1, 71
percent of the region’s existing transportation revenue
sources were local. Eight sales tax measures have been
adopted throughout the region since the 1980s, so the
burden of raising tax dollars had shifted significantly to local
agencies. The region needed a stronger state and federal
commitment to raising tax dollars for the Southern California
transportation system—its prominence and importance to
the state and national economy, particularly when it comes to
the movement of goods. The region’s transportation system
should be able to rely on more consistent tax revenues raised
at all levels of government. SB 1 enables the state meet this
commitment.
The federal government enacted the FAST Act in 2015,
providing the first quasi long-term federal transportation
authorization in a decade. Unfortunately, the Act did not
increase funding significantly over current levels. Prior to
SB 1, the state continued to struggle with stabilizing its
transportation revenue, which led to a $754 million reduction
in the STIP by the California Transportation Commission in
$0.8
$22.4
$8.1
Active Goods Movement Total Transportation
early 2016, attributed to the dramatic decline in anticipated
fuel excise tax revenue. Such a reduction significantly impacted the region’s ability to deliver projects over the next
several years.
To illustrate the impact at a specific project level, the funding
package for the I-10 Express Lane project in San Bernardino
County relies on a combination of local, state, and federal
funds, including a federal Transportation Infrastructure
Finance and Innovation Act (TIFIA) loan. The unfunded
project costs at present includes the TIFIA loan, which the
San Bernardino County Transportation Authority (SBCTA)
expects to receive, but has not been fully committed. Prior
to SB 1, the remaining funding gap was approximately
$90 million, a portion of which came about from the STIP
reduction. Filling the other portion would have required
a long term loan of Measure I (local sales tax measure
dedicated for transportation funding) that is committed to
other parts of the freeway program. The I-10 funding strategy
has changed several times in recent years to adjust for the
uncertainties at the state and federal level. Reliable funding
at the state level from SB 1 will stabilize the funding picture
for this and other important projects.

48 CALIFORNIA TRANSPORTATION COMMISSION
CHAPTER 11 SOUTHERN CALIFORNIAS
OU
TH
ER
N C
AL
IF
OR
NI
A
expenditures for widespread major roadway rehabilitation CONSEQUENCES OF THE and reconstruction projects. In addition, roadways with poor PRIOR FUNDING SHORTFALL pavement are unsafe for bicyclists and motorists as they must
Effect on Maintenance and Operation of Transportation Systems, Including Transit As previously mentioned, system preservation continues to
be a challenge for the region’s highways and local arterials.
Part of the challenge is ensuring that life cycle costs (i.e.,
maintenance and preservation expenses) are considered
and planned for when infrastructure projects are being
developed. Because roadway infrastructure represents
hundreds of billions in investments, it is important that
these assets are preserved and maintained. Making sure
previous investments will continue to serve future residents
is a priority for SCAG and its partner agencies. Without
the additional investments from SB 1 for preservation,
pavement conditions on the local roads would have
significantly deteriorated by 2026 to a regional average PCI
rating of below 58, which would have required substantial
swerve to avoid potholes. Lack of safe infrastructure also acts
as a barrier against bicycling and walking.
The rate of deterioration of the region’s roadways and
other assets was expected to accelerate significantly if
maintenance continued to be deferred. As shown in Figure
14, with respect to roadways, deferred maintenance leads to
much costlier repairs in the future. Minor repairs to keep our
roadways in a state of good repair cost on average $106,000
per highway lane mile, while major rehabilitation of a lane
mile can cost an average of $842,000. As maintenance is
deferred, the cost of bringing these assets back to a state of
good repair grows exponentially.
FIGURE 14 – Cost Effectiveness of Pavement Treatment
Good Roadway: Patching, thin overlays
($106,000 / Lane Mile)
Roadway: Thicker overlays ($309,000 / Lane Mile)
Roadway: Major Rehabilitation ($842,000 / Lane Mile)
Time
Pave
men
t Con
ditio
n
Surface Damage 4-7 Years
Minor Damage 5-10 Years
Major Damage 20+ Years
Failed

49
SOUTHERN CALIFORNIA - CHAPTER 11
UNFUNDED TRANSPORTATION INVESTMENT PRIORITIES
SO
UT
HE
RN
CA
LI
FO
RN
IA
Effect of Neglected Infrastructure on the Economy The health of Southern California’s economy depends on the
well-being of businesses and households, and a strong and
efficient regional transportation system can go a long way in helping businesses and households succeed. An efficient
transportation system can lead to an increase in productivity,
personal, income and ultimately public tax revenues.
Businesses depend on a reliable transportation network to
distribute products and services that reach their customers
at a reasonable cost. Households depend on an integrated,
accessible, and dependable transportation network to provide
reliable access to education, jobs, shopping, and recreational
activities. A sustainable, time-efficient, and cost-effective
transportation system can help neighborhood businesses
compete more effectively with those in neighboring
jurisdictions. Relieving congestion contributes greatly to
future employment growth. For the region to remain a
competitor in the global economy, it must continue to invest
strategically in transportation infrastructure, while ensuring
that it obtains the maximum return on those investments.
When investments are made in the transportation system, the
economic benefits go far beyond the jobs created building, operating and maintaining it. Unlike spending to satisfy
current needs, infrastructure delivers benefits for decades. The infrastructure, once built, can enhance the economic
competitiveness of a region. Projects that reduce congestion may help firms produce at lower cost, or allow those firms to reach larger markets or reach larger pools of qualified employees to draw from. An economy with a well-functioning transportation
system is a more attractive place for firms to do business, enhancing the economic competitiveness of the region.
In addition, traffic congestion has been increasing in nearly all U.S. metropolitan areas. Research shows that traffic delays inhibit job growth. In the Los Angeles metropolitan
area, actual employment growth from 1990 to 2003 was
567,983 new jobs, but researchers have estimated that
with a 50 percent reduction in congestion in the region’s
metropolitan areas, employment growth from 1990 to 2003
would have been 700,235 new jobs. Research suggests that
the employment enhancing effect of reducing congestion
in more congested urban areas is larger. The “distance
shrinking” effect of managing congestion is more important
in more congested urban areas. This is also a non-linear
effect because congestion relief grows more important for
the economy as congestion levels rise.
WHERE ADDITIONAL FUNDING FROM SB 1 COULD BE
SPENT AND KEY BENEFITS
The passage of SB 1 is critical to address the Southern
California region’s long- term needs, as it makes
transportation funding more sustainable. Such funds will
be leveraged against local funds going towards the backlog
of projects to preserve the existing transportation system. Several counties in the SCAG region have transportation sales
tax measures, such as the recently adopted Measure M in
Los Angeles, which have or will help them deliver important
multi-modal projects. Without funding provided by SB 1, these measures are not sufficient to meet the needs of the region.
SCAG, in close coordination with the six county transportation
commissions, has identified near term projects that can
be implemented within the next 10 years that can now be
funded with the passage of SB 1. The projects referenced in
Appendix I were mainly derived from the adopted SCAG 2016
RTP/SCS with additional input from the county transportation
commissions and is by no means an exhaustive list, nor
presented as the highest regional priorities, but merely a
sample of major improvements that can be implemented
should additional funding become available. Projects include
state highway improvements, local arterial improvements,
railroad grade separations, bikeways, new transit hubs, and
replacement bridges.
Maintenance and Operations Managing the operation and maintenance of the region’s
multi-modal transportation network is crucial considering
that projected population growth will only lead to increased
network demand. System preservation investments
implemented in the near term are the region’s first priority to ensure its assets maintain a state of good repair. In
collaboration with the region’s six county transportation
commissions, the improvements listed in Appendix I
are illustrative of critical operations and maintenance
improvements that could be implemented.

50 CALIFORNIA TRANSPORTATION COMMISSION
CHAPTER 11 SOUTHERN CALIFORNIAS
OU
TH
ER
N C
AL
IF
OR
NI
A
Completing Our System Closing critical gaps within the region’s existing network
not only improves access, but is essential to creating an
integrated and seamless network. The reconstruction and/
or reconfiguration of existing roadways is also needed
to increase efficiency and address travel demand. In
collaboration with the region’s six county transportation
commissions, the improvements listed in Appendix I are
illustrative of critical state highway, local arterial, and transit
and passenger rail projects that could be implemented in the
near term (10 years).
Goods Movement Southern California’s freight transportation system is
integral to regional and national economic growth. As
the unparalleled gateway to the nation, the Ports of Los
Angeles and Long Beach are the dominant port of entry for
Pacific Rim trade with the U.S., and demand at these ports
is expected to more than double by 2035. Growth in cargo
volumes will exacerbate existing challenges at marine
terminals, intermodal rail facilities, and further constrain
local highways, particularly along the southern part of the
I-710 corridor.
As demand for warehousing and distribution facilities
move farther inland, traffic on regional east-west corridors
is also expected to increase considerably, serving a mix
of international and domestic trade markets. Additionally
rail volumes will increase, tripling along certain segments
of the mainline rail network, impacting passenger rail
service and increasing grade crossing delays. Although
Southern California continues to be the nation’s epicenter
for distribution and logistics activities, severely congested
highways and rail corridors are a barrier to keeping goods
moving and the economy growing. Additionally, public
health is at risk as regional freight activities are a major
source of air pollution. While Southern California has made
great strides in building infrastructure, deploying clean
technologies and planning for the future through self-help
tax measures, numerous critical projects in the region are
urgently needed, as identified in Appendix I.
Active Transportation Active transportation (walking and bicycling) is an essential
part of the regional transportation system. Nearly everyone
is a pedestrian at some point during the day. Bicycling can
dramatically increase the mobility for those opting not
to drive or those entirely without motor vehicles. Active
transportation is low cost, does not emit greenhouse gases,
can help reduce roadway congestion, and can expand
transit ridership. Based on input from the region’s county
transportation commissions, the active transportation
improvements in Appendix I could be implemented in the
near term (10 years).
Technology Technological advancements in the form of communications
can lead to a more efficient transportation system and can
improve the deployment of various intelligent transportation
system (ITS) strategies. An example of an ITS strategy is real
time traveler information. By leveraging technology system
strategies, users can make more efficient transportation
choices, which help public agencies manage the multi-
modal transportation system more efficiently. Based on
input from the region’s county transportation commissions,
the technological improvements in Appendix I could be
implemented in the near term (10 years) and would allow for
a more efficient transportation network.

51
SOUTHERN CALIFORNIA - CHAPTER 11
UNFUNDED TRANSPORTATION INVESTMENT PRIORITIES
SO
UT
HE
RN
CA
LI
FO
RN
IA
Key Benefits The implementation of the near term projects as identified
under Appendix I, in addition to other committed projects
currently underway, will result in a regional transportation
network that not only improves travel conditions and air
quality, but also promotes an equitable distribution of
benefits. Trips to work, schools and other key destinations
would also be quicker and more efficient. In addition, the
integration of multiple transportation modes would result in
increases in carpooling, demand for transit and use of active
transportation modes for trips during peak travel hours and
at other times. Key benefits that would be achieved include:
• An increase in the combined percentage of work trips made by walking and biking and public transit, with commensurate reduction in the share of commuters traveling by single occupant vehicle.
• An increase in the number of short trips taken by biking and walking, rather than by motor vehicle.
• A reduction in Vehicle Miles Traveled per capita and Vehicle Hours Traveled per capita (for automobiles and light/medium duty trucks) as a result of more location efficient land use patterns and improved transit service.
• An increase in daily transit travel, as a result of improved transit service and more transit-oriented development patterns.
• A reduction in delay per capita.
• A reduction in total heavy duty truck and freight delay.
• The creation of additional new jobs annually, due to the region’s increased competitiveness and improved economic performance that will result from congestion reduction and improvements in regional amenities.
• Safety improvements as a result of improved operations and maintenance.
• Improved state of good repair in addition to long term cost savings as a result of early system preservation investments on our highways, local roads, bridges, and transit network
A list of project needs can be found in Appendix I.
Prepared By
~ Imperial County Transportation Commission
~ Los Angeles County Metropolitan Transportation Authority
~ Orange County Transportation Authority
~ Riverside County Transportation Commission
~ San Bernardino County Transportation Authority
~ Southern California Association of Governments
~ Ventura County Transportation Commission
52 CALIFORNIA TRANSPORTATION COMMISSION
APPENDIXA
PP
EN
DI
X
APPENDIX OVERVIEW
The projects referenced in Appendices A – I were prepared by each super-region and the state (Caltrans) and are for illustrative purposes only.
Projects were mainly identified from project lists found in previously adopted documents such as Regional Transportation Plans (RTP), maintenance plans, transportation bond measures, and other documents. Additional input was provided from county transportation commissions, advocacy groups, and others.
Projects included in the RTPs must meet a variety of federal, state, and regional goals. Pursuant to SB 375 (Steinberg, Chapter 728, Statutes of 2008), RTPs in metropolitan regions must also include a Sustainable Communities Strategy (SCS) to demonstrate how the region will integrate land use and transportation to achieve greenhouse gas emissions reduction targets established by the California Air Resources Board (ARB). Therefore many transportation projects identified in this report by metropolitan regions are part of regional strategies to meet greenhouse gas emission reduction goals.
The projects identified in the following appendices do not represent an exhaustive list of needs, are not necessarily intended as the highest regional priorities, nor as projects that will be funded through the recently enacted transportation funding solution. The project listings are merely illustrative of needed major improvements that were unfunded before the passage of SB 1, as identified by each super-region. Identified needs fall into such categories as preservation, maintenance, capacity and operational projects and range from highway/ roadway, transit/passenger rail, active transportation, and more.

53
APPENDIX A - STATEWIDE
UNFUNDED TRANSPORTATION INVESTMENT PRIORITIES
AP
PE
ND
IX
A -
S
TA
TE
WI
DE
APPENDIX A – STATEWIDE PRIORITY PROJECTS
Statewide High Priority Interregional Highway Needs County Route High Priority Highway Project Title
Shasta I-5 Little Easy Northern - Anderson and Redding. Widen to 6 lanes. PM 6.2-11.7
Shasta I-5 Big Easy Middle - Anderson and Redding. PM 5.0-7.0
Shasta I-5 Big Easy Southern - Anderson and Redding. PM3.8-5.5
Kern SR 14 Freeman Gulch Widening - Segment 2
Lake SR 29 Lake 29 Expressway Segment 2a
Lake SR 29 Lake 29 Expressway Segment 2b
Lake SR 29 Lake 29 Expressway Segment 2c
Fresno SR 41 Excelsior Expressway, Widen to 4 Lanes
San Luis Obispo (SLO) SR 46 Wye, Convert to 4 Lane Expressway
SLO/Kern SR 46 Route 46 Corridor US 101 to I-5 ( Segment IV-b, Cholame, Antelope Grade)
Nevada SR 49 SR 49 Widening: La Bar Meadows Road to McKnight Way
San Bernardino SR 58 Kramer Junction - Phase 1
Butte SR 70 Passing Lanes, Cox-Palermo, Segment 2
Butte SR 70 Passing Lanes, Segment 1
Madera SR 99 Madera, Avenue 12-Avenue 17, Widen to 6 Lanes
Merced SR 99 Livingston 6 Lane Widening, Northbound
Merced SR 99 Livingston 6 Lane Widening, Southbound
Tulare SR 99 Tulare, 6 Lane Freeway, Prosperity Avenue Interchange-Avenue 200
Tulare SR 99 Tagus 6 lane Southbound Widening
Var. (6 & 10) SR 99 SR 99 widening to 6 Lane
Madera SR 99 South Madera 6 Lane (Ave 7 to Ave 12)
Marin/Sonoma US 101 MSN A4 - Extend SB HOV Lanes-Widen from 4 to 6 lanes
Humboldt US 101 Eureka / Arcata corridor
Santa Barbara 101 Carpenteria Creek-Sycamore Creek, Add HOV - Widen from 4 to 6 lanes
Merced SR 152 Los Banos Bypass, Segment 1
Monterey SR 156 4 Lane Expressway, Castroville-Prunedale
Inyo/Mono US 395 Olancha-Cartago 4 lane Expressway
San Bernardino US 395 US 395 Widening

54 CALIFORNIA TRANSPORTATION COMMISSION
APPENDIX A - STATEWIDEA
PP
EN
DI
X A
-
ST
AT
EW
ID
E
Intercity High Priority Passenger Rail Capital Projects Corridor Link
Miles Service Goals High Priority Passenger Rail Capital Projects
Sacramento to Roseville
19 20 trains a day, intercity service. Roseville Service Expansion
San Jose to Oakland 43 Up to hourly frequency. Shift passenger service to “Coast” route to reduce travel time; shift freight traffic to “Niles” route to allow conversion of Coast route to passenger focus; address capacity bottlenecks at Jack London Square / Port of Oakland and between Newark and San Jose
Richmond/Martinez to Stockton
90 6-8 Trains per day. • New single track or Conversion to double track: 2 Route-Miles At-Grade
• Right-of-Way Acquisition: 2 Route-Miles of Rural-Conversion of Single to Double Track
• Stations: Construction of two new stations
Salinas to Gilroy 38 Extend conventional rail service with bi-hourly frequencies.
• Conversion to double track for siding, 4 miles total • Stations: Upgrades to 3 stations • Additional layover facility
Goleta to Salinas 230 1 round trip: Salinas & Goleta, SLO to Salinas/San Jose and SLO-Goleta.
Implement four-hour service potentially by extending either Bay Area or LOSSAN North service as a through train and extending additional runs beyond Goleta.
Merced to Sacramento
119 Regional rail service at 60 minute intervals.
Chatsworth to Burbank
18.8 Implement bi-hourly intercity express service (Goleta to Los Angeles); (Chatsworth to Los Angeles).
• Guideway Improvements: Construction of 2 HSR tracks and additional platforms at ARTIC
• Right-of-Way Acquisition: Refer to HSR document • Stations: Refer to HSR document • Other Improvements: Thru tracks, and additional
platforms at ARTIC
LA to Anaheim via Fullerton (Amtrak & Metrolink)
27 Increase frequencies of services to half hourly/hourly (peak/off-peak); Implement blended HST Phase 1 service. Capacity enough for 36 trains a day.
• Guideway Improvements: Construction of 2 HSR tracks and additional platforms at ARTIC
• Right-of-Way Acquisition: Refer to HSR document • Stations: Refer to HSR document • Other Improvements: Thru tracks, and additional
platforms at ARTIC
Anaheim to Santa Ana
5 Regional rail service LA-LNL at 30 minute intervals.
• 5 miles of siding • 5 miles of signals
Santa Ana to Laguna Niguel
22.4 Increase frequencies of ICE and REG services to half hourly/ hourly.
22 miles of systems and communication
Oceanside to Escondido
22 Half hourly local service. Pedestrian connectivity improvements at Oceanside terminal
Oceanside to Sorrento Valley
24 Increase frequencies to hourly. Conversion to double track or New single track: 8 Route-Miles At-Grade, 1.8 Route-Miles Aerial, 3 Route-Miles Retained Cut or Fill • Stations: Carlsbad Station expansion from one to two
tracks, plus two sided platform development
Sorrento Valley to San Diego
17 Increase frequencies to hourly. Conversion to double track or New single track: 8 Route-Miles At-Grade, 1.8 Route-Miles Aerial, 3 Route-Miles Retained Cut or Fill • Stations: Carlsbad Station expansion from one to two
tracks, plus two sided platform development • Other Improvements: New maintenance facility one-
mile south from Santa Fe Depot
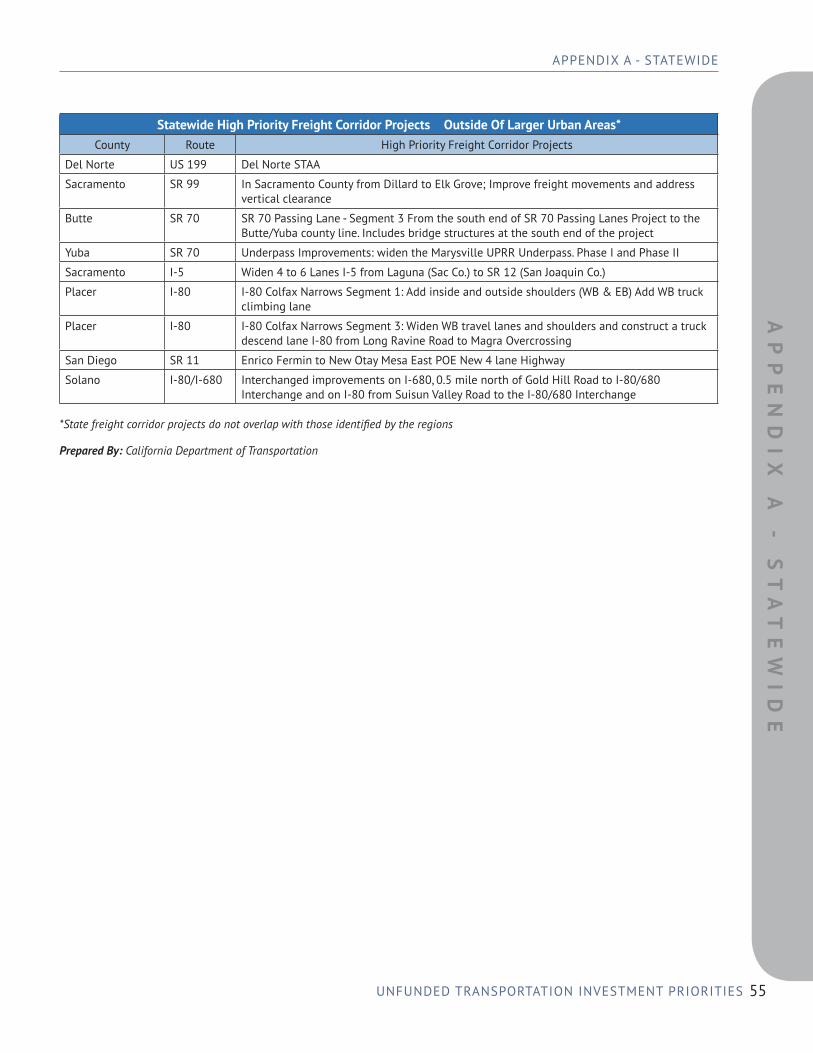
55
APPENDIX A - STATEWIDE
UNFUNDED TRANSPORTATION INVESTMENT PRIORITIES
AP
PE
ND
IX
A -
S
TA
TE
WI
DE
–Statewide High Priority Freight Corridor Projects Outside Of Larger Urban Areas* County Route High Priority Freight Corridor Projects
Del Norte US 199 Del Norte STAA
Sacramento SR 99 In Sacramento County from Dillard to Elk Grove; Improve freight movements and address vertical clearance
Butte SR 70 SR 70 Passing Lane - Segment 3 From the south end of SR 70 Passing Lanes Project to the Butte/Yuba county line. Includes bridge structures at the south end of the project
Yuba SR 70 Underpass Improvements: widen the Marysville UPRR Underpass. Phase I and Phase II
Sacramento I-5 Widen 4 to 6 Lanes I-5 from Laguna (Sac Co.) to SR 12 (San Joaquin Co.)
Placer I-80 I-80 Colfax Narrows Segment 1: Add inside and outside shoulders (WB & EB) Add WB truck climbing lane
Placer I-80 I-80 Colfax Narrows Segment 3: Widen WB travel lanes and shoulders and construct a truck descend lane I-80 from Long Ravine Road to Magra Overcrossing
San Diego SR 11 Enrico Fermin to New Otay Mesa East POE New 4 lane Highway
Solano I-80/I-680 Interchanged improvements on I-680, 0.5 mile north of Gold Hill Road to I-80/680 Interchange and on I-80 from Suisun Valley Road to the I-80/680 Interchange
*State freight corridor projects do not overlap with those identified by the regions
Prepared By: California Department of Transportation

56 CALIFORNIA TRANSPORTATION COMMISSION
APPENDIX B - CENTRAL COASTA
PP
EN
DI
X
B -
CE
NT
RA
L C
OA
ST
-
-
APPENDIX B – CENTRAL COAST SUPER-REGION PROJECTS
Central Coast Super-Region Transit/Passenger Rail Projects County Project
Monterey Salinas Rail Extension and Transit Capital Expansion. Provide a safe, healthy alternative to driving on US 101 by establishing new daily passenger rail service between Salinas and Sacramento. Service will extend Capitol Corridor trains, with new stations planned in Pajaro/Watsonville, Castroville and Salinas. Major stops in Gilroy, San Jose and Oakland will allow convenient transfers to Caltrain and BART service to San Francisco and nearby destinations.
San Benito San Benito County Transit Operations. Provide regional transit connections (service to Gilroy, Monterey and Santa Cruz counties), in addition to existing fixed route and paratransit services.
Santa Cruz Santa Cruz County Transit Operations. Provide additional funding for fixed route bus and paratransit service for Santa Cruz METRO.
San Luis Obispo San Luis Obispo County Transit Improvements. Construct central area transit transfer center and regional transit maintenance garage and dispatch center, increase express runs on US 101, procure higher-capacity buses, construct bus rapid transit stops, expand service along US 101 and SR 1 corridors, increase frequency and service coverage, expand paratransit and specialized services.
Santa Barbara Santa Barbara Cabrillo Underpass at Union Pacific Railroad Project. Improve operations and safety for pedestrians, bicycles and vehicles at the underpass of Cabrillo Blvd at the Union Pacific Railroad.
Santa Barbara Santa Barbara/Ventura Sea Cliff Siding. Lengthen the existing Seacliff siding to the current Class I railroad standard of 10,000 feet, which will expand capacity in the corridor and potentially allow for future expanded passenger service in the constrained Coast Route.
Santa Barbara Santa Barbara Commuter Rail from Ventura County. Provide new peak hour passenger rail service connecting west Ventura County to south Santa Barbara County. The new service will help reduce congestion on US 101 and provide commuters with an alternative to driving.
Central Coast Super-Region Non-Motorized Transportation County Project
Various Bicycle/Pedestrian projects Various Safe Routes to School projects Various Juan Bautista de Anza National Historic Trail
Various California Coastal Trail
Monterey Monterey County Fort Ord Recreation Trail and Greenway (FORTAG)
Santa Cruz Santa Cruz County Monterey Bay Sanctuary Scenic Trail Network (MBSST)
San Luis Obispo SR 227 and SR 41 West - Complete Street Improvements
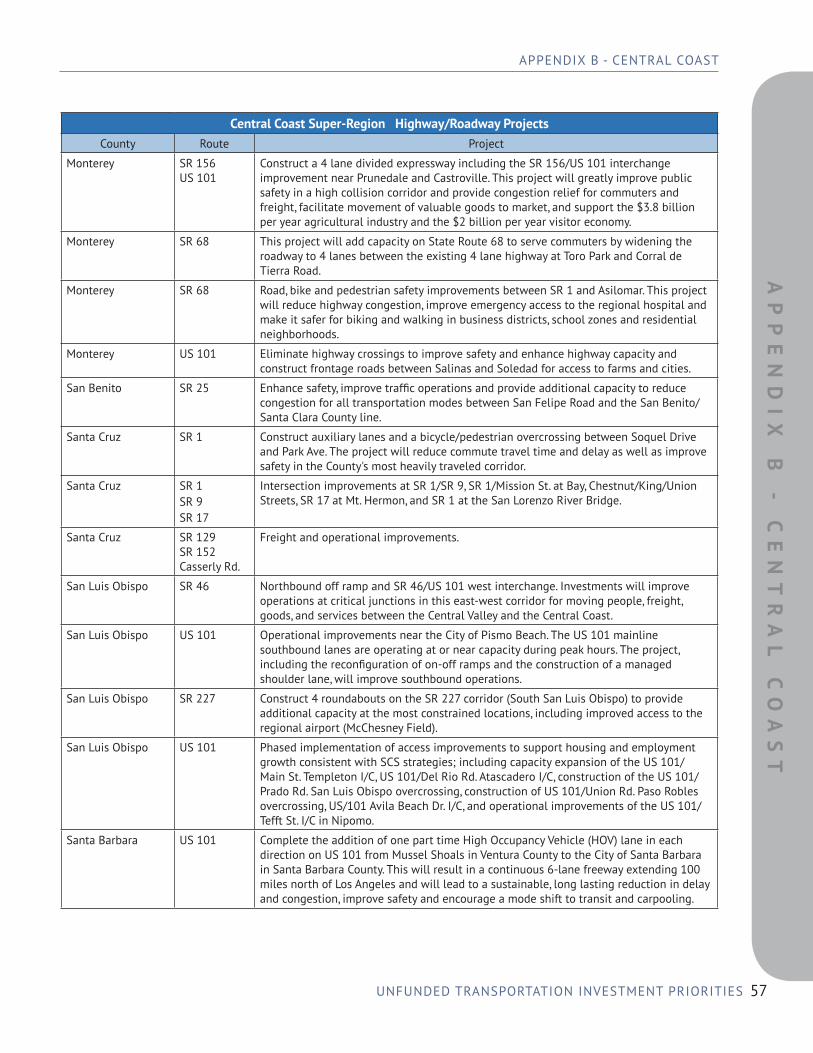
57
APPENDIX B - CENTRAL COAST
UNFUNDED TRANSPORTATION INVESTMENT PRIORITIES
AP
PE
ND
IX
B
- C
EN
TR
AL
CO
AS
T
-Central Coast Super-Region Highway/Roadway Projects County Route Project
Monterey SR 156 US 101
Construct a 4 lane divided expressway including the SR 156/US 101 interchange improvement near Prunedale and Castroville. This project will greatly improve public safety in a high collision corridor and provide congestion relief for commuters and freight, facilitate movement of valuable goods to market, and support the $3.8 billion per year agricultural industry and the $2 billion per year visitor economy.
Monterey SR 68 This project will add capacity on State Route 68 to serve commuters by widening the roadway to 4 lanes between the existing 4 lane highway at Toro Park and Corral de Tierra Road.
Monterey SR 68 Road, bike and pedestrian safety improvements between SR 1 and Asilomar. This project will reduce highway congestion, improve emergency access to the regional hospital and make it safer for biking and walking in business districts, school zones and residential neighborhoods.
Monterey US 101 Eliminate highway crossings to improve safety and enhance highway capacity and construct frontage roads between Salinas and Soledad for access to farms and cities.
San Benito SR 25 Enhance safety, improve traffic operations and provide additional capacity to reduce congestion for all transportation modes between San Felipe Road and the San Benito/ Santa Clara County line.
Santa Cruz SR 1 Construct auxiliary lanes and a bicycle/pedestrian overcrossing between Soquel Drive and Park Ave. The project will reduce commute travel time and delay as well as improve safety in the County's most heavily traveled corridor.
Santa Cruz SR 1 SR 9 SR 17
Intersection improvements at SR 1/SR 9, SR 1/Mission St. at Bay, Chestnut/King/Union Streets, SR 17 at Mt. Hermon, and SR 1 at the San Lorenzo River Bridge.
Santa Cruz SR 129 SR 152 Casserly Rd.
Freight and operational improvements.
San Luis Obispo SR 46 Northbound off ramp and SR 46/US 101 west interchange. Investments will improve operations at critical junctions in this east-west corridor for moving people, freight, goods, and services between the Central Valley and the Central Coast.
San Luis Obispo US 101 Operational improvements near the City of Pismo Beach. The US 101 mainline southbound lanes are operating at or near capacity during peak hours. The project, including the reconfiguration of on-off ramps and the construction of a managed shoulder lane, will improve southbound operations.
San Luis Obispo SR 227 Construct 4 roundabouts on the SR 227 corridor (South San Luis Obispo) to provide additional capacity at the most constrained locations, including improved access to the regional airport (McChesney Field).
San Luis Obispo US 101 Phased implementation of access improvements to support housing and employment growth consistent with SCS strategies; including capacity expansion of the US 101/ Main St. Templeton I/C, US 101/Del Rio Rd. Atascadero I/C, construction of the US 101/ Prado Rd. San Luis Obispo overcrossing, construction of US 101/Union Rd. Paso Robles overcrossing, US/101 Avila Beach Dr. I/C, and operational improvements of the US 101/ Tefft St. I/C in Nipomo.
Santa Barbara US 101 Complete the addition of one part time High Occupancy Vehicle (HOV) lane in each direction on US 101 from Mussel Shoals in Ventura County to the City of Santa Barbara in Santa Barbara County. This will result in a continuous 6-lane freeway extending 100 miles north of Los Angeles and will lead to a sustainable, long lasting reduction in delay and congestion, improve safety and encourage a mode shift to transit and carpooling.

58 CALIFORNIA TRANSPORTATION COMMISSION
APPENDIX B - CENTRAL COASTA
PP
EN
DI
X
B -
CE
NT
RA
L C
OA
ST
-
-
Central Coast Super-Region Highway/Roadway Projects (continued) County Route Project
Santa Barbara US 101 Santa Barbara US 101 San Ysidro Interchange. Improve operations at the intersection of San Ysidro Road, North Jameson Lane and the US 101 ramps.
Santa Barbara US 101 Santa Barbara US 101 Goleta Overpass Project. Improve traffic circulation in Goleta by constructing a new overpass of US 101.
Santa Barbara US 101 SR 135
Santa Barbara US 101 Goleta Overpass Project. Improve traffic circulation in Goleta by constructing a new overpass of US 101.
Santa Barbara US 101 Santa Maria US 101/McCoy Road Interchange. Connect McCoy Lane to US 101 through a new interchange to provide Santa Maria residents and businesses with improved access to the highway.
Santa Barbara US 101 State Route 246 Santa Ynez River Bridge. Improve access to Lompoc across the Santa Ynez River by providing a bridge raised above flood level with wider shoulders that safely accommodate vehicles, bicycles and pedestrians.
Santa Barbara SR 166 SR 166 Safety and Operational Improvements. Improve safety and operations on SR 166.
Central Coast Super-Region Other Projects County Project
Various Miscellaneous TDM/TSM Programs
Santa Cruz Santa Cruz County SR 17 Wildlife Habitat Connectivity
Prepared By:
The following organizations contributed to and are responsible for the contents of the Central Coast Super-Region chapter and appendix:
~ Association of Monterey Bay Area Governments
~ Transportation Agency for Monterey County
~ County of San Benito Council of Governments
~ Santa Cruz County Regional Transportation Commission
~ Santa Barbara County Association of Governments
~ San Luis Obispo Council of Governments
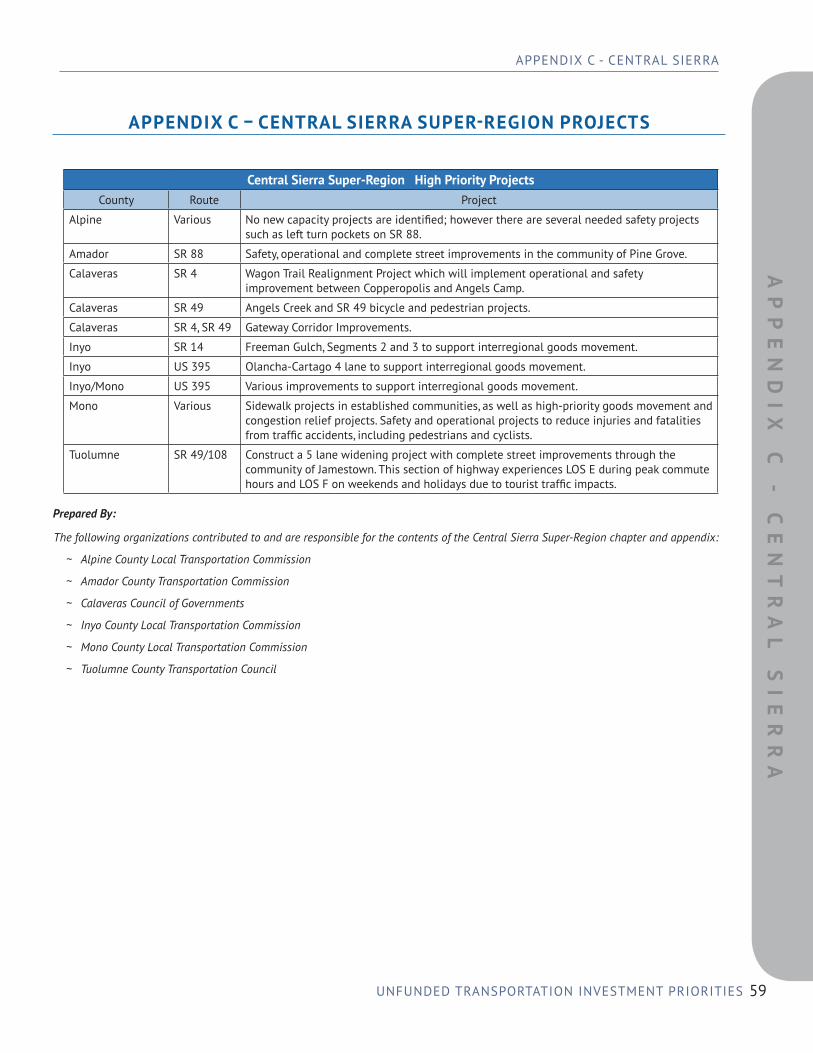
59
APPENDIX C - CENTRAL SIERRA
UNFUNDED TRANSPORTATION INVESTMENT PRIORITIES
AP
PE
ND
IX
C -
CE
NT
RA
L
SI
ER
RA
-
APPENDIX C – CENTRAL SIERRA SUPER-REGION PROJECTS
Central Sierra Super-Region High Priority Projects County Route Project
Alpine Various No new capacity projects are identified; however there are several needed safety projects such as left turn pockets on SR 88.
Amador SR 88 Safety, operational and complete street improvements in the community of Pine Grove.
Calaveras SR 4 Wagon Trail Realignment Project which will implement operational and safety improvement between Copperopolis and Angels Camp.
Calaveras SR 49 Angels Creek and SR 49 bicycle and pedestrian projects. Calaveras SR 4, SR 49 Gateway Corridor Improvements.
Inyo SR 14 Freeman Gulch, Segments 2 and 3 to support interregional goods movement.
Inyo US 395 Olancha-Cartago 4 lane to support interregional goods movement.
Inyo/Mono US 395 Various improvements to support interregional goods movement.
Mono Various Sidewalk projects in established communities, as well as high-priority goods movement and congestion relief projects. Safety and operational projects to reduce injuries and fatalities from traffic accidents, including pedestrians and cyclists.
Tuolumne SR 49/108 Construct a 5 lane widening project with complete street improvements through the community of Jamestown. This section of highway experiences LOS E during peak commute hours and LOS F on weekends and holidays due to tourist traffic impacts.
Prepared By:
The following organizations contributed to and are responsible for the contents of the Central Sierra Super-Region chapter and appendix:
~ Alpine County Local Transportation Commission
~ Amador County Transportation Commission
~ Calaveras Council of Governments
~ Inyo County Local Transportation Commission
~ Mono County Local Transportation Commission
~ Tuolumne County Transportation Council

60 CALIFORNIA TRANSPORTATION COMMISSION
APPENDIX D - NORTH STATEA
PP
EN
DI
X
D -
N
OR
TH
S
TA
TE
-
APPENDIX D – NORTH STATE SUPER-REGION PROJECTS
North State Super-Region High Priority Projects County Route Project
Lake SR 29 Lake 29 Expressway Project: Complete five more miles of expressway in two remaining segments to address critical congestion and safety concerns.
Shasta I-5 Replace the substandard UPRR/I-5 railroad grade separation that does not meet minimum vertical and horizontal safety clearances. Increase I-5 from 4 to 6 lanes, eliminating a bottleneck frequently congested by large trucks. The project will significantly improve the efficiency and reliability of both truck and rail access on I-5 and the Union Pacific Rail line.
Mendocino Windy Hollow Road
Construct a new bridge over the Garcia River, a location in which there has never been a permanent bridge.
Various North State Express Connect
Develop a brand new intercity transit express route that will form the backbone of an integrated rural transit network between Redding and Sacramento with feeder routes linking the counties of Shasta, Modoc, Siskiyou, Humboldt, Lassen, Butte, Trinity, Tehama, Glenn, Lake and Colusa. This transformative project will create new avenues of economic opportunity and mobility for the residents of the North State, who do not currently have access to timely and convenient public transportation to Sacramento. Riders will have access to Sacramento International Airport, Sacramento Regional Transit (Sac RT light rail) and the Sacramento Amtrak Station for connections to the Capital Corridor, Coast Starlight, San Joaquins and eventual California High Speed Rail lines.
Prepared By:
The following organizations contributed to and are responsible for the contents of the North State Super-Region chapter and appendix:
~ Del Norte Local Transportation Commission
~ Humboldt County Association of Governments
~ Lake County/City Area Planning Council
~ Mendocino Council of Governments
~ Modoc County Transportation Commission
~ Nevada County Transportation Commission
~ Shasta Regional Transportation Agency
~ Tehama County Transportation Commission
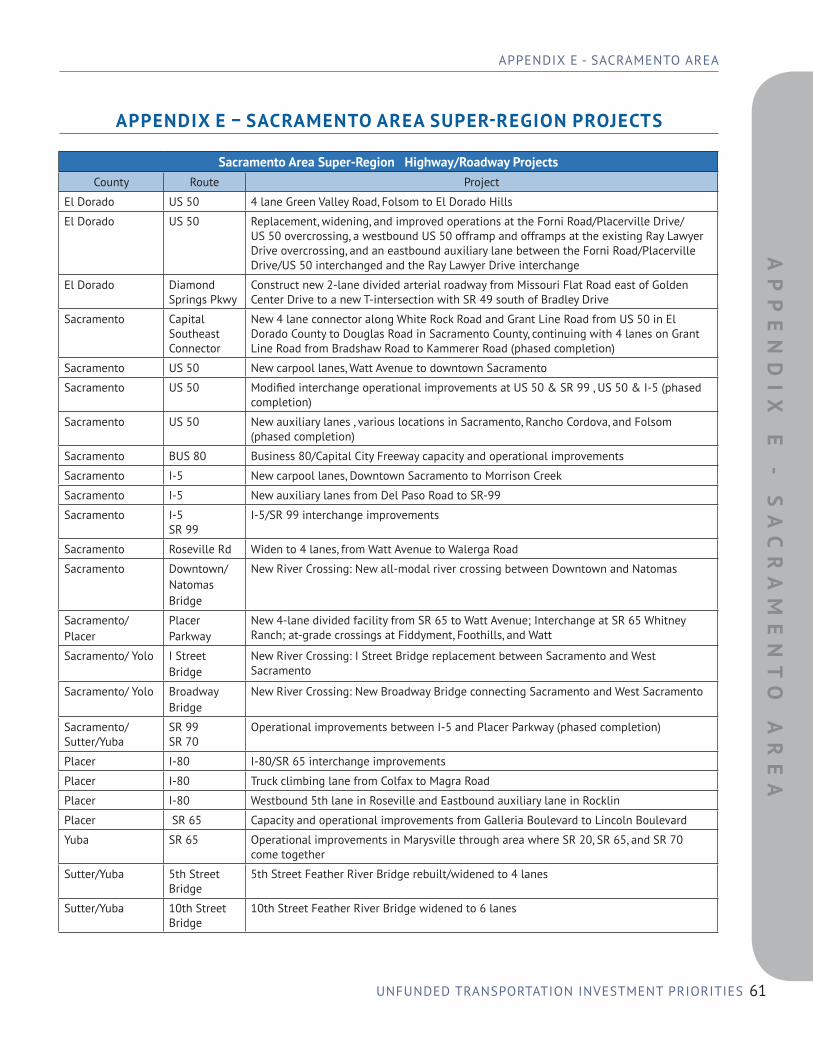
61
APPENDIX E - SACRAMENTO AREA
UNFUNDED TRANSPORTATION INVESTMENT PRIORITIES
AP
PE
ND
IX
E
-
SA
CR
AM
EN
TO
AR
EA
-
APPENDIX E – SACRAMENTO AREA SUPER-REGION PROJECTS
Sacramento Area Super-Region Highway/Roadway Projects County Route Project
El Dorado US 50 4 lane Green Valley Road, Folsom to El Dorado Hills
El Dorado US 50 Replacement, widening, and improved operations at the Forni Road/Placerville Drive/ US 50 overcrossing, a westbound US 50 offramp and offramps at the existing Ray Lawyer Drive overcrossing, and an eastbound auxiliary lane between the Forni Road/Placerville Drive/US 50 interchanged and the Ray Lawyer Drive interchange
El Dorado Diamond Springs Pkwy
Construct new 2-lane divided arterial roadway from Missouri Flat Road east of Golden Center Drive to a new T-intersection with SR 49 south of Bradley Drive
Sacramento Capital Southeast Connector
New 4 lane connector along White Rock Road and Grant Line Road from US 50 in El Dorado County to Douglas Road in Sacramento County, continuing with 4 lanes on Grant Line Road from Bradshaw Road to Kammerer Road (phased completion)
Sacramento US 50 New carpool lanes, Watt Avenue to downtown Sacramento
Sacramento US 50 Modified interchange operational improvements at US 50 & SR 99 , US 50 & I-5 (phased completion)
Sacramento US 50 New auxiliary lanes , various locations in Sacramento, Rancho Cordova, and Folsom (phased completion)
Sacramento BUS 80 Business 80/Capital City Freeway capacity and operational improvements
Sacramento I-5 New carpool lanes, Downtown Sacramento to Morrison Creek
Sacramento I-5 New auxiliary lanes from Del Paso Road to SR-99
Sacramento I-5 SR 99
I-5/SR 99 interchange improvements
Sacramento Roseville Rd Widen to 4 lanes, from Watt Avenue to Walerga Road
Sacramento Downtown/ Natomas Bridge
New River Crossing: New all-modal river crossing between Downtown and Natomas
Sacramento/ Placer
Placer Parkway
New 4-lane divided facility from SR 65 to Watt Avenue; Interchange at SR 65 Whitney Ranch; at-grade crossings at Fiddyment, Foothills, and Watt
Sacramento/ Yolo I Street Bridge
New River Crossing: I Street Bridge replacement between Sacramento and West Sacramento
Sacramento/ Yolo Broadway Bridge
New River Crossing: New Broadway Bridge connecting Sacramento and West Sacramento
Sacramento/ Sutter/Yuba
SR 99 SR 70
Operational improvements between I-5 and Placer Parkway (phased completion)
Placer I-80 I-80/SR 65 interchange improvements
Placer I-80 Truck climbing lane from Colfax to Magra Road
Placer I-80 Westbound 5th lane in Roseville and Eastbound auxiliary lane in Rocklin
Placer SR 65 Capacity and operational improvements from Galleria Boulevard to Lincoln Boulevard
Yuba SR 65 Operational improvements in Marysville through area where SR 20, SR 65, and SR 70 come together
Sutter/Yuba 5th Street Bridge
5th Street Feather River Bridge rebuilt/widened to 4 lanes
Sutter/Yuba 10th Street Bridge
10th Street Feather River Bridge widened to 6 lanes

62 CALIFORNIA TRANSPORTATION COMMISSION
APPENDIX E - SACRAMENTO AREAA
PP
EN
DI
X
E -
S
AC
RA
ME
NT
O A
RE
A
-
-
-
Sacramento Area Super-Region New Rail Projects County Project
Sacramento Green Line Light Rail to the Sacramento International Airport
Sacramento High-Speed Rail – Altamont connection from points south, terminating at Sacramento Valley Station
Placer/ Sacramento/ Yolo
Capitol Corridor connecting Placer County, Sacramento, and Yolo Counties to the Bay Area
Sacramento/ Yolo Downtown Sacramento to West Sacramento streetcar
Sacramento Area Super-Region New Transit Projects County Project
Various Local & Express Buses, Neighborhood Shuttles: Increase bus service with 15 minute or better service from roughly one quarter of all service in 2012 to about half of all services
Various Bus Rapid Transit: Nine BRT lines with 15-30 minute service connecting Roseville, eastern Sacramento County, Citrus Heights, northern Sacramento County, Natomas, Rancho Cordova, South Sacramento, Elk Grove, Downtown (phases completion)
Various Bus Rapid Transit: Various street and operational improvements coordinated with complete streets corridor enhancements to enhance bus transit (phased completion)
Sacramento Area Super-Region New Bicycle and Pedestrian Projects County Project
Various Bike Lanes, Complete Streets, and Recreational Trails: Bike Lanes, Complete Streets and Recreational Trails – Emphasis on complete streets connections within and between cities, areas of high pedestrian-scale development, and to transit and school facilities (phased completion)
Yolo New bike bridge across the Yolo Causeway
Prepared By:
The following organizations contributed to and are responsible for the contents of the Sacramento Area Super-Region chapter and appendix:
~ El Dorado County Transportation Commission
~ Placer County Transportation Planning Agency
~ Sacramento Area Council of Governments
~ California Department of Transportation District 3
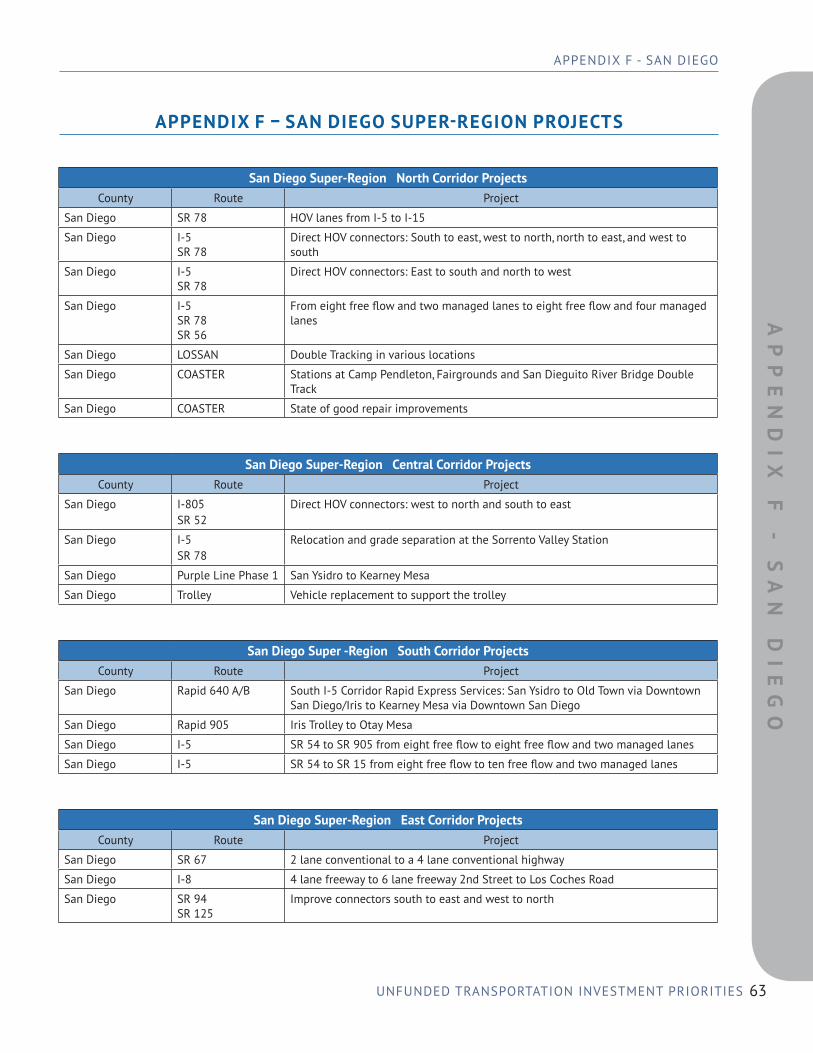
63
APPENDIX F - SAN DIEGO
UNFUNDED TRANSPORTATION INVESTMENT PRIORITIES
AP
PE
ND
IX
F
-
SA
N
DI
EG
O
-
-
-
-
APPENDIX F – SAN DIEGO SUPER-REGION PROJECTS
San Diego Super-Region North Corridor Projects County Route Project
San Diego SR 78 HOV lanes from I-5 to I-15
San Diego I-5 SR 78
Direct HOV connectors: South to east, west to north, north to east, and west to south
San Diego I-5 SR 78
Direct HOV connectors: East to south and north to west
San Diego I-5 SR 78 SR 56
From eight free flow and two managed lanes to eight free flow and four managed lanes
San Diego LOSSAN Double Tracking in various locations
San Diego COASTER Stations at Camp Pendleton, Fairgrounds and San Dieguito River Bridge Double Track
San Diego COASTER State of good repair improvements
San Diego Super-Region Central Corridor Projects County Route Project
San Diego I-805 SR 52
Direct HOV connectors: west to north and south to east
San Diego I-5 SR 78
Relocation and grade separation at the Sorrento Valley Station
San Diego Purple Line Phase 1 San Ysidro to Kearney Mesa
San Diego Trolley Vehicle replacement to support the trolley
San Diego Super -Region South Corridor Projects County Route Project
San Diego Rapid 640 A/B South I-5 Corridor Rapid Express Services: San Ysidro to Old Town via Downtown San Diego/Iris to Kearney Mesa via Downtown San Diego
San Diego Rapid 905 Iris Trolley to Otay Mesa
San Diego I-5 SR 54 to SR 905 from eight free flow to eight free flow and two managed lanes San Diego I-5 SR 54 to SR 15 from eight free flow to ten free flow and two managed lanes
San Diego Super-Region East Corridor Projects County Route Project
San Diego SR 67 2 lane conventional to a 4 lane conventional highway
San Diego I-8 4 lane freeway to 6 lane freeway 2nd Street to Los Coches Road
San Diego SR 94 SR 125
Improve connectors south to east and west to north
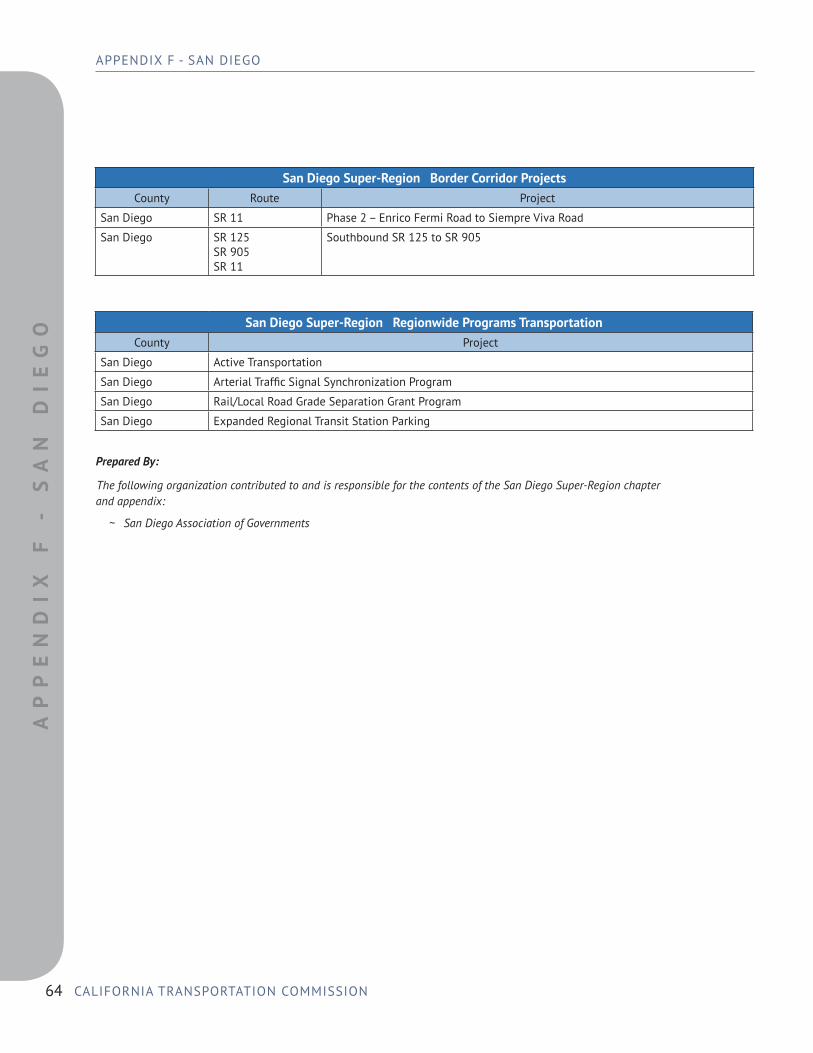
64 CALIFORNIA TRANSPORTATION COMMISSION
APPENDIX F - SAN DIEGOA
PP
EN
DI
X
F -
S
AN
D
IE
GO
-
-
San Diego Super-Region Border Corridor Projects County Route Project
San Diego SR 11 Phase 2 – Enrico Fermi Road to Siempre Viva Road
San Diego SR 125 SR 905 SR 11
Southbound SR 125 to SR 905
San Diego Super-Region Regionwide Programs Transportation County Project
San Diego Active Transportation
San Diego Arterial Traffic Signal Synchronization Program San Diego Rail/Local Road Grade Separation Grant Program
San Diego Expanded Regional Transit Station Parking
Prepared By:
The following organization contributed to and is responsible for the contents of the San Diego Super-Region chapter and appendix:
~ San Diego Association of Governments

65
APPENDIX G - SAN FRANCISCO BAY AREA
UNFUNDED TRANSPORTATION INVESTMENT PRIORITIES
AP
PE
ND
IX
G -
S
AN
F
RA
NC
IS
CO
B
AY
AR
EA
-
-
-
APPENDIX G – SAN FRANCISCO BAY AREA SUPER-REGION PROJECTS
San Francisco Bay Area Super-Region TIGER Projects County Location Project
Alameda BART 19th Street/Oakland Station Modernization and Multi-modal Transit Improvements
Alameda I-680 I-680 Sunol Express Lanes – Northbound Project Alameda City of Alameda Naval Air Station Alameda Multi-Modal Regional Connections
Contra Costa City of Oakley Oakley Civic Center Train Platform and Park and Ride
San Joaquin Stockton Stockton Track Extension (outside of Bay Area, but supports Altamont Commuter Express (ACE) between San Jose and Central Valley)
San Francisco Bay Area Super-Region TIRCP Projects County Location/System Project
San Francisco SFMTA Light Rail Modernization and Expansion Program
Santa Clara VTA BART Silicon Valley Phase II Extension
Alameda BART Expanding BART Peak Period Trains via construction of a Vehicle Overhaul Heavy Repair Shop (Hayward Maintenance Complex)
Alameda /Contra Costa/
City of Oakley Oakley Civic Center Train Platform and Park and Ride
San Francisco AC Transit Purchase 42 buses to support AC Transit’s new service expansion plan and Transbay service
Solano City of Fairfield Fairfield/Vacaville Intermodal Station Alameda LAVTA LAVTA Zero Emission Bus Commuter Bus Lines Project Alameda /Contra Costa/ San Francisco
WestCAT Addition of 3 double-decker buses to LYNX Route
Various CCTA Bay Area Fair Value Commuting Pilot Project
San Francisco Bay Area Super-Region Goods Movement Projects County Location/System Project
Alameda Port of Oakland Global Opportunities for the Port of Oakland (GoPort) Project, including 7th Street Grade Separation, Middle Harbor and Maritime Street Improvements, and ITS enhancements
Solano I-80/ I-680
Interchange Improvements
Marin/ Sonoma
US 101 Marin-Sonoma Narrows, Segments C2 and B2, Phase 2
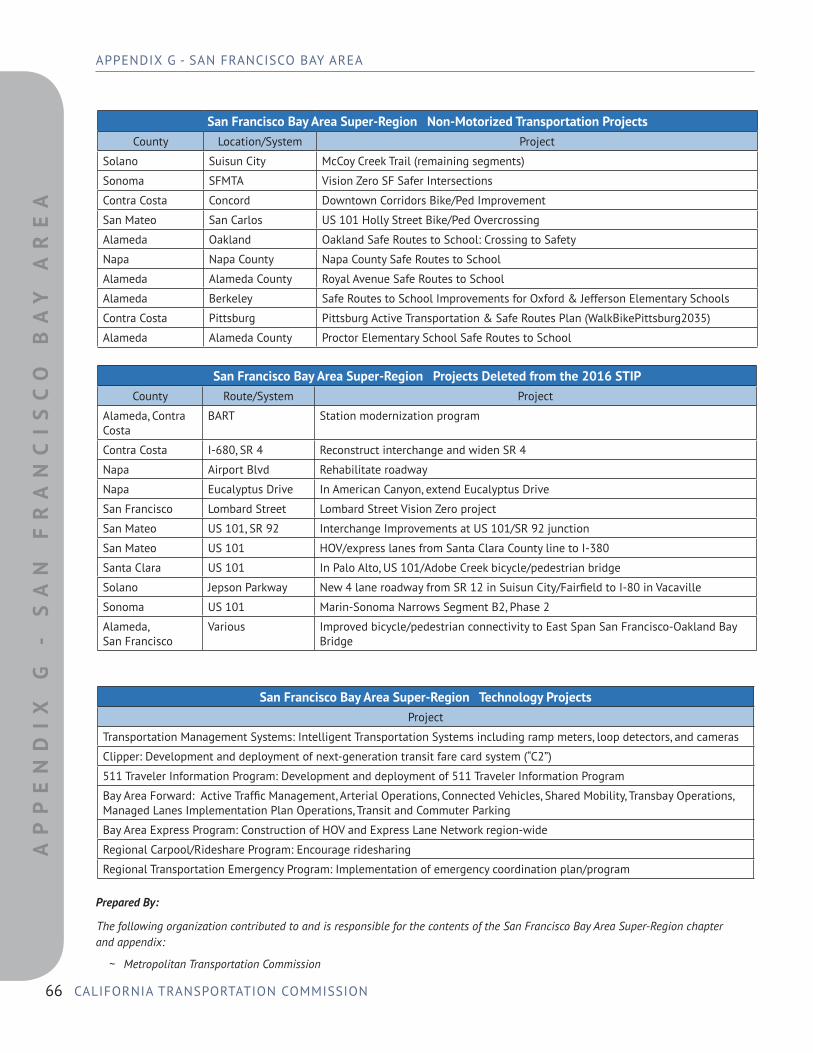
66 CALIFORNIA TRANSPORTATION COMMISSION
APPENDIX G - SAN FRANCISCO BAY AREAA
PP
EN
DI
X G
-
SA
N
FR
AN
CI
SC
O
BA
Y A
RE
A
-
-
-
San Francisco Bay Area Super-Region Non-Motorized Transportation Projects County Location/System Project
Solano Suisun City McCoy Creek Trail (remaining segments)
Sonoma SFMTA Vision Zero SF Safer Intersections
Contra Costa Concord Downtown Corridors Bike/Ped Improvement
San Mateo San Carlos US 101 Holly Street Bike/Ped Overcrossing
Alameda Oakland Oakland Safe Routes to School: Crossing to Safety
Napa Napa County Napa County Safe Routes to School
Alameda Alameda County Royal Avenue Safe Routes to School
Alameda Berkeley Safe Routes to School Improvements for Oxford & Jefferson Elementary Schools
Contra Costa Pittsburg Pittsburg Active Transportation & Safe Routes Plan (WalkBikePittsburg2035)
Alameda Alameda County Proctor Elementary School Safe Routes to School
San Francisco Bay Area Super-Region Projects Deleted from the 2016 STIP County Route/System Project
Alameda, Contra Costa
BART Station modernization program
Contra Costa I-680, SR 4 Reconstruct interchange and widen SR 4
Napa Airport Blvd Rehabilitate roadway
Napa Eucalyptus Drive In American Canyon, extend Eucalyptus Drive
San Francisco Lombard Street Lombard Street Vision Zero project San Mateo US 101, SR 92 Interchange Improvements at US 101/SR 92 junction San Mateo US 101 HOV/express lanes from Santa Clara County line to I-380
Santa Clara US 101 In Palo Alto, US 101/Adobe Creek bicycle/pedestrian bridge
Solano Jepson Parkway New 4 lane roadway from SR 12 in Suisun City/Fairfield to I-80 in Vacaville Sonoma US 101 Marin-Sonoma Narrows Segment B2, Phase 2
Alameda, San Francisco
Various Improved bicycle/pedestrian connectivity to East Span San Francisco-Oakland Bay Bridge
San Francisco Bay Area Super-Region Technology Projects Project
Transportation Management Systems: Intelligent Transportation Systems including ramp meters, loop detectors, and cameras
Clipper: Development and deployment of next-generation transit fare card system (“C2”)
511 Traveler Information Program: Development and deployment of 511 Traveler Information Program
Bay Area Forward: Active Traffic Management, Arterial Operations, Connected Vehicles, Shared Mobility, Transbay Operations, Managed Lanes Implementation Plan Operations, Transit and Commuter Parking
Bay Area Express Program: Construction of HOV and Express Lane Network region-wide
Regional Carpool/Rideshare Program: Encourage ridesharing
Regional Transportation Emergency Program: Implementation of emergency coordination plan/program
Prepared By:
The following organization contributed to and is responsible for the contents of the San Francisco Bay Area Super-Region chapter and appendix:
~ Metropolitan Transportation Commission

67
APPENDIX H - SAN JOAQUIN VALLEY
UNFUNDED TRANSPORTATION INVESTMENT PRIORITIES
AP
PE
ND
IX
H
-
SA
N
JO
AQ
UI
N V
AL
LE
Y
-
-
-
APPENDIX H – SAN JOAQUIN VALLEY SUPER-REGION PROJECTS
San Joaquin Valley Super-Region Active Transportation Projects Project
Active Transportation Projects and Non-Motorized Transportation Facilities throughout the SJV Super-Region: These projects would create sidewalks, bike facilities, and improved crossings for pedestrians and bicyclists throughout the SJV Super-Region.
San Joaquin Valley Super-Region Transit/Passenger Rail Projects County Location/System Project
Various Various Transit Improvements throughout the SJV Super-Region: These projects would expand transit services where warranted, replace buses, and improve transit stops. They would also help convert existing buses to electric buses.
San Joaquin Stockton Regional Transit District Bus Rapid Transit (BRT) Expansion project: Implement BRT service along two major corridors within the City of Stockton, including traffic signal upgrades, bus stop amenities, and transit access enhancements.
Stanislaus Modesto Modesto Passenger Rail Station: Construct a passenger rail station in downtown Modesto.
San Joaquin/ Stanislaus/ Merced
Various Altamont Corridor Express (ACE) Service Expansion and Extension to Merced in San Joaquin, Stanislaus and Merced counties: This project modernizes the existing Corridor Express and extends ACE service to Merced (including new rail stations). The project also expands ACE service from 4 trains a day to 10.
San Joaquin Valley Super-Region State Highway/Roadway Projects County Location/System Project
Various SR 99 Widen SR 99 to 6+ lanes throughout the San Joaquin Valley.
Various Various Next-in-Line Critical Freight Projects throughout the San Joaquin Valley. These projects would create truck climbing lanes, freight hub connectors, and other critically important infrastructure improvements.
Various Various Construct new and improve interchanges on I-5, SR 58, SR 99 and US 395 throughout the San Joaquin Valley Super-Region.
Various Various Local Street/Road Improvements and Maintenance Projects throughout the San Joaquin Valley Super-Region.
Various Various Widen and improve highways (including bypasses) throughout the SJV Super-Region including SR 41, SR 43, SR 46, SR 58, SR 119, SR 145, SR 152, and SR 233, etc.
Fresno Old SR 99 Golden State Corridor Economic Development & Infrastructure Improvements: This project would include rehabilitation, intersection improvements, turning lanes, bike lanes, a bike path, railroad safety features, and landscaping and lighting in the cities of Fowler, Selma, and Kingsburg.
Fresno SR 269 Replace a bridge structure.
Fresno SR 99 Construct a 6 lane new interchange at Veterans Boulevard.
Kern SR 58 SR 58 Centennial Corridor freeway projects: Extend the SR 58 freeway to the Westside Parkway freeway for an additional 7-miles through metropolitan Bakersfield and create a new freeway connection from the Westside Parkway to I-5.
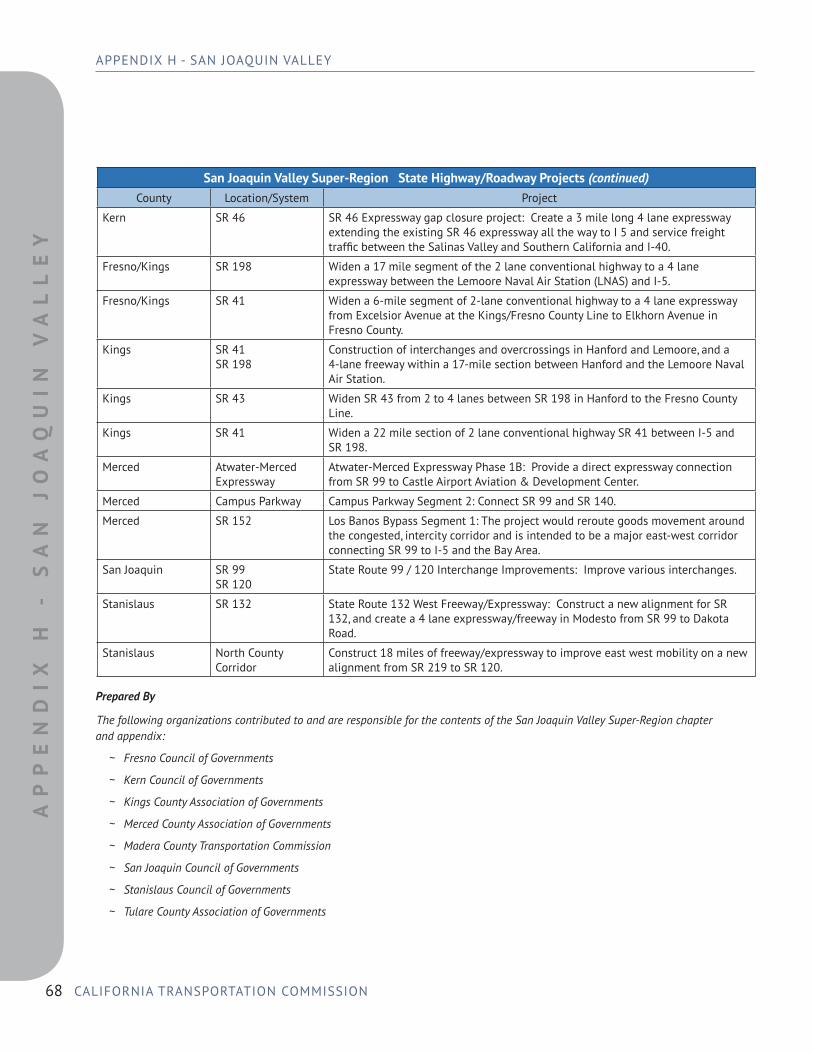
68 CALIFORNIA TRANSPORTATION COMMISSION
APPENDIX H - SAN JOAQUIN VALLEYA
PP
EN
DI
X
H -
S
AN
J
OA
QU
IN
VA
LL
EY
-San Joaquin Valley Super-Region State Highway/Roadway Projects (continued) County Location/System Project
Kern SR 46 SR 46 Expressway gap closure project: Create a 3 mile long 4 lane expressway extending the existing SR 46 expressway all the way to I 5 and service freight traffic between the Salinas Valley and Southern California and I-40.
Fresno/Kings SR 198 Widen a 17 mile segment of the 2 lane conventional highway to a 4 lane expressway between the Lemoore Naval Air Station (LNAS) and I-5.
Fresno/Kings SR 41 Widen a 6-mile segment of 2-lane conventional highway to a 4 lane expressway from Excelsior Avenue at the Kings/Fresno County Line to Elkhorn Avenue in Fresno County.
Kings SR 41 SR 198
Construction of interchanges and overcrossings in Hanford and Lemoore, and a 4-lane freeway within a 17-mile section between Hanford and the Lemoore Naval Air Station.
Kings SR 43 Widen SR 43 from 2 to 4 lanes between SR 198 in Hanford to the Fresno County Line.
Kings SR 41 Widen a 22 mile section of 2 lane conventional highway SR 41 between I-5 and SR 198.
Merced Atwater-Merced Expressway
Atwater-Merced Expressway Phase 1B: Provide a direct expressway connection from SR 99 to Castle Airport Aviation & Development Center.
Merced Campus Parkway Campus Parkway Segment 2: Connect SR 99 and SR 140.
Merced SR 152 Los Banos Bypass Segment 1: The project would reroute goods movement around the congested, intercity corridor and is intended to be a major east-west corridor connecting SR 99 to I-5 and the Bay Area.
San Joaquin SR 99 SR 120
State Route 99 / 120 Interchange Improvements: Improve various interchanges.
Stanislaus SR 132 State Route 132 West Freeway/Expressway: Construct a new alignment for SR 132, and create a 4 lane expressway/freeway in Modesto from SR 99 to Dakota Road.
Stanislaus North County Corridor
Construct 18 miles of freeway/expressway to improve east west mobility on a new alignment from SR 219 to SR 120.
Prepared By
The following organizations contributed to and are responsible for the contents of the San Joaquin Valley Super-Region chapter and appendix:
~ Fresno Council of Governments
~ Kern Council of Governments
~ Kings County Association of Governments
~ Merced County Association of Governments
~ Madera County Transportation Commission
~ San Joaquin Council of Governments
~ Stanislaus Council of Governments
~ Tulare County Association of Governments

69
APPENDIX I - SOUTHERN CALIFORNIA
UNFUNDED TRANSPORTATION INVESTMENT PRIORITIES
AP
PE
ND
IX
I
-
SO
UT
HE
RN
CA
LI
FO
RN
IA
-
APPENDIX I – SOUTHERN CALIFORNIA SUPER-REGION PROJECTS
Southern California Super-Region State Highway/Roadway Projects County Route Project
Imperial I-8 I-8/Imperial Avenue Interchange: Reconstruct interchange at Imperial Avenue from a 2 to 4 lane diamond type overcrossing, realign and reconstruct on and off-ramps, and provide access to Imperial Avenue south of I-8.
Imperial SR 86 SR 86 and Pitzer Road Improvements: Intersection widening and improvements at SR 86 and Pitzer Road.
Imperial SR 98 SR 98 Widening: Widen from 4 to 6 lanes from All American Canal to Rockwood Avenue.
Los Angeles I-5 I-5 North Capacity Enhancements (SR 14 to Lake Hughes Rd): Widen N/B and S/B I-5 to accommodate High Occupancy Vehicle (HOV) Lanes, auxiliary lanes, and truck lanes from the SR 14 interchange to Lake Hughes Rd.
Los Angeles SR 71 SR-71 Freeway Conversion: Convert SR 71 roadway to a fully access-controlled freeway with additional mixed flow lanes, high occupancy vehicle (HOV) lanes to provide a uniform eight lane facility between I-10 and SR 60. This conversion will also eliminate at-grade signalized intersections.
Los Angeles SR 138 SR 138 Widening (Segments 6 and 13): Widen from one to two lanes in each direction from Avenue T to SR 18. The project has been divided into 13 segments, seven are under construction or complete, with the remaining six waiting for funding resources to become available.
Los Angeles I-710 I-710 South Corridor Project (Phase 1) – Early Action Projects: Widens and replaces the first phase of critical interchanges along the I-710 corridor, improving the safety and throughput of cars and trucks.
Orange I-5 I-5 El Toro Road Interchange: Construct interchange improvements from Los Alisos Boulevard Overcrossing to Ridge Route Drive.
Orange I-5 I-5 Widening (Segments 1, 2, and 3): Addition of one mixed flow lane in each direction from SR 73 to El Toro Road including reconstruction of interchanges, added auxiliary lanes where needed and extension of the second High Occupancy Vehicle Lane from El Toro Road to Alicia Parkway. The overall project length is approximately 6.5 miles.
Orange I-5 I-5 Widening (I-405 to SR 55): Addition of one N/B mixed-flow lane from truck bypass on ramp to SR 55, one S/B mixed-flow lane from SR 55 to Alton, and one axillary lane Alton to truck bypass.
Orange SR 55 SR-55 Widening (I-405 to I-5): Addition of one mixed-flow lane and one HOV lane in each direction and fix chokepoints from I-405 to I-5 including the addition of one auxiliary lane in each direction at select on and off ramps and non-capacity operational improvements.
Orange SR 55 SR-55 Widening (I-5 to SR 91): Addition of one mixed-flow lane each direction and fix chokepoints from I-5 to SR 22; and other operational improvements throughout project limits.
Orange SR 57 SR 57 Widening (Orangewood to Katella): Addition of one N/B mixed-flow lane between Orangewood and Katella.
Orange SR 91 SR 91 Widening (SR-55 to SR-57): Addition of one EB mixed-flow lane from SR 55 to SR 57, one W/B mixed-flow lane from Glassell to State College; improve interchanges and merging from Lakeview to Raymond.
Orange I-405 I-405 Widening Project (I-5 to SR 55): Addition of one mixed-flow lane in each direction from I-5 to SR 55 and improve merging.

70 CALIFORNIA TRANSPORTATION COMMISSION
APPENDIX I - SOUTHERN CALIFORNIAA
PP
EN
DI
X
I -
S
OU
TH
ER
N C
AL
IF
OR
NI
A
-Southern California Super-Region State Highway/Roadway Projects (continued) County Route Project
Orange I-405 I-405 Widening Project (SR 73 to I-605): Add 1 mixed-flow lane in each direction and additional capital improvements from SR-73 to I-605, convert existing High Occupancy Vehicle (HOV) to High Occupancy Toll (HOT) lane. Add 1 additional HOT lane each direction.
Orange I-605 I-605 Katella Ave Interchange: Improve the local interchange to improve freeway access, traffic operations, enhance safety, and improve pedestrian and bicycle facilities within project limits.
Riverside I-10 I-10/Portola Avenue Interchange: Construct new 6 lane Portola Avenue interchange from Dinah Shore Drive to Varner Road, including on and off ramps, bridge widening over UPRR, relocation/widening of Varner Road from two to four lanes, additional auxiliary lanes, and extension of fourth W/B lane to from Cook to Portola.
Riverside I-15 I-15 Express Lanes: Addition of two express lanes in each direction from Cantu-Galleano Rancho Rd. to Hidden Valley Parkway and from SR 91 to El Cerrito Road.
Riverside I-15 I-15/French Valley Parkway Interchange/Arterial (Phases II & III): Phase II: A new collector/distributor system along I-15 between Winchester Road and the I-15/I-215 Junction. Phase III: Construct a six lane overcrossing from Jefferson to Ynez including ramps, N/B and S/B lanes, collector/distributor lanes and modifications to Winchester Road interchange.
Riverside I-15 I-15/Limonite Ave Interchange: Reconstruct and widen Limonite Avenue from four to six through lanes between East Vale Gateway and 475’ east of Pats Ranch Road, including on an off ramp improvements, acceleration/deceleration lanes, and extended right turn lanes.
Riverside I-15 I-15/Railroad Canyon Road Interchange (Phases I and II): Phase I: Widen Railroad Canyon Road undercrossing from seven to eight lanes from Summerhill Drive to Mission Terrace, including on and off ramp improvements, and acceleration/ deceleration lanes. Phase II: Construct new I-15/Franklin St interchange, including auxiliary lanes from Franklin Street interchange to Main Street interchange and from Franklin Street interchange to Railroad Canyon interchange, including on ramp improvements, and extensions of Auto Center Drive and Canyon Estate Drive.
Riverside SR 79 SR 79 Realignment/Widening: Realign and widen SR 79 from 2 to 4 lanes between two kilometers south of Domenigoni Parkway to Gilman Springs Road.
Riverside SR 86 SR 86/Ave 50 Interchange Widening: Widen and construct a 6 through lane interchange from east of Coachella stormwater channel bridge to east of Tyler Street, including, relocate/realign Avenue 50 and Tyler Street, extend ramp acceleration/deceleration lanes, bike lanes, sidewalks, and reconstruct traffic signals.
Riverside SR 86 SR 86/Ave 52 Interchange Widening: Widen and construct a 6 through lane interchange from east of Coachella stormwater channel bridge to east of Tyler Street, including, realign Polk St and relocate Avenue 52 and Polk St intersection, extended ramp acceleration/deceleration lanes, bike lanes, sidewalks, and reconstruct traffic signals.
Riverside I-15 SR 91
SR 91/71 Junction Corridor: At SR 91/71 Junction replace E/B SR 91 to N/B SR 71 connector with a direct flyover connector, and reconstruct the Green River Road EB on-ramp.
Riverside I-15 SR 91
SR 86/Ave 50 Interchange Widening: Widen and construct a 6 through lane interchange from east of Coachella stormwater channel bridge to east of Tyler Street, including, relocate/realign Avenue 50 and Tyler Street, extend ramp acceleration/deceleration lanes, bike lanes, sidewalks, and reconstruct traffic signals.
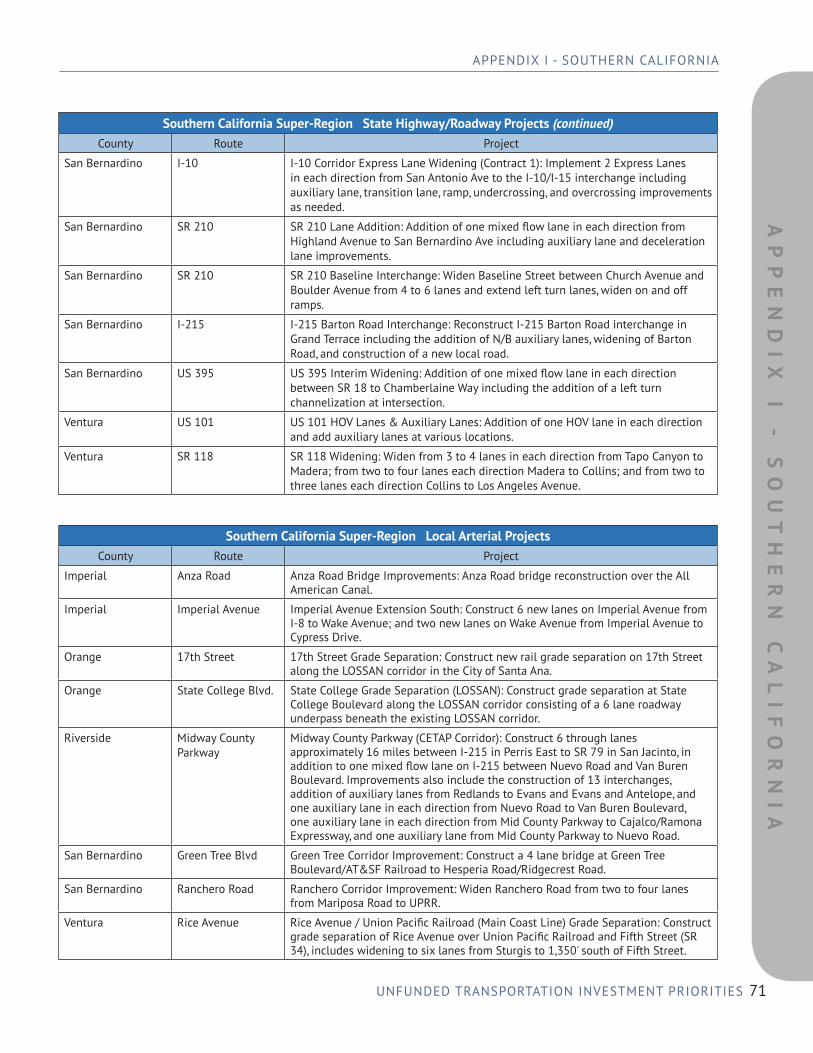
71
APPENDIX I - SOUTHERN CALIFORNIA
UNFUNDED TRANSPORTATION INVESTMENT PRIORITIES
AP
PE
ND
IX
I
-
SO
UT
HE
RN
CA
LI
FO
RN
IA
-
-
Southern California Super-Region State Highway/Roadway Projects (continued) County Route Project
San Bernardino I-10 I-10 Corridor Express Lane Widening (Contract 1): Implement 2 Express Lanes in each direction from San Antonio Ave to the I-10/I-15 interchange including auxiliary lane, transition lane, ramp, undercrossing, and overcrossing improvements as needed.
San Bernardino SR 210 SR 210 Lane Addition: Addition of one mixed flow lane in each direction from Highland Avenue to San Bernardino Ave including auxiliary lane and deceleration lane improvements.
San Bernardino SR 210 SR 210 Baseline Interchange: Widen Baseline Street between Church Avenue and Boulder Avenue from 4 to 6 lanes and extend left turn lanes, widen on and off ramps.
San Bernardino I-215 I-215 Barton Road Interchange: Reconstruct I-215 Barton Road interchange in Grand Terrace including the addition of N/B auxiliary lanes, widening of Barton Road, and construction of a new local road.
San Bernardino US 395 US 395 Interim Widening: Addition of one mixed flow lane in each direction between SR 18 to Chamberlaine Way including the addition of a left turn channelization at intersection.
Ventura US 101 US 101 HOV Lanes & Auxiliary Lanes: Addition of one HOV lane in each direction and add auxiliary lanes at various locations.
Ventura SR 118 SR 118 Widening: Widen from 3 to 4 lanes in each direction from Tapo Canyon to Madera; from two to four lanes each direction Madera to Collins; and from two to three lanes each direction Collins to Los Angeles Avenue.
Southern California Super-Region Local Arterial Projects County Route Project
Imperial Anza Road Anza Road Bridge Improvements: Anza Road bridge reconstruction over the All American Canal.
Imperial Imperial Avenue Imperial Avenue Extension South: Construct 6 new lanes on Imperial Avenue from I-8 to Wake Avenue; and two new lanes on Wake Avenue from Imperial Avenue to Cypress Drive.
Orange 17th Street 17th Street Grade Separation: Construct new rail grade separation on 17th Street along the LOSSAN corridor in the City of Santa Ana.
Orange State College Blvd. State College Grade Separation (LOSSAN): Construct grade separation at State College Boulevard along the LOSSAN corridor consisting of a 6 lane roadway underpass beneath the existing LOSSAN corridor.
Riverside Midway County Parkway
Midway County Parkway (CETAP Corridor): Construct 6 through lanes approximately 16 miles between I-215 in Perris East to SR 79 in San Jacinto, in addition to one mixed flow lane on I-215 between Nuevo Road and Van Buren Boulevard. Improvements also include the construction of 13 interchanges, addition of auxiliary lanes from Redlands to Evans and Evans and Antelope, and one auxiliary lane in each direction from Nuevo Road to Van Buren Boulevard, one auxiliary lane in each direction from Mid County Parkway to Cajalco/Ramona Expressway, and one auxiliary lane from Mid County Parkway to Nuevo Road.
San Bernardino Green Tree Blvd Green Tree Corridor Improvement: Construct a 4 lane bridge at Green Tree Boulevard/AT&SF Railroad to Hesperia Road/Ridgecrest Road.
San Bernardino Ranchero Road Ranchero Corridor Improvement: Widen Ranchero Road from two to four lanes from Mariposa Road to UPRR.
Ventura Rice Avenue Rice Avenue / Union Pacific Railroad (Main Coast Line) Grade Separation: Construct grade separation of Rice Avenue over Union Pacific Railroad and Fifth Street (SR 34), includes widening to six lanes from Sturgis to 1,350' south of Fifth Street.

72 CALIFORNIA TRANSPORTATION COMMISSION
APPENDIX I - SOUTHERN CALIFORNIAA
PP
EN
DI
X
I -
S
OU
TH
ER
N C
AL
IF
OR
NI
A
-Southern California Super-Region Maintenance and Operations Needs County Project
Imperial Calexico Intermodal Transportation Center: New Intermodal Transportation Center in the City of Calexico.
Los Angeles Airport Metro Connect 96th St. Station/Green Line Ext LAX: Connects two Metro rail lines and Metro municipal bus service with Los Angeles International Airport via LAX's Automated People Mover.
Los Angeles East San Fernando Valley North-South Corridor: The project is an element of a package of projects providing enhanced BRT and new transit corridors to serve the San Fernando Valley. This particular element includes a new transit corridor in the western San Fernando Valley to help relieve surface street congestion and improve mobility for residents.
Los Angeles/ San Bernardino
Gold Line Foothill Phase 2B: Extends Gold Line 11 miles and adds five stations from Citrus College Station to the Montclair Transcenter. Project will provide light rail transit access to five Cities within the San Gabriel Valley of Los Angeles County and connect with the existing Gold Line segment from Los Angeles to Azusa.
Los Angeles Orange Line BRT Improvements – Grade Separation: Grade separations along the Orange Line's Right of Way, improving bus speeds and travel times.
Los Angeles P3010 Light Rail Vehicles: To address continuing ridership growth, system expansion, and fleet replacement needs, Metro has awarded a base order contract for 78 light rail vehicles with options for up to 157 additional vehicles.
Los Angeles Sepulveda Pass Transit Corridor: Provides Express Lanes on I-405 from US 101 to I-10 and 18.8 miles of high-capacity transit from Metro Orange Line Van Nuys Station to Airport Metro Connector 96th Street Station.
Los Angeles Vermont Transit Corridor: Adds a 12.5-mile high-capacity Bus Rapid Transit corridor from Hollywood Blvd to 120th St. The project would be converted to light rail service at a later date if ridership demand outgrows the bus rapid service capacity.
Los Angeles West Santa Ana Transit Corridor: Provides 20 mile light rail transit from the City of Artesia to Union Station.
Los Angeles Westside Purple Line Extension Section 3: Extends the Purple Line Subway along the Wilshire Corridor, connecting Century City, the VA and UCLA.
Los Angeles Rail Fleet Expansion and Modernization: New rail cars will replace existing cars and expand fleet to accommodate increased service following rail line extensions.
Los Angeles Red/Purple Line Core Capacity Enhancement: Red and Purple Line Subway Portal widening and Turnback Facility. Project will accommodate increased service levels on the Metro Red/Purple Lines by reducing turn back time for both subway lines at Union Station.
Orange Orange County Streetcar: OC Streetcar between Santa Ana Regional Transportation Center (SARTC) and a new transit center in Garden Grove, near the intersection of Harbor Boulevard and Westminster Avenue.
Orange Bravo Route 529 Operating and Capital Cost: Operating and capital cost for limited stop bus service on Beach Blvd from Fullerton Park and Ride to Goldenwest Transportation Center.
San Bernardino Metrolink Gold Line Phase 2B: Light rail extension from Montclair to the San Bernardino/Los Angeles County line.
San Bernardino Metrolink Double Track: Double tracking of Metrolink San Bernardino Line between Control Point (CP) Lilac and CP Rancho in San Bernardino County.
San Bernardino Redlands Passenger Rail Program: Extend Metrolink rail service from Rialto/E Street in San Bernardino to Redlands.

73
APPENDIX I - SOUTHERN CALIFORNIA
UNFUNDED TRANSPORTATION INVESTMENT PRIORITIES
AP
PE
ND
IX
I
-
SO
UT
HE
RN
CA
LI
FO
RN
IA
-
-
Southern California Super-Region Port Operation Projects County Project
Imperial Calexico East Port of Entry Improvements: Widen bridge over the All American Canal to six lanes at the Calexico East Port of Entry.
Los Angeles Gerald Desmond Bridge Replacement: Replace existing structurally deficient and functionally obsolete bridge high enough to accommodate the newest generation of the most efficient cargo ships.
Ventura Port Hueneme Efficiency & Optimization Project: Includes installation of solar panels to support electricity needed for the refer plugs on dock; installation of additional on-dock refer plugs and racks; traffic flow enhancements at the gate; and the building demolition to provide capacity.
Southern California Super-Region Trucking Routes/Operations/Logistics Projects County Route Project
Imperial Forrester Road Forrester Road Corridor: Construct Forrester Road Bridge over the New River reconstruction, including roadway realignment and operational improvements.
Imperial Menvielle Road Menvielle Road Widening: Widen Menvielle Road from 2 to 4 lanes between Carr Road to SR 98.
Los Angeles SR 57 SR 60
SR 57/SR 60 Confluence Freight Bottleneck Project: Construction of critical bypass improvements to unlock a bottleneck on SR 60 where SR 57 converge to share the same alignment with SR 60 in Los Angeles County near the Orange County border. The project would construct a new E/B SR 60 bypass off-ramp to Grand Avenue, a new E/B bypass connector to SR 60, reconstructing the Grand Avenue Overcrossing, and reconfiguring the E/B ramps at Grand Avenue, including adding a SB Grand Avenue to the E/B SR 60 loop on-ramp.
Orange SR 57 SR 57 Lambert Interchange: Reconfigure existing diamond interchange at SR 57/ Lambert Road to loop ramp, including addition of S/B lane on and off-ramps.
Orange SR 57 SR-57 Truck Climbing Aux Lane: Addition of auxiliary truck climbing lane from Lambert Ave to the Los Angeles/Orange County Line.
Riverside SR 60 SR 60 Truck Lanes: Construct new E/B climbing and W/B descending truck lanes from Gilman Springs Road to approximately 1.37 miles west of Jack Rabbit Trail and upgrade existing inside and outside shoulders to standard widths.
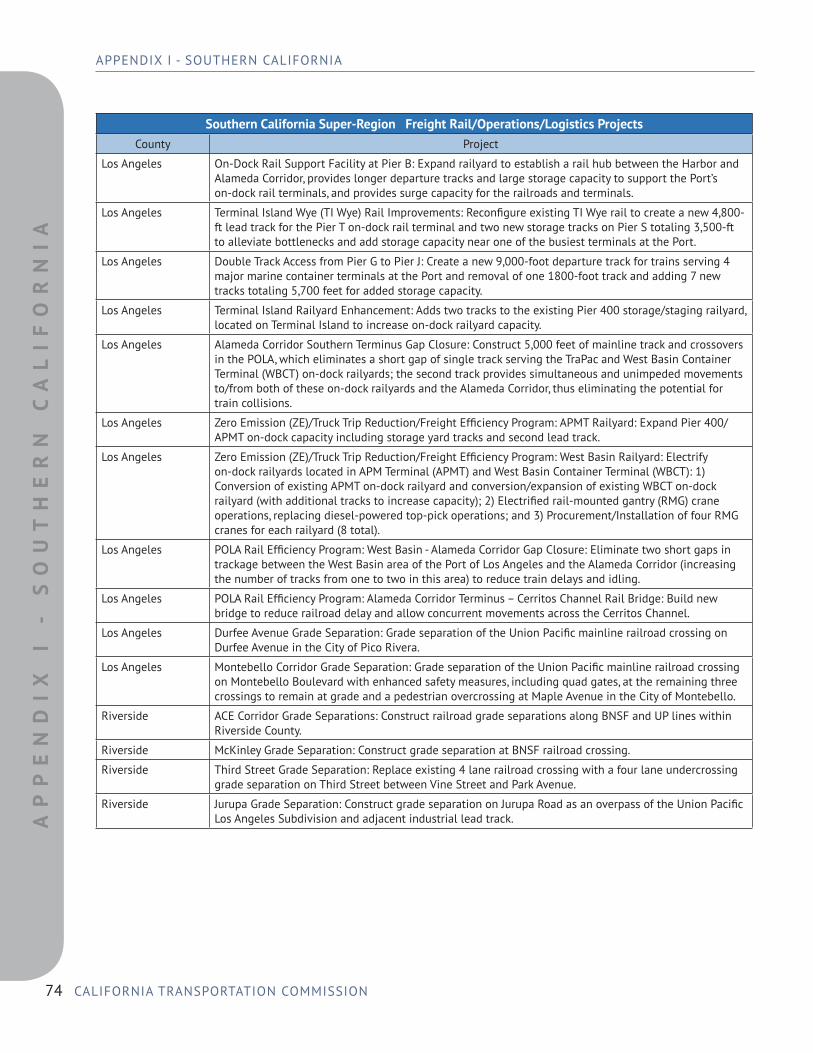
74 CALIFORNIA TRANSPORTATION COMMISSION
APPENDIX I - SOUTHERN CALIFORNIAA
PP
EN
DI
X
I -
S
OU
TH
ER
N C
AL
IF
OR
NI
A
-Southern California Super-Region Freight Rail/Operations/Logistics Projects County Project
Los Angeles On-Dock Rail Support Facility at Pier B: Expand railyard to establish a rail hub between the Harbor and Alameda Corridor, provides longer departure tracks and large storage capacity to support the Port’s on-dock rail terminals, and provides surge capacity for the railroads and terminals.
Los Angeles Terminal Island Wye (TI Wye) Rail Improvements: Reconfigure existing TI Wye rail to create a new 4,800-ft lead track for the Pier T on-dock rail terminal and two new storage tracks on Pier S totaling 3,500-ft to alleviate bottlenecks and add storage capacity near one of the busiest terminals at the Port.
Los Angeles Double Track Access from Pier G to Pier J: Create a new 9,000-foot departure track for trains serving 4 major marine container terminals at the Port and removal of one 1800-foot track and adding 7 new tracks totaling 5,700 feet for added storage capacity.
Los Angeles Terminal Island Railyard Enhancement: Adds two tracks to the existing Pier 400 storage/staging railyard, located on Terminal Island to increase on-dock railyard capacity.
Los Angeles Alameda Corridor Southern Terminus Gap Closure: Construct 5,000 feet of mainline track and crossovers in the POLA, which eliminates a short gap of single track serving the TraPac and West Basin Container Terminal (WBCT) on-dock railyards; the second track provides simultaneous and unimpeded movements to/from both of these on-dock railyards and the Alameda Corridor, thus eliminating the potential for train collisions.
Los Angeles Zero Emission (ZE)/Truck Trip Reduction/Freight Efficiency Program: APMT Railyard: Expand Pier 400/ APMT on-dock capacity including storage yard tracks and second lead track.
Los Angeles Zero Emission (ZE)/Truck Trip Reduction/Freight Efficiency Program: West Basin Railyard: Electrify on-dock railyards located in APM Terminal (APMT) and West Basin Container Terminal (WBCT): 1) Conversion of existing APMT on-dock railyard and conversion/expansion of existing WBCT on-dock railyard (with additional tracks to increase capacity); 2) Electrified rail-mounted gantry (RMG) crane operations, replacing diesel-powered top-pick operations; and 3) Procurement/Installation of four RMG cranes for each railyard (8 total).
Los Angeles POLA Rail Efficiency Program: West Basin - Alameda Corridor Gap Closure: Eliminate two short gaps in trackage between the West Basin area of the Port of Los Angeles and the Alameda Corridor (increasing the number of tracks from one to two in this area) to reduce train delays and idling.
Los Angeles POLA Rail Efficiency Program: Alameda Corridor Terminus – Cerritos Channel Rail Bridge: Build new bridge to reduce railroad delay and allow concurrent movements across the Cerritos Channel.
Los Angeles Durfee Avenue Grade Separation: Grade separation of the Union Pacific mainline railroad crossing on Durfee Avenue in the City of Pico Rivera.
Los Angeles Montebello Corridor Grade Separation: Grade separation of the Union Pacific mainline railroad crossing on Montebello Boulevard with enhanced safety measures, including quad gates, at the remaining three crossings to remain at grade and a pedestrian overcrossing at Maple Avenue in the City of Montebello.
Riverside ACE Corridor Grade Separations: Construct railroad grade separations along BNSF and UP lines within Riverside County.
Riverside McKinley Grade Separation: Construct grade separation at BNSF railroad crossing.
Riverside Third Street Grade Separation: Replace existing 4 lane railroad crossing with a four lane undercrossing grade separation on Third Street between Vine Street and Park Avenue.
Riverside Jurupa Grade Separation: Construct grade separation on Jurupa Road as an overpass of the Union Pacific Los Angeles Subdivision and adjacent industrial lead track.

75
APPENDIX I - SOUTHERN CALIFORNIA
UNFUNDED TRANSPORTATION INVESTMENT PRIORITIES
AP
PE
ND
IX
I
-
SO
UT
HE
RN
CA
LI
FO
RN
IA
-
-
Southern California Super-Region Active Transportation Projects County Project
Imperial Calexico Intermodal Transportation Center: A new border crossing focusing on pedestrian and bicyclist access.
Los Angeles Los Angeles County Active Transportation Needs: First/Last Mile Connectivity, Transit Hub connectivity, Bike Share and Secure Bike Parking. Regional Bikeway and mixed use paths that connect cities, communities, major destinations, and local projects that feed into the regional network.
Orange OC Loop: 66 miles of seamless connections provides an opportunity for people to bike, walk and connect to some of California’s most scenic beaches and inland reaches. Currently, 70 percent of the loop is complete.
Riverside Coachella Valley CV Link: 55-mile mixed use/electric vehicle path linking areas across the Coachella Valley.
Southern California Super-Region Technology Projects County Project
Imperial Imperial ITS Implementation at Calexico West and East POE: Install border wait-time monitoring systems, radio frequency identification (RFID)/Bluetooth technology, and advanced traveler information systems.
Prepared By:
The following organizations contributed to and are responsible for the contents of the Southern California Super-Region chapter
and appendix:
~ Imperial County Transportation Commission
~ Los Angeles County Metropolitan Transportation Authority
~ Orange County Transportation Authority
~ Riverside County Transportation Commission
~ San Bernardino County Transportation Authority
~ Southern California Association of Governments
~ Ventura County Transportation Commission

Commissioners
Bob Alvarado, Chair Fran Inman, Vice Chair Yvonne Burke Lucetta Dunn James Earp James Ghielmetti Carl Guardino Christine Kehoe James Madaffer Joseph Tavaglione
Ex-Officio Members
The Honorable Jim Beall, Member of the California Senate The Honorable Jim Frazier, Member of the California Assembly
Staff Members
Susan Bransen, Executive Director Kristina Assouri, Chief Deputy Director Ericka Butler Dawn Cheser Teresa Favila Rick Guevel Garth Hopkins Anne Johnson Stephen Maller Deborah McKee Jose Oseguera Laura Pennebaker Douglas Remedios Eric Thronson Justine To-Gutterres Curtis Vandermolen David Van Dyken Laurie Waters Mitchell Weiss
Commission extends a special “thank you” to Eric Thronson and David Van Dyken for their efforts in the preparation and development of the report.
Special thanks to Stephen Brooks, Caltrans’ Reprographics Division, for designing the report.

The California Transportation Commission is an independent state commission responsible for programming and allocating funds for the construction of highway, passenger rail, transit and active transportation improvements throughout California. The Commission also advises and assists the California State Transportation Agency Secretary and the Legislature in formulating and evaluating state policies and plans for California’s transportation programs. The Commission is an active participant in the initiation and development of State and Federal legislation to secure financial stability for the State’s transportation needs.

California Transportation Commission
1120 N Street, MS-52 CALIFORNIA TRANSPORTATION Sacramento, California 95814
COMMISSION Tel: 916.654.4245 Fax: 916.653.2134 www.catc.ca.govTwitter:@California_CTC


