CANSO GLOBAL AIR NAVIGATION SERVICES PERFORMANCE REPORT2014 – 2018 ANSP Performance Results
canso.org

2
CANSO Global Air Navigation Services Performance Report
Acknowledgements
The Global Air Navigation Services Performance Report is produced by the CANSO Global Benchmarking Workgroup, with the assistance of Helios. The workgroup is grateful for the continued analytical support provided by Helios.
This year we also thank EUROCONTROL and their Performance Review Unit (PRU) for their collaboration in providing the data from the ATM Cost-Effectiveness (ACE) Benchmarking Report. This has enabled our report to reflect data from a broader scope of air navigation service providers.
The workgroup would also like to thank its Chair, Siree Vatanavigkit of AEROTHAI, who is stepping down from the Chair position this year, for her leadership, commitment, and diligence. We welcome to Diána Rohácsné Galgóczi of HungaroControl as the new Chair.
© Copyright CANSO October 2020
All rights reserved. No part of this publication may be reproduced, or transmitted in any form, without the prior permission of CANSO. This paper is for information purposes only. While every effort has been made to ensure the quality and accuracy of information in this publication, it is made available without any warranty of any kind.

3
CANSO Global Air Navigation Services Performance Report
Contents
Acknowledgements ����������������������������������������������������������������������������������������������� 2
Foreword ��������������������������������������������������������������������������������������������������������������������������� 4
Introduction ������������������������������������������������������������������������������������������������������������������� 5
Key Findings ������������������������������������������������������������������������������������������������������������������ 7
2018 Industry Trends ������������������������������������������������������������������������������������������� 9
10-year Trends ���������������������������������������������������������������������������������������������������������� 11
ANSP Case Studies ���������������������������������������������������������������������������������������������� 13
JANS �����������������������������������������������������������������������������������������������������������������������������13
PANSA ��������������������������������������������������������������������������������������������������������������������������13
KCAA �����������������������������������������������������������������������������������������������������������������������������15
NAV CANADA ���������������������������������������������������������������������������������������������������������15
Methodology ������������������������������������������������������������������������������������������������������������� 17
Measuring Performance �����������������������������������������������������������������������������������17
Key Performance Indicators ���������������������������������������������������������������������������18
Data Processing �����������������������������������������������������������������������������������������������������18
Reporting Periods �������������������������������������������������������������������������������������������������20
2018 Participation ������������������������������������������������������������������������������������������������21
2018 Performance Data ���������������������������������������������������������������������������������25
Continental Cost Efficiency and Productivity: 2018 ����������������������26
Oceanic Cost Efficiency and Productivity: 2018 �������������������������������38
Joint Continental and Oceanic Cost Efficiency: 2018 ������������������44
Summary of Performance Trends ��������������������������������������������������������46
Related CANSO Benchmarking Activities ����������������������������������47
Safety Performance Measurement Workgroup ��������������������������������47
Annex 1: Data Definitions ����������������������������������������������������������������������������52
Contextual Data Element Definitions ������������������������������������������������������52
Annex 2: Key Performance Indicators ��������������������������������������������53
Annex 3: Contextual Data ���������������������������������������������������������������������������54
Airports Authority of India ������������������������������������������������������������������������������54
AEROTHAI������������������������������������������������������������������������������������������������������������������55
Airways New Zealand �����������������������������������������������������������������������������������������56
Air Navigation Services of the Czech Republic ��������������������������������57
Air Navigation Services Finland Oy ����������������������������������������������������������58
Air Traffic & Navigation Services ����������������������������������������������������������������59
Civil Aviation Authority of Singapore ������������������������������������������������������60
Devlet Hava Meydanları İşletmesi Genel Müdürlüğü ������������������61
Administration de la navigation aérienne ��������������������������������������������62
Direction des Services de la navigation Aérienne ��������������������������63
Empresa Argentina de Navegación Aérea ������������������������������������������64
Lennuliiklusteeninduse AS ������������������������������������������������������������������������������65
Federal Aviation Administration – Air Traffic Organization������66
HungaroControl Pte. Ltd. Co ������������������������������������������������������������������������67
Isavia Ltd����������������������������������������������������������������������������������������������������������������������68
Japan Air Navigation Service ������������������������������������������������������������������������70
Kenya Civil Aviation Authority ���������������������������������������������������������������������71
Latvijas gaisa satiksme ��������������������������������������������������������������������������������������72
Macedonian Air Navigation Service Provider �����������������������������������73
NAV Portugal �����������������������������������������������������������������������������������������������������������74
Oro navigacija����������������������������������������������������������������������������������������������������������75
PANSA Polish Air Navigation Services Agency ���������������������������������76
Papua New Guinea Air Services Ltd ���������������������������������������������������������77
Saudi Air Navigation Services ����������������������������������������������������������������������78
Serbia and Montenegro Air Traffic Services SMATSA LLC �������79
Tanzania Civil Aviation Authority ����������������������������������������������������������������80
Annex 4: KPI Data�������������������������������������������������������������������������������������������������81
Annex 5: Exchange Rates �����������������������������������������������������������������������������94
Annex 6: Acronyms and Abbreviations �����������������������������������������95
Annex 7: Sources ���������������������������������������������������������������������������������������������������96
4
CANSO Global Air Navigation Services Performance Report
Foreword
This year, CANSO celebrates the tenth edition of the CANSO Global Air Navigation Services Performance Report. The publication was initially developed in 2009 by a small collection of dedicated ANSPs in the CANSO Global Benchmarking Workgroup (GBWG). The report was designed to act as a tool for ANSPs to compare, contrast and identify good practices in ANS performance, particularly in the areas of cost efficiency and ATCO productivity.
A decade later, the report has a loyal and significantly larger list of contributors from all across the globe, demonstrating the fruits of long-term international collaboration – an ethos that lies at the very heart of CANSO’s strategy and ambition.
The report has evolved significantly over time. This includes the introduction of the CANSO performance framework and reinvention of the report in 2013 following the CANSO GBWG’s partnership with Helios, who has undertaken the data analysis for the report for the past eight years.
This year marks another step in its evolution – the incorporation of data published by EUROCONTROL’s Performance Review Unit (PRU). For the first time, the report now includes coverage of ANSPs from almost the entire European Civil Aviation Conference (ECAC) region – increasing the number of ANSPs represented from 36 to 57, together responsible for the management of over 65% of global air traffic.
While this issue covers 2018 performance, it is impossible to ignore the state of the industry at the time of its release. The global COVID-19 pandemic poses one of the greatest challenges for the aviation industry of all time. The collapse of traffic volumes due to state-imposed travel restrictions aimed at controlling the pandemic spread has devastated the industry. And while the recovery will take several years, this report is a timely reminder of progress that had been made and areas to which we must now turn our attention.
Although the impacts of the pandemic will not be reflected in the data published in this report, future editions will undoubtedly demonstrate its effect on performance and provide a means for ANSPs to elicit lessons learnt. This type of collaboration is vital to inform the industry’s response to any future crises.
In this special edition, we look back at some of the success stories from those ANSPs that have tracked their performance across the last ten years. In addition, we hear some of the thoughts provided by CANSO Members regarding how their businesses have changed and will continue to evolve over time.
I would like to thank the CANSO GBWG and all the participating CANSO Members. In addition, I would like to thank Helios for their efforts over the past eight years in data collection and analysis and its continued dedication in supporting this work. I also thank EUROCONTROL for their collaboration and generous assistance in helping the initiative.
I invite the industry to celebrate this collaboration and champion the excellent example this initiative sets as CANSO journeys through this new decade.
Simon Hocquard Director General CANSO

5
CANSO Global Air Navigation Services Performance Report
Introduction
Comparing ANSP Performance
Air navigation service providers (ANSPs) are responsible for managing global air traffic safely, efficiently and cost-effectively. This includes managing and enhancing airspace capacity through improvements to infrastructure and technology, and improving efficiency through a skilled and productive workforce and an innovative and technological approach to airspace management.
The performance of the air navigation system impacts stakeholders across the aviation value chain. From boosting connectivity and minimising delays, to upholding the highest standard of safety in aviation, efficient, effective air navigation services are a critical component of a high-performance aviation industry. To that end, CANSO has devised benchmarking exercises that aggregate and review global performance accordingly.
Comparing and benchmarking key financial and productivity indicators enables ANSPs to make informed decisions when pursuing increased cost-effectiveness and productivity, without impacting safety – the industry’s top priority. It helps ANSPs to work together to address both their own performance and that of the ATM industry worldwide. The CANSO Global ANS Performance Report does not therefore seek to compare the results of various ANSPs to a ‘best-in-class’; rather it highlights global performance trends and identifies performance gaps, acting as a basis for collective improvement.
Measuring Cost Efficiency and Productivity
Cost efficiency and productivity are two key performance indicators of air navigation services. They demonstrate how ANSPs are delivering value and serve as indicators of operational efficiency. The CANSO ANS Performance Framework identifies the factors that determine cost-efficiency and productivity, including employment costs, hours worked and other costs, and is used to create a clear, common model for understanding global ANS performance.
Global Air Navigation Services Performance Report
The Global Air Navigation Services (ANS) Performance Report is produced annually by CANSO’s Global Benchmarking Workgroup (GBWG), with the support of Helios, to benchmark the cost efficiency and productivity of air navigation services worldwide.
This latest Global Air Navigation Services Performance Report contains performance indicators for 57 ANSPs for the year 2018, along with trend data between 2014 and 2018.
ANSPs submitting to CANSO have also provided contextual comments, including any exceptional events during the year or items that may impact the comparability of their data. Additional comments on important events are included within the contextual data, providing insight into the results of the participating ANSPs.
Incorporation of PRU Data
A key objective for CANSO and the members of CANSO’s Global Benchmarking Workgroup (GBWG) is to continue to increase the global coverage of the data included in the annual report. To support this, in 2020 CANSO, with the agreement of EUROCONTROL, has incorporated public data collected by EUROCONTROL’s Performance Review Unit (PRU) to complete the representation of European ANSPs in the dataset. CANSO consulted with European members prior to the inclusion of this data within the report.
Key Performance Indicators
The trends presented within the report are based on the results of the key performance indicators (KPIs) that comprise the CANSO ANS Performance Framework, displayed below. The KPI results for each ANSP can be found under the 2018 performance data from page 25 onwards.

6
CANSO Global Air Navigation Services Performance Report
The average percentage change for all CANSO Key Performance Indicators (KPIs), when comparing 2017 and 2018 ANSP data, are detailed in the summary figure below:
Cost effectiveness KPI:Total Costs
IPR flight hours
1Cont.-2.1%
Oceanic-3.5%
Proportion of total costs made up of ATCO in OPS employment costs
Cont.0.5%
Oceanic6.9%
ATCO in OPS employment costs
Total Costs
Comb.0.5%
Comb.-2.1%
2d
Unit ATCO employment cost
Annual Working hours per ATCO in OPS
IFR hours per ATCO in OPS
Employment cost ATCO
No. ATCOs
ATCO in OPS hours
No. ATCOs
IFR hours
No. ATCOs
Cont.5.1%
Cont.0.9%
Cont.5.5%
3a 3b 3c
Level 3
Level 1
Level 2
ATCO employment cost per ATCO hour
Cont.2.6%
Oceanic6.8%
ATCO employment costs
ATCO hours
ATCO hour productivity
Cont.4.6%
Oceanic-0.7%
2a 2b
ATCO in OPS costs
IFR hours
ATCO hours
Other costs
Cont.-2.2%
Oceanic-5.1%
Costs excl. ATCO employment costs
IFR hours
Capital costs
Depreciation costs
Non-staff operat ing costs
Non ATCO in OPS staff costs
2c
Figure 1: Average percentage change for all CANSO GBWG KPIs between 2017 and 2018

7
CANSO Global Air Navigation Services Performance Report
Key Findings
Increases in Traffic Continue to Outweigh Increases in Costs
The highest-level metric for determining cost-efficiency is cost per IFR flight hour. This is the total cost incurred by an ANSP for safely managing controlled IFR flight hours in continental and oceanic airspace. It is presented on a unit basis (i.e. per IFR hour basis) to improve the comparability of the data between different ANSPs.
The latest figures show that increases in traffic continue to outweigh increases in costs, indicating that cost-efficiency has been maintained.
total cost per IFR flight hour
in continental total cost per IFR flight hour
in oceanic ANSPs saw metric increase
41%59%
ANSPs saw metric decrease
ANSPs saw metric increase60%40%
ANSPs saw metric decrease
Increases in employment costs were consistent with those recorded in 2017The ‘ATCOs in OPS employment cost per ATCO hour’ metric considers employment costs per hour of service delivery. Many factors can influence the absolute value of employment costs in different countries, territories and regions, most notably differences in the local or regional economy. Comparison of these figures remains useful however for high-level trend analysis, for example annual growth rates, in addition to observing the values with Purchasing Power Parity (PPP) adjustment.
The latest data shows increases in employment costs were consistent with previous year, when increases had continued to slow.
employment cost per ATCO hour
employment cost per ATCO hour
in continental in oceanic ANSPs saw metric increase
73%27%
ANSPs saw metric decrease
ANSPs saw metric increase83%17%
ANSPs saw metric decrease

8
CANSO Global Air Navigation Services Performance Report
ATCO Productivity Increases were Widespread
The ‘ATCOs in OPS hour productivity’ metric measures the productivity performance of ATCOs. It is the number of IFR flight hours controlled for every hour that an ATCO is in OPS.
The figures show that there has been widespread increases in productivity.
ATCO productivity hour
ATCO productivity hour
in continental
56% of ATCO productivity 2017-2018 increases were under 4%
in oceanic ANSPs saw metric increase
50%50%
ANSPs saw metric decrease
ANSPs saw metric increase76%24%
ANSPs saw metric decrease
Costs Excluding ‘ATCO in OPS Employment Costs per IFR Flight Hour’ Reduced for Most ANSPs
The ‘Costs excluding ATCO in OPS employment costs’ metric reflects the contribution that ANS costs, other than those related to ATCO in OPS employment or MET costs, make towards total cost per IFR flight hour. These are referred to as ‘other costs’, and include operating costs, depreciation or amortisation and costs of capital related to providing air traffic control services.
The data shows that for the majority of ANSPs costs excluding ‘ATCO in OPS employment costs per IFR flight hour’ decreased.
other costs per IFR flight hour
other costs per IFR flight hour
in continental in oceanic ANSPs saw metric increase
20%80%
ANSPs saw metric decrease
ANSPs saw metric increase46%54%
ANSPs saw metric decrease
For identified results supporting these key findings, see 2018 performance data section from page 25 onwards, and see page 46 for a summary of results.

9
CANSO Global Air Navigation Services Performance Report
2018 Industry Trends
Global passenger growth of
6.4%Slowing in air cargo growth,
3.4% compared to 9.7% in 2017
Passenger traffic in advanced economies grew
4.8% while passenger traffic in emerging economies grew
8.3%
Traffic at world’s 20 busiest air passenger hubs grew
4.7% last year, serving
17% of all global passenger traffic.
3.1% increase in aircraft movements
Passenger movements
Cargomovements =
Movement and passenger number growth resilient
RPK ASK 0.5% increase in Load Factor/ =
Demand rising faster than supplyRPK rising more than ASK
Increase in passenger numbers driven predominantly by
Asia Pacific region
Almost 50 million journeys added in China alone
Passenger numbers rose almost to 4.4 billion
18.5% India’s domestic market showed the fastest growth in passenger numbers, increasing by
and passenger load factor reached a record of 81.9%

10
CANSO Global Air Navigation Services Performance Report
Airline financial performance
2018 provided lower profits for airlines worldwide, collective net profit value of
USD 30 billioncompared to USD 38 billion in 2017
Global RPK
7.4%
Operating margins fell to
5.8%Oil prices rose more than 20% to peak at $76.41 on 3 Oct, but fell more than
40% by 24 Dec
Positive contribution to the wider economy
In 2018, air traffic movements contributed
USD 2.7 trillion to global GDP and supported
65 million jobs
Environmental impact
The average cost of transport was half that of two decades ago.
And since 2010 the carbon footprint per passenger has reduced by about
2.8% per year
Jet aircraft are over 80% more fuel efficient per seat kilometre than the first jets in 1960s

11
CANSO Global Air Navigation Services Performance Report
10-year Trends
In celebration of the tenth edition of the Global Air Navigation Services Performance Report, contributors shared their thoughts on some of the most significant ways their ANSPs have evolved over the past decade. Members also considered what changes they anticipate will occur in the next decade. Please note the views enclosed were collected before the rise of the COVID-19 pandemic – this may impact priorities going forward� This will be explored in future reports�
Looking Backwards
Despite traffic fluctuations resulting from the global economic downturn in 2008, the past decade has generally been characterised by traffic growth. In fact, the traffic increase across 2008 to 2018 was almost 50% in some European and Asian States. In parallel, there has been significant technological development in order to cope with such a large increase in traffic.
Most ANSPs focused on coping with the growth by implementing new technology, such as new ATM systems, modernising surveillance technology including ADS-B, implementation of GNSS technology and introducing performance based navigation (PBN) with associated NAVAID rationalisation. The implementation of new technology has been driven by the ICAO Global Air Navigation Plan (GANP) and ASBUs, with ASBU block 0 running from 2013 to 2018. This initiative has taken considerable steps to harmonising avionics capabilities and ATM ground infrastructure across the globe. This is set to continue with ASBU Block 1 running from 2019 to 2024.
The growth required not only new technologies, but significant staff increases by most of the ANSPs.
Many contributors acknowledge unique local factors which impacted their business. Responses ranged from government initiatives relating to transport strategy and changes in the ANSP’s legal status, through to natural disasters such as earthquakes.
Another important factor for European ANSPs has been the adoption of the second Single European Sky (SES) legislation package in 2009, which led to the adoption of the Performance and Charging Schemes. SES legislation also introduced ‘Functional Airspace Blocks’. The concepts paved the way for new technologies, while also enabling efficiencies in service provision, focus on capacity targets, as well as environment and safety.
Looking Forwards
Several ANSPs highlighted they are considering implementing remote/digital towers or introducing new ATM systems. ATM systems will incorporate more functions such as time based flow management (TBFM) or advanced conflict detection; in some cases these functions could evolve the human-machine interface, or enable increased automation of services.
Dynamic and flexible use of airspace together with satellite systems for surveillance and communication will also play a bigger role in the next decade, as uptake of these long-established concepts begins to increase.
Information management will also play a role in many of the new ATM systems, mainly to support interoperability. The deployment of System Wide Information Management (SWIM) is expected to accelerate in several regions.
Where technology cannot sufficiently increase productivity to meet traffic requirements, expanded infrastructure may be put in place. While some ANSPs note that their State’s airports are considering the reconstruction of taxiways and development of new runways, others highlight their own businesses are considering new operations centres. These will be supported by recruitment drives to enlarge operational teams.

12
CANSO Global Air Navigation Services Performance Report
New entrants to the market will present challenges. Increasing numbers of UAS will require a way to manage the traffic to preserve the safety of current airspace users and ensure their seamless integration into controlled airspace.
ANSPs recognise the gradual liberalisation of services is expected in some States, supported by digitalisation and automation. These changes will naturally have a significant impact on ATC provision in general.
The severity of the impact of COVID-19 on the aviation industry remains uncertain. The re-starting of the aviation industry, however, represents an opportunity to underpin future growth in the sector with a commitment to sustainability, productivity, efficiency, and safety, which ANSPs will aim to provide with the help of new technology.

13
CANSO Global Air Navigation Services Performance Report
ANSP Case Studies
The following case studies have been kindly provided by JANS, PANSA, KCAA and NAV CANADA. They provide an insight into measures these ANSPs have taken, within the last decade, to yield improvements in performance.
JANS The IFR flight hours in Fukuoka FIR increased by 40% in the eight years between 2011 and 2018, while the national budget, including employment cost for ATCOs, was significantly reduced in four years between 2011 to 2014 by national policy. As a result, we faced the difficult situation of having to deal with increasing traffic within the reduced budget. In order to get over this difficult situation, we increased the ability of ATCOs to handle more traffic by introducing new technologies such as improved ATC systems, revised flight route and introduction of PBN. In addition, we abolished unnecessary technology and combined terminal facilities in order to generate necessary budget for new effort.
These measures made it possible to cope with increasing traffic with minimal cost increase. As a result, we were able to reduce the other costs and increase ATCO productivity.
100.000.000
105.000.000
110.000.000
115.000.000
120.000.000
125.000.000
130.000.000
135.000.000
140.000.000
2011 2012 2013 2014 2015 2016 2017 2018
‘000
Yen
Employment costs for ATCOs in OPS Costs excluding employment costs for ATCOs in OPS
Figure 2 – JANS historical combined other and employment costs (‘000 Yen)
1.71
4.24
2
1.82
8.15
7
1.94
1.53
0
2.06
7.98
7
2.17
2.49
5
2.26
1.68
5
2.35
0.84
5
2.40
0.19
6
2.48
0.46
5
2.50
6.66
0
2.51
4.72
0
2.54
2.93
0
2.56
7.11
0
2.50
2.63
0
2.47
6.43
5
2.49
8.60
0
0,690,73
0,770,81
0,850,9
0,95 0,96
0
0,2
0,4
0,6
0,8
1
1,2
0
500.000
1.000.000
1.500.000
2.000.000
2.500.000
3.000.000
2011 2012 2013 2014 2015 2016 2017 2018
IFR flight hours ATCO hours ATCO productivity
Figure 3 – JANS historical ATCO productivity against IFR flight and ATCO hours
PANSAIn recent years, many factors have influenced PANSA’s performance. We have been observing a significant increase in the number of movements in the Polish airspace with a simultaneous decrease in the en-route ATFM delays generated by ATC.
At the same time the need for airspace users to avoid congested and military areas, areas affected by adverse weather conditions, as well as conflict areas (restrictions on Ukrainian airspace, which have been affecting Polish airspace since 2014), can have negative impact on environmental, capacity and cost efficiency performance.

14
CANSO Global Air Navigation Services Performance Report
When assessing productivity, which is one of the key indicators of measuring the performance of air navigation service provision, route extension (caused for example by the factors indicated above), can lead to an increase in productivity. ATCO productivity is directly linked to the air traffic.
In Poland, 2014-2018 CAGR for IFR flight hours was 4.5% and was higher than CAGR for the ATCOs in OPS hours, which amounted to 2.5%. This directly influenced the increase in the ATCOs in OPS hour productivity indicator which range from 0.75 in 2014 to 0.81 in 2018.
The remarkable ATCO-hour productivity increase observed for 2018 is mainly because traffic rose much faster than ATCO-hours on duty.
Improvements in ATCO-hour productivity can result from more effective OPS room management and by making a better use of existing resources, for example through the adaptation of shift times, effective management of overtime and through the adaptation of sector opening times to traffic demand patterns.
Similarly, advanced ATM system functionalities and procedures are drivers for productivity improvements.
413.
893
408.
509
432.
016
449.
902
493.
816
550.
197
549.
594
554.
036
574.
990
608.
240
0,75
0,74
0,78 0,78
0,81
0,7
0,72
0,74
0,76
0,78
0,8
0,82
0
100.000
200.000
300.000
400.000
500.000
600.000
700.000
2014 2015 2016 2017 2018
IFR flight hours ATCO hours ATCO productivity
Figure 4: ATCOs in OPS hour productivity at PANSA over the years 2014 – 2018

15
CANSO Global Air Navigation Services Performance Report
KCAATraffic levels have increased tremendously over the years in Kenya (+22% between 2015 and 2018). The country is well placed geographically, located at the equator and thus flights from north to south or east to west and vice-versa overfly our airspace. There has been the expansion of the African airlines which are flying more frequently in the region and also the rise of low-cost carriers in Kenya which are flying medium-sized aircrafts. In addition, there has been increased demand for local air travel that has seen small aerodromes upgraded to handle bigger aircraft, for example at Diani, necessitating the establishment of ATC services.
+16% 2017-18 Traffic levels +6% 2017-18
ATCO in OPS Productivity
Whilst KCAA has employed new ATCOs in OPS to meet demand (+9% in 2017-18), the ANSP is also targeting higher ATCO in OPS productivity by re-sectorisation of the airspace. This will enable KCAA to handle the increased traffic more efficiently. The benefits are demonstrated in our 2017-18 trends. Plans were underway prior to the COVID-19 pandemic to further re-sectorise the airspace to reduce ATCO workload. In addition, there has been constant recruitment of ATC cadets to go hand-in hand with the increase of traffic thus the increase of ATCO hours.
NAV CANADAIn the past decade, NAV CANADA has seen tremendous gains in technology, automation, infrastructure, and innovation that have contributed to increased ATCO productivity and system efficiency.
ATS Technology
In 2010, NAV CANADA completed the implementation of a new National Flight Data Processor. Aside from enabling automated hand-offs across the country, Canadian Automated Air Traffic System (CAATS) facilitated further automation, such as medium-term conflict detection (MTCD), controller-pilot data link communications (CPDLC) and electronic flight strips (EFS), enhancing user experience while advancing safety, efficiency, and productivity with increasing traffic demand.
NAVAID Modernisation
The improved accuracy, integrity, and availability of satellite navigation provides the opportunity to reduce the requirement for ground-based NAVAIDs. Leveraging this technology paves the way for more sophisticated airspace design and successful innovation.
Airspace Modernisation
Windsor-Toronto-Montreal Airspace (WTM) Redesign:This phased redesign was completed in 2015 and safely improved route segregation between inbound and outbound aircraft and reduced distances for many routes from the north and west. It enabled ATC to offer pilots more continuous climb opportunities, leading to a significant reduction in fuel costs and greenhouse gas emissions. The initial phase of WTM reduced flying time between Montreal and Toronto by 1.5 minutes per flight, reducing overall flying time in the corridor by over 10 hours daily.
Alberta Airspace and Services Project:Arrival and departure routings around Calgary International Airport were redesigned in 2014 to accommodate the new parallel runway. Airways north of Calgary were also adjusted to improve overall operational efficiency in the area, creating a safe, predictable design for all users.
16
CANSO Global Air Navigation Services Performance Report
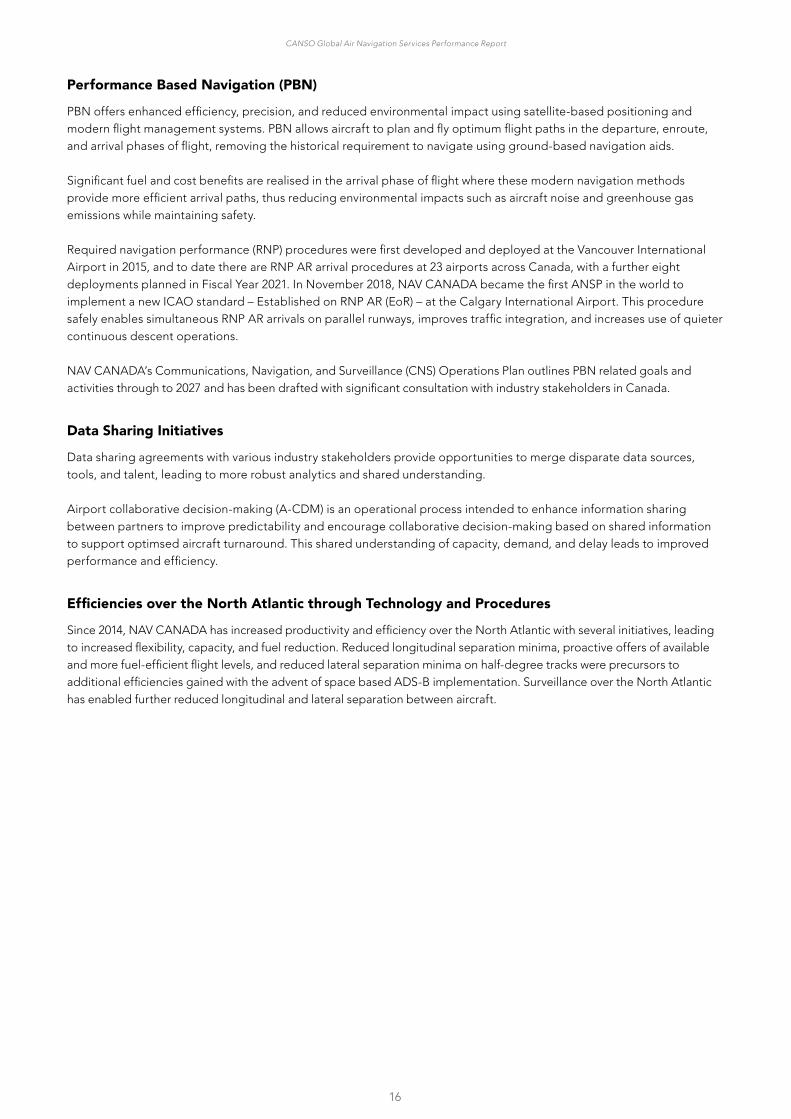
Performance Based Navigation (PBN)
PBN offers enhanced efficiency, precision, and reduced environmental impact using satellite-based positioning and modern flight management systems. PBN allows aircraft to plan and fly optimum flight paths in the departure, enroute, and arrival phases of flight, removing the historical requirement to navigate using ground-based navigation aids.
Significant fuel and cost benefits are realised in the arrival phase of flight where these modern navigation methods provide more efficient arrival paths, thus reducing environmental impacts such as aircraft noise and greenhouse gas emissions while maintaining safety.
Required navigation performance (RNP) procedures were first developed and deployed at the Vancouver International Airport in 2015, and to date there are RNP AR arrival procedures at 23 airports across Canada, with a further eight deployments planned in Fiscal Year 2021. In November 2018, NAV CANADA became the first ANSP in the world to implement a new ICAO standard – Established on RNP AR (EoR) – at the Calgary International Airport. This procedure safely enables simultaneous RNP AR arrivals on parallel runways, improves traffic integration, and increases use of quieter continuous descent operations.
NAV CANADA’s Communications, Navigation, and Surveillance (CNS) Operations Plan outlines PBN related goals and activities through to 2027 and has been drafted with significant consultation with industry stakeholders in Canada.
Data Sharing Initiatives
Data sharing agreements with various industry stakeholders provide opportunities to merge disparate data sources, tools, and talent, leading to more robust analytics and shared understanding.
Airport collaborative decision-making (A-CDM) is an operational process intended to enhance information sharing between partners to improve predictability and encourage collaborative decision-making based on shared information to support optimsed aircraft turnaround. This shared understanding of capacity, demand, and delay leads to improved performance and efficiency.
Efficiencies over the North Atlantic through Technology and Procedures
Since 2014, NAV CANADA has increased productivity and efficiency over the North Atlantic with several initiatives, leading to increased flexibility, capacity, and fuel reduction. Reduced longitudinal separation minima, proactive offers of available and more fuel-efficient flight levels, and reduced lateral separation minima on half-degree tracks were precursors to additional efficiencies gained with the advent of space based ADS-B implementation. Surveillance over the North Atlantic has enabled further reduced longitudinal and lateral separation between aircraft.

17
CANSO Global Air Navigation Services Performance Report
Methodology
Measuring PerformanceCost efficiency and productivity are two key indicators of measuring the performance of air navigation service provision. They demonstrate how ANSPs are delivering value and serve as indicators of operational efficiency. These KPIs are all part of the CANSO ANS Performance Framework (page 53).
Cost Efficiency
Cost efficiency provides an indication of the balance between operational effectiveness (i.e. ATCO productivity) and the cost of providing the service.
The simplest indicator of cost efficiency is the cost of providing ANS services per IFR flight hour. A lower cost per flight hour, however, is not necessarily indicative of greater overall performance.
Economic differences outside of the control of ANSPs can drive differences in costs. This includes labour contracts, salary scales and working conditions (such as hours), as well as government regulations on pension management and mandatory financial controls. Furthermore, ANSPs do not control the volume of traffic, which is a function of economic activity and other air passenger demands. Where a minimum level of service is required, there is a limit to how activities can be scaled down in response to lower demand.
Cost indicators do not reflect external factors, other performance areas or the quality of service. Moreover, there are costs associated with providing a safer and more punctual, predictable, and efficient service.
Costs are broken down into ATCOs in OPS employment and other costs. Other costs include operating costs (excluding ATCO in OPS employment costs), depreciation/amortisation and costs of capital related to providing ATC/ATFM services. They do not include MET costs.
Productivity
The key indicator of ANS productivity is IFR flight hours per ATCO in OPS hour, often described as ‘ATCO in OPS productivity’.
Although generally reflective of ANSPs’ performance, factors beyond the control of the ANSP can cause low levels of productivity – for example a geopolitical event that alters traffic demand.
ATCO in OPS productivity is driven by traffic levels and an ANSP’s ability to utilise its ATCOs in operations (OPS) resources. Although they cannot affect traffic demand, ANSPs may improve productivity by utilising flexible rostering and adapting airspace configuration to open and close sectors according to evolving traffic patterns.
Furthermore, advances in technology are now focusing more than ever on reducing the workload of ATCOs in OPS to enable them to safely manage higher levels of traffic in a given volume of airspace. Training associated with the introduction of technology, however, can lead to short-term reductions in productivity.
Airspace complexity also affects ATCO in OPS productivity. Lower airspace will typically have lower levels of ATCO in OPS productivity than upper airspace where aircraft are flying at more consistent altitudes and on non-crossing routes. Therefore, an ANSP operating a high proportion of sectors in lower airspace, or with numerous busy airports with complex approach sectors, is likely to have lower ATCO in OPS productivity than an ANSP with more overflights at higher altitude.

18
CANSO Global Air Navigation Services Performance Report
Key Performance Indicators
Indicator KPI Numerator Denominator Figure References
Cost Efficiency and Productivity Performance IndicatorsContinental Oceanic
2018 / Trend 2018
1 Cost per IFR flight hour Total Cost IFR flight hours Figure 5 Figure 15
2A ATCOs in OPS Employment cost per ATCO in OPS hour
Employment costs for ATCOs in OPS
ATCOs in OPS hoursFigure 6, Figure 7
Figure 16, Figure 17
2B ATCOs in OPS hour productivity IFR flight hours ATCOs in OPS hours Figure 8 Figure 18
2C Cost excluding ATCOs in OPS employment costs per IFR flight hour
Costs excluding employment costs for ATCOs in OPS
IFR flight hours Figure 9 Figure 19
2D Employment cost of ATCOs in OPS as a percentage of total costs
Employment cost for ATCOs in OPS
Total Costs Figure 10 Figure 20
3A Annual employment cost per ATCO in OPSEmployment cost for ATCOs in OPS
ATCOs in OPSFigure 11, Figure 12
3B Annual Working hours per ATCO in OPS ATCOs in OPS hours ATCOs in OPS Figure 13
3C Annual IFR hours per ATCO in OPS IFR flight hours ATCOs in OPS Figure 14
Joint Continental and Oceanic Cost Efficiency Performance IndicatorsContinental and Oceanic
2018/Trend
CO1 Cost per IFR flight hour Total Cost IFR flight hours Figure 21
CO2D Employment cost of ATCOs in OPS as a percentage of total costs
Employment cost for ATCOs in OPS
Total Cost Figure 22
Note that KPI CO1 is the combined continental and oceanic metric for KPI 1� Likewise, KPI CO2D is the combined continental and oceanic metric for KPI 2D�
Data ProcessingData collection: ANSPs who are members of the CANSO GBWG provided data for this analysis. ANSPs either submit the minimum dataset required for participation in the report (the basic data), or additional data to inform the analysis of trial KPIs (the advanced data).
ANSPs can also revise data submitted in previous years. The data submission workbook includes validation calculations that ANSPs are encouraged to consult in the data collection phase.
The entire dataset is available to all participating ANSPs to enable closer analysis and evaluation of performance trends. The advanced KPI dataset is only available to ANSPs submitting advanced data.
2018 performance data for European ANSPs has been kindly provided by EUROCONTROL, alongside data for the years 2014-2017 to facilitate historical trends analysis, which will be completed with the extended set of ANSPs to ensure validity of any trend analysis. European ANSP members of the CANSO GBWG, who also submit data to EUROCONTROL, will have their EUROCONTROL ACE data used in this analysis, unless otherwise agreed.
PRU data comparability: A key step to ensuring ATM Cost-effectiveness (ACE) Benchmarking Report (ACE) data is used and represented appropriately is to ensure that it is comparable with CANSO GBWG submission data. The CANSO GBWG, supported by Helios, assessed the comparability of ACE and CANSO data points. The analysis looked at both the wording of the definitions of analogous data points, and compared the data reported for European ANSPs participating in both processes. Comparable ACE data points were identified for all CANSO data points, which has enabled the calculation of all the KPIs in the GBWG KPI framework using the ACE data.

19
CANSO Global Air Navigation Services Performance Report
It should be noted that while the raw data extracted from the ACE report is directly comparable, the final KPIs expressed in the CANSO report are not directly comparable to those reported in the ACE report. This is because the KPIs use different inputs. In particular, CANSO uses IFR flight hours, whilst the ACE report used composite flight hours. Hence it should be noted that Indicator 2B ‘ATCO productivity’ of the CANSO ANS Performance Framework is not directly comparable to the ATCO productivity KPI used in the ACE report.
There remains uncertainty over whether ‘irrecoverable VAT’ and ‘payments for delegation of ANS’ should be included/excluded from CANSO Total Costs. Through consultation with European ANSPs it was noted that European ANSPs include these additional costs in their CANSO Total Costs submission. It remains unclear, however, whether non-European ANSPs have included these values in their Total Costs submission. For this report we have assumed that irrecoverable VAT and payments for delegation of ANS have been included in all CANSO Total Costs submissions. This issue will be addressed at the next GBWG meeting in October 2020.
European GBWG members have been allowed to request, with justification, to use the GBWG submission instead. For further details please see Global Air Navigation Services Performance Report 2020: Participation.
Data processing: Data has been processed by Helios subject to a data processing agreement with CANSO and in accordance with European data privacy laws. It was subject to a one-step quality check for significant changes, potential errors or omissions and is subject to continued revision by participating ANSPs.
Separation of continental and oceanic data: Information is provided both for continental and oceanic air navigation services, where applicable. Each of these environments has different challenges associated with providing ANS. For example, it is more straightforward to provide ground infrastructure for communications and surveillance services in continental airspace than it is over oceans.
Exchange rate conversion: ANSPs submit data in their chosen currency. For KPI comparison, data is presented in USD. 2018 KPI data is converted using exchange rates provided by each ANSP or using data available from the Organisation for Economic Co-operation and Development (OECD) website. Exchange rates for some countries are unavailable using OECD; International Monetary Fund (IMF) exchange rates have been used in such situations.
For ANSPs that operate in a currency other than the USD, the assumption of lower cost may be caused in part by the strengthening USD. Between 2014 and 2016, the USD appreciated against most other world currencies, meaning each USD buys more foreign currency. Despite a dip in 2017, the USD once again strengthened in 2018. This change in the relative value of the dollar effectively lowers the price that ANSPs incur in USD.
Growth rates: Data is presented from 2018 and then for the one-year and four-year trends. The trend over four years is calculated as the compound annual growth rate (4 yr CAGR). This shows the overall trend between 2014 and 2018, but masks the fluctuations that may have taken place over the intervening years. In addition, if 2014 was an outlier, this trend may not be representative of the trend over this timeframe. Individual ANSP results for 4 yr CAGR should therefore be interpreted alongside contextual information.
The trend analysis is presented above the 2018 KPI data and is based on the data submitted in the ANSP’s chosen currency.
Inflation: The growth rates are not adjusted for inflation, and local inflation rates should therefore be considered when interpreting AGR trends.
PPP correction: Salaries and the cost of living vary extensively around the world. One way to correct for this is by using purchasing power parity (PPP). Employment costs for ATCOs in OPS are corrected using IMF data. There are, of course, limitations to this approach, as the cost of living can vary widely within a country and may be higher or lower in the region where ANS offices are located.

20
CANSO Global Air Navigation Services Performance Report
Q1 and Q3: The first quartile (Q1) is defined as the middle number between the smallest number and the median of the data set. The third quartile (Q3) is the middle value between the median and the highest value of the data set. The average is the mean result.
Reporting PeriodsIn the previous edition of this report, Airways New Zealand updated their reference period to align it with their most recent report (i.e. moved from July 2015-June 2016 to July 2016-June 2017). This was to improve consistency with localised reporting and to provide more relevant benchmarking opportunities with other ANSPs.
While the GBWG encourages ANSPs with fiscal years that do not run between January and December to submit their most recent dataset, it is noted this is not possible for some providers due to data validation and availability. Readers are therefore encouraged to check reporting periods when comparing individual ANSPs. These are outlined within Table 2.
21
CANSO Global Air Navigation Services Performance Report
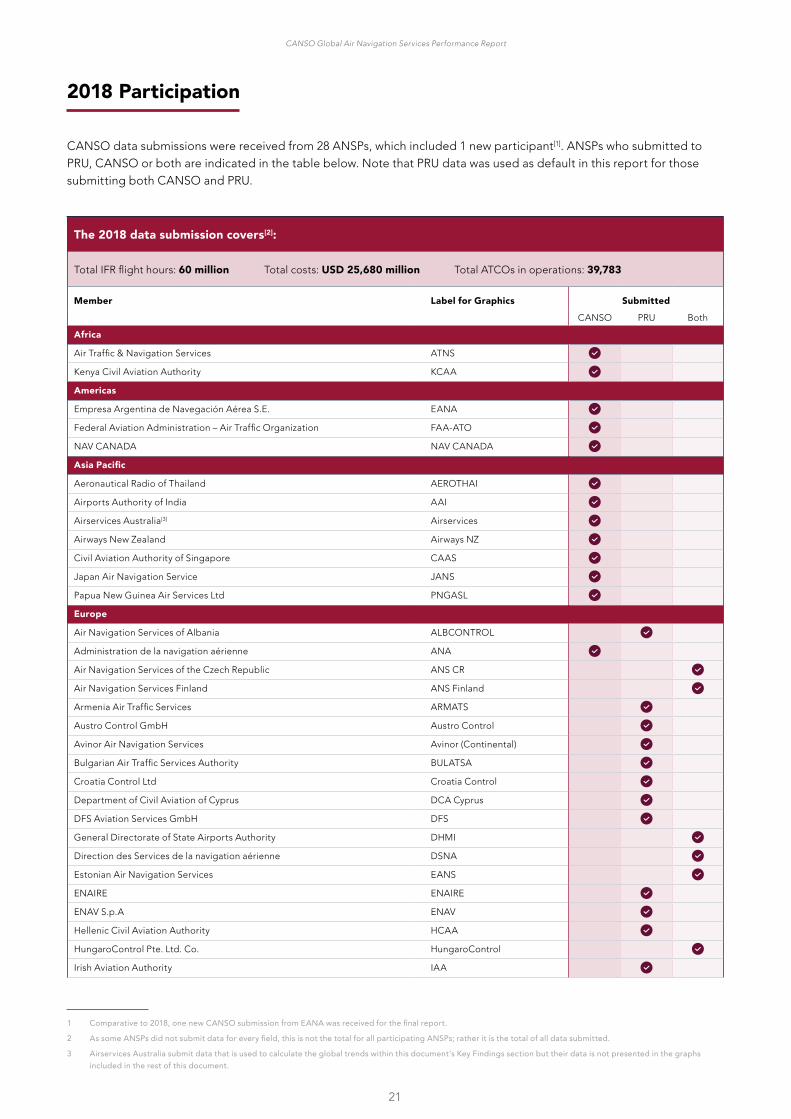
2018 Participation
CANSO data submissions were received from 28 ANSPs, which included 1 new participant[1]. ANSPs who submitted to PRU, CANSO or both are indicated in the table below. Note that PRU data was used as default in this report for those submitting both CANSO and PRU.
The 2018 data submission covers[2]:
Total IFR flight hours: 60 million Total costs: USD 25,680 million Total ATCOs in operations: 39,783
Member Label for Graphics Submitted
CANSO PRU Both
Africa
Air Traffic & Navigation Services ATNS
Kenya Civil Aviation Authority KCAA
Americas
Empresa Argentina de Navegación Aérea S.E. EANA
Federal Aviation Administration – Air Traffic Organization FAA-ATO
NAV CANADA NAV CANADA
Asia Pacific
Aeronautical Radio of Thailand AEROTHAI
Airports Authority of India AAI
Airservices Australia[3] Airservices
Airways New Zealand Airways NZ
Civil Aviation Authority of Singapore CAAS
Japan Air Navigation Service JANS
Papua New Guinea Air Services Ltd PNGASL
Europe
Air Navigation Services of Albania ALBCONTROL
Administration de la navigation aérienne ANA
Air Navigation Services of the Czech Republic ANS CR
Air Navigation Services Finland ANS Finland
Armenia Air Traffic Services ARMATS
Austro Control GmbH Austro Control
Avinor Air Navigation Services Avinor (Continental)
Bulgarian Air Traffic Services Authority BULATSA
Croatia Control Ltd Croatia Control
Department of Civil Aviation of Cyprus DCA Cyprus
DFS Aviation Services GmbH DFS
General Directorate of State Airports Authority DHMI
Direction des Services de la navigation aérienne DSNA
Estonian Air Navigation Services EANS
ENAIRE ENAIRE
ENAV S.p.A ENAV
Hellenic Civil Aviation Authority HCAA
HungaroControl Pte. Ltd. Co. HungaroControl
Irish Aviation Authority IAA
1 Comparative to 2018, one new CANSO submission from EANA was received for the final report.
2 As some ANSPs did not submit data for every field, this is not the total for all participating ANSPs; rather it is the total of all data submitted.
3 Airservices Australia submit data that is used to calculate the global trends within this document’s Key Findings section but their data is not presented in the graphs included in the rest of this document.

22
CANSO Global Air Navigation Services Performance Report
Isavia Ltd Isavia
Luftfartsverket LFV
Latvijas Gaisa Satiksme LGS
Letové prevádzkové služby LPS
Luchtverkeersleiding Nederland LVNL
Malta Air Traffic Services MATS
Macedonian Air Navigation Service Provider, GOJSC M-NAV
Moldovian Air Traffic Services Authority MOLDATSA[4]
Maastricht Upper Areal Control Centre MUAC
NATS Holdings NATS (Continental)
Navegação Aérea de Portugal – NAV Portugal, E.P.E. NAV Portugal (Continental)
Navigation Via Air (Denmark) NAVIAIR
SE Oro Navigacija Oro Navigacija
Polish Air Navigation Services Agency PANSA
Romanian Air Traffic Services Administration ROMATSA
Sakaeronavigatsia Ltd. Sakaeronavigatsia
skeyes skeyes
skyguide skyguide
Kontrola zračnega prometa Slovenije Slovenia Control
Serbia and Montenegro Air Traffic Services LLC Services llc Services SMATSA IIc
SMATSA
Ukrainian State Air Traffic Service Enterprise UkSATSE
Middle East
Saudi Air Navigation Services SANS
Table 1 – CANSO GBWG Public Report participation
4 MOLDATSA has been excluded from the performance graphs as their data points for several of the KPIs were identified outliers. Their KPI data, however, can be found in the Annex 4.

23
CANSO Global Air Navigation Services Performance Report
Table 2 – ANSP reporting periods. *Indicates an ANSP providing data from previous fiscal year[5].
AfricaATNS Apr 2017 – Mar 2018*
KCAA Jul 18 – Jun 19
AmericasEANA Jan 2018 – Dec 2018
FAA-ATO Oct 2017 – Sep 2018
NAV CANADA Sep 2017 – Aug 2018
Asia PacificAEROTHAI Oct 2017 – Sep 2018
AAI Apr 2018 – Mar 2019
Airservices Jul 2018 – Jun 2018
Airways NZ Jul 2018 – Jun 2019
CAAS Apr 2018 – Mar 2019
JANS Apr 2018 – Mar 2019
PNGASL Jan 2018 – Dec 2018
EuropeAlbcontrol Jan 2018 – Dec 2018
ANA Jan 2018 – Dec 2018
ANS CR Jan 2018 – Dec 2018
ANS Finland Jan 2018 – Dec 2018
ARMATS Jan 2018 – Dec 2018
Austro Control Jan 2018 – Dec 2018
Avinor (Continental) Jan 2018 – Dec 2018
BULATSA Jan 2018 – Dec 2018
Croatia Control Jan 2018 – Dec 2018
DCA Cyprus Jan 2018 – Dec 2018
DFS Jan 2018 – Dec 2018
DHMI Jan 2018 – Dec 2018
DSNA Jan 2018 – Dec 2018
EANS Jan 2018 – Dec 2018
ENAIRE Jan 2018 – Dec 2018
ENAV Jan 2018 – Dec 2018
HCAA Jan 2018 – Dec 2018
HungaroControl Jan 2018 – Dec 2018
IAA Jan 2018 – Dec 2018
Isavia Jan 2018 – Dec 2018
LFV Jan 2018 – Dec 2018
LGS Jan 2018 – Dec 2018
LPS Jan 2018 – Dec 2018
LVNL Jan 2018 – Dec 2018
MATS Jan 2018 – Dec 2018
M-NAV Jan 2018 – Dec 2018
MOLDATSA Jan 2018 – Dec 2018
MUAC Jan 2018 – Dec 2018
NATS (Continental) Jan 2018 – Dec 2018
NAV Portugal (Continental) Jan 2018 – Dec 2018
NAVIAIR Jan 2018 – Dec 2018
Oro Navigacija Jan 2018 – Dec 2018
PANSA Jan 2018 – Dec 2018
ROMATSA Jan 2018 – Dec 2018
Sakaeronavigatsia Jan 2018 – Dec 2018
skeyes Jan 2018 – Dec 2018
skyguide Jan 2018 – Dec 2018
Slovenia Control Jan 2018 – Dec 2018
SMATSA Jan 2018 – Dec 2018
UkSATSE Jan 2018 – Dec 2018
Middle EastSANS Jan 2018 – Dec 2018
Table 2 – ANSP reporting periods. *Indicates an ANSP providing data from previous fiscal year .
5 ANSP Legal Status has been excluded from this report due to the incompatibility of CANSO Legal Status and PRU Organisational and Corporate Arrangements definitions. These tables can be found on the CANSO Global-ATM-net for reference. The legal status categories will be rationalised through discussion with members at the next GBWG meeting in October 2020.

24
CANSO Global Air Navigation Services Performance Report
Table 3 – Participating ANSP’s IFR flight hours
ANSP
Total IFR Flight Hours 2018 (Continental)
Growth IFR Flight Hours (Continental)
Total IFR Flight Hours 2018 (Oceanic)
Growth IFR Flight Hours (Oceanic)
FAA-ATO 24,902,736 3% 2,128,699 2%AAI 3,745,683 13% NAV CANADA 3,173,491 5% 625,932 -3%DSNA 2,458,363 3% JANS 2,400,196 2% ENAIRE 1,580,352 6% NATS (Continental) 1,536,681 3% DFS 1,525,668 5% DHMI 1,472,252 9% ENAV 1,137,404 8% SANS 895,988 0% AEROTHAI 864,802 7% MUAC 667,869 4% HCAA 586,265 11% PANSA 493,816 11% CAAS 474,157 4% LFV 463,334 3% EANA 429,555 2% NAV Portugal (Continental) 421,475 3% ROMATSA 393,271 9% Avinor (Continental) 364,765 0% skyguide 360,044 5% Austro Control 324,460 8% IAA 315,776 1% BULATSA 291,109 12% ATNS 287,580 2% 11,566 16%HungaroControl 281,534 10% ANS CR 281,310 8% SMATSA 274,232 11% Airways NZ 264,866 4% 125,895 3%Croatia Control 241,385 10% NAVIAIR 224,099 2% DCA Cyprus 186,916 11% UkSATSE 184,292 16% LVNL 171,219 2% ANS Finland 124,274 10% skeyes 118,113 4% LPS 112,166 10% KCAA 89,088 16% LGS 88,953 9% MATS 85,571 12% PNGASL 80,407 -5% EANS 77,601 7% Oro navigacija 66,878 17% Slovenia Control 59,436 10% Sakaeronavigatsia 55,028 3% Albcontrol 43,860 6% Isavia 33,158 7% 293,430 7%M-NAV 32,424 13% ANA 26,075 ARMATS 18,313 22% MOLDATSA 12,452 14%
Table 3 – Participating ANSP’s IFR flight hours

25
CANSO Global Air Navigation Services Performance Report
2018 Performance Data
The following section presents 2018 performance data and 2014-2018 trend data for both continental and oceanic activities in line with the CANSO ANS Performance Framework levels 1-3 (page 6).

26
CANSO Global Air Navigation Services Performance Report
Continental Cost Efficiency and Productivity: 2018
2018 Continental – Cost Efficiency Indicator 1: Cost per IFR hour (USD)
Formula: Total costs / IFR flight hours
-1%-1%-1%1%-4%
-9%
1%
6%4%
-15%
-3%
4%
-4%-1%0%
22%
1%
-20%
8%
-7%-8%
-1%
7%
-6%
2%
-3%-2%
3%1%1%
-6%
7%
-3%0%
0%
-8%
13%
1%
-19%
-4%
27%
-5%
2%7%
1%
-13%
-6%
-13%
-30%
-20%
-10%
0%
10%
20%
30%
40%
2017-2018 AG 4 yr CAGR
0
500
1000
1500
2000
2500
AA
IA
ERO
THA
IA
irway
s N
ZA
lbco
ntro
lA
NA
AN
S C
RA
NS
Finl
and
ARM
ATS
ATN
SA
ustro
Con
trol
Avi
nor (
Con
tinen
tal)
BULA
TSA
CA
AS
Cro
atia
Con
trol
DC
AC
Cyp
rus
DFS
DH
MI
DSN
AEA
NA
EAN
SEN
AIR
EEN
AV
FAA
-ATO
HC
AA
Hun
garo
cont
rol
IAA
ISA
VIA
JAN
SKC
AA
LFV
LGS
LPS
LVN
LM
ATS
M-N
AV
MU
AC
NA
TS (C
ontin
enta
l)N
AV
CAN
AD
AN
av P
ortu
gal
(Con
tinen
tal)
NA
VIA
IRO
ro N
avig
acija
PAN
SAPN
GA
SLRO
MA
TSA
Saka
eron
avig
atsi
aSA
NS
skey
esSk
ygui
deSl
oven
ia C
ontro
lSM
ATS
A
2018 Avg Q1 Q3
Figure 5 – Cost per IFR flight hour (USD)
The 2018 average cost per IFR flight hour is USD 527. The 2018 average of those ANSPs that submitted data for 2018 and 2017 is USD 526 compared to USD 538 in 2017. Revenue expenditure and financial market conditions caused total costs to rise for some ANSPs, while changes in traffic impacted IFR flight hours.
It should be noted that differences between the operational characteristics of ANSPs’ airspaces may significantly influence their ‘Cost per IFR flight hour’. For example, skeyes and LVNL have delegated control of their upper airspace to MUAC. MUAC is therefore able to achieve a much lower ‘Cost per IFR flight hour’ due to differences in traffic characteristics (horizontal and speeds interactions are lower in upper airspace while traffic density is higher), in ground infrastructure (use of ground infrastructure managed by skeyes and LVNL) and in traffic type (absence of VFR flights in upper airspace). In contrast, skeyes and LVNL have a high value for this KPI because they do not control an area of upper airspace.

27
CANSO Global Air Navigation Services Performance Report
Specific ANSP comments are outlined below.
AAICosts increased for AAI due to ANS infrastructure investments and an increase in expenditure. IFR Flight Hours increased as forecasted due to an increase in total aircraft movements.
DHMIGrowth rates in total costs for DHMI were heavily influenced by high levels of inflation. The 2018 actual inflation rate of 20.30% exceeded the forecast (7.9%) by 12.40 points, meaning nearly triple the latest forecast. This significant development has been the result of the economic crisis and trade war and has led to an unexpected impact on costs.
The interest rate for 2018 was forecasted to be 11.19% but was actually 23.48%, an increase of 100.8%.
On the other hand, further to the increase (+42.8%) in the 2016-2017 period, the rapid and huge increase in the Euro/TRL exchange rate in 2018 (+61.5%), and cumulative more than +130%, has created a significant increase of real market prices in which the expenditures relating to air navigation services were made. These expenditures are exposed to an impact at three different levels:
• Expenditures directly linked to the exchange rate (multiplier)
• Expenditures linked indirectly to the exchange rate
• Expenditures still bound to market prices (but with no direct interaction with the exchange rate)
Bearing in mind that within an environment of an average inflation rate of 20.30%, interest rate of 23.48% and exchange rate increase of more than 130%, DHMI regards the increases in their costs as very modest under the macro-economic indicators as realised in the Turkish market.
HungaroControlHungaroControl experienced an increase in IFR flight hours in 2018. This was generated by traffic shifting to the south after the tragic event of the loss of the Malaysian flight over Ukraine, and also by the vigorous expansion of low-cost carriers (Wizzair, Ryanair, easyJet) in the East – and South-East Europe region. In addition, traffic levels from Germany to Turkish destinations were restored and traffic originating from Russia increased. Hungary is in the crossroad for traffic originating from the Scandinavian countries going to the traditional holiday destinations of Greece, Turkey and more recently to the Adriatic coast. In addition to the expansion of low-cost carriers, the number of charter traffic via Hungary also increased significantly.
LGSIn 2018 LGS saw an increase in IFR Flight hours. In addition, 9% of ATCOs were on maternity leave. This caused increases in total costs, other costs and ATCO employment costs.
28
CANSO Global Air Navigation Services Performance Report
NAV PortugalNAV Portugal experienced higher total costs than expected, mainly justified by the behaviour of the financial markets, which strongly affected the cost of the ANSP’s defined benefit pension funds. This contributed to a larger KPI 1.
PNGASLAn increase in the number of ATCOs has led to an increase in ATCO employment and therefore total costs.
SMATSAThe reason for the high percentage increase in IFR hours 2017-2018 was the increase in the total number of IFR flights controlled by the ANSP. There were 712,596 IFR flights in 2018 compared to 650,157 in 2017, an increase of 9.60%. There was consequently 274,232 IFR flight hours in 2018, compared to the year 246,294 IFR flight hours in 2017. This was the main drive for the decrease in SMATSA’s results for KPI 1.

29
CANSO Global Air Navigation Services Performance Report
2018 Continental – Cost Efficiency Indicator 2A: ATCOs in OPS employment cost per ATCO in OPS hour (USD)
Formula: ATCOs in OPS employment costs / ATCOs in OPS hours
Figure 6 – ATCOs in OPS employment cost per ATCOs in OPS hour (USD)
The 2018 average ATCOs in OPS employment cost per ATCOs in OPS hour is USD 104. The 2018 average of those ANSPs that submitted data for 2018 and 2017 is USD 104 compared to USD 101 in 2017. ANSPs commented that more ATCO hours had been needed to support extra traffic.
NAV PortugalStaff costs contribute the highest percentage to NAV Portugal’s costs. With a reduction in the number of ATCOs available, the ATCOs employment costs increase was mainly due to the mitigation measures implemented throughout the year to deal with the increase in traffic, while keeping ATFM delays under control. KPI 2A increased due to these expenses.
PNGASLATCO employment cost increased due to conditions in new labour agreements which require increased number of ATCOs. The value for KPI 2A therefore increased due to these expenses.

30
CANSO Global Air Navigation Services Performance Report
Indicator 2A: ATCOs in OPS employment cost per ATCO in OPS hour (USD) – PPP adjusted
Figure 7 – ATCOs in OPS employment cost per ATCOs in OPS hour, PPP adjusted (USD)
The 2018 average ATCOs in OPS employment cost per ATCOs in OPS hour, after PPP adjustment is USD 146. The 2018 average of those ANSPs that submitted for 2018 and 2017 is USD 147, an increase compared to USD 145 in 2017.

31
CANSO Global Air Navigation Services Performance Report
2018 Continental – Productivity Indicator 2B: ATCOs in OPS hour productivity
Formula: IFR flight hours / ATCOs in OPS hours
Figure 8 – ATCOs in OPS hour productivity
The 2018 average ATCOs in OPS hour productivity is 0.72. The 2018 average of those ANSPs that submitted for 2018 and 2017 is 0.72, an increase compared to 0.69 in 2017. This figure is influenced, in a similar manner to 2017, by the effect of traffic increasing quicker than ATCO hours for some ANSPs.

32
CANSO Global Air Navigation Services Performance Report
2018 Continental – Cost Efficiency Indicator 2C: Costs excluding ATCOs in OPS employment costs per IFR hour (USD)
Formula: Costs excluding ATCOs in OPS employment costs / IFR flight hours
Figure 9 – Cost excluding ATCOs in OPS employment costs per IFR flight hour (USD)
The 2018 average cost excluding ATCOs in operations employment cost per IFR flight hour is USD 379. In 2018, the average of those ANSPs that submitted data in both 2017 and 2018 is USD 381. This is a decrease from USD 389 for 2017.
For the same reasons stated in the description of Indicator 1 ‘Cost per IFR flight hour’, it should be noted that differences between the operational characteristics of ANSPs’ airspaces may significantly influence their ‘Costs excluding ATCOs in OPS employment costs per IFR hour’.

33
CANSO Global Air Navigation Services Performance Report
2018 Continental – Cost Efficiency Indicator 2D: Proportion of total costs made up of ATCO in OPS employment costs (USD)
Formula: ATCO in OPS employment costs/Total Costs
Figure 10 – Proportion of total costs made up of ATCO in OPS employment costs (USD)
The 2018 average for the proportion of total costs made up of ATCO in OPS employment costs is 0.3. This indicates that on average 30% of total continental ANS costs are spent on employing ATCOs in OPS. The 2018 and 2017 average of only the ANSPs that submitted for 2018 and 2017 is 0.29.

34
CANSO Global Air Navigation Services Performance Report
2018 Continental – Cost Efficiency Indicator 3A: Annual employment cost per ATCO in OPS (USD)
Formula: ATCOs in OPS employment costs / No. ATCOs in OPS
Figure 11 – Annual ATCO in OPS employment cost (USD)
The 2018 average unit ATCO in OPS employment cost is USD 153,448. The 2018 average of only the ANSPs that submitted for 2018 and 2017 is USD 153,305, an increase compared to USD 145,849 in 2017.
NAV PortugalReduced number of ATCOs led to increased costs from mitigation measures implemented across the year to deal with traffic increases, as stipulated in the comment under KPI 2A results.
PNGASLA new ATM system increased the capacity of the building for employment of an additional seven ATCO’s.

35
CANSO Global Air Navigation Services Performance Report
Indicator 3A: Annual employment cost per ATCO in OPS (USD) – PPP adjusted
Figure 12 – Annual ATCO in OPS employment cost (USD) – PPP adjusted
The 2018 average unit ATCO in OPS employment cost, after PPP adjustment, is USD 214,741. The 2018 average of only the ANSPs that submitted for 2018 and 2017 is USD 216,163 an increase compared to USD 207,832 in 2017.

36
CANSO Global Air Navigation Services Performance Report
2018 Continental – Productivity Indicator 3B: Annual Working hours per ATCO in OPS
Formula: ATCOs in OPS hours / No. ATCOs in OPS
Figure 13 – Annual Working hours per ATCO in OPS
The 2018 average annual working hours per ATCO in OPS is 1,541 hours. Differences in this metric are influenced by the number of staff working full time. The 2018 average of only the ANSPs that submitted for 2018 and 2017 is 1,542 hours an increase on the 2017 value of 1,528 hours.

37
CANSO Global Air Navigation Services Performance Report
2018 Continental – Productivity Indicator 3C: Annual IFR hours per ATCO in OPS
Formula: IFR flight hours / No. ATCOs in OPS
Figure 14 – IFR hours per ATCO in OPS
The 2018 average annual IFR hours per ATCO in OPS is 1,138 IFR flight hours per ATCO in OPS. The 2018 average of only the ANSPs that submitted for 2018 and 2017 is 1,150, an increase compared to 1,089 in 2017. The increase in this metric is likely related to the factors mentioned for the increase in KPI 2B.

38
CANSO Global Air Navigation Services Performance Report
Oceanic Cost Efficiency and Productivity: 2018
2018 Oceanic – Cost Efficiency Indicator 1: Cost per IFR flight hour (USD)
Formula: Total costs / IFR flight hours
-10%
-5%
0%
5%
10%
15%
PPeerrcc
eenntt
CChhaa
nnggee
((%%))
2017-2018 AG 4 yr CAGR
0
50
100
150
200
250
Air
way
s N
Z
FAA
-ATO
ISA
VIA
NA
V C
AN
AD
ACCooss
tt pp
eerr IIFF
RR ffllii
gghhtt
hhoouu
rr ((UU
SSDD))
2018 Avg
Figure 15 – Cost per IFR flight hour (USD)
The 2018 average cost per IFR flight hour is USD 97; for comparison, this figure for continental flights is USD 527. All ANSPs submitting oceanic data for 2018 did so for 2017; the 2017 average for these ANSPs was 95 USD.
FAA-ATOAn increase in total costs is driven primarily by depreciation/amortisation (oceanic) and adjustments made within our cost accounting system. FY2016 and FY2018 depreciation costs are more comparable, and the Operating costs (oceanic) remain consistent, even as IFR flight hours (oceanic) continue to rise.
The increase in depreciation/amortisation (oceanic) impacts multiple metrics, including the Cost per IFR flight hour (oceanic), Costs excluding ATCOs in OPS employment costs per IFR hour (USD), and Proportion of total costs made up of ATCO employment costs (USD).

39
CANSO Global Air Navigation Services Performance Report
Airways NZIn the reported year, responsibility for a sector of continental airspace was transferred from the Christchurch ACC to the Auckland ACC, which up to this point was predominately Oceanic operations.
The current data collection method does not allow for the separation of Continental ATCO in Ops hours and associated costs from the Auckland ACC as it is currently configured to be Oceanic reporting.
Some Continental costs and ATCO in Ops are therefore included within the Oceanic metrics but the Oceanic IFR flight hours figures are correct as they come from a separate data source.
Thus, the changes in Oceanic cost efficiency KPIs and the reduction in productivity KPIs throughout this and the following Oceanic charts are due to the current inability to exclude continental data from these figures.
It is anticipated in the following reporting year the data collection methods will be updated to separate the Continental components from the Oceanic for the Auckland ACC.
2018 Oceanic – Cost Efficiency Indicator 2A: ATCOs in OPS employment cost per ATCOs in OPS hour (USD)
Formula: ATCOs in OPS employment costs / ATCOs in OPS Hours
-10%
-5%
0%
5%
10%
15%
20%
25%
PPeerrcc
eenntt
CChhaa
nnggee
((%%))
2017-2018 AG 4 yr CAGR
0
20
40
60
80
100
120
140
160
180
Air
way
s N
Z
AT
NS
FAA
-ATO
ISA
VIA
NA
V C
AN
AD
A
AATTCC
OOss
iinn OO
PPSS ee
mmpp
llooyymm
eenntt
ccoosstt
ppeerr
AATTCC
OOss
iinn
OOPPSS
hhoouu
rr ((UU
SSDD))
2018 Avg
Figure 16 – ATCOs in OPS employment per ATCOs in OPS hour (USD)
The 2018 oceanic average employment cost per ATCO in OPS hour is USD 108, for comparison, the 2018 figure for continental airspace is USD 104. The 2017 average of only the ANSPs that submitted for 2018 and 2017 is USD 101.

40
CANSO Global Air Navigation Services Performance Report
Indicator 2A: ATCOs in OPS employment cost per ATCOs in OPS hour (USD) – PPP adjusted
-10%
-5%
0%
5%
10%
15%
20%
PPeerrcc
eenntt
CChhaa
nnggee
((%%))
2017-2018 AG 4 yr CAGR
0
20
40
60
80
100
120
140
160
180
Air
way
s N
Z
AT
NS
FAA
-ATO
ISA
VIA
NA
V C
AN
AD
A
AATTCC
OOss
iinn OO
PPSS ee
mmpp
llooyymm
eenntt
ccoosstt
ppeerr
AA
TTCCOO
ss iinn
OOPPSS
hhoouu
rr,, PP
PPPP aa
ddjjuu
sstteedd
((UUSSDD
))
2018 2018 PPP Avg
Figure 17 – ATCOs in OPS employment per ATCOs in OPS hour (USD) – PPP adjusted
The 2018 oceanic average employment cost per ATCO (PPP Adjusted) in OPS hour is USD 108, the average figure for continental airspace is USD 146. The 2017 average of only the ANSPs that submitted for 2018 and 2017 is USD 99.
41
CANSO Global Air Navigation Services Performance Report
2018 Oceanic – Productivity Indicator 2B: ATCOs in OPS hour productivity
(Formula: IFR flight hours / ATCOs in OPS Hours)
-20%
-10%
0%
10%
20%
30%
40%
PPeerrcc
eenntt
CChhaa
nnggee
((%%))
2017-2018 AG 4 yr CAGR
0
1
2
3
4
5
6
7
8
Air
way
s N
Z
AT
NS
FAA
-ATO
ISA
VIA
NA
V C
AN
AD
A
AATTCC
OOss
iinn OO
PPSS hh
oouurr
pprroo
dduucc
ttiivviittyy
2018 Avg
Figure 18 – ATCOs in OPS hour productivity
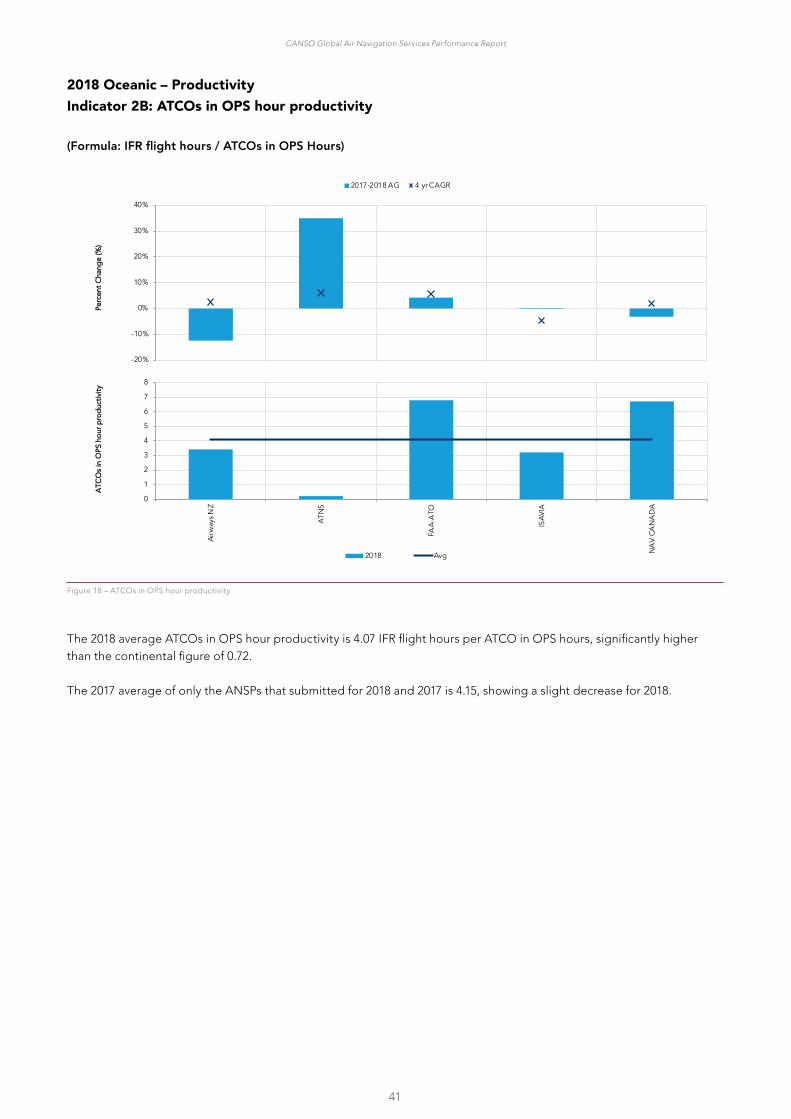
The 2018 average ATCOs in OPS hour productivity is 4.07 IFR flight hours per ATCO in OPS hours, significantly higher than the continental figure of 0.72.
The 2017 average of only the ANSPs that submitted for 2018 and 2017 is 4.15, showing a slight decrease for 2018.

42
CANSO Global Air Navigation Services Performance Report
2018 Oceanic – Cost Efficiency Indicator 2C: Costs excluding ATCOs in OPS employment costs per IFR hour (USD)
(Formula: IFR flight hours / ATCOs in OPS Hours)
-20%
-15%
-10%
-5%
0%
5%
10%
15%
20%
PPeerrcc
eenntt
CChhaa
nnggee
((%%))
2017-2018 AG 4 yr CAGR
0
20
40
60
80
100
120
140
160
Air
way
s N
Z
FAA
-ATO
ISA
VIA
NA
V C
AN
AD
A
CCooss
tt eexx
cclluudd
iinngg
AATTCC
OOss
iinn OO
PPSS ee
mmpp
llooyymm
eenntt
ccoosstt
ss pp
eerr IIFF
RR ffllii
gghhtt
hhoouu
rr ((UU
SSDD))
2018 Avg
Figure 19 – Cost excluding ATCOs in OPS employment costs per IFR flight hour (USD)
The 2018 average cost excluding ATCOs in operations employment cost per IFR flight hour is USD 68. The 2017 average of only the ANSPs that submitted for 2018 and 2017 is 69.
ATNS is not included on this graph, as it does not separately calculate costs for oceanic flights, and thus it is impossible to obtain an accurate picture of what the costs are – excluding ATCO in OPS costs – for oceanic service provision.
FAA-ATOAs alluded to under KPI 1 (oceanic), an increase in total costs in 2018 was driven primarily by depreciation/amortisation (oceanic). These costs fall under the costs excluding ATCOs in OPS employment costs bracket. The increase in KPI 2C (oceanic) reflects this change.
43
CANSO Global Air Navigation Services Performance Report
2018 Oceanic – Cost Efficiency Indicator 2D: Proportion of total costs made up of ATCO in OPS employment costs (USD)
Formula: ATCO in OPS employment costs/Total Costs
-15%
-10%
-5%
0%
5%
10%
15%
20%
25%
PPeerrcc
eenntt
CChhaa
nnggee
((%%))
2017-2018 AG 4 yr CAGR
0%
10%
20%
30%
40%
50%
60%
Air
way
s N
Z
FAA
-ATO
ISA
VIA
NA
V C
AN
AD
A
PPrroopp
oorrttiioo
nn ooff
ttoott
aall cc
oossttss
mmaadd
ee uupp
ooff AA
TTCCOO
eemm
pplloo
yymmeenn
tt ccoo
ssttss
((UUSSDD
))
2018 Avg
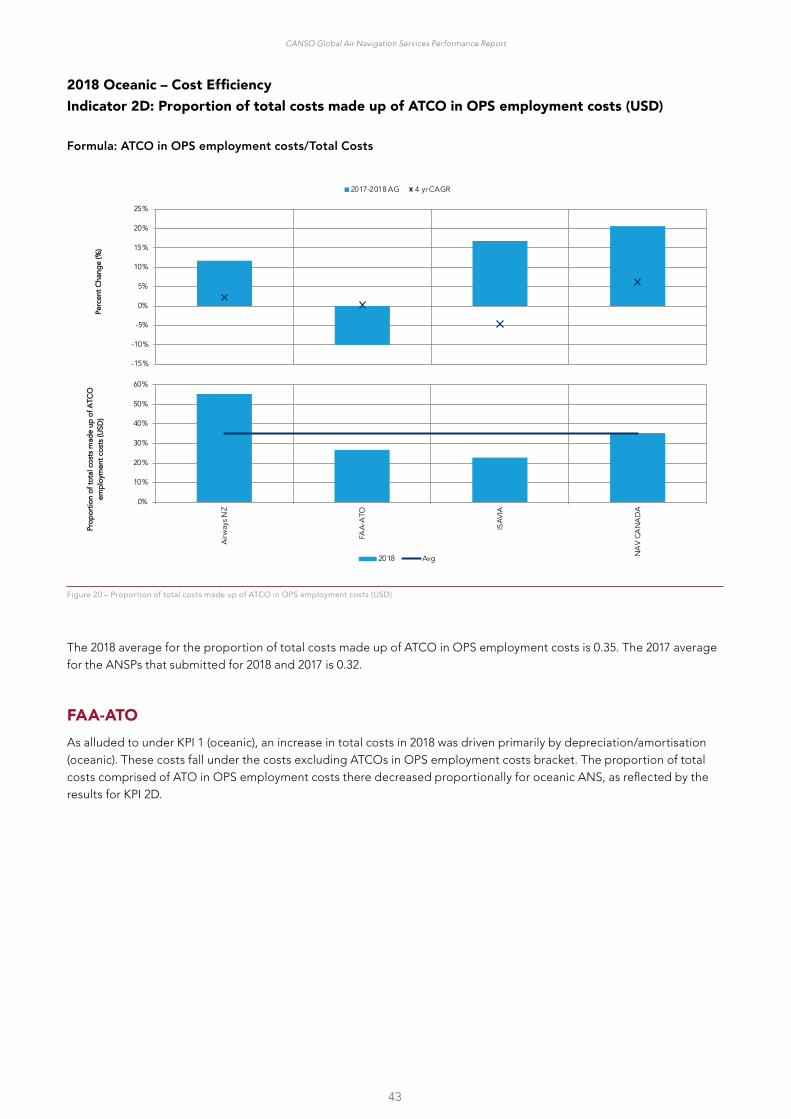
Figure 20 – Proportion of total costs made up of ATCO in OPS employment costs (USD)
The 2018 average for the proportion of total costs made up of ATCO in OPS employment costs is 0.35. The 2017 average for the ANSPs that submitted for 2018 and 2017 is 0.32.
FAA-ATOAs alluded to under KPI 1 (oceanic), an increase in total costs in 2018 was driven primarily by depreciation/amortisation (oceanic). These costs fall under the costs excluding ATCOs in OPS employment costs bracket. The proportion of total costs comprised of ATO in OPS employment costs there decreased proportionally for oceanic ANS, as reflected by the results for KPI 2D.
44
CANSO Global Air Navigation Services Performance Report
Joint Continental and Oceanic Cost Efficiency: 2018
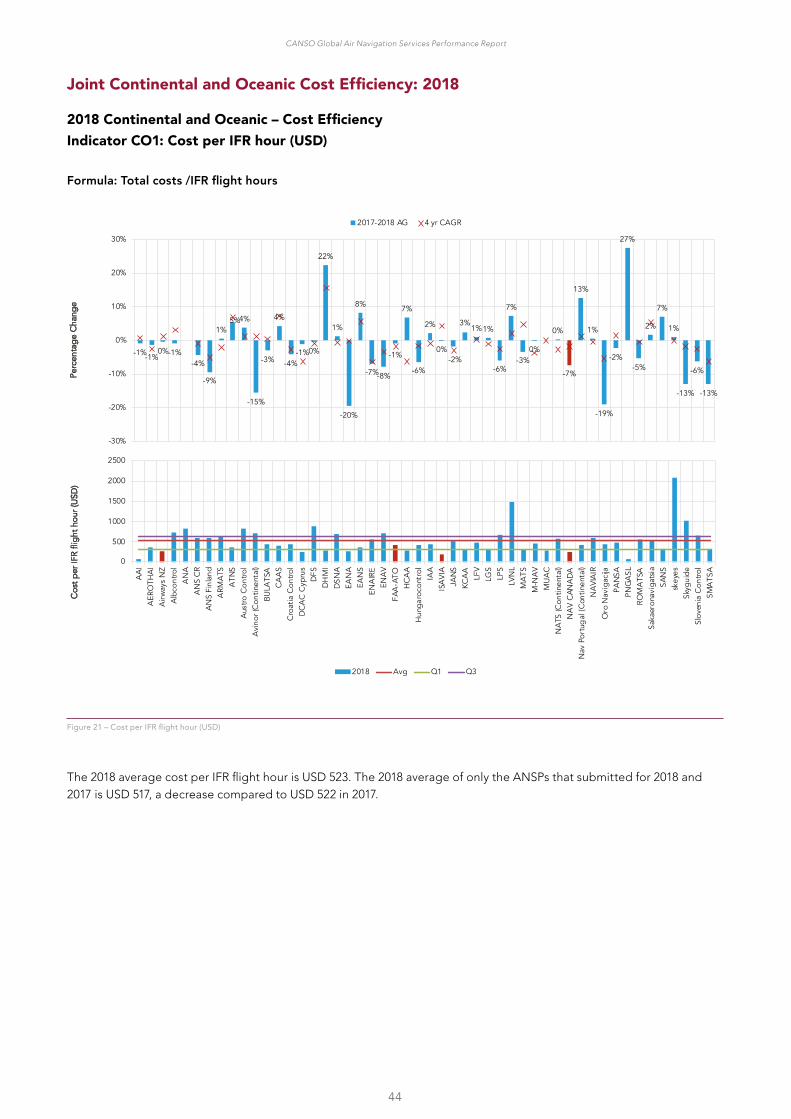
2018 Continental and Oceanic – Cost Efficiency Indicator CO1: Cost per IFR hour (USD)
Formula: Total costs /IFR flight hours
-1%-1%0%-1%
-4%
-9%
1%5%4%
-15%
-3%
4%
-4%-1%0%
22%
1%
-20%
8%
-7%-8%
-1%
7%
-6%
2%
0%-2%
3%1%1%
-6%
7%
-3%0%
0%
-7%
13%
1%
-19%
-2%
27%
-5%
2%
7%
1%
-13%
-6%
-13%
-30%
-20%
-10%
0%
10%
20%
30%
2017-2018 AG 4 yr CAGR
0
500
1000
1500
2000
2500
AA
IA
ERO
THA
IA
irway
s N
ZA
lbco
ntro
lA
NA
AN
S C
RA
NS
Finl
and
ARM
ATS
ATN
SA
ustro
Con
trol
Avi
nor (
Con
tinen
tal)
BULA
TSA
CA
AS
Cro
atia
Con
trol
DC
AC
Cyp
rus
DFS
DH
MI
DSN
AEA
NA
EAN
SEN
AIR
EEN
AV
FAA
-ATO
HC
AA
Hun
garo
cont
rol
IAA
ISA
VIA
JAN
SKC
AA
LFV
LGS
LPS
LVN
LM
ATS
M-N
AV
MU
AC
NA
TS (C
ontin
enta
l)N
AV
CAN
AD
AN
av P
ortu
gal
(Con
tinen
tal)
NA
VIA
IRO
ro N
avig
acija
PAN
SAPN
GA
SLRO
MA
TSA
Saka
eron
avig
atsi
aSA
NS
skey
esSk
ygui
deSl
oven
ia C
ontro
lSM
ATS
A
2018 Avg Q1 Q3
Figure 21 – Cost per IFR flight hour (USD)
The 2018 average cost per IFR flight hour is USD 523. The 2018 average of only the ANSPs that submitted for 2018 and 2017 is USD 517, a decrease compared to USD 522 in 2017.

45
CANSO Global Air Navigation Services Performance Report
2018 Continental and Oceanic – Cost Efficiency Indicator CO2D: Employment cost of ATCOs in OPS as a percentage of total costs
Formula: ATCOs in OPS employment costs / Total costs
Figure 22 – Employment cost of ATCOs in OPS as a percentage of total cost
The 2018 average employment cost of ATCOs in OPS as a percentage of total costs is 30%. The 2017 and 2018 average of only the ANSPs that submitted for 2018 and 2017 is 28%.

46
CANSO Global Air Navigation Services Performance Report
Summary of Performance Trends
Key Findings
• Increases in traffic continue to outweigh increases in costs in 2018
• Increases in employment costs were consistent with those recorded in 2017
• ATCO productivity increases were widespread
• Costs excluding ‘ATCO in OPS employment costs per IFR flight hour’ reduced for most ANSPs
Cost Efficiency
The inclusion of EUROCONTROL ACE data has allowed for an increased global representation on ANSP performance for the years 2014-2018, with the inclusion of data from 21 new ANSPs. The inclusion of this data shows that, on average, 2018 saw rising traffic and improving cost efficiency across the 57 providers. The observation that increases in traffic have outweighed increases in costs is aligned with the findings of this report over the last three years (2015-2017).
The majority of ANSPs saw a reduction in their ‘Costs excluding ATCO in OPS employment costs’ relative to traffic during 2018, which will have contributed to the observed improvement in cost efficiency. However, the effect of this reduction in other costs has been offset by increases in ATCO employment costs per IFR flight hour, with 73% of continental and 83% of oceanic service providers reporting increases in this metric.
Productivity
In line with what was observed for the past two years, ATCO productivity increases were widespread across ANSPs in 2018, with 76% of ANSPs reporting an increase in the KPI. It appears that the impact of increased traffic (2% increase in IFR flight hours across oceanic and continental service providers between 2017 and 2018), has driven ATCO productivity, since traffic rose faster than ATCO hours on duty.
It should be noted that other factors have played a part in increasing ATCO productivity in recent years, as indicated by the case studies kindly provided by JANS, PANSA, KCAA and NAVCANADA. These ANSPs highlighted their strategies to enhance productivity through operational changes and new technologies. This included improved ATC systems, the abolishment of old and unnecessary technology, and re-sectorisation. These initiatives proved to have a positive impact on ATCO productivity.
Cost-efficiency vs Productivity
The improving cost efficiency witnessed by service providers in 2018, despite increasing relative ATCO employment costs, suggests that the key drivers in this improvement have been the consistent ATCO in OPS productivity improvements paired with falling ‘Costs excluding ATCO in OPS employment costs’, in the face of significant traffic growth.
Future Performance
Looking forward, the impact of the COVID-19 pandemic on ANSP performance will become clear in the results of future reports. The trends of increasing ATCO productivity and cost efficiency observed in 2018 are likely to be reversed and strongly negative as traffic falls. ANSPs have been required to keep their airspace open, but with severely depleted traffic. The challenge will be to recover ATCO productivity sustainably and flexibly to enable ANSPs to react and adjust to change in traffic demand. CANSO hopes to use this report series alongside discussions within the GBWG as a tool to enable ANSPs to share strategies to achieve this.
If you are interested in participating in next year’s report or the CANSO GBWG, then please get in touch.

47
CANSO Global Air Navigation Services Performance Report
Related CANSO Benchmarking Activities
An appreciation of the work of other CANSO Workgroups allows for a greater understanding of the current initiatives and trends occurring across the aviation industry, contextualising the ANS performance analysis within this report. The following input has kindly been provided by the Safety Performance Measurement Workgroup (SPMWG).
Safety Performance Measurement Workgroup
Measuring Performance
ANSPs must consider numerous performance indicators, many of which are related and have interdependencies that need to be understood. CANSO is working with its membership to support the assessment of performance indicators that represent all aspects of ANSP performance.
Safety performance is an essential determiner of ANSP performance. ANSPs can learn a great deal from the assessment of safety performance and the active monitoring of safety trends. Cost-efficiency and productivity meanwhile are two key indicators used to demonstrate how ANSPs are delivering value and serve as indicators of operational efficiency.
Safety
Safety is critical for the trust and confidence of the flying public. CANSO measures key safety performance indicators to contribute to improvements in the safety and efficiency of air traffic control. Doing so in conjunction with the measurement of KPAs such as productivity and cost efficiency is valuable in furthering our understanding of the interdependencies between the three facets.
Safety and safety performance are measured in several ways, both through proactive indicators of the CANSO Standard of Excellence (SoE) in Safety Management Systems (SMS) and event-based indicators of loss of separation and runway incursions. This ensures that globally, ATM stakeholders understand how today’s safety performance drives tomorrow’s improvements – inspiring CANSO Members to be future-focussed.
Safety Performance
To ensure continuous improvement and active learning, safety and safety performance are measured in a multitude of ways in the areas of proactive indicators of the SoE in SMS, and event-based indicators. This is driven through the leadership of the CANSO Safety Performance Workgroup.
This group is CANSO’s global forum for championing safety measurement and continuous improvement of safety and safety performance. Consisting of representatives from ANSPs worldwide, this group analyses, advises on, and advances safety performance measurement.

48
CANSO Global Air Navigation Services Performance Report
Standard of Excellence in Safety Management Systems
This framework and corresponding Key Performance Measures are leading indicators enabling the measurement of maturity of an ANSP’s SMS to drive continuous improvement of safety and active learning. The framework is summarised below.
There are two key measures for SoE in SMS. One is the maturity score, which produces an overall score from 0-100% (a weighted average of the key elements of the SMS as seen above).
In 2019, 31 ANSPs completed the questionnaire and signed the Data Identification Agreement (DIA). Of these, 28 participated in both 2018 and 2019. The average score for these 28 ANSPs stands at 70.37%, a 1.19 percent point increase when compared to the 2018 average of 69.18.
This average shows that the core elements of safety management enabling safety performance are being addressed globally.

49
CANSO Global Air Navigation Services Performance Report
The second measure is the SMS maturity level. These levels are explained in the table below.
Of the total number of ANSPs that participated in 2019 (31), 52% are Level C or above (as a reference to the 28 ANSPs that participated in both years, 57% are level C or above). To obtain a particular level, an ANSP must achieve that level in all elements. The CANSO community continues to support and collaborate with all ANSPs to achieve a C-or-above level of maturity, as this is considered to exceed the standards outlined in ICAO Annex 19.
ATM Ground IFR-IFR Losses of Separation
A loss of separation is a Key Performance Indicator for assuring compliance with applicable separation standards. This measure focuses on IFR-IFR losses (both aircraft flying under instrument flight rules). There are multiple measures for safety performance, CANSO has prioritised this measure over others as a benchmark based on the risk profiling around potential loss of life.
In 2018, 39 ANSPs submitted data on the loss of separation rates. The annual average rate for these ANSPs were 92.99 IFR-IFR losses of separation per 1 million IFR flight hours and 4.62 per 100,000 IFR flights. Based on analysis by the Safety Performance Group, only 1% of reported losses were considered high risk, according to the RAT/RAP classification schemes.
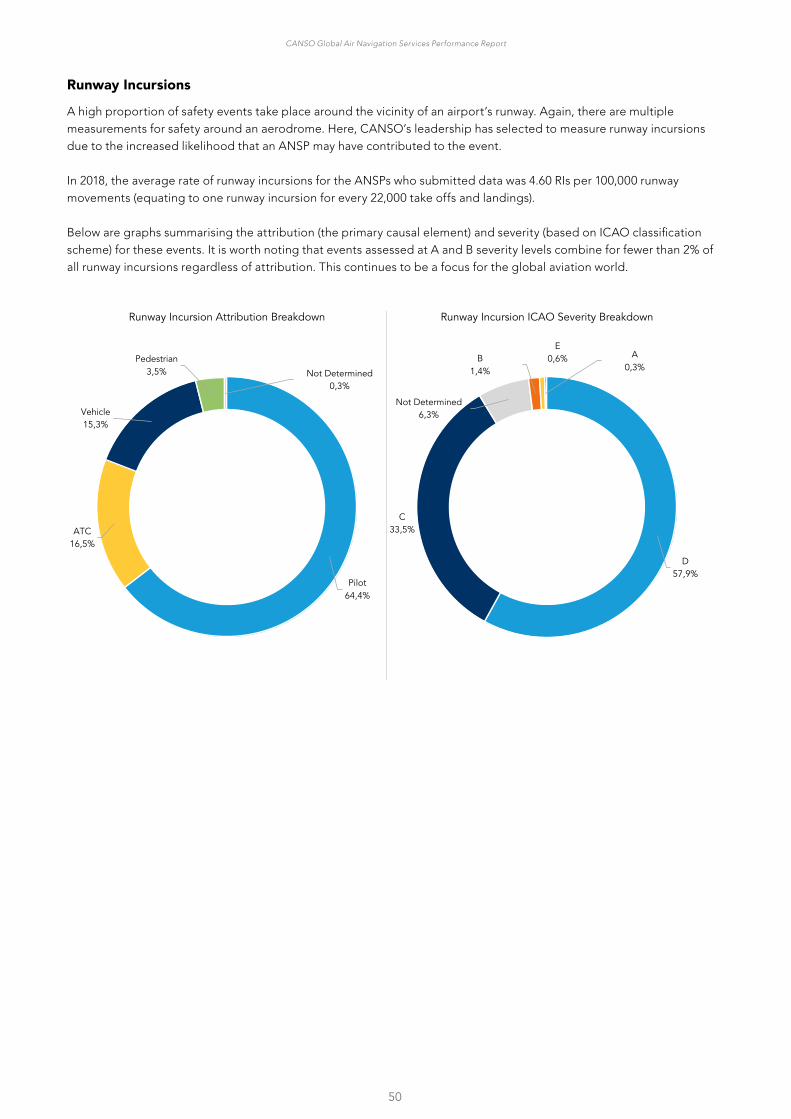
50
CANSO Global Air Navigation Services Performance Report
Runway Incursions
A high proportion of safety events take place around the vicinity of an airport’s runway. Again, there are multiple measurements for safety around an aerodrome. Here, CANSO’s leadership has selected to measure runway incursions due to the increased likelihood that an ANSP may have contributed to the event.
In 2018, the average rate of runway incursions for the ANSPs who submitted data was 4.60 RIs per 100,000 runway movements (equating to one runway incursion for every 22,000 take offs and landings).
Below are graphs summarising the attribution (the primary causal element) and severity (based on ICAO classification scheme) for these events. It is worth noting that events assessed at A and B severity levels combine for fewer than 2% of all runway incursions regardless of attribution. This continues to be a focus for the global aviation world.
Pilot64,4%
ATC16,5%
Vehicle15,3%
Pedestrian3,5% Not Determined
0,3%
Runway Incursion Attribution Breakdown
D57,9%
C33,5%
Not Determined6,3%
B1,4%
E0,6% A
0,3%
Runway Incursion ICAO Severity Breakdown

51
CANSO Global Air Navigation Services Performance Report
ICAO Severity Classification Scheme
Severity classification Description*
A A serious incident in which a collision is narrowly avoided.
BAn incident in which separation decreases and there is significant potential for collision, which may result in a time-critical corrective /evasive response to avoid a collision.
C An incident characterized by ample time and/or distance to avoid a collision.
DAn incident that meets the definition of runway incurs ion such as the incorrect presence of a single vehicle , person or aircraft on the protected area of a surface designated for the landing and take-off of aircraft but with no immediate safety consequences.
E Insufficient information or inconclusive or conflicting evidence precludes a severity assessment.
* Refer to Annex 13 for the definition of “incident”.
Conclusion
Although every ANSP’s performance is not represented, the participating ANSPs represent a majority of global air traffic; therefore, we feel confident this safety performance measurement data gives a high-level picture of overall industry performance.
There is an increase in the overall average of scores in the SoE in SMS; and for both IFR-IFR Losses of Separation and Runway Incursions, a very small percentage of those events have potential to lead to an event of high consequence.
In addition, over the past five years, participation in the CANSO Safety Performance Measurement Workgroup has increased consistently, which reflects the industry’s commitment to sharing data and peer learning.
All of these results demonstrate the achievement of a high level of safety and responsibility to continuous improvement that members of the ANS community pride themselves on.

52
CANSO Global Air Navigation Services Performance Report
Annex 1: Data Definitions
Contextual Data Element Definitions
Data Element Definitions
IFR hours per sq. km This is the result of dividing the number of IFR hours for the current year of data by surface area (in square kilometres).
Sq. km – oceanic and continental
The size (the surface area) of the airspace for which an ANSP is responsible. This should include the area where ANS have been delegated to the ANSP by another provider, and exclude the area in which ANS have been delegated to another ANSP. The sq. km here should be consistent with ACC coverage with respect to total area. Differentiation for facilities controlling only upper or lower airspace will be addressed by item 3 below. (Source: PRU D1).
% surveillance coverage @ 30,000ft radar and ADS-B only Surveillance coverage from radar and ADS-B.
% surveillance coverage @ 30,000ft radar, ADS-B and ADS-C only
Surveillance coverage from radar, ADS-B and ADS-C.
Number of FIRs A Flight Information Region is airspace of defined dimensions within which flight information service and alerting service are provided.
Number of ACC facilities ACC facilities are the ATC units providing ATC services to en-route traffic in control areas under its jurisdiction. Part of an ACC may also provide approach services.
Number of co-located ACC and approach facilities
An ACC unit is described above. An approach control unit is an ATC unit providing ATC services to arriving, departing and over-flying flights within the airspace in the vicinity of an airport.
Number of stand-alone approach facilities Definition of an approach control unit is above.
Number of co-located approach and tower facilities
Definition of an approach control unit is above. Tower facilities, or a tower control unit, is an ATC unit at an airport responsible for the provision of ATC services in respect of flights that are landing and taking off and other traffic that is on the active run-way(s).
Number of co-located approach, tower and ACC facilities For definitions see above.
Number of stand-alone towers Definition of a tower control unit is above.
Total CostsThe sum of operating costs, depreciation/amortisation and cost of capital related to providing continental and oceanic ATC/ATFM services. Meteorological costs and EUROCONTROL costs (if applicable) are not included.
IFR flight hours Total number of controlled IFR flight hours in continental and oceanic airspace.
ATCO hours Total annual working hours for ATCOs in operations – including breaks and overtime. Holiday is not included.
ATCO employment cost
Total employment costs including gross wages and salaries, payments for overtime and other bonuses, employer contribution to social security scheme and taxes, pension contributions and other benefits for ‘ATCOs in operations’. This excludes: mission related expenditures, including travel expenditures and training fees, as these are considered operating costs.
Other costs Total operating costs minus ATCO in OPS employment costs.
Number of ATCOsThe number of FTE ATCOs – whose employment costs were included in "ATCO employment cost" – participating in an activity that is either directly related to the control of traffic or is a necessary requirement for ATCOs to be able to control traffic.

53
CANSO Global Air Navigation Services Performance Report
Annex 2: Key Performance Indicators
The detailed metrics for determining the cost efficiency and productivity of continental and oceanic air navigation services are set out in Figure 1. These performance indicators are derived from the CANSO ANS Performance Framework.
Determining Performance Metrics
The CANSO ANS Performance Framework was established to create common performance indicators for global ANS data. Based on a tiered structure, the framework was developed in 2014 by the CANSO Global Benchmarking Workgroup (GBWG). It aims to demonstrate the drivers of cost efficiency.
Cost effectiveness KPI:Total Costs
IPR flight hours
1
Level 1
Proportion of total costs made up of ATCO in OPS employment costs
ATCO in OPS employment costs
Total Costs
2d
Annual employment cost per ATCO in OPS
Annual working hours per ATCO in OPS
Annual IFR hours per ATCO in OPS
ATCOs in OPS employment costs
No. ATCOs in OPS
ATCO in OPS hours
No .ATCOs in OPS
IFR flight hours
No .ATCOs in OPS
3a 3b 3c
Level 3
Level 2
ATCO employment cost per ATCO hour
ATCOs in OPS employment costs
ATCOs in OPS hours
ATCO hour productivity
2a 2b
ATCO in OPS costs
IFR flight hours
ATCOs in OPS hours
Other costs
Costs excl. ATCOs in OPS employment cost
IFR flight hours
Remaining operational costs
Remaining employment costs
ATCOs in non-OPS
Frontline staff
2c
Depreciation costs
Capital costs
Figure 24 – CANSO ANS Performance Framework
Over the years, the GBWG has worked to identify alternative KPIs to investigate the drivers of the KPIs in the framework, in particular KPI 2C. Last year, KPI 2D was added to framework to recognise the relative contribution of ATCO in OPS Employment costs to total ANS provision costs. It measures the contribution of ATCO employment costs to the total costs of service provision.
It is important to note the dependence of the higher tier metrics on the lower tier. This can be established as follows:
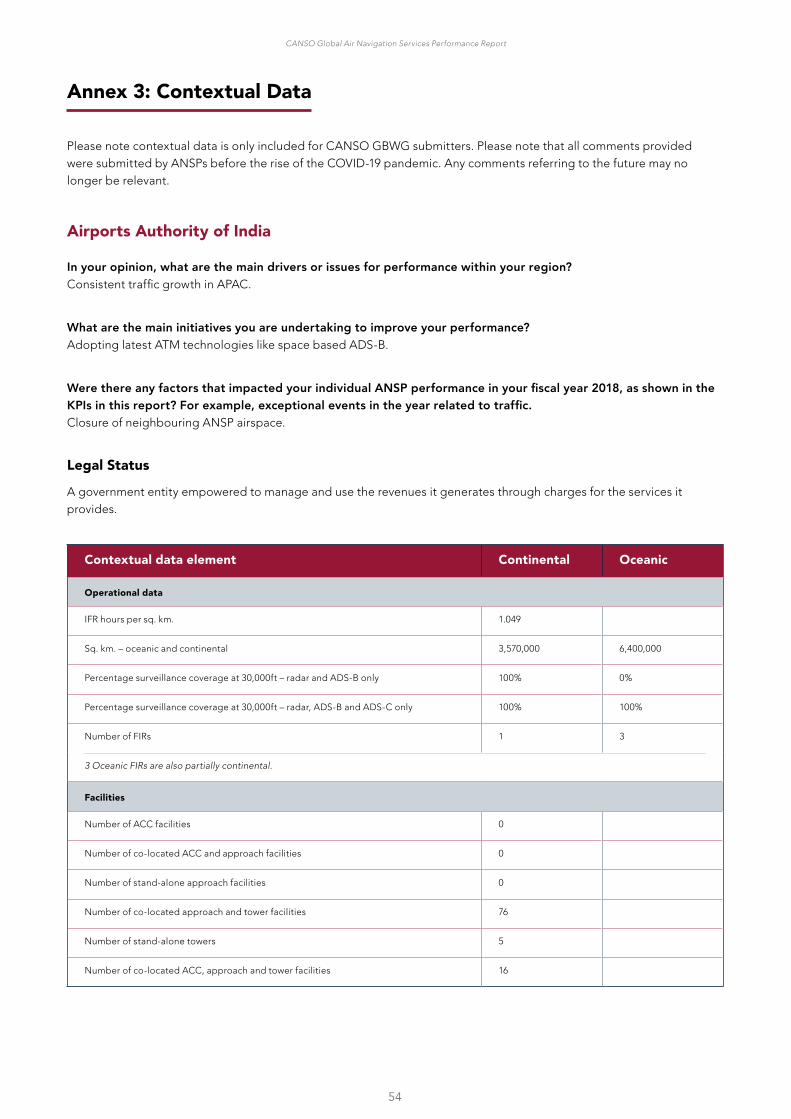
54
CANSO Global Air Navigation Services Performance Report
Annex 3: Contextual Data
Please note contextual data is only included for CANSO GBWG submitters. Please note that all comments provided were submitted by ANSPs before the rise of the COVID-19 pandemic. Any comments referring to the future may no longer be relevant.
Airports Authority of India
In your opinion, what are the main drivers or issues for performance within your region?Consistent traffic growth in APAC.
What are the main initiatives you are undertaking to improve your performance? Adopting latest ATM technologies like space based ADS-B.
Were there any factors that impacted your individual ANSP performance in your fiscal year 2018, as shown in the KPIs in this report? For example, exceptional events in the year related to traffic.Closure of neighbouring ANSP airspace.
Legal Status
A government entity empowered to manage and use the revenues it generates through charges for the services it provides.
Contextual data element Continental Oceanic
Operational data
IFR hours per sq. km. 1.049
Sq. km. – oceanic and continental 3,570,000 6,400,000
Percentage surveillance coverage at 30,000ft – radar and ADS-B only 100% 0%
Percentage surveillance coverage at 30,000ft – radar, ADS-B and ADS-C only 100% 100%
Number of FIRs 1 3
3 Oceanic FIRs are also partially continental�
Facilities
Number of ACC facilities 0
Number of co-located ACC and approach facilities 0
Number of stand-alone approach facilities 0
Number of co-located approach and tower facilities 76
Number of stand-alone towers 5
Number of co-located ACC, approach and tower facilities 16

55
CANSO Global Air Navigation Services Performance Report
AEROTHAI
Does your ANSP have stated objectives? If so, what are they?Yes. We have 10 strategic objectives supporting our vision of “a sustainable quality excellent air navigation service provider.”
In your opinion, what are the main drivers or issues for performance within your region?The demand for air travel in Asia Pacific region is growing faster than the development of the infrastructure needed to provide supporting service. This leads to the delay both on ground and in the air. The high demand also leads to higher workload and fatigue for ATCO in ops. However, productivity is improved due to the increasing number of IFR hours.
What are the main initiatives you are undertaking to improve your performance?AEROTHAI is investing in the new ATM system and in the process of transitioning which will be done by 2019. We are also working with ANSPs in Asia Pacific to develop and employ multi-nodal ATFM to improve air traffic flow within the region. We are also working with the Thai government and the military to improve the commercial use of Thai airspace.
Were there any factors that impacted your individual ANSP performance in your fiscal year 2018, as shown in the KPIs in this report? For example, exceptional events in the year related to traffic.ATCO in ops are training and working on transitioning to the new ATM system which leads to the increase in ATCO in ops hours.
Legal Status
A company established as a public-private partnership to provide the services on behalf of the government, and part-owned by the government.
Contextual data element Continental
Operational data
IFR hours per sq. km. 1.112
Sq. km. – oceanic and continental 777,760
Percentage surveillance coverage at 30,000ft – radar and ADS-B only 100%
Percentage surveillance coverage at 30,000ft – radar, ADS-B and ADS-C only 99.64%
Number of FIRs 1
Facilities
Number of ACC facilities 1
Number of co-located ACC and approach facilities 0
Number of stand-alone approach facilities 1
Number of co-located approach and tower facilities 6
Number of stand-alone towers 14
Number of co-located ACC, approach and tower facilities 0

56
CANSO Global Air Navigation Services Performance Report
Airways New Zealand
Does your ANSP have stated objectives? If so, what are they?Creating flexible and responsive operations with a focus on sustainability. Growing partnerships with tomorrows customers and suppliers eg. UAV and space based technologies. Establishing one centre, two locations concept. Implementing new ATM platform which will result in a single platform for both continental and oceanic operations replacing the current setup with two systems.
In your opinion, what are the main drivers or issues for performance within your region?Less predictability being experienced with customer schedule volatility and reactionary behaviour by customers to industry demands/trends. Emerging technologies eg. digital towers and the introduction of new fleet types eg 787-9 are also factors.
What are the main initiatives you are undertaking to improve your performance?Implemented a new rostering system and building a new ATM platform incorporating TBFM. Cross skilling of workforce, up skilling and re-sectorisation with Auckland/Wellington approach services to create commonality of services and resilience.
Were there any factors that impacted your individual ANSP performance in your fiscal year 2018, as shown in the KPIs in this report? For example, exceptional events in the year related to traffic.Commissioning of new control towers at Wellington and Nelson airports as well as other increases in CAPEX costs.
Legal Status
A corporatised entity with special status, not governed by normal commercial law but by a specific founding law or statute (and wholly owned by the government).
Contextual data element Continental Oceanic
Operational data
IFR hours per sq. km. 0.3069 0.0044
Sq. km. – oceanic and continental 863,100 28,790,000
Percentage surveillance coverage at 30,000ft – radar and ADS-B only 100% 100%
Percentage surveillance coverage at 30,000ft – radar, ADS-B and ADS-C only 100% 100%
Number of FIRs 1 1
Facilities
Number of ACC facilities 0 1
Number of co-located ACC and approach facilities 1 0
Number of stand-alone approach facilities 0 0
Number of co-located approach and tower facilities 7 0
The approach function for Queenstown tower was migrated to ACC in March 2019 but for this reported year was still reported as a co-located approach and tower facility�
Number of stand-alone towers 10 0
From next year’s report onwards, Queenstown tower will be reported as a stand-alone tower�
Number of co-located ACC, approach and tower facilities 0 0
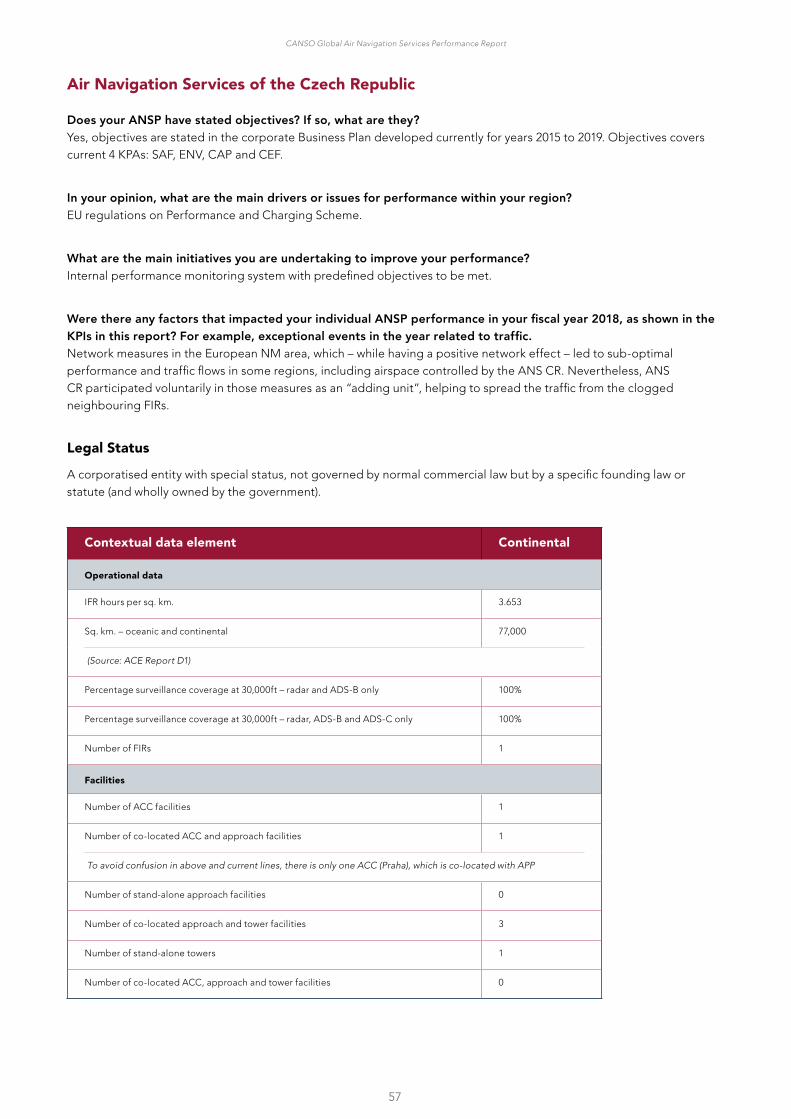
57
CANSO Global Air Navigation Services Performance Report
Air Navigation Services of the Czech Republic
Does your ANSP have stated objectives? If so, what are they?Yes, objectives are stated in the corporate Business Plan developed currently for years 2015 to 2019. Objectives covers current 4 KPAs: SAF, ENV, CAP and CEF.
In your opinion, what are the main drivers or issues for performance within your region?EU regulations on Performance and Charging Scheme.
What are the main initiatives you are undertaking to improve your performance?Internal performance monitoring system with predefined objectives to be met.
Were there any factors that impacted your individual ANSP performance in your fiscal year 2018, as shown in the KPIs in this report? For example, exceptional events in the year related to traffic.Network measures in the European NM area, which – while having a positive network effect – led to sub-optimal performance and traffic flows in some regions, including airspace controlled by the ANS CR. Nevertheless, ANS CR participated voluntarily in those measures as an “adding unit”, helping to spread the traffic from the clogged neighbouring FIRs.
Legal Status
A corporatised entity with special status, not governed by normal commercial law but by a specific founding law or statute (and wholly owned by the government).
Contextual data element Continental
Operational data
IFR hours per sq. km. 3.653
Sq. km. – oceanic and continental 77,000
(Source: ACE Report D1)
Percentage surveillance coverage at 30,000ft – radar and ADS-B only 100%
Percentage surveillance coverage at 30,000ft – radar, ADS-B and ADS-C only 100%
Number of FIRs 1
Facilities
Number of ACC facilities 1
Number of co-located ACC and approach facilities 1
To avoid confusion in above and current lines, there is only one ACC (Praha), which is co-located with APP
Number of stand-alone approach facilities 0
Number of co-located approach and tower facilities 3
Number of stand-alone towers 1
Number of co-located ACC, approach and tower facilities 0

58
CANSO Global Air Navigation Services Performance Report
Air Navigation Services Finland Oy
Does your ANSP have stated objectives? If so, what are they?SES Performance plan Finland.
In your opinion, what are the main drivers or issues for performance within your region?Customers’ needs and SES Performance plan Finland.
Were there any factors that impacted your individual ANSP performance in your fiscal year 2018, as shown in the KPIs in this report? For example, exceptional events in the year related to traffic.More traffic than expected.
Legal Status
A corporatised entity with special status, not governed by normal commercial law but by a specific founding law or statute (and wholly owned by the government). General Companies act is applied.
Contextual data element Continental
Operational data
IFR hours per sq. km. 0.302
Sq. km. – oceanic and continental 411,000
Percentage surveillance coverage at 30,000ft – radar and ADS-B only 100%
Percentage surveillance coverage at 30,000ft – radar, ADS-B and ADS-C only 100%
Number of FIRs 1
Facilities
Number of ACC facilities 1
Number of co-located ACC and approach facilities 1
Number of stand-alone approach facilities 0
Number of co-located approach and tower facilities 5
Number of stand-alone towers 15
Number of co-located ACC, approach and tower facilities 1
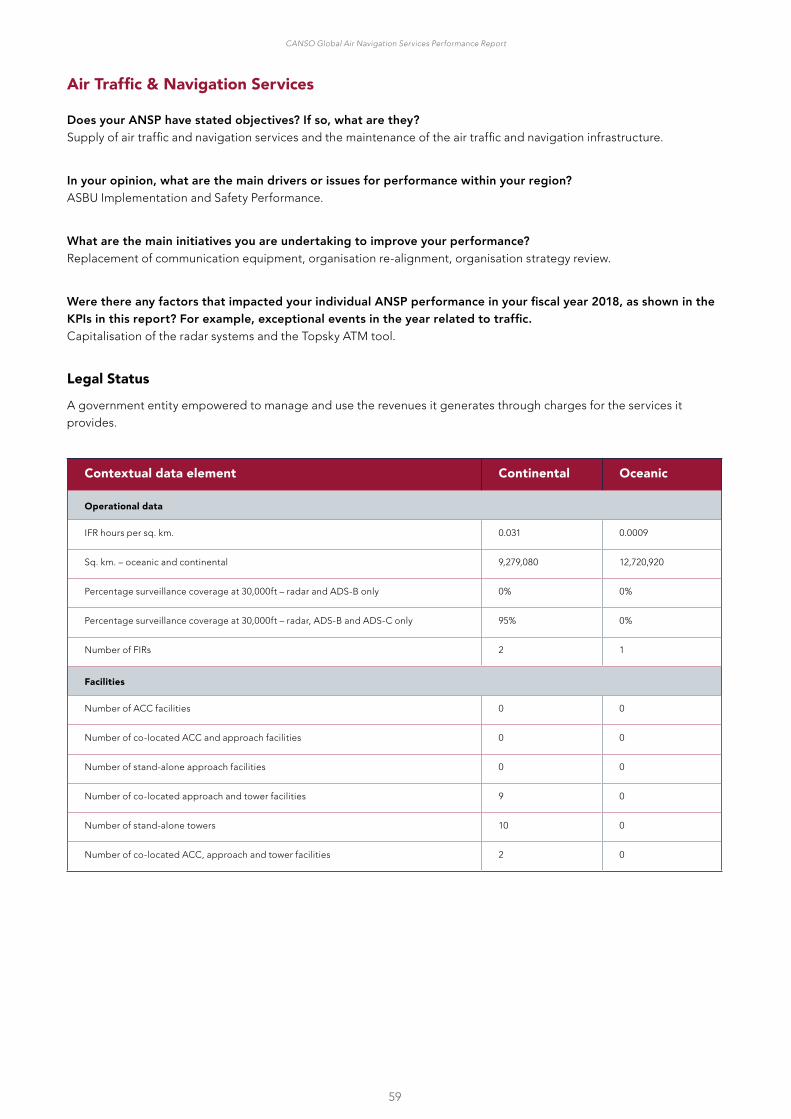
59
CANSO Global Air Navigation Services Performance Report
Air Traffic & Navigation Services
Does your ANSP have stated objectives? If so, what are they?Supply of air traffic and navigation services and the maintenance of the air traffic and navigation infrastructure.
In your opinion, what are the main drivers or issues for performance within your region?ASBU Implementation and Safety Performance.
What are the main initiatives you are undertaking to improve your performance?Replacement of communication equipment, organisation re-alignment, organisation strategy review.
Were there any factors that impacted your individual ANSP performance in your fiscal year 2018, as shown in the KPIs in this report? For example, exceptional events in the year related to traffic.Capitalisation of the radar systems and the Topsky ATM tool.
Legal Status
A government entity empowered to manage and use the revenues it generates through charges for the services it provides.
Contextual data element Continental Oceanic
Operational data
IFR hours per sq. km. 0.031 0.0009
Sq. km. – oceanic and continental 9,279,080 12,720,920
Percentage surveillance coverage at 30,000ft – radar and ADS-B only 0% 0%
Percentage surveillance coverage at 30,000ft – radar, ADS-B and ADS-C only 95% 0%
Number of FIRs 2 1
Facilities
Number of ACC facilities 0 0
Number of co-located ACC and approach facilities 0 0
Number of stand-alone approach facilities 0 0
Number of co-located approach and tower facilities 9 0
Number of stand-alone towers 10 0
Number of co-located ACC, approach and tower facilities 2 0

60
CANSO Global Air Navigation Services Performance Report
Civil Aviation Authority of Singapore
Legal Status
A government entity empowered to manage and use the revenues it generates through charges for the services it provides.
Contextual data element Continental
Operational data
IFR hours per sq. km. 0.5645
Sq. km. – oceanic and continental 840,000
Percentage surveillance coverage at 30,000ft – radar and ADS-B only 69%
Percentage surveillance coverage at 30,000ft – radar, ADS-B and ADS-C only 100%
Number of FIRs 1
Facilities
Number of ACC facilities 1
Number of co-located ACC and approach facilities 0
Number of stand-alone approach facilities 1
Number of co-located approach and tower facilities 0
Number of stand-alone towers 2
Number of co-located ACC, approach and tower facilities 0

61
CANSO Global Air Navigation Services Performance Report
Devlet Hava Meydanları İşletmesi Genel Müdürlüğü
Legal Status
A government entity empowered to manage and use the revenues it generates through charges for the services it provides.
Contextual data element Continental
Operational data
IFR hours per sq. km. 1.4992
Sq. km. – oceanic and continental 982,000
Percentage surveillance coverage at 30,000ft – radar and ADS-B only 100%
Percentage surveillance coverage at 30,000ft – radar, ADS-B and ADS-C only 100%
Number of FIRs 2
Facilities
Number of ACC facilities 2
Number of co-located ACC and approach facilities 3
Number of stand-alone approach facilities 0
Number of co-located approach and tower facilities 44
Number of stand-alone towers 0
Number of co-located ACC, approach and tower facilities 0

62
CANSO Global Air Navigation Services Performance Report
Administration de la navigation aérienne
Does your ANSP have stated objectives? If so, what are they?No.
In your opinion, what are the main drivers or issues for performance within your region?The main driver is the increased passenger and airline demand for the region. These numbers have grown between 4-7% each year for the last couple of years. During that time our airspace size, airport infrastructure and ATCO staff have not changed in a significant way. The management of this increase in traffic with the same infrastructure is the main challenge for us.
What are the main initiatives you are undertaking to improve your performance?We have recruited more ATCOs and are recruiting more in the coming years. We have undertaking a runway capacity study with EUROCONTROL and the infrastructure improvement recommendations have been forwarded to the aerodrome operator for implementation. A TMA capacity study is in the planning stage.
Were there any factors that impacted your individual ANSP performance in your fiscal year 2018, as shown in the KPIs in this report? For example, exceptional events in the year related to traffic.The increase in traffic that we have seen since 2016 has continued in 2018. It remained in line with the recent years. This has been expected and was planned.
Legal Status
A government department or authority that is subject to government accounting and treasury rules, and staff are employed under civil service pay and conditions.
Contextual data element Continental
Operational data
IFR hours per sq. km. 2.37
Sq. km. – oceanic and continental 4,000
Percentage surveillance coverage at 30,000ft – radar and ADS-B only 0%
Percentage surveillance coverage at 30,000ft – radar, ADS-B and ADS-C only 0%
Number of FIRs 1
Facilities
Number of ACC facilities 0
Number of co-located ACC and approach facilities 0
Number of stand-alone approach facilities 1
Number of co-located approach and tower facilities 1
Number of stand-alone towers 0
Number of co-located ACC, approach and tower facilities 0

63
CANSO Global Air Navigation Services Performance Report
Direction des Services de la navigation Aérienne
Legal Status
A government entity empowered to manage and use the revenues it generates through charges for the services it provides.
Contextual data element Continental Oceanic
Operational data
IFR hours per sq. km. 2.43
Sq. km. – oceanic and continental 1,010,000 15,437,214
For overseas, this covers New Caledonia, Tahiti, La Réunion, Saint Pierre, Cayenne and Antilles facilities�
Percentage surveillance coverage at 30,000ft – radar and ADS-B only 100% 1.88%
Percentage surveillance coverage at 30,000ft – radar, ADS-B and ADS-C only 100% 95.02%
Number of FIRs 5 2
Overseas TMA within foreign FIRs (French Antilles) are not taken into consideration
Facilities
Number of ACC facilities 5 0
Number of co-located ACC and approach facilities 0 0
Number of stand-alone approach facilities 0 0
Number of co-located approach and tower facilities 12 6
Number of stand-alone towers 74 4
Number of co-located ACC, approach and tower facilities 0 2

64
CANSO Global Air Navigation Services Performance Report
Empresa Argentina de Navegación Aérea
Does your ANSP have stated objectives? If so, what are they?Yes. It follows from strategic plan.
In your opinion, what are the main drivers or issues for performance within your region?Airport capacity, airspace capacity, coordination between stakeholders.
What are the main initiatives you are undertaking to improve your performance?Airspace re-design, introduction of KPI, COO for special events.
Were there any factors that impacted your individual ANSP performance in your fiscal year 2018, as shown in the KPIs in this report? For example, exceptional events in the year related to traffic.New LCC and increase of traffic, radio frequency interference.
Legal Status
A government entity empowered to manage and use the revenues it generates through charges for the services it provides.
Contextual data element Continental Oceanic
Operational data
IFR hours per sq. km. 0.0264
Sq. km. – oceanic and continental 16,300,000.0
No opening between continental and oceanic
Percentage surveillance coverage at 30,000ft – radar and ADS-B only 87% 2%
Percentage surveillance coverage at 30,000ft – radar, ADS-B and ADS-C only 87% 100%
Number of FIRs 5
Facilities
Number of ACC facilities 5
Number of co-located ACC and approach facilities 0
Number of stand-alone approach facilities 0
Number of co-located approach and tower facilities 51
Number of stand-alone towers 5
Number of co-located ACC, approach and tower facilities 0
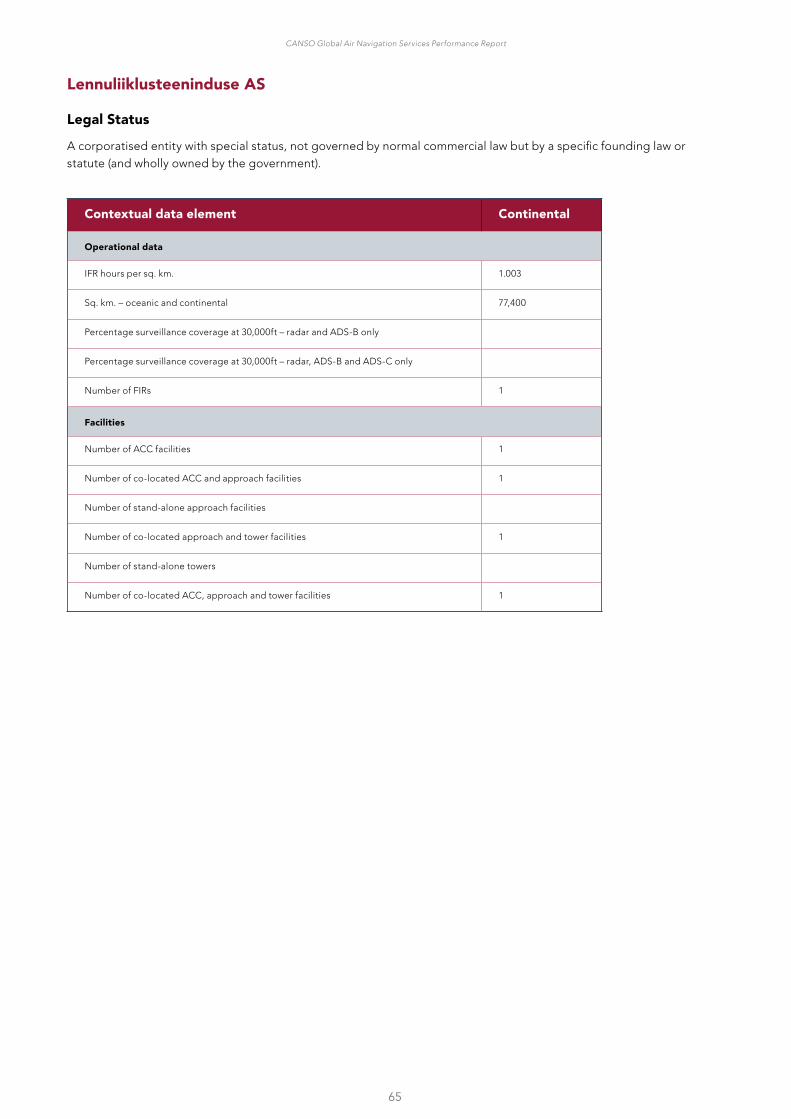
65
CANSO Global Air Navigation Services Performance Report
Lennuliiklusteeninduse AS
Legal Status
A corporatised entity with special status, not governed by normal commercial law but by a specific founding law or statute (and wholly owned by the government).
Contextual data element Continental
Operational data
IFR hours per sq. km. 1.003
Sq. km. – oceanic and continental 77,400
Percentage surveillance coverage at 30,000ft – radar and ADS-B only
Percentage surveillance coverage at 30,000ft – radar, ADS-B and ADS-C only
Number of FIRs 1
Facilities
Number of ACC facilities 1
Number of co-located ACC and approach facilities 1
Number of stand-alone approach facilities
Number of co-located approach and tower facilities 1
Number of stand-alone towers
Number of co-located ACC, approach and tower facilities 1

66
CANSO Global Air Navigation Services Performance Report
Federal Aviation Administration – Air Traffic Organization
Legal Status
A government department or authority that is subject to government accounting and treasury rules, and staff are employed under civil service pay and conditions.
Contextual data element Continental Oceanic
Operational data
IFR hours per sq. km. 1.6789 0.0351
Sq. km. – oceanic and continental 14,832,411 60,628,411
Percentage surveillance coverage at 30,000ft – radar and ADS-B only 100%
Percentage surveillance coverage at 30,000ft – radar, ADS-B and ADS-C only
Number of FIRs 21 5
Facilities
Number of ACC facilities 21
Number of co-located ACC and approach facilities 3
Number of stand-alone approach facilities 25
Number of co-located approach and tower facilities 132
Number of stand-alone towers 131
Number of co-located ACC, approach and tower facilities 1
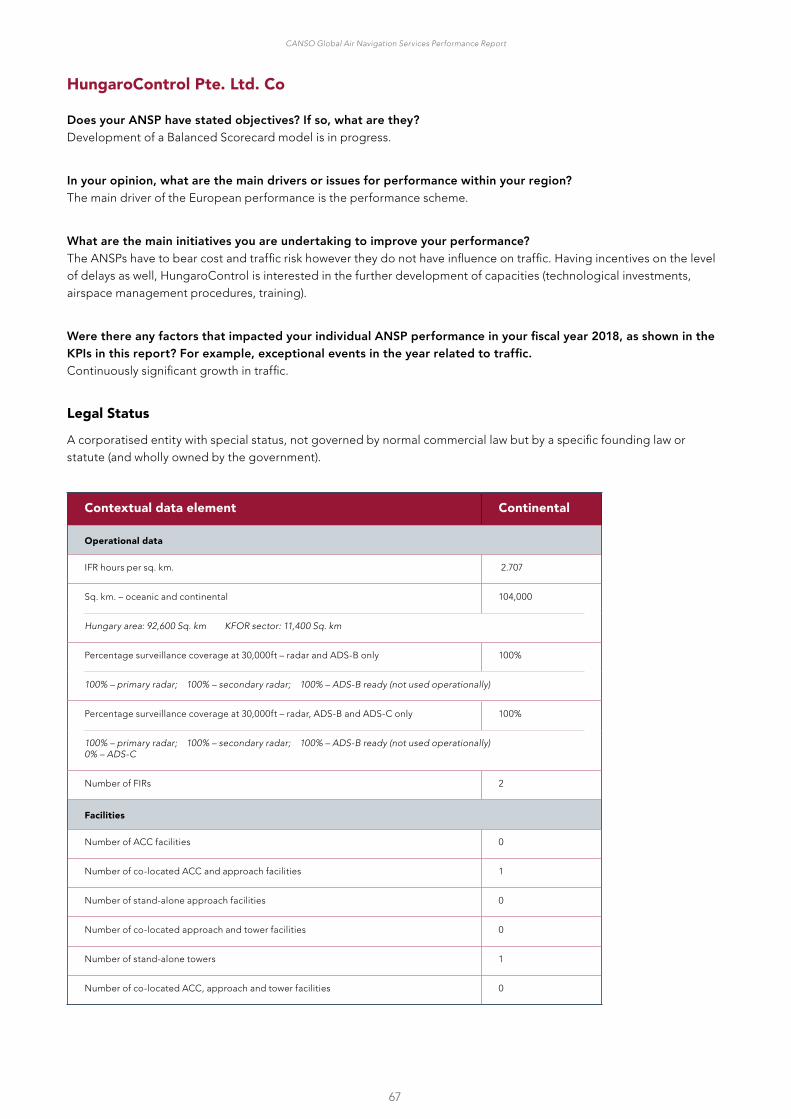
67
CANSO Global Air Navigation Services Performance Report
HungaroControl Pte. Ltd. Co
Does your ANSP have stated objectives? If so, what are they?Development of a Balanced Scorecard model is in progress.
In your opinion, what are the main drivers or issues for performance within your region?The main driver of the European performance is the performance scheme.
What are the main initiatives you are undertaking to improve your performance?The ANSPs have to bear cost and traffic risk however they do not have influence on traffic. Having incentives on the level of delays as well, HungaroControl is interested in the further development of capacities (technological investments, airspace management procedures, training).
Were there any factors that impacted your individual ANSP performance in your fiscal year 2018, as shown in the KPIs in this report? For example, exceptional events in the year related to traffic.Continuously significant growth in traffic.
Legal Status
A corporatised entity with special status, not governed by normal commercial law but by a specific founding law or statute (and wholly owned by the government).
Contextual data element Continental
Operational data
IFR hours per sq. km. 2.707
Sq. km. – oceanic and continental 104,000
Hungary area: 92,600 Sq� km KFOR sector: 11,400 Sq� km
Percentage surveillance coverage at 30,000ft – radar and ADS-B only 100%
100% – primary radar; 100% – secondary radar; 100% – ADS-B ready (not used operationally)
Percentage surveillance coverage at 30,000ft – radar, ADS-B and ADS-C only 100%
100% – primary radar; 100% – secondary radar; 100% – ADS-B ready (not used operationally) 0% – ADS-C
Number of FIRs 2
Facilities
Number of ACC facilities 0
Number of co-located ACC and approach facilities 1
Number of stand-alone approach facilities 0
Number of co-located approach and tower facilities 0
Number of stand-alone towers 1
Number of co-located ACC, approach and tower facilities 0
68
CANSO Global Air Navigation Services Performance Report
Isavia Ltd
Does your ANSP have stated objectives? If so, what are they?Isavia works actively and consistently towards the following:
• Ensuring good aviation services in Iceland and performing its role in society in a safe and efficient manner
• Promoting employee satisfaction and a good working environment
• Developing an operation that is sustainable in the long term in co-operation and consultation with customers and other stakeholders
• Treating the environment in a responsible and sustainable manner, reducing the company’s carbon footprint and thereby contributing to the reduction of its environmental impact
• Publishing information on CSR in accordance with the UN Global Compact principles and GRI
In your opinion, what are the main drivers or issues for performance within your region?Traffic variability can be a factor due to shifting jet streams. We hope to continue providing the same high level of service despite the substantial rise in traffic over the past few years. Maintaining a suitable operational balance has been one of our key challenges and so far we have managed to do so without incurring excessive operational costs or decreasing our level of service.
What are the main initiatives you are undertaking to improve your performance?• We are collaborating with our transport authority regarding the implementation of a comprehensive performance
scheme that will provide us with key information and figures regarding cost-efficiency, capacity, environment and safety. We hope to maintain and build upon our current high level of service to ensure that as our operations grow we continue to provide a safe, cost effective, efficient and environmentally sustainable service to our customers
• On January 3 2019, Isavia‘s air navigation services implemented the fourth of seven steps in the Borealis Alliance Free Route Airspace (FRA) Programme, completing Isavia‘s FRA project. When fully implemented, the Borealis Alliance FRA Programme will enable airline and business aviation customers to plan and take the most cost effective, fuel efficient and timely routes across the entire airspace managed by Borealis Alliance members saving time, money and fuel
• Isavia´s Air Navigation Division has implemented sector changes to improve traffic capacity without having to rely on the addition of further resources. Since implementation in March of 2018 traffic capacity has gone up by 14%
• Isavia and its subsidiaries are currently developing new ATM software that will bring a number of improvements with regard to safety and ATCO performance
Were there any factors that impacted your individual ANSP performance in your fiscal year 2018, as shown in the KPIs in this report? For example, exceptional events in the year related to traffic.No.
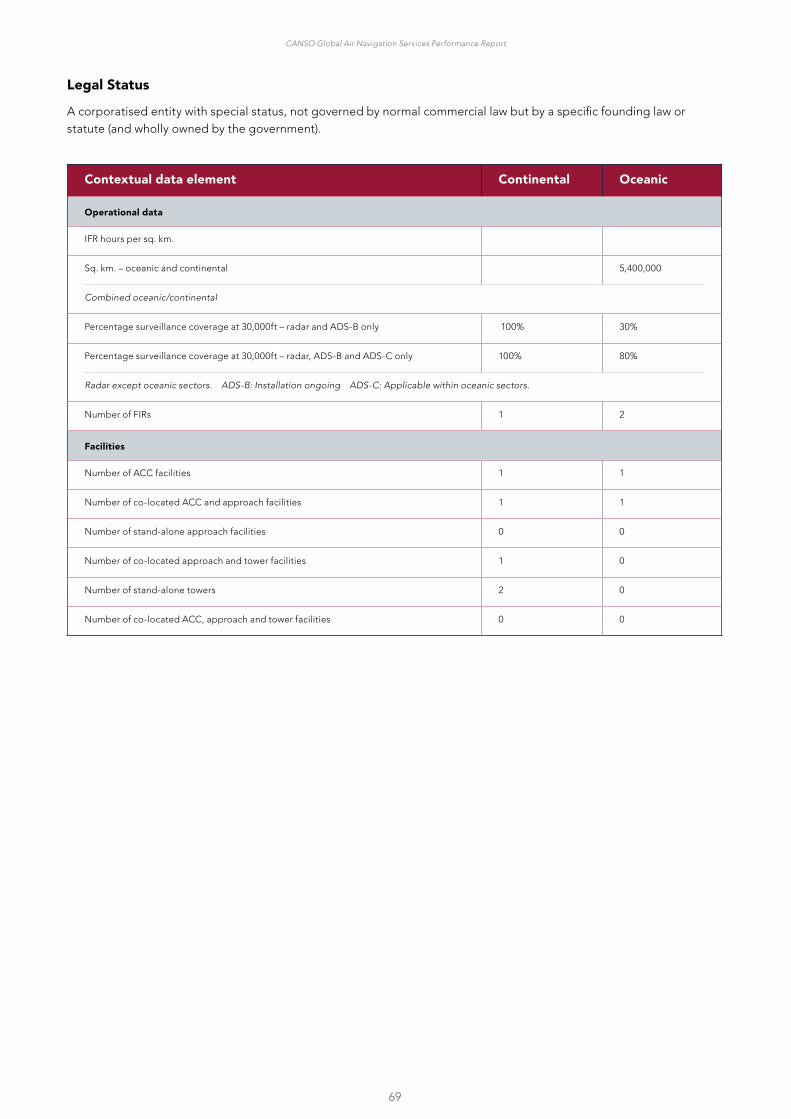
69
CANSO Global Air Navigation Services Performance Report
Legal Status
A corporatised entity with special status, not governed by normal commercial law but by a specific founding law or statute (and wholly owned by the government).
Contextual data element Continental Oceanic
Operational data
IFR hours per sq. km.
Sq. km. – oceanic and continental 5,400,000
Combined oceanic/continental
Percentage surveillance coverage at 30,000ft – radar and ADS-B only 100% 30%
Percentage surveillance coverage at 30,000ft – radar, ADS-B and ADS-C only 100% 80%
Radar except oceanic sectors� ADS-B: Installation ongoing ADS-C: Applicable within oceanic sectors�
Number of FIRs 1 2
Facilities
Number of ACC facilities 1 1
Number of co-located ACC and approach facilities 1 1
Number of stand-alone approach facilities 0 0
Number of co-located approach and tower facilities 1 0
Number of stand-alone towers 2 0
Number of co-located ACC, approach and tower facilities 0 0

70
CANSO Global Air Navigation Services Performance Report
Japan Air Navigation Service
Does your ANSP have stated objectives? If so, what are they?We have stated objectives such as: Enhance aviation safety; expand air navigation capacity to meet ever increasing air traffic volume; improve convenience through upgrading efficiency of aviation services; increase efficiency of operation including cost reductions; enhance efficiency of air navigation services; and focus on environmental consciousness such as CO2 emissions reduction and noise abatement.
In your opinion, what are the main drivers or issues for performance within your region?Functional enhancement of the Tokyo metropolitan airports toward the Tokyo Olympic and Paralympic Games to be held in 2020.
What are the main initiatives you are undertaking to improve your performance?1. Introduction of Integrated Air Traffic Control Data Processing System
2. Enhancement of capacity and efficiency of the Tokyo metropolitan airports
3. Optimization of the Tokyo metropolitan airspace and establishment of new routes
Were there any factors that impacted your individual ANSP performance in your fiscal year 2018, as shown in the KPIs in this report? For example, exceptional events in the year related to traffic.The IFR flight hour in Fukuoka FIR have increased by 2.1% compared to the previous year. But the increase rate is smaller than average increase rate of 4.7% from 2014 to 2017.As part of the reason, natural disasters such as earthquakes, typhoons and heavy rains can be considered.
Legal Status
A government department or authority that is subject to government accounting and treasury rules, and staff are employed under civil service pay and conditions.
Contextual data element Continental
Operational data
IFR hours per sq. km. 0.2857
Sq. km. – oceanic and continental 8,400,000
Percentage surveillance coverage at 30,000ft – radar and ADS-B only 100%
Radar: Except oceanic sectors ADS-B: Installation ongoing
Percentage surveillance coverage at 30,000ft – radar, ADS-B and ADS-C only 100%
Radar except oceanic sectors� ADS-B: Installation ongoing� ADS-C: Applicable within oceanic sectors�
Number of FIRs 1
Facilities
Number of ACC facilities 4
Number of co-located ACC and approach facilities 0
Number of stand-alone approach facilities 0
Number of co-located approach and tower facilities 13
Number of stand-alone towers 20
Number of co-located ACC, approach and tower facilities 0

71
CANSO Global Air Navigation Services Performance Report
Kenya Civil Aviation Authority
Legal Status
A government entity empowered to manage and use the revenues it generates through charges for the services it provides.
Contextual data element Continental
Operational data
IFR hours per sq. km. 1.16
Sq. km. – oceanic and continental 77,052
Percentage surveillance coverage at 30,000ft – radar and ADS-B only 100%
Percentage surveillance coverage at 30,000ft – radar, ADS-B and ADS-C only 100%
Number of FIRs 1
Facilities
Number of ACC facilities 1
Number of co-located ACC and approach facilities 1
Number of stand-alone approach facilities 2
Number of co-located approach and tower facilities 3
Number of stand-alone towers 5
Number of co-located ACC, approach and tower facilities 1

72
CANSO Global Air Navigation Services Performance Report
Latvijas gaisa satiksme
Does your ANSP have stated objectives? If so, what are they?Yes. Safety, cost-effectiveness, environment, capacity and modernization of technologies (VOR/DME, PBN, CPDLC, etc).
In your opinion, what are the main drivers or issues for performance within your region?Volatility of traffic. Territory, cost-effectiveness pressures.
Legal Status
A corporatised entity with special status, not governed by normal commercial law but by a specific founding law or statute (and wholly owned by the government).
Contextual data element Continental
Operational data
IFR hours per sq. km. 0.9251
Sq. km. – oceanic and continental 95,900
Percentage surveillance coverage at 30,000ft – radar and ADS-B only 0%
100% – radar; 100% – ADS-B ready (not used operationally)
Percentage surveillance coverage at 30,000ft – radar, ADS-B and ADS-C only 0%
100% – radar; 100% – ADS-B ready (not used operationally) 0% – ADS-C
Number of FIRs 1
Facilities
Number of ACC facilities 0
Number of co-located ACC and approach facilities 1
Number of stand-alone approach facilities 0
Number of co-located approach and tower facilities 0
Number of stand-alone towers 1
Number of co-located ACC, approach and tower facilities 0

73
CANSO Global Air Navigation Services Performance Report
Macedonian Air Navigation Service Provider
Does your ANSP have stated objectives? If so, what are they?M-NAV strategic objectives are stated in company’s Strategic business plan, and are constantly promoted as such. They include: achieving international and national standards in safety, quality and security, optimize airspace capacity, optimise cost effectiveness, comply with associated SES Regulations, Guidelines and SES II, support national and international environment standards, enhance human resources management, adopt managerial structures to future SES Requirements.
In your opinion, what are the main drivers or issues for performance within your region?Progressive implementation of the objectives stated in the European ATM Master Plan lvl 3, rapid traffic growth, enhanced regional cooperation and sharing mutual experiences for best practices.
What are the main initiatives you are undertaking to improve your performance?The new ATM System Project, optimization of human resources and flexible sectorisation on daily basis in order to reduce Europe – wide en-route delays.
Legal Status
A government entity empowered to manage and use the revenues it generates through charges for the services it provides.
Contextual data element Continental
Operational data
IFR hours per sq. km. 1.3022
Sq. km. – oceanic and continental 24,900
Percentage surveillance coverage at 30,000ft – radar and ADS-B only 100%
Radar only
Percentage surveillance coverage at 30,000ft – radar, ADS-B and ADS-C only 100%
Radar only
Number of FIRs 1
Facilities
Number of ACC facilities 0
Number of co-located ACC and approach facilities 0
Number of stand-alone approach facilities 0
Number of co-located approach and tower facilities 1
Number of stand-alone towers 0
Number of co-located ACC, approach and tower facilities 1
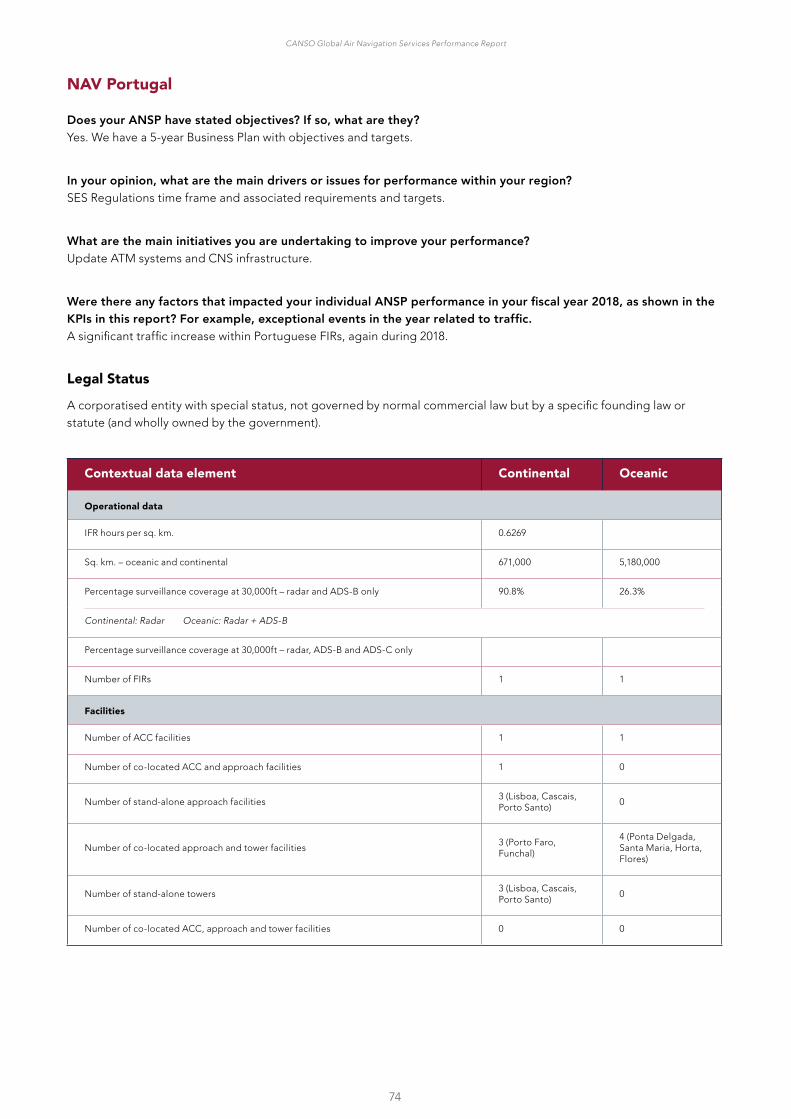
74
CANSO Global Air Navigation Services Performance Report
NAV Portugal
Does your ANSP have stated objectives? If so, what are they?Yes. We have a 5-year Business Plan with objectives and targets.
In your opinion, what are the main drivers or issues for performance within your region?SES Regulations time frame and associated requirements and targets.
What are the main initiatives you are undertaking to improve your performance?Update ATM systems and CNS infrastructure.
Were there any factors that impacted your individual ANSP performance in your fiscal year 2018, as shown in the KPIs in this report? For example, exceptional events in the year related to traffic.A significant traffic increase within Portuguese FIRs, again during 2018.
Legal Status
A corporatised entity with special status, not governed by normal commercial law but by a specific founding law or statute (and wholly owned by the government).
Contextual data element Continental Oceanic
Operational data
IFR hours per sq. km. 0.6269
Sq. km. – oceanic and continental 671,000 5,180,000
Percentage surveillance coverage at 30,000ft – radar and ADS-B only 90.8% 26.3%
Continental: Radar Oceanic: Radar + ADS-B
Percentage surveillance coverage at 30,000ft – radar, ADS-B and ADS-C only
Number of FIRs 1 1
Facilities
Number of ACC facilities 1 1
Number of co-located ACC and approach facilities 1 0
Number of stand-alone approach facilities3 (Lisboa, Cascais, Porto Santo)
0
Number of co-located approach and tower facilities3 (Porto Faro, Funchal)
4 (Ponta Delgada, Santa Maria, Horta, Flores)
Number of stand-alone towers3 (Lisboa, Cascais, Porto Santo)
0
Number of co-located ACC, approach and tower facilities 0 0

75
CANSO Global Air Navigation Services Performance Report
Oro navigacija
Legal Status
A corporatised entity with special status, not governed by normal commercial law but by a specific founding law or statute (and wholly owned by the government).
Does your ANSP have stated objectives? If so, what are they?Yes. To be the most competitive and innovative ANSP in the Baltic Sea region. To maintain quality services – 0 delays track-record. To optimize costs and seek economic-efficiency. To reduce environmental footprint. To be modern and innovative.
In your opinion, what are the main drivers or issues for performance within your region?Geographical situation and geopolitical situation (we are EU frontier, Ukraine-Russia tensions, Russia-NATO tensions).
What are the main initiatives you are undertaking to improve your performance?Transparent and competitive public procurement. Constant search for efficiencies and costs savings. Employing technologies. Participation in cross-border initiatives and alliances (Itec e.g.)
Were there any factors that impacted your individual ANSP performance in your fiscal year 2018, as shown in the KPIs in this report? For example, exceptional events in the year related to traffic.In 2018 we saw an unexpected big jump in terms of traffic compared to previous years. Despite all the challenges and a shake-up in the company we managed to maintain 0 delays result. At the same time as already mentioned costs were significantly lower than in the past and this resulted in productivity growth and big improvement in unit costs.
Legal Status
A corporatised entity with special status, not governed by normal commercial law but by a specific founding law or statute (and wholly owned by the government).
Contextual data element Continental
Operational data
IFR hours per sq. km. 0.895
Sq. km. – oceanic and continental 74,700
Percentage surveillance coverage at 30,000ft – radar and ADS-B only 100%
Percentage surveillance coverage at 30,000ft – radar, ADS-B and ADS-C only 100%
Number of FIRs 1
Facilities
Number of ACC facilities 1
Number of co-located ACC and approach facilities 0
Number of stand-alone approach facilities 0
Number of co-located approach and tower facilities 3
Number of stand-alone towers 1
Number of co-located ACC, approach and tower facilities 0
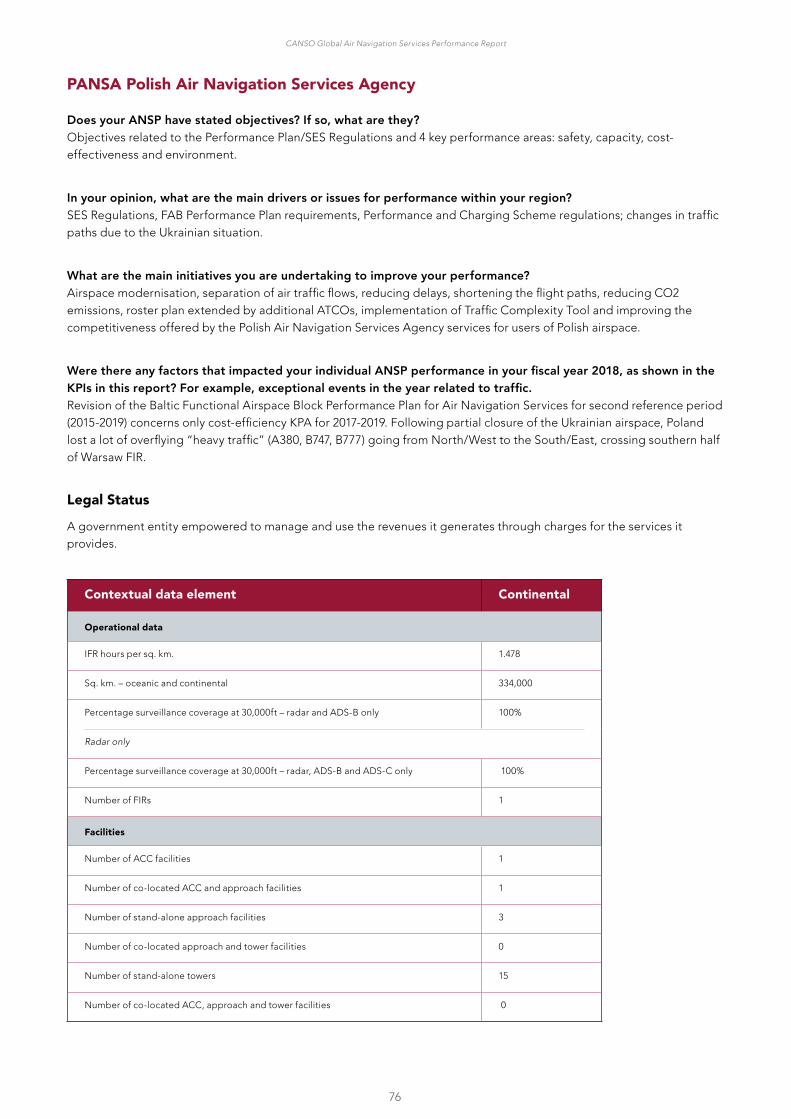
76
CANSO Global Air Navigation Services Performance Report
PANSA Polish Air Navigation Services Agency
Does your ANSP have stated objectives? If so, what are they?Objectives related to the Performance Plan/SES Regulations and 4 key performance areas: safety, capacity, cost-effectiveness and environment.
In your opinion, what are the main drivers or issues for performance within your region?SES Regulations, FAB Performance Plan requirements, Performance and Charging Scheme regulations; changes in traffic paths due to the Ukrainian situation.
What are the main initiatives you are undertaking to improve your performance?Airspace modernisation, separation of air traffic flows, reducing delays, shortening the flight paths, reducing CO2 emissions, roster plan extended by additional ATCOs, implementation of Traffic Complexity Tool and improving the competitiveness offered by the Polish Air Navigation Services Agency services for users of Polish airspace.
Were there any factors that impacted your individual ANSP performance in your fiscal year 2018, as shown in the KPIs in this report? For example, exceptional events in the year related to traffic.Revision of the Baltic Functional Airspace Block Performance Plan for Air Navigation Services for second reference period (2015-2019) concerns only cost-efficiency KPA for 2017-2019. Following partial closure of the Ukrainian airspace, Poland lost a lot of overflying “heavy traffic” (A380, B747, B777) going from North/West to the South/East, crossing southern half of Warsaw FIR.
Legal Status
A government entity empowered to manage and use the revenues it generates through charges for the services it provides.
Contextual data element Continental
Operational data
IFR hours per sq. km. 1.478
Sq. km. – oceanic and continental 334,000
Percentage surveillance coverage at 30,000ft – radar and ADS-B only 100%
Radar only
Percentage surveillance coverage at 30,000ft – radar, ADS-B and ADS-C only 100%
Number of FIRs 1
Facilities
Number of ACC facilities 1
Number of co-located ACC and approach facilities 1
Number of stand-alone approach facilities 3
Number of co-located approach and tower facilities 0
Number of stand-alone towers 15
Number of co-located ACC, approach and tower facilities 0

77
CANSO Global Air Navigation Services Performance Report
Papua New Guinea Air Services Ltd
Does your ANSP have stated objectives? If so, what are they?Improve customer satisfaction, enhance ANS infrastructure and ATC service reliability and accessibility, improve total cost management, enhance safety, modernize infrastructure.
In your opinion, what are the main drivers or issues for performance within your region?Increased number of Airline Operators – increased domestic and international traffic volume. Maintain acceptable safety level as per the corporate KPI.
What are the main initiatives you are undertaking to improve your performance?Modernization of CNS ICT/ATM infrastructure. Efficient Capability and capacity building in ATS/AIS and organisation wide.
Were there any factors that impacted your individual ANSP performance in your fiscal year 2018, as shown in the KPIs in this report? For example, exceptional events in the year related to traffic.World leaders APEC Conference hosted by Papua New Guinea. Resulted to slide increase in traffic volume from international airline operators.
Legal Status
A government entity empowered to manage and use the revenues it generates through charges for the services it provides.
Contextual data element Continental
Operational data
IFR hours per sq. km. 0.0223
Sq. km. – oceanic and continental 3.6 million
Percentage surveillance coverage at 30,000ft – radar and ADS-B only 100%
Percentage surveillance coverage at 30,000ft – radar, ADS-B and ADS-C only 100%
Number of FIRs 1
Facilities
Number of ACC facilities 1
Number of co-located ACC and approach facilities 1
Number of stand-alone approach facilities 1
Number of co-located approach and tower facilities 6
Number of stand-alone towers 0
Number of co-located ACC, approach and tower facilities 0

78
CANSO Global Air Navigation Services Performance Report
Saudi Air Navigation Services
Does your ANSP have stated objectives? If so, what are they?There are 14 objectives under 5 strategic pillars in SANS. The strategic pillars are Safe Operation, Efficient Operation, Human Focus, Financial Effectiveness, and Strategic Partnership.
In your opinion, what are the main drivers or issues for performance within your region?
• Maintaining and ensuring safe air space while optimizing operations
• Be a regional leader in all aspects in ANSP
• To be aligned with Kingdom Vision 2030
What are the main initiatives you are undertaking to improve your performance?SANS has 81 Initiatives that would improve performance in safety, performance, people, finance, and strategic partnership. Some of these initiatives involves in upgrading the ATM system, re-designing Saudi FIR, uplifting working environment, and increasing overall SANS maturity in safety and performance.
Legal Status
A corporatised entity with special status, not governed by normal commercial law but by a specific founding law or statute (and wholly owned by the government).
Contextual data element Continental
Operational data
IFR hours per sq. km.
Sq. km. – oceanic and continental 2,089,797
Percentage surveillance coverage at 30,000ft – radar and ADS-B only 95%
There is a coverage of 95% by Radar and 20% by ADS-B
Percentage surveillance coverage at 30,000ft – radar, ADS-B and ADS-C only 95%
There is a coverage of 95% by Radar and 20% by ADS-B� While a zero 0% by ADS-C
Number of FIRs 1
Facilities
Number of ACC facilities
Number of co-located ACC and approach facilities 2
Located in Jeddah and Riyahd
Number of stand-alone approach facilities 4
Located in Abha, Dammam, Taif, and Tabuk
Number of co-located approach and tower facilities
Number of stand-alone towers 18
Located in Nejarn, Abha, Gizan, Bisha, Baha, Taif, Jeddah, Madinah, Yanbu, Wajh, Neom, Tabuk, Aljouf (Military), Hail, Qassim, Dammam, Alehsa, and Alriyadh
Number of co-located ACC, approach and tower facilities

79
CANSO Global Air Navigation Services Performance Report
Serbia and Montenegro Air Traffic Services SMATSA LLC
In your opinion, what are the main drivers or issues for performance within your region? SES requirements.
Legal Status
Limited liability company, 100% state-owned (92% owned by Serbia and 8% owned by Montenegro). Integrated civil/military ANSP.
Contextual data element Continental
Operational data
IFR hours per sq. km. 2.159
Sq. km. – oceanic and continental 127,000
Percentage surveillance coverage at 30,000ft – radar and ADS-B only 100%
Percentage surveillance coverage at 30,000ft – radar, ADS-B and ADS-C only 100%
Number of FIRs 1
Facilities
Number of ACC facilities 1
Number of co-located ACC and approach facilities 1
Number of stand-alone approach facilities
Number of co-located approach and tower facilities 7
Number of stand-alone towers 1
Number of co-located ACC, approach and tower facilities

80
CANSO Global Air Navigation Services Performance Report
Tanzania Civil Aviation Authority
Does your ANSP have stated objectives? If so, what are they?To ensure safety, security and regularity of civil aviation in Tanzania by providing effective oversight and efficient air navigation services while maintaining quality, protecting the environment and safeguarding the interest of consumers and public.
In your opinion, what are the main drivers or issues for performance within your region?Improved ANS infrastructure, skilled and adequate manpower, conducive working environment and up to date working documents.
What are the main initiatives you are undertaking to improve your performance?Installation of new radar and ADS-B systems to cover the whole Dar FIR, training of technical and operational staff, review of documents and procedures, restructuring of airspace to meet users needs and improve staff welfares.
Were there any factors that impacted your individual ANSP performance in your fiscal year 2018, as shown in the KPIs in this report? For example, exceptional events in the year related to traffic.Shortage of ATCOs, financial constraints, inadequate training to operational staff, poor VHF radio communication performance.
Legal Status
A government entity empowered to manage and use the revenues it generates through charges for the services it provides.
Contextual data element Continental
Operational data
IFR hours per sq. km. 0.0223
Sq. km. – oceanic and continental 1 million
Percentage surveillance coverage at 30,000ft – radar and ADS-B only 50%
Percentage surveillance coverage at 30,000ft – radar, ADS-B and ADS-C only 0%
Number of FIRs 1
Facilities
Number of ACC facilities 1
Number of co-located ACC and approach facilities 0
Number of stand-alone approach facilities 1
Number of co-located approach and tower facilities 4
Number of stand-alone towers 8
Number of co-located ACC, approach and tower facilities 0

81
CANSO Global Air Navigation Services Performance Report
Annex 4: KPI Data
1: Continental Cost per IFR hour (USD) Formula: Total costs (USD) / IFR flight hours
ANSP KPI 2017-2018 AGR 4-year CAGRAAI 75.61 -0.87% 0.59%
AEROTHAI 367.27 -1.20% -2.51%
Airways NZ 376.82 -1.01% 2.33%
Albcontrol 724.98 -0.88% 3.00%
ANA 832.81
ANS CR 602.82 -4.29% -0.65%
ANS Finland 589.35 -9.32% -5.22%
ARMATS 635.94 0.57% -2.00%
ATNS 371.99 5.95% 6.82%
Austro Control 820.23 3.90% 1.16%
Avinor (Continental) 706.09 -15.46% 1.27%
BULATSA 430.88 -3.00% 0.51%
CAAS 384.51 4.23% 7.19%
Croatia Control 449.14 -4.18% -2.75%
DCA Cyprus 240.65 -1.02% -6.28%
DFS 874.80 -0.43% -0.87%
DHMI 291.05 22.36% 15.65%
DSNA 696.54 1.22% -0.76%
EANA 267.66 -19.52%
EANS 355.06 8.27% 5.58%
ENAIRE 550.22 -6.74% -6.59%
ENAV 706.40 -7.86% -3.58%
FAA-ATO 447.50 -1.08% -1.63%
HCAA 287.26 6.90% -6.19%
HungaroControl 421.85 -6.36% -1.62%
IAA 447.67 2.23% -0.91%
Isavia 233.43 -3.05% 35.45%
JANS 511.95 -1.68% -3.05%
KCAA 310.24 2.55%
LFV 470.99 1.03% 0.25%
LGS 331.06 0.70% -0.95%
LPS 679.14 -5.89% -2.59%
LVNL 1490.70 7.27% 2.19%
MATS 296.40 -3.33% 4.53%
M-NAV 456.70 -0.06% -3.62%
MOLDATSA 847.61 -4.16% 1.33%
MUAC 276.86
NATS (Continental) 572.78 0.43% -2.74%
NAV CANADA 294.74 -8.35% -1.81%
NAV Portugal (Continental) 429.22 12.68% 1.06%
NAVIAIR 597.45 0.57% -0.54%
Oro Navigacija 440.79 -18.97% -5.39%
PANSA 476.52 -3.66% 0.99%
PNGASL 65.83 27.48%
ROMATSA 551.71 -5.27% -0.46%
Sakaeronavigatsia 529.01 1.82% 5.27%
SANS 315.06 7.08%
skeyes 2081.325 0.94% 0.09%
skyguide 1023.27 -13.00% -1.78%
Slovenia Control 650.7962 -6.23% -2.63%
SMATSA 329.331 -12.91% -5.99%

82
CANSO Global Air Navigation Services Performance Report
2A: Continental ATCOs in OPS employment cost per ATCO in OPS hour (USD) Formula: ATCOs in OPS employment costs / ATCOs in OPS hours
ANSP KPI 2017-2018 AGR 4-year CAGR
AAI 18.54 -7.74% 4.92%
AEROTHAI 35.22 -3.77% 8.85%
Airways NZ 88.32 3.48% 2.21%
Albcontrol 42.02 -0.86% 0.21%
ANA 104.95
ANS CR 138.84 5.97% 7.37%
ANS Finland 89.92 0.25% -0.75%
ARMATS 17.64 16.17% 7.71%
ATNS 42.01 18.58% 7.89%
Austro Control 193.31 1.63% 3.20%
Avinor (Continental) 143.91 11.99% -3.67%
BULATSA 110.23 7.93% 8.55%
Croatia Control 108.65 -8.08% 1.99%
DCA Cyprus 57.67 2.25% -7.59%
DFS 279.23 2.05% 4.64%
DHMI 49.69 16.93% 16.09%
DSNA 127.49 3.49% 2.12%
EANA 34.75 -32.81%
EANS 84.68 0.37% 6.09%
ENAIRE 182.76 -2.33% -2.70%
ENAV 147.96 0.62% 2.79%
FAA-ATO 120.69 0.67% 2.63%
HCAA 67.95 10.22% 4.89%
HungaroControl 102.28 1.95% -0.27%
IAA 116.99 1.37% -0.94%
Isavia 138.47 5.59% 7.10%
JANS 40.19 0.32% -0.54%
KCAA 27.85 -2.48%
LFV 126.23 -3.89% 8.34%
LGS 65.11 43.48% 12.22%
LPS 134.26 -7.66% 3.37%
LVNL 211.27 -2.03% 6.59%
MATS 68.95 4.79% 18.21%
M-NAV 52.95 2.22% 1.16%
MOLDATSA 29.76 77.99% 1%
NATS (Continental) 145.16 2.00% 0.34%
NAV CANADA 120.90 3.69% 4.27%
NAV Portugal (Continental) 197.17 25.84% 10.62%
NAVIAIR 128.02 2.21% 1.30%
Oro Navigacija 59.84 6.58% 3.40%
PANSA 131.34 -0.41% 5.22%
PNGASL 38.16 38.41%
ROMATSA 128.09 3.43% 7.05%
Sakaeronavigatsia 17.89 5.22% 19.16%
SANS 64.21 21.06%
skeyes 190.79 -8.81% 2.42%
skyguide 198.26 -1.20% 0.11%
Slovenia Control 111.72 7.28% 4.09%
SMATSA 66.93 5.32% 2.91%

83
CANSO Global Air Navigation Services Performance Report
2A: Continental ATCOs in OPS employment cost per ATCO in OPS hour (USD), PPP adjusted
ANSP KPI KPI PPP adjusted 2017-2018 AGR 4-year CAGR
AAI 18.54 69.93 -9.22% 3.16%
AEROTHAI 35.22 92.13 -2.79% 8.79%
Airways NZ 88.32 92.19 4.88% 2.19%
Albcontrol 42.02 106.42 0.82% 0.47%
ANA 104.95 96.73
ANS CR 138.84 224.37 5.86% 7.37%
ANS Finland 89.92 84.34 0.81% -0.23%
ARMATS 17.64 43.29 16.05% 3.09%
ATNS 42.01 89.86 16.89% 4.02%
Austro Control 193.31 213.43 2.05% 4.24%
Avinor (Continental) 143.91 92.48 13.07% -5.04%
BULATSA 110.23 265.20 5.64% 7.45%
Croatia Control 108.65 204.81 -8.19% 3.58%
DCA Cyprus 57.67 80.14 3.16% -5.04%
DFS 279.23 319.29 2.02% 5.62%
DHMI 49.69 174.68 2.92% 6.48%
DSNA 127.49 136.35 5.19% 3.01%
EANA 34.75 64.95 -51.09%
EANS 84.68 124.10 -1.54% 4.93%
ENAIRE 182.76 243.95 -3.02% -1.65%
ENAV 147.96 183.57 1.18% 4.87%
FAA-ATO 120.69 120.69 0.67% 2.63%
HCAA 67.95 101.51 11.99% 13.20%
HungaroControl 102.28 214.17 -0.09% -1.42%
IAA 116.99 125.72 1.73% 0.02%
Isavia 138.47 103.96 5.36% 6.02%
JANS 40.19 45.23 2.87% 0.53%
KCAA 27.85 56.71 -2.86%
LFV 126.23 124.70 -3.69% 7.88%
LGS 65.11 108.14 40.94% 11.72%
LPS 134.26 225.19 -8.08% 2.35%
LVNL 211.27 229.33 -2.26% 7.55%
MATS 68.95 100.00 3.69% 18.33%
M-NAV 52.95 145.00 0.38% -0.50%
MOLDATSA 29.76 68.16 77.99% 1.19%
NATS (Continental) 145.16 158.34 1.26% 0.75%
NAV CANADA 120.90 132.75 4.46% 4.87%
NAV Portugal (Continental) 197.17 272.89 26.86% 10.49%
NAVIAIR 128.02 119.32 3.36% 3.31%
Oro Navigacija 59.84 109.01 5.66% 2.67%
PANSA 131.34 283.63 0.85% 5.82%
PNGASL 38.16 55.47 31.35%
ROMATSA 128.09 302.48 -0.57% 6.39%
Sakaeronavigatsia 17.89 47.09 3.91% 12.34%
SANS 64.21 152.01 11.20%
skeyes 190.79 209.97 -8.43% 3.43%
skyguide 198.26 158.48 0.93% 2.11%
Slovenia Control 111.72 157.20 7.64% 4.30%
SMATSA 66.93 167.51 5.74% 2.42%

84
CANSO Global Air Navigation Services Performance Report
2B: Continental ATCOs in OPS hour productivity Formula: IFR flight hours / ATCOs in OPS hours
ANSP KPI 2017-2018 AGR 4-year CAGR
AAI 0.87 7.37% 4.06%
AEROTHAI 0.35 -0.18% 7.64%
Airways NZ 0.65 4.38% 1.33%
Albcontrol 0.49 11.02% -2.99%
ANA 0.36
ANS CR 0.94 6.18% 5.75%
ANS Finland 0.46 14.46% 4.20%
ARMATS 0.18 19.76% 10.21%
ATNS 0.50 11.07% 3.18%
Austro Control 0.79 6.03% 3.89%
Avinor (Continental) 0.56 -0.02% -1.31%
BULATSA 0.84 7.82% 5.08%
CAAS 0.65 1.28% -2.95%
Croatia Control 0.72 6.12% 4.39%
DCA Cyprus 0.88 9.94% 0.65%
DFS 0.89 7.01% 3.40%
DHMI 0.84 3.31% 0.32%
DSNA 0.68 5.55% 3.01%
EANA 0.43 -6.75%
EANS 0.87 -0.65% 2.66%
ENAIRE 0.73 4.33% 4.21%
ENAV 0.64 8.77% 3.72%
FAA-ATO 1.14 2.69% 4.22%
HCAA 0.82 11.68% 9.60%
HungaroControl 0.98 5.83% 5.46%
IAA 0.88 -2.37% -0.26%
Isavia 1.29 -0.41% -28.80%
JANS 0.96 1.19% 4.25%
KCAA 0.32 5.94%
LFV 0.59 -3.74% 2.51%
LGS 0.79 19.18% 7.75%
LPS 0.69 -6.00% -2.09%
LVNL 0.52 -1.00% 6.30%
MATS 0.88 12.18% 8.95%
M-NAV 0.40 19.63% 4.20%
MOLDATSA 0.14 45.52% 3.25%
NATS (Continental) 0.90 4.69% 4.32%
NAV CANADA 1.33 6.09% 4.10%
NAV Portugal (Continental) 1.02 -0.46% 6.08%
NAVIAIR 0.73 4.64% 1.18%
Oro Navigacija 0.53 24.09% 7.76%
PANSA 0.81 5.27% 2.26%
PNGASL 0.66 -1.92%
ROMATSA 0.73 3.50% 5.22%
Sakaeronavigatsia 0.35 3.94% 7.25%
SANS 0.92 -5.77%
skeyes 0.42 3.70% 4.09%
skyguide 0.75 2.03% 1.01%
Slovenia Control 0.52 14.54% 7.89%
SMATSA 0.81 9.21% 5.61%
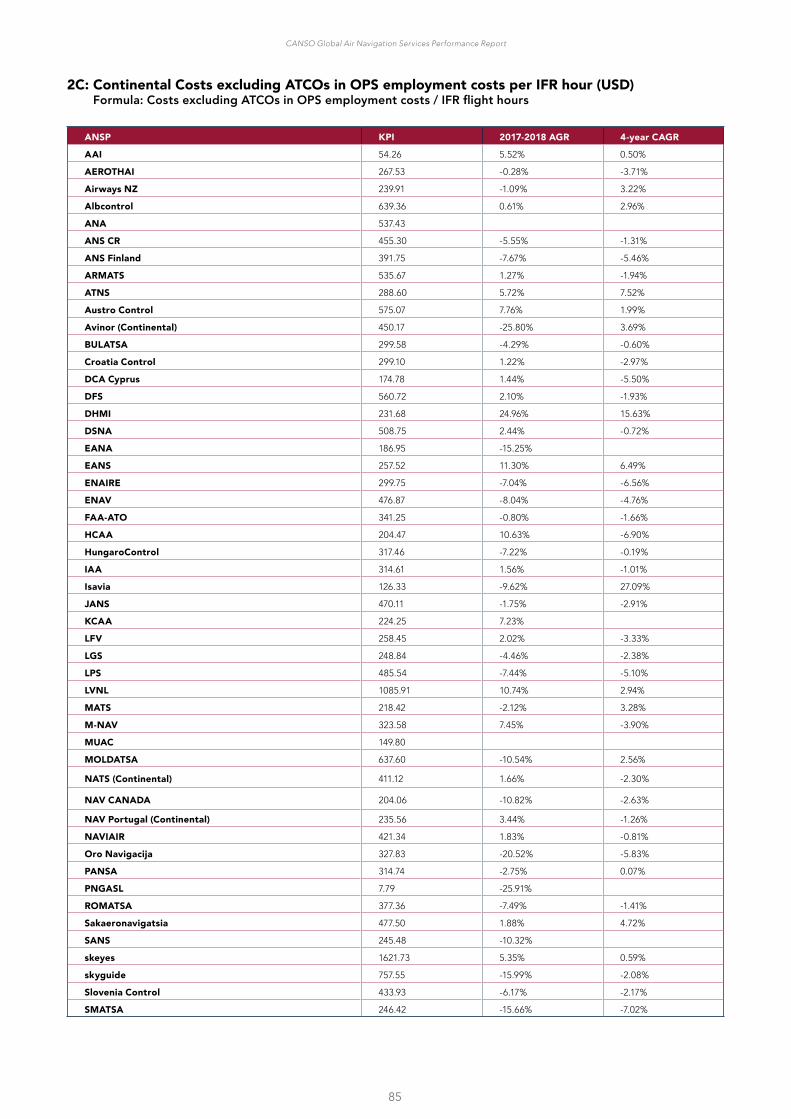
85
CANSO Global Air Navigation Services Performance Report
2C: Continental Costs excluding ATCOs in OPS employment costs per IFR hour (USD) Formula: Costs excluding ATCOs in OPS employment costs / IFR flight hours
ANSP KPI 2017-2018 AGR 4-year CAGR
AAI 54.26 5.52% 0.50%
AEROTHAI 267.53 -0.28% -3.71%
Airways NZ 239.91 -1.09% 3.22%
Albcontrol 639.36 0.61% 2.96%
ANA 537.43
ANS CR 455.30 -5.55% -1.31%
ANS Finland 391.75 -7.67% -5.46%
ARMATS 535.67 1.27% -1.94%
ATNS 288.60 5.72% 7.52%
Austro Control 575.07 7.76% 1.99%
Avinor (Continental) 450.17 -25.80% 3.69%
BULATSA 299.58 -4.29% -0.60%
Croatia Control 299.10 1.22% -2.97%
DCA Cyprus 174.78 1.44% -5.50%
DFS 560.72 2.10% -1.93%
DHMI 231.68 24.96% 15.63%
DSNA 508.75 2.44% -0.72%
EANA 186.95 -15.25%
EANS 257.52 11.30% 6.49%
ENAIRE 299.75 -7.04% -6.56%
ENAV 476.87 -8.04% -4.76%
FAA-ATO 341.25 -0.80% -1.66%
HCAA 204.47 10.63% -6.90%
HungaroControl 317.46 -7.22% -0.19%
IAA 314.61 1.56% -1.01%
Isavia 126.33 -9.62% 27.09%
JANS 470.11 -1.75% -2.91%
KCAA 224.25 7.23%
LFV 258.45 2.02% -3.33%
LGS 248.84 -4.46% -2.38%
LPS 485.54 -7.44% -5.10%
LVNL 1085.91 10.74% 2.94%
MATS 218.42 -2.12% 3.28%
M-NAV 323.58 7.45% -3.90%
MUAC 149.80
MOLDATSA 637.60 -10.54% 2.56%
NATS (Continental) 411.12 1.66% -2.30%
NAV CANADA 204.06 -10.82% -2.63%
NAV Portugal (Continental) 235.56 3.44% -1.26%
NAVIAIR 421.34 1.83% -0.81%
Oro Navigacija 327.83 -20.52% -5.83%
PANSA 314.74 -2.75% 0.07%
PNGASL 7.79 -25.91%
ROMATSA 377.36 -7.49% -1.41%
Sakaeronavigatsia 477.50 1.88% 4.72%
SANS 245.48 -10.32%
skeyes 1621.73 5.35% 0.59%
skyguide 757.55 -15.99% -2.08%
Slovenia Control 433.93 -6.17% -2.17%
SMATSA 246.42 -15.66% -7.02%

86
CANSO Global Air Navigation Services Performance Report
2D: Continental Proportion of total costs made up of ATCO in OPS employment costs (USD) Formula: ATCO in OPS employment Costs / Total Costs
ANSP KPI 2017-2018 AGR 4-year CAGR
AAI 0.28242 -13.33% 0.23%
AEROTHAI 0.27156 -2.42% 3.73%
Airways NZ 0.36333 0.14% -1.43%
Albcontrol 0.11810 -9.91% 0.29%
ANA 0.35468
ANS CR 0.24472 4.28% 2.20%
ANS Finland 0.33529 -3.41% 0.50%
ARMATS 0.15768 -3.55% -0.28%
ATNS 0.22416 0.76% -2.11%
Austro Control 0.29890 -7.74% -1.80%
Avinor (Continental) 0.36245 32.49% -3.61%
BULATSA 0.30471 3.19% 2.78%
Croatia Control 0.33406 -9.61% 0.46%
DCA Cyprus 0.27372 -6.04% -2.05%
DFS 0.35904 -4.23% 2.08%
DHMI 0.20399 -7.50% 0.06%
DSNA 0.26960 -3.13% -0.10%
EANA 0.30155 -10.47%
EANS 0.27470 -6.69% -2.11%
ENAIRE 0.45523 0.38% -0.04%
ENAV 0.32494 0.40% 2.79%
FAA-ATO 0.23744 -0.89% 0.11%
HCAA 0.28821 -7.69% 2.02%
HungaroControl 0.24745 2.88% -3.87%
IAA 0.29723 1.57% 0.24%
Isavia 0.45880 9.37% 11.06%
JANS 0.08171 0.83% -1.59%
KCAA 0.27716 -10.23%
LFV 0.45125 -1.17% 5.42%
LGS 0.24836 19.55% 5.15%
LPS 0.28506 4.38% 8.39%
LVNL 0.27155 -7.75% -1.86%
MATS 0.26308 -3.37% 3.80%
M-NAV 0.29148 -14.51% 0.73%
MOLDATSA 0.24776 27.63% -3.28%
MUAC 0.45895
NATS (Continental) 0.28223 -2.99% -1.10%
NAV CANADA 0.30768 6.64% 2.01%
NAV Portugal (Continental) 0.45117 12.19% 3.19%
NAVIAIR 0.29478 -2.88% 0.66%
Oro Navigacija 0.25627 6.00% 1.42%
PANSA 0.33949 -1.80% 1.89%
PNGASL 0.88170 10.70%
ROMATSA 0.31601 5.49% 2.21%
Sakaeronavigatsia 0.09738 -0.58% 5.54%
SANS 0.22086 19.97%
skeyes 0.22082 -12.88% -1.68%
skyguide 0.25968 11.29% 0.91%
Slovenia Control 0.33322 -0.12% -0.92%
SMATSA 0.25175 10.74% 3.66%

87
CANSO Global Air Navigation Services Performance Report
3A: Continental Annual employment cost per ATCO in OPS (USD) Formula: ATCOs in OPS employment costs / No. ATCOs in OPS
ANSP KPI 2017-2018 AGR 4-year CAGR
AAI 36308.48 -8.25% 5.31%
AEROTHAI 108630.47 2.29% 11.25%
Airways NZ 120474.66 3.48% 2.21%
Albcontrol 58678.50 -2.00% -2.21%
ANA 160461.98
ANS CR 217276.88 7.46% 7.30%
ANS Finland 140508.13 2.03% -0.18%
ARMATS 25154.75 21.63% 8.97%
ATNS 61173.63 5.99% 4.43%
Austro Control 272423.45 2.93% 3.27%
Avinor (Continental) 228238.94 12.40% -3.26%
BULATSA 141785.89 7.91% 8.55%
Croatia Control 144293.67 -6.69% -0.01%
DCA Cyprus 112439.94 2.30% -8.19%
DFS 263952.65 2.80% 3.55%
DHMI 59100.15 15.90% 13.72%
DSNA 163701.02 3.49% 2.12%
EANA 37767.97 -28.69%
EANS 125519.51 4.02% 3.88%
ENAIRE 244951.03 2.66% 1.07%
ENAV 183276.26 2.52% 1.74%
FAA-ATO 221892.00 1.34% 2.66%
HCAA 100699.29 10.22% 1.33%
HungaroControl 163270.41 4.29% 0.27%
IAA 181894.17 1.08% -0.47%
Isavia 253652.40 12.96% 13.31%
JANS 80975.03 0.32% -0.54%
KCAA 40105.68 -2.48%
LFV 223806.90 2.79% 10.28%
LGS 102291.15 46.67% 15.90%
LPS 209742.60 -7.50% 4.53%
LVNL 326926.77 -0.26% 1.36%
MATS 130832.43 4.79% 16.73%
M-NAV 66403.22 -0.67% 4.30%
MOLDATSA 41507.76 73.27% 0.39%
MUAC 327656.64 2.43% 3.68%
NATS (Continental) 194682.61 2.82% 2.75%
NAV CANADA 195377.97 10.46% 4.31%
NAV Portugal (Continental) 379624.12 34.57% 12.18%
NAVIAIR 189961.18 2.59% 1.87%
Oro Navigacija 95242.90 5.17% 3.91%
PANSA 143901.21 1.89% 3.98%
PNGASL 83337.80 17.61%
ROMATSA 153353.99 4.20% 6.51%
Sakaeronavigatsia 27258.01 5.22% 13.19%
SANS 101705.73 21.06%
skeyes 267858.79 2.17% 4.09%
skyguide 269864.11 4.16% 2.40%
Slovenia Control 154474.70 4.61% 3.28%
SMATSA 79496.26 3.63% 3.70%

88
CANSO Global Air Navigation Services Performance Report
3A: Continental Annual employment cost per ATCO in OPS (USD), PPP adjusted
ANSP KPI KPI PPP adjusted 2017-2018 AGR 4-year CAGR
AAI 36308.48 136962.86 -9.72% 3.54%
AEROTHAI 108630.47 284176.74 3.32% 11.18%
Airways NZ 120474.66 125740.44 4.88% 2.19%
Albcontrol 58678.50 148620.05 -0.35% -1.95%
ANA 160461.98 147895.12
ANS CR 217276.88 351116.21 7.35% 7.30%
ANS Finland 140508.13 131798.64 2.60% 0.34%
ARMATS 25154.75 61725.35 21.51% 4.29%
ATNS 61173.63 130831.48 4.48% 0.68%
Austro Control 272423.45 300780.01 3.36% 4.32%
Avinor (Continental) 228238.94 146669.20 13.48% -4.64%
BULATSA 141785.89 341106.34 5.62% 7.45%
Croatia Control 144293.67 271992.29 -6.80% 1.55%
DCA Cyprus 112439.94 156255.60 3.21% -5.65%
DFS 263952.65 301819.22 2.77% 4.52%
DHMI 59100.15 207763.83 2.02% 4.31%
DSNA 163701.02 175074.72 5.19% 3.01%
EANA 37767.97 70587.04 -48.09%
EANS 125519.51 183941.88 2.04% 2.74%
ENAIRE 244951.03 326960.72 1.93% 2.16%
ENAV 183276.26 227390.80 3.10% 3.80%
FAA-ATO 221892.00 221892.00 1.34% 2.66%
HCAA 100699.29 150439.54 11.99% 9.35%
HungaroControl 163270.41 341870.51 2.20% -0.88%
IAA 181894.17 195460.34 1.45% 0.48%
Isavia 253652.40 190425.24 12.70% 12.17%
JANS 80975.03 91138.08 2.87% 0.53%
KCAA 40105.68 81656.28 -2.86%
LFV 223806.90 221087.77 3.00% 9.81%
LGS 102291.15 169888.93 44.08% 15.39%
LPS 209742.60 351777.78 -7.91% 3.50%
LVNL 326926.77 354871.46 -0.49% 2.27%
MATS 130832.43 189735.76 3.69% 16.84%
M-NAV 66403.22 181836.71 -2.45% 2.58%
MOLDATSA 41507.76 95081.02 73.27% 0.39%
MUAC 327656.64
NATS (Continental) 194682.61 212366.19 2.07% 3.17%
NAV CANADA 195377.97 214527.28 11.29% 4.91%
NAV Portugal (Continental) 379624.12 525411.53 35.67% 12.04%
NAVIAIR 189961.18 177050.88 3.76% 3.89%
Oro Navigacija 95242.90 173490.97 4.26% 3.18%
PANSA 143901.21 310755.54 3.18% 4.57%
PNGASL 83337.80 121151.65 11.61%
ROMATSA 153353.99 362149.76 0.16% 5.85%
Sakaeronavigatsia 27258.01 71761.51 3.91% 6.71%
SANS 101705.73 240780.30 11.20%
skeyes 267858.79 294784.58 2.60% 5.11%
skyguide 269864.11 215718.71 6.41% 4.44%
Slovenia Control 154474.70 217349.22 4.96% 3.49%
SMATSA 79496.26 198957.61 4.04% 3.20%

89
CANSO Global Air Navigation Services Performance Report
3B: Continental Annual working hours per ATCO in OPS Formula: ATCOs in OPS hours / No. ATCOs in OPS
ANSP KPI 2017-2018 AGR 4-year CAGR
AAI 1958.55 -0.55% 0.37%
AEROTHAI 3084.46 6.29% 2.20%
Airways NZ 1364.00 0.00% 0.00%
Albcontrol 1396.50 -1.16% -2.41%
ANA 1528.90
ANS CR 1564.92 1.40% -0.07%
ANS Finland 1562.61 1.78% 0.58%
ARMATS 1425.92 4.70% 1.17%
ATNS 1456.00 -10.61% -3.21%
Austro Control 1409.26 1.28% 0.07%
Avinor (Continental) 1585.99 0.37% 0.42%
BULATSA 1286.23 -0.02% 0.00%
CAAS 1819.00 0.00% 0.00%
Croatia Control 1328.00 1.51% -1.96%
DCA Cyprus 1949.75 0.05% -0.65%
DFS 945.28 0.74% -1.04%
DHMI 1189.43 -0.88% -2.04%
DSNA 1284.00 0.00% 0.00%
EANA 1086.81 6.13%
EANS 1482.22 3.64% -2.08%
ENAIRE 1340.27 5.11% 3.88%
ENAV 1238.70 1.89% -1.03%
FAA-ATO 1838.57 0.67% 0.03%
HCAA 1482.00 0.00% -3.40%
HungaroControl 1596.27 2.30% 0.55%
IAA 1554.74 -0.28% 0.47%
Isavia 1831.79 6.97% 5.80%
JANS 2015.00 0.00% 0.00%
KCAA 1440.00 0.00%
LFV 1773.00 6.95% 1.79%
LGS 1570.95 2.22% 3.28%
LPS 1562.16 0.18% 1.13%
LVNL 1547.46 1.81% -4.91%
MATS 1897.37 0.00% -1.26%
M-NAV 1254.03 -2.83% 3.10%
MOLDATSA 1341.19 -2.65% -0.80%
NATS (Continental) 1615.99 0.80% 2.40%
NAV CANADA 1925.34 6.53% 0.04%
NAV Portugal (Continental) 1483.88 6.94% 1.41%
NAVIAIR 1591.56 0.38% 0.56%
Oro Navigacija 1341.19 -1.33% 0.49%
PANSA 1095.65 2.31% -1.18%
PNGASL 2184.00 -15.03%
ROMATSA 1197.26 0.74% -0.51%
Sakaeronavigatsia 1524.00 0.00% -5.01%
SANS 1584.00 0.00%
skeyes 1403.95 12.04% 1.63%
skyguide 1361.13 5.43% 2.29%
Slovenia Control 1382.64 -2.49% -0.78%
SMATSA 1187.75 -1.61% 0.77%

90
CANSO Global Air Navigation Services Performance Report
3C: Continental Annual IFR hours per ATCO in OPS Formula: IFR flight hours / No. ATCOs in OPS
ANSP KPI 2017-2018 AGR 4-year CAGR
AAI 1700.26 6.78% 4.44%
AEROTHAI 1089.17 6.10% 10.00%
Airways NZ 879.95 4.38% 1.33%
Albcontrol 685.31 9.74% -5.33%
ANA 543.23
ANS CR 1472.83 7.67% 5.68%
ANS Finland 711.08 16.49% 4.80%
ARMATS 250.86 25.39% 11.50%
ATNS 733.62 -0.72% -0.13%
Austro Control 1111.17 7.39% 3.96%
Avinor (Continental) 891.85 0.35% -0.89%
BULATSA 1079.94 7.80% 5.08%
CAAS 1188.36 1.28% -2.95%
Croatia Control 961.69 7.73% 2.35%
DCA Cyprus 1706.99 9.99% 0.00%
DFS 840.38 7.80% 2.33%
DHMI 995.44 2.40% -1.73%
DSNA 871.74 5.55% 3.01%
EANA 467.92 -1.03%
EANS 1286.91 2.96% 0.52%
ENAIRE 977.94 9.66% 8.25%
ENAV 798.46 10.83% 2.66%
FAA-ATO 2088.32 3.37% 4.25%
HCAA 1216.32 11.68% 5.87%
HungaroControl 1564.08 8.26% 6.03%
IAA 1366.99 -2.64% 0.21%
Isavia 2368.43 6.53% -24.67%
JANS 1935.64 1.19% 4.25%
KCAA 466.43 5.94%
LFV 1053.03 2.95% 4.34%
LGS 1244.10 21.83% 11.28%
LPS 1083.40 -5.83% -0.99%
LVNL 807.64 0.79% 1.08%
MATS 1677.86 12.18% 7.58%
M-NAV 498.83 16.25% 7.43%
MOLDATSA 197.65 41.66% 2.42%
MUAC 2578.64 6.33% 4.15%
NATS (Continental) 1204.30 5.53% 6.82%
NAV CANADA 2154.44 13.02% 4.15%
NAV Portugal (Continental) 1960.35 6.46% 7.58%
NAVIAIR 1078.62 5.04% 1.75%
Oro Navigacija 843.15 22.45% 8.29%
PANSA 889.54 7.70% 1.05%
PNGASL 1435.83 -16.66%
ROMATSA 879.60 4.27% 4.68%
Sakaeronavigatsia 529.11 3.94% 1.88%
SANS 1461.64 -5.77%
skeyes 582.82 16.19% 5.79%
skyguide 1015.59 7.57% 3.32%
Slovenia Control 712.32 11.69% 7.05%
SMATSA 958.85 7.46% 6.42%

91
CANSO Global Air Navigation Services Performance Report
1: Oceanic Cost per IFR hour (USD) Formula: Total costs / IFR flight hours
ANSP KPI 2017-2018 AGR 4-year CAGR
Airways NZ 49.07 2.98% -2.12%
FAA-ATO 91.33 11.57% -2.19%
Isavia 193.77 0.33% 2.14%
NAV CANADA 52.58 -6.98% -2.96%
2A: Oceanic ATCO in OPS employment cost per ATCO in OPS hour (USD) Formula: ATCOs in OPS employment costs / ATCOs in OPS Hours
ANSP KPI 2017-2018 AGR 4-year CAGR
Airways NZ 92.71 0.69% 2.57%
ATNS 15.13 18.90% 11.82%
FAA-ATO 165.25 4.58% 3.55%
Isavia 142.11 16.93% -7.20%
NAV CANADA 124.27 8.58% 5.11%
2A: Oceanic ATCO in OPS employment cost per ATCO in OPS hour (USD), PPP adjusted
ANSP KPI KPI – PPP 2017-2018 AGR 4 yr CAGR
Airways NZ 92.71 96.77 2.05% 2.55%
ATNS 15.13 32.36 17.20% 7.80%
FAA-ATO 165.25 165.25 4.58% 3.55%
Isavia 142.11 106.68 16.67% -8.13%
NAV CANADA 124.27 136.45 9.39% 5.71%
2B: Oceanic ATCO in OPS hour productivity Formula: IFR flight hours / ATCOs in OPS hours
ANSP KPI 2017-2018 AGR 4-year CAGR
Airways NZ 3.42 -12.46% 2.50%
ATNS 0.22 34.97% 5.93%
FAA-ATO 6.78 4.22% 5.58%
Isavia 3.22 -0.22% -4.76%
NAV CANADA 6.71 -3.27% 1.95%
2C: Oceanic Costs excluding ATCOs in OPS employment costs per IFR hour (USD) Formula: Costs excluding ATCOs in OPS employment costs / IFR flight hours
ANSP KPI 2017-2018 AGR 4-year CAGR
Airways NZ 21.95 -8.82%
FAA-ATO 66.97 16.31% -2.29%
Isavia 149.68 -3.75% 3.76%
NAV CANADA 34.05 -14.91% -5.61%
2D: Oceanic Proportion of total costs made up of ATCO in OPS employment costs (USD) Formula: ATCO in OPS employment Costs / Total Costs
ANSP KPI 2017-2018 AGR 4-year CAGR
Airways NZ 0.55 11.69% 2.23%
FAA-ATO 0.27 -10.06% 0.28%
Isavia 0.23 16.81% -4.60%
NAV CANADA 0.35 20.67% 6.24%

92
CANSO Global Air Navigation Services Performance Report
CO1: Combined Cost per IFR hour (USD) Formula: Total costs /IFR flight hours
ANSP KPI 2017-2018 AGR 4-year CAGR
AAI 75.61 -0.87% 0.59%
AEROTHAI 367.27 -1.20% -2.51%
Airways NZ 271.22 -0.37% 1.10%
Albcontrol 724.98 -0.88% 3.00%
ANA 832.81
ANS CR 602.82 -4.29% -0.65%
ANS Finland 589.35 -9.32% -5.22%
ARMATS 635.94 0.57% -2.00%
ATNS 357.60 5.46% 6.80%
Austro Control 820.23 3.90% 1.16%
Avinor (Continental) 706.09 -15.46% 1.27%
BULATSA 430.88 -3.00% 0.51%
CAAS 384.51 4.23% 7.19%
Croatia Control 449.14 -4.18% -2.75%
DCA Cyprus 240.65 -1.02% -6.28%
DFS 874.80 -0.43% -0.87%
DHMI 291.05 22.36% 15.65%
DSNA 696.54 1.22% -0.76%
EANA 267.66 -19.52%
EANS 355.06 8.27% 5.58%
ENAIRE 550.22 -6.74% -6.59%
ENAV 706.40 -7.86% -3.58%
FAA-ATO 419.45 -0.85% -1.76%
HCAA 287.26 6.90% -6.19%
HungaroControl 421.85 -6.36% -1.62%
IAA 447.67 2.23% -0.91%
Isavia 197.79 -0.09% 4.21%
JANS 511.95 -1.68% -3.05%
KCAA 310.24 2.55%
LFV 470.99 1.03% 0.25%
LGS 331.06 0.70% -0.95%
LPS 679.14 -5.89% -2.59%
LVNL 1490.70 7.27% 2.19%
MATS 296.40 -3.33% 4.53%
M-NAV 456.70 -0.06% -3.62%
MOLDATSA 847.61 -4.16% 1.33%
MUAC 276.86
NATS (Continental) 572.78 0.43% -2.74%
NAV CANADA 254.85 -7.29% -1.81%
NAV Portugal (Continental) 429.22 12.68% 1.06%
NAVIAIR 597.45 0.57% -0.54%
Oro Navigacija 440.79 -18.97% -5.39%
PANSA 483.51 -2.25% 1.35%
PNGASL 65.83 27.48%
ROMATSA 551.71 -5.27% -0.46%
Sakaeronavigatsia 529.01 1.82% 5.27%
SANS 315.06 7.08%
skeyes 2081.33 0.94% 0.09%
skyguide 1023.27 -13.00% -1.78%
Slovenia Control 650.80 -6.23% -2.63%
SMATSA 329.33 -12.91% -5.99%

93
CANSO Global Air Navigation Services Performance Report
CO2D: Combined Proportion of total costs made up of ATCO in OPS employment costs (USD) Formula: ATCO in OPS employment Costs / Total Costs
ANSP KPI 2017-2018 AGR 4-year CAGR
AAI 0.28 -13.33% 0.23%
AEROTHAI 0.27 -2.42% 3.73%
Airways NZ 0.37 1.09% -1.15%
Albcontrol 0.12 -9.91% 0.29%
ANA 0.35
ANS CR 0.24 4.28% 2.20%
ANS Finland 0.34 -3.41% 0.50%
ARMATS 0.16 -3.55% -0.28%
ATNS 0.23 0.55% -2.07%
Austro Control 0.30 -7.74% -1.80%
Avinor (Continental) 0.36 32.49% -3.61%
BULATSA 0.30 3.19% 2.78%
Croatia Control 0.33 -9.61% 0.46%
DCA Cyprus 0.27 -6.04% -2.05%
DFS 0.36 -4.23% 2.08%
DHMI 0.20 -7.50% 0.06%
DSNA 0.27 -3.13% -0.10%
EANA 0.30 -10.47%
EANS 0.27 -6.69% -2.11%
ENAIRE 0.46 0.38% -0.04%
ENAV 0.32 0.40% 2.79%
FAA-ATO 0.24 -1.04% 0.11%
HCAA 0.29 -7.69% 2.02%
HungaroControl 0.25 2.88% -3.87%
IAA 0.30 1.57% 0.24%
Isavia 0.26 14.66% -1.92%
JANS 0.08 0.83% -1.59%
KCAA 0.28 -10.23%
LFV 0.45 -1.17% 5.42%
LGS 0.25 19.55% 5.15%
LPS 0.29 4.38% 8.39%
LVNL 0.27 -7.75% -1.86%
MATS 0.26 -3.37% 3.80%
M-NAV 0.29 -14.51% 0.73%
MOLDATSA 0.25 27.63% -3.28%
MUAC 0.46
NATS (Continental) 0.28 -2.99% -1.10%
NAV CANADA 0.31 7.12% 2.16%
NAV Portugal (Continental) 0.45 12.19% 3.19%
NAVIAIR 0.29 -2.88% 0.66%
Oro Navigacija 0.26 6.00% 1.42%
PANSA 0.34 -1.80% 1.89%
PNGASL 0.88 10.70%
ROMATSA 0.32 5.49% 2.21%
Sakaeronavigatsia 0.10 -0.58% 5.54%
SANS 0.22 19.97%
skeyes 0.22 -12.88% -1.68%
skyguide 0.26 11.29% 0.91%
Slovenia Control 0.33 -0.12% -0.92%
SMATSA 0.25 10.74% 3.66%

94
CANSO Global Air Navigation Services Performance Report
Annex 5: Exchange Rates
All exchange rates are the 2018 average for local currency per US Dollar. For sources please see Annex 7.
ANSP Currency 2018 Exchange RateAAI INR 0.0146
AEROTHAI THB 0.0309
Airservices AUD 0.7500
Airways NZ NZD 0.6461
Albcontrol ALL 0.0093
ANA EUR 1.1806
ANS CR CZK 0.0460
ANS Finland EUR 1.1806
ARMATS AMD 0.0021
ATNS ZAR 0.0758
Austro Control EUR 1.1806
Avinor (Continental) NOK 0.1584
BULATSA BGN 0.6035
CAAS SGD 0.7377
Croatia Control HRK 0.1593
DCA Cyprus EUR 1.1806
DFS EUR 1.1806
DHMI TRY 0.1757
DSNA EUR 1.1806
EANA ARS 0.0336
EANS EUR 1.1806
ENAIRE EUR 1.1806
ENAV EUR 1.1806
FAA-ATO USD 1.0000
HCAA EUR 1.1806
HungaroControl HUF 0.0035
IAA EUR 1.1806
Isavia ISK 0.0092
JANS JPY 0.0091
KCAA KES 0.0098
LFV SEK 0.1149
LGS EUR 1.1806
LPS EUR 1.1806
LVNL EUR 1.1806
MATS EUR 1.1806
M-NAV MKD 0.0181
MOLDATSA MDL 0.0595
MUAC EUR 1.1806
NATS (Continental) GBP 1.3342
NAV CANADA CAD 0.7546
NAV Portugal (Continental) EUR 1.1806
NAVIAIR DKK 0.1584
Oro navigacija EUR 1.1806
PANSA PLN 0.2660
PNGASL PGK 0.2900
ROMATSA RON 0.2537
Sakaeronavigatsia GEL 0.3940
SANS SAR 0.2667
SENEAM MXN 0.0521
skeyes EUR 1.1806
skyguide CHF 1.0000
Slovenia Control EUR 1.1806
SMATSA RSD 0.0097
TCAA TZS 0.0004
UkSATSE UAH 0.0386
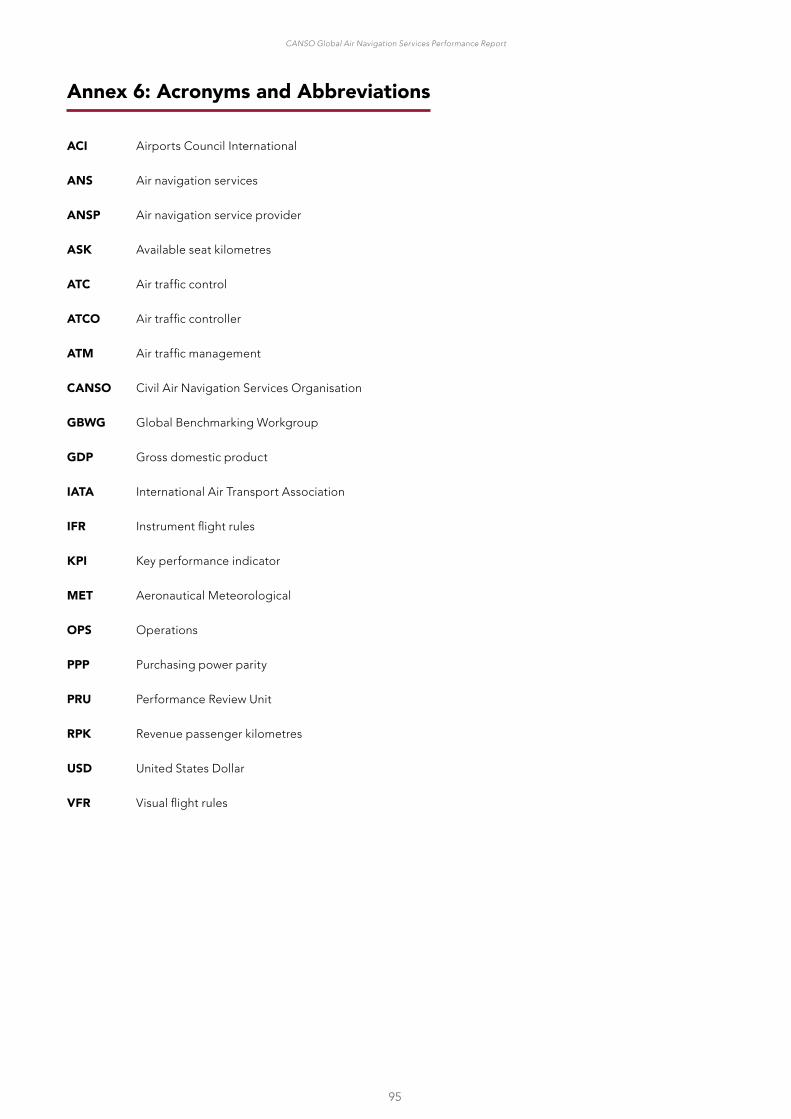
95
CANSO Global Air Navigation Services Performance Report
Annex 6: Acronyms and Abbreviations
ACI Airports Council International
ANS Air navigation services
ANSP Air navigation service provider
ASK Available seat kilometres
ATC Air traffic control
ATCO Air traffic controller
ATM Air traffic management
CANSO Civil Air Navigation Services Organisation
GBWG Global Benchmarking Workgroup
GDP Gross domestic product
IATA International Air Transport Association
IFR Instrument flight rules
KPI Key performance indicator
MET Aeronautical Meteorological
OPS Operations
PPP Purchasing power parity
PRU Performance Review Unit
RPK Revenue passenger kilometres
USD United States Dollar
VFR Visual flight rules

96
CANSO Global Air Navigation Services Performance Report
Annex 7: Sources
Definitions: EUROCONTROL Specification for Economic Information Disclosure V2.6
EUROCONTROL Specification for Economic Information Disclosure V3.0
ACE benchmarking report data dashboard: eurocontrol.int/ACE/ACE-Home.html
Industry Trends:aci.aero
atag.org
aviationbenefits.org/media/166344/abbb18_full-report_web.pdf
iata.org/publications/Documents/iata-annual-review-2018.pdf
Exchange rate data: data.oecd.org/conversion/exchange-rates.htm
bankofengland.co.uk/boeapps/iadb/index.asp?Travel=NIxIRx&levels=2&XNotes=Y&A3790XNode3790.x=7&A3790XNode3790.y=5&Nodes=&SectionRequired=I&HideNums=-1&ExtraInfo=true#BM
xe.com/currencytables/
exchangerates.org.uk/US-Dollar-USD-currency-table.html
IMF World Economic Outlook database: imf.org/external/pubs/ft/weo/2017/01/weodata/index.aspx
PPP rate data:data.oecd.org/conversion/purchasing-power-parities-ppp.htm
https://www.imf.org/external/datamapper/PPPEX@WEO/OEMDC/ADVEC/WEOWORLD

2 CANSO STANDARD OF EXCELLENCE IN SAFETY MANAGEMENT SYSTEMS
canso.org


