
Dr. Ahmad Al-Shafei, MBChB, PhD, MHPE
Associate Professor in Physiology
KSU
Dr. Ahmad Al-Shafei, MBChB, PhD, MHPE
Associate Professor in Physiology
KSU
Cardiovascular Block
Electrocardiogram (ECG)

Learning outcomes
Describe the procedure of recording an electrocardiogram.Define the different ECG leads.State Einthoven’s law and describe its physiological significance.Discuss the ECG waves, intervals and segments.Calculate the electrical axis of the heart and discuss its diagnostic uses.Discuss usefulness of ECG.Define and interpret normal sinus rhythm.
After reviewing the PowerPoint presentation, lecture notes and associated material, the student should be able to:

Learning Resources
Textbooks :
Guyton and Hall, Textbook of Medical Physiology; 12th Edition.Mohrman and Heller, Cardiovascular Physiology; 7th Edition.Ganong’s Review of Medical Physiology; 24th Edition.
Websites:
http://accessmedicine.mhmedical.com/
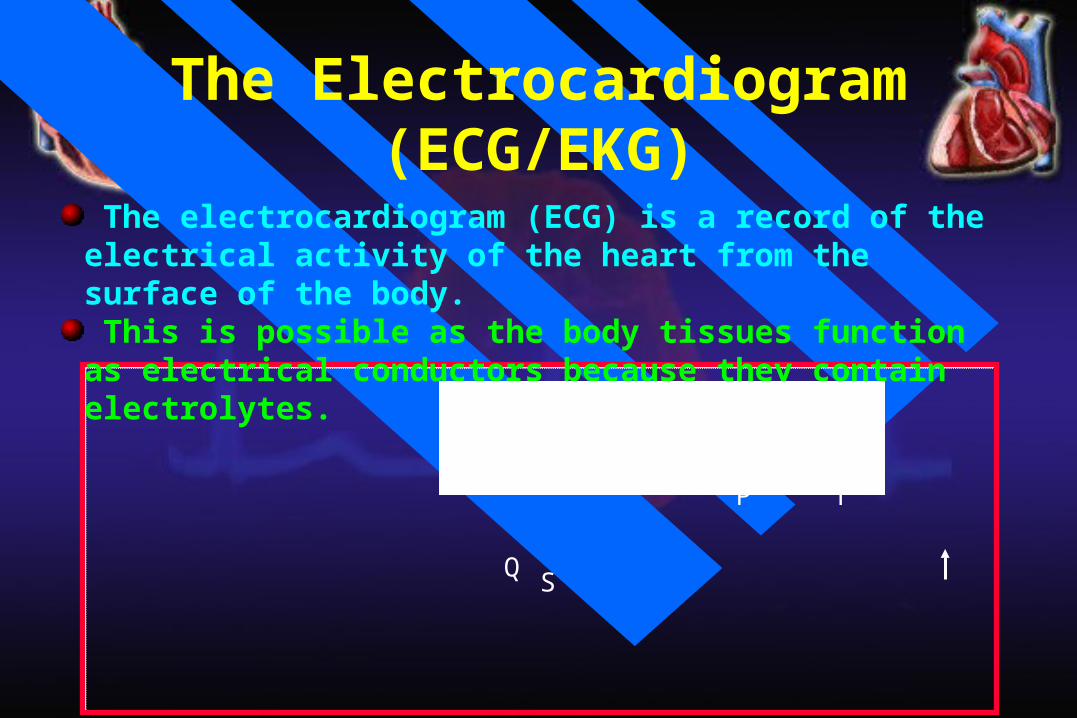
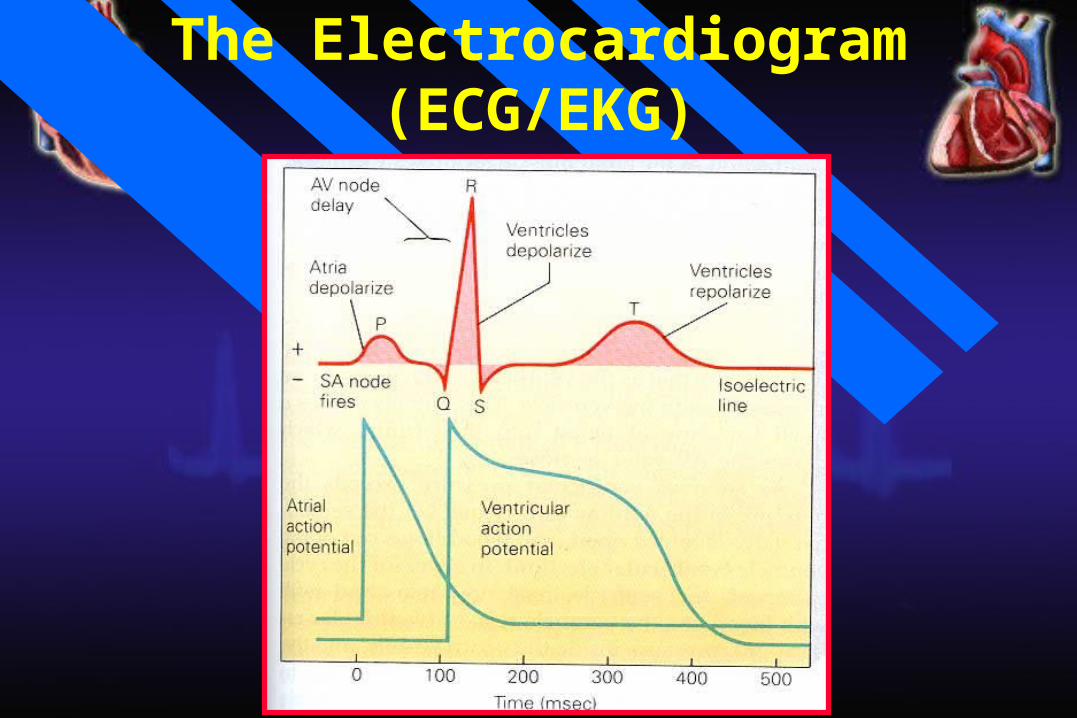
The electrocardiogram (ECG) is a record of the electrical activity of the heart from the surface of the body. This is possible as the body tissues function as electrical conductors because they contain electrolytes.
P T
Q S
The Electrocardiogram(ECG/EKG)

The Electrocardiogram(ECG/EKG)
The Electrocardiogram(ECG/EKG)
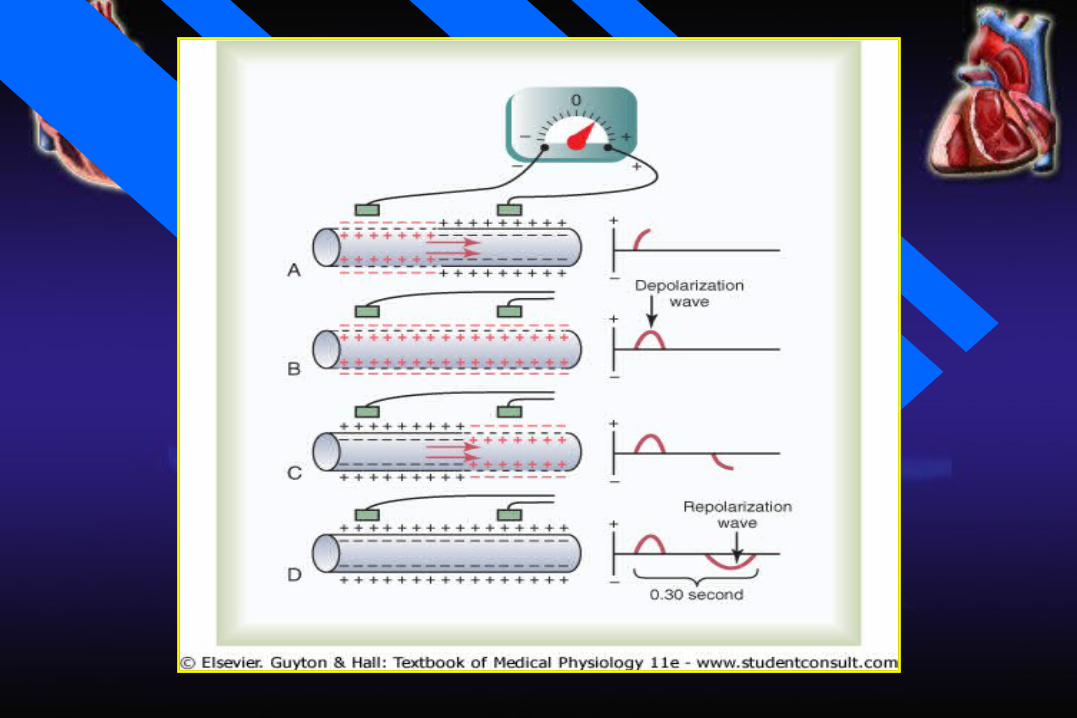
If a recording electrode is applied on any point on the surface of the trunk, it will detect electrical waves reflecting the electrical activity in the heart. These electrical waves may be as small as 1 mv and are amplified, recorded on ECG paper / monitor / computer and stored.A positive wave is recorded when depolarization is propagating towards the electrode or when repolarization is propagating away from the electrode. A negative wave is recorded when depolarization is propagating away from the electrode or when repolarization is propagating towards the electrode. When there are no propagating potentials, no waves are recorded and the recording needle will be on the line of zero potential, which is called the isoelectric line.
The Electrocardiogram(ECG/EKG)
The active and reference electrodes
For recording an ECG, two electrodes are required.
One of the them is the active electrode (also called searching electrode or exploring electrode) which is applied to a recoding point on the surface of the body.
The other is the reference electrode which serves a reference to the active electrode.
Recording pointson the body surface
By convention, there are nine standard points on the surface of the body from which an ECG should be recorded.
Six points are on the chest wall and the other three points are on the limbs.

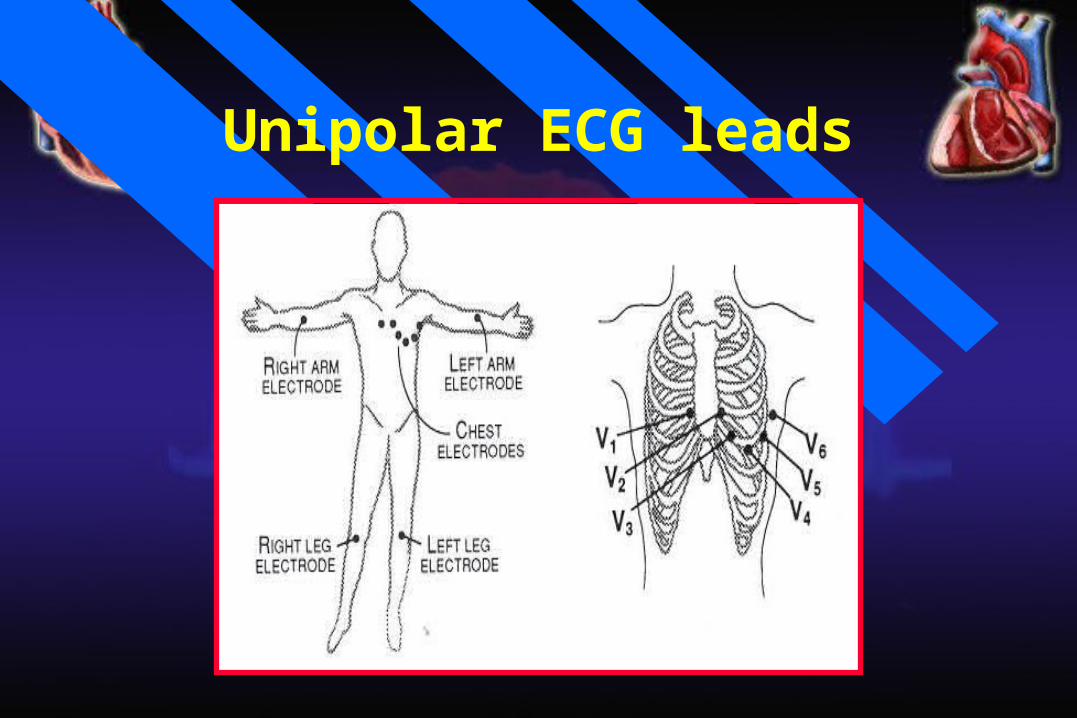
Chest points
V1: at the right fourth intercostals space near the sternum.V2: at the left fourth intercostals space near the sternum.V3: midway between V2 and V4.
V4: at the left fifth intercostals space at the midcalvicular line.V5: at the left fifth intercostals space at the anterior axillary line.V6: at the left fifth intercostals space at the midaxillary line.

Chest points
Limb points
VL: at the junction of the left arm with the trunk. Any point on the left upper limb has the same potential.
VR: at the junction of the right arm with the trunk. Any point on the right upper limb has the same potential.
VF: at the junction of the left lower limb with the trunk. Any point on the left or right lower limbs has the same potential.

ECG leadsAn ECG lead is the ECG record obtained when the recording electrodes are placed at specific points on the body.
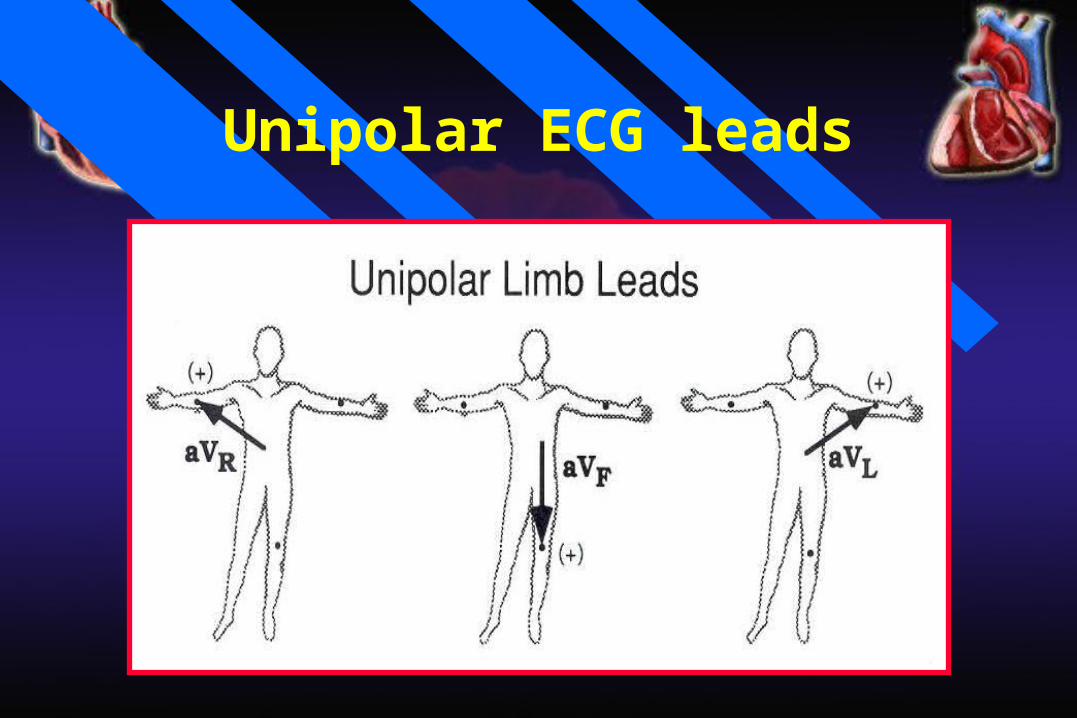
Unipolar ECG leads
These are the ECG records obtained when the reference electrode is at zero potential. The active electrode is applied to the recording points on the body surface.
There are six standard unipolar chest leads recorded from the six standard chest points and designated as V1, V2, V3, V4, V5 and V6.
There are other three standard unipolar limb leads recorded from the standard limb points and designated as aVL, aVR, aVF.
Unipolar ECG leads
Unipolar ECG leads

Bipolar ECG leads
These are the ECG records obtained when the active electrode is applied to a recording point and the reference electrode is applied to another recording point.
The ECG will be a record of the changes in electrical potential at the active electrode relative to the reference electrode.
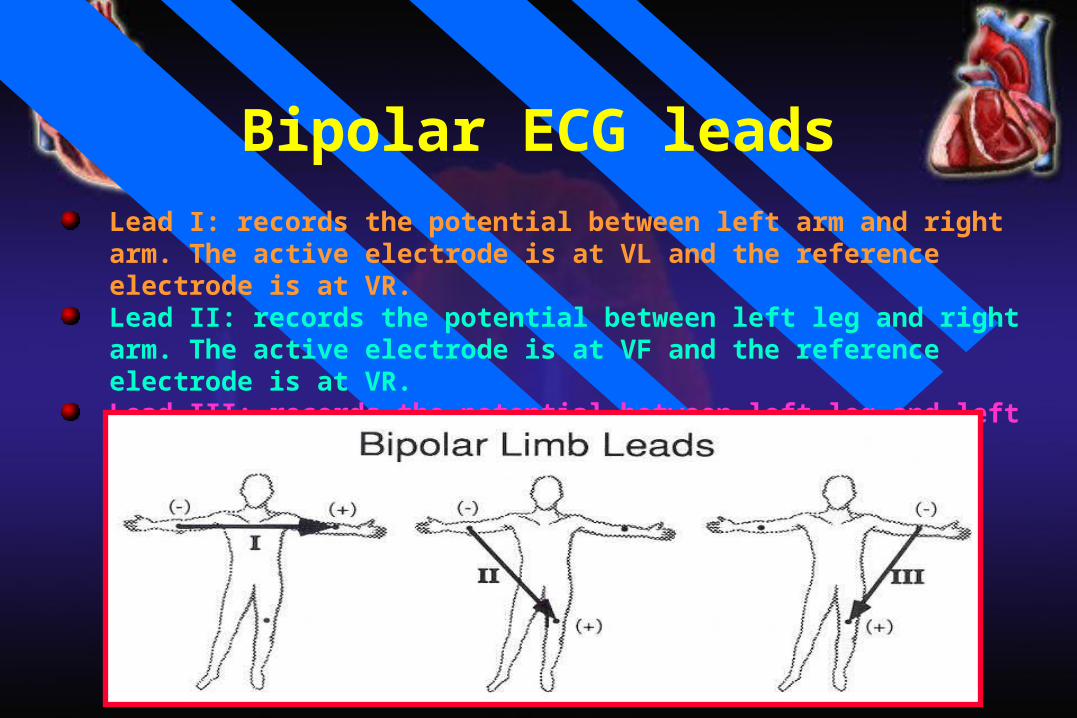
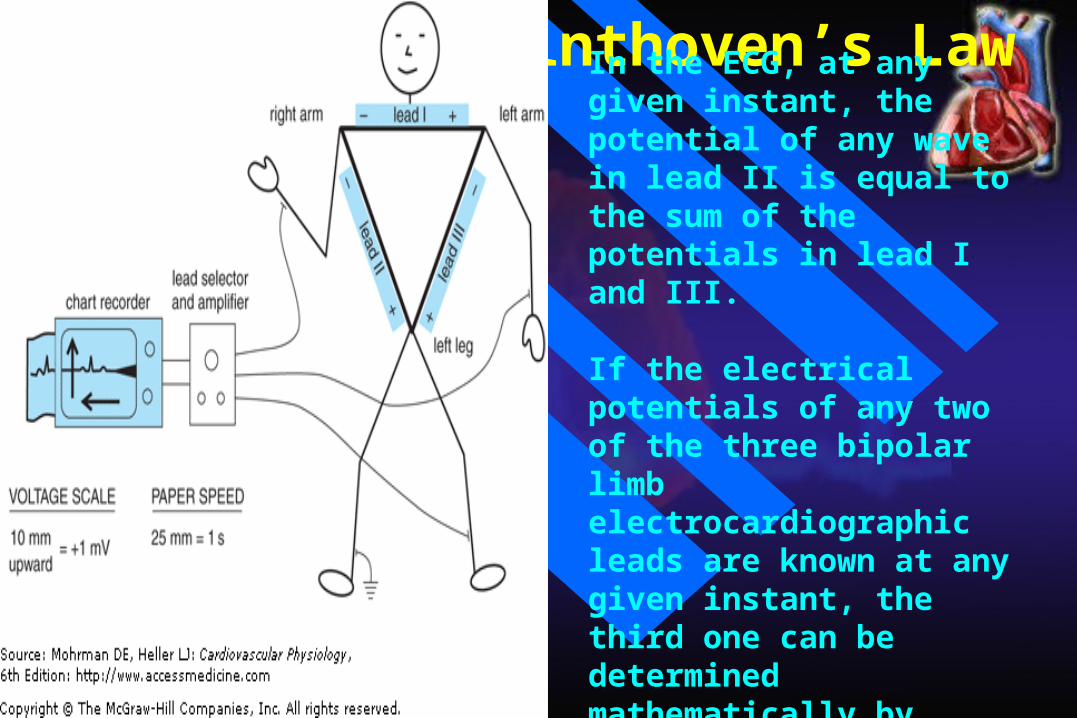
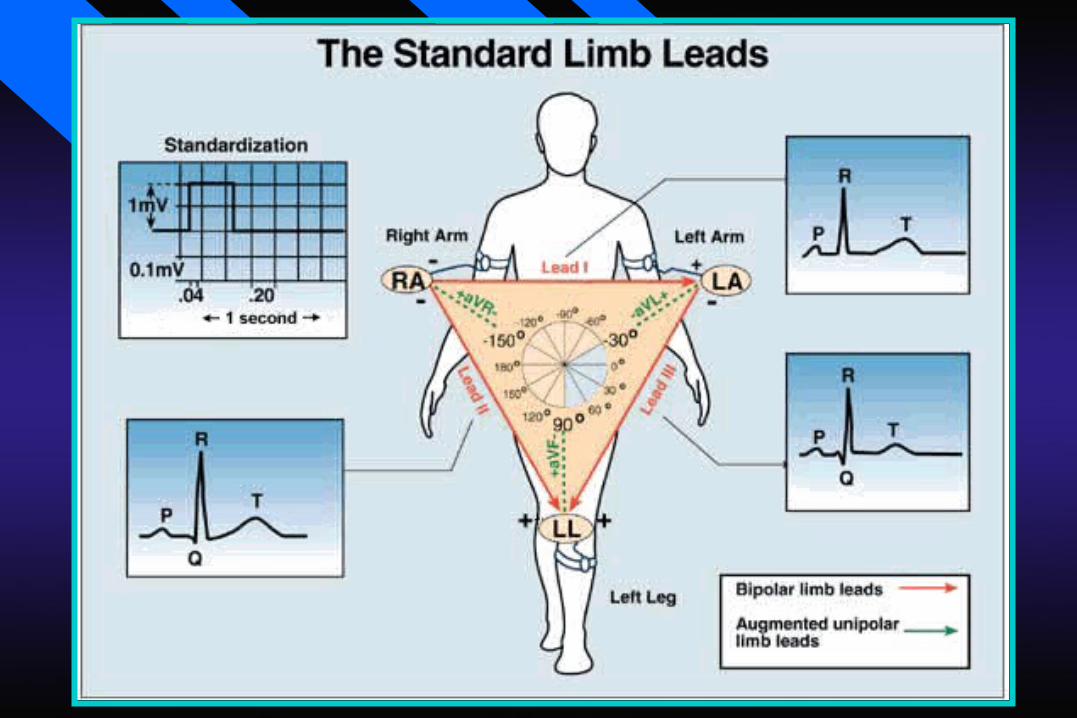
Lead I: records the potential between left arm and right arm. The active electrode is at VL and the reference electrode is at VR.Lead II: records the potential between left leg and right arm. The active electrode is at VF and the reference electrode is at VR. Lead III: records the potential between left leg and left arm. The active electrode is at VF and the reference electrode is at VL.
Bipolar ECG leads
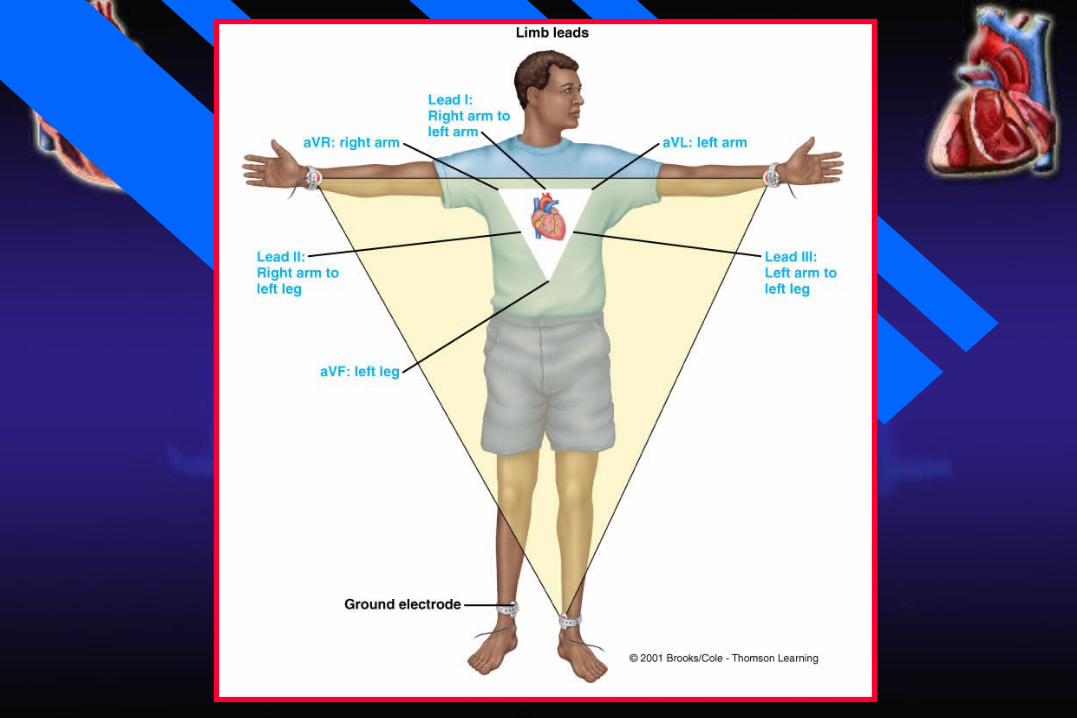

Einthoven’s Law
In the ECG, at any given instant, the potential of any wave in lead II is equal to the sum of the potentials in lead I and III.
Lead I = ELA- ERA
Lead II = ELL- ERA Lead III = ELL- ELA
E = electrical potential
EI + EIII = EII
Einthoven’s Law
In the ECG, at any given instant, the potential of any wave in lead II is equal to the sum of the potentials in lead I and III.
If the electrical potentials of any two of the three bipolar limb electrocardiographic leads are known at any given instant, the third one can be determined mathematically by simply summing the first two.

Recording an ECG
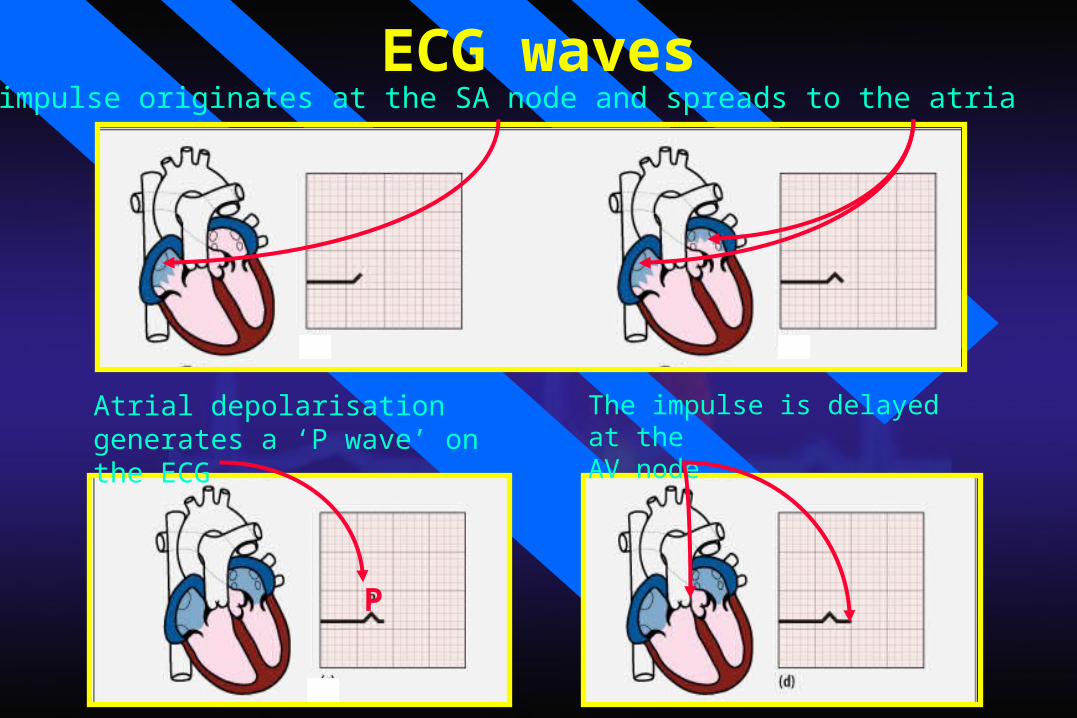
ECG wavesThe impulse originates at the SA node and spreads to the atria
Atrial depolarisation generates a ‘P wave’ on the ECG
The impulse is delayed at the AV node
P

The impulse then spreads to ventricles generating a QRS complex
R
SQ
Ventricles uniformly depolarised - ST segment
T
Ventricles repolarize T wave

ECG

Question
Why atrial repolarization does not appear in ECG?
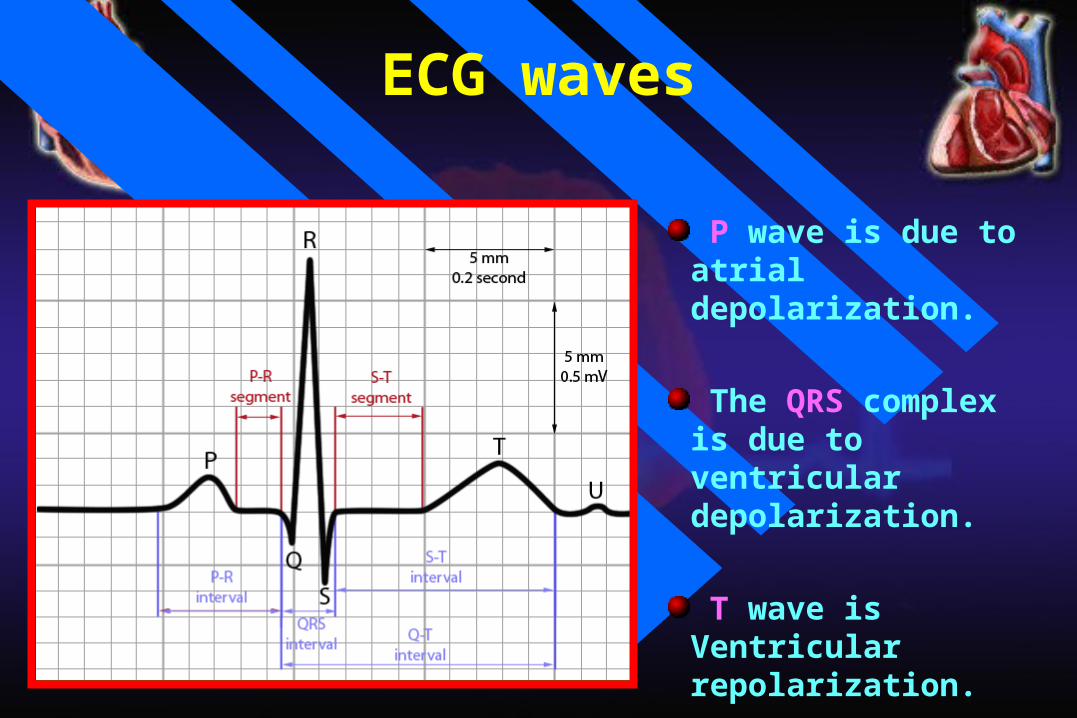
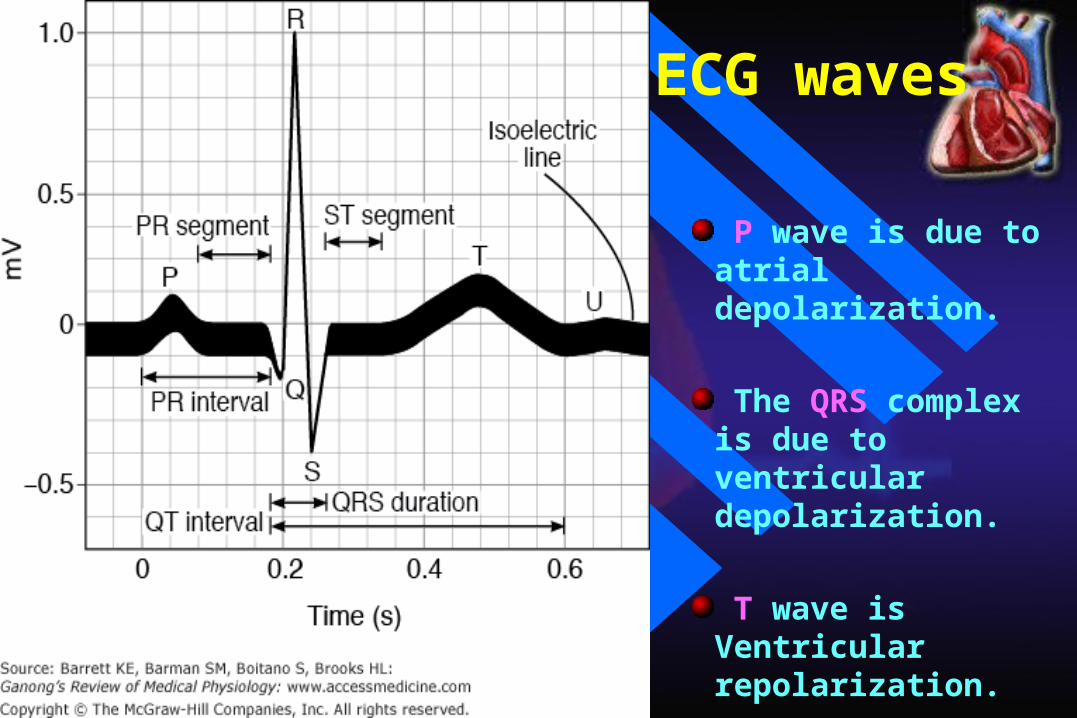
P wave is due to atrial depolarization.
The QRS complex is due to ventricular depolarization.
T wave is Ventricular repolarization.
ECG waves
P wave is due to atrial depolarization.
The QRS complex is due to ventricular depolarization.
T wave is Ventricular repolarization.
ECG waves
ECG intervalsand segments
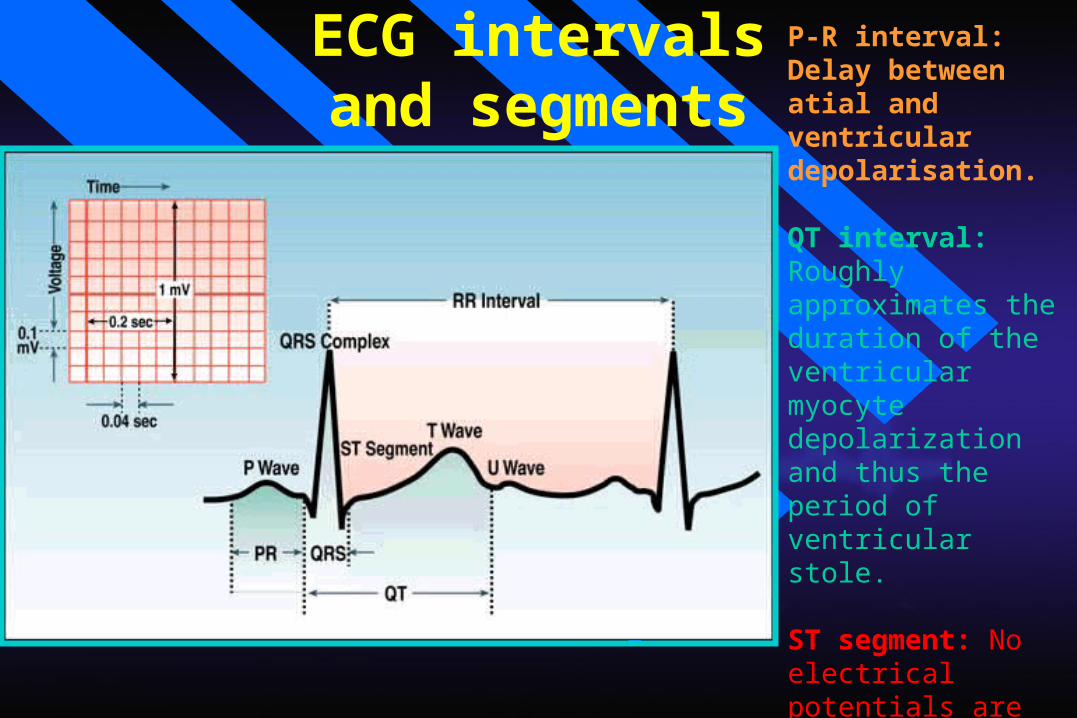
P-R interval: Delay between atial and ventricular depolarisation.
QT interval: Roughly approximates the duration of the ventricular myocyte depolarization and thus the period of ventricular stole.
ST segment: No electrical potentials are measured on the body surface; ventricular muscle cells are in the plateau phase of their action potentials.
Normal ECG intervals
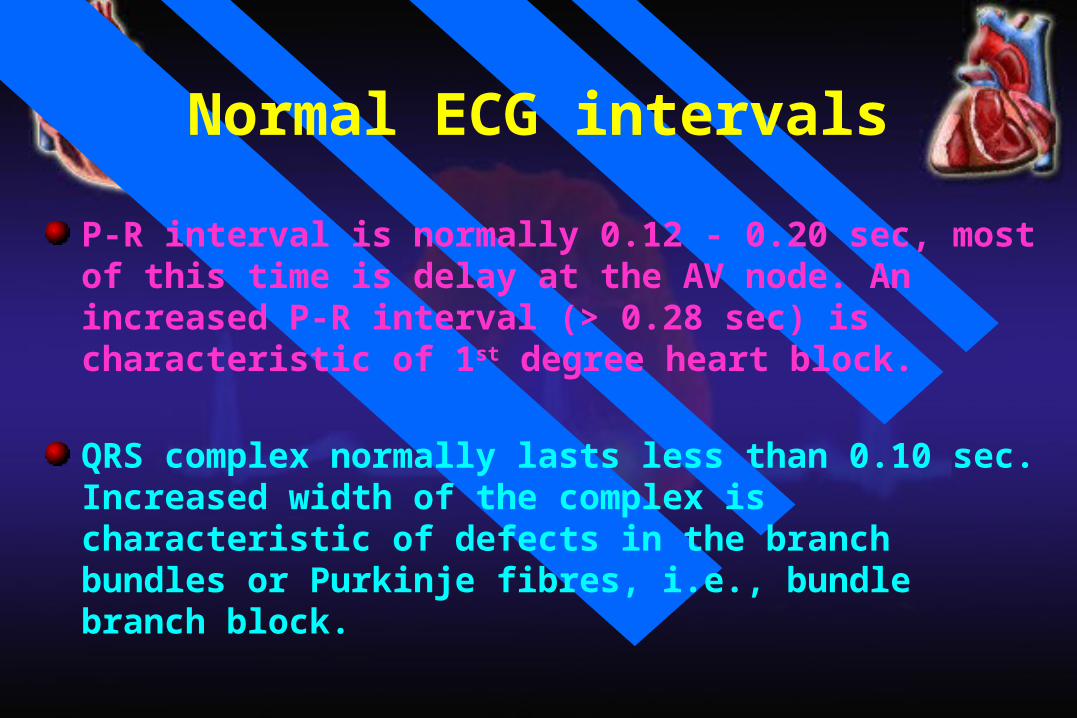
P-R interval is normally 0.12 - 0.20 sec, most of this time is delay at the AV node. An increased P-R interval (> 0.28 sec) is characteristic of 1st degree heart block.
QRS complex normally lasts less than 0.10 sec. Increased width of the complex is characteristic of defects in the branch bundles or Purkinje fibres, i.e., bundle branch block.

Mean electrical axisof the ventricles (cardiac axis)
The mean electrical axis of the ventricles describes the net direction and magnitude of current movement during ventricular depolarization.
It is affected by a number of factors, including the position of the heart, heart mass, and conduction time.
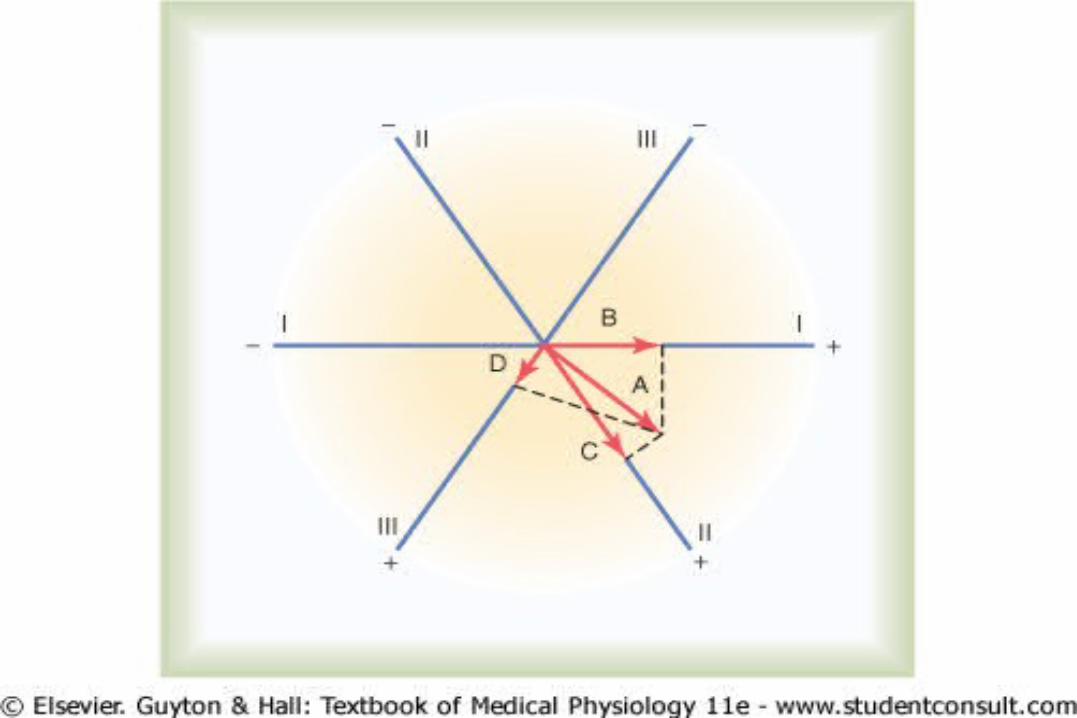
It can be calculated by summing the depolarization during the QRS complex in any two leads.
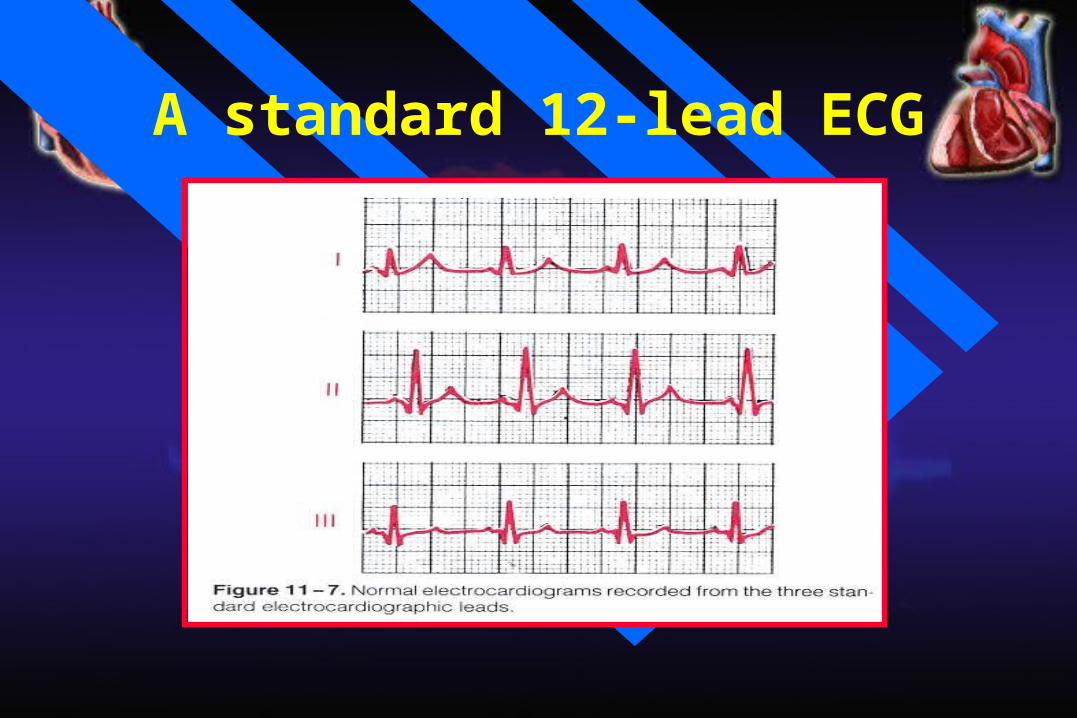
A standard 12-lead ECG
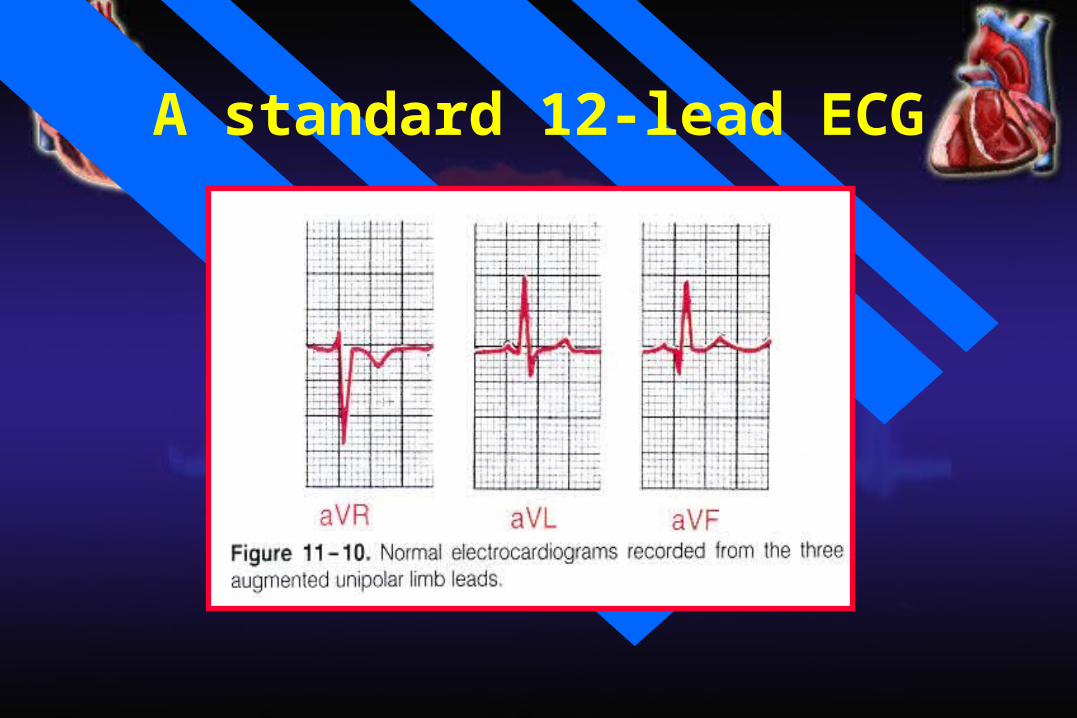
A standard 12-lead ECG
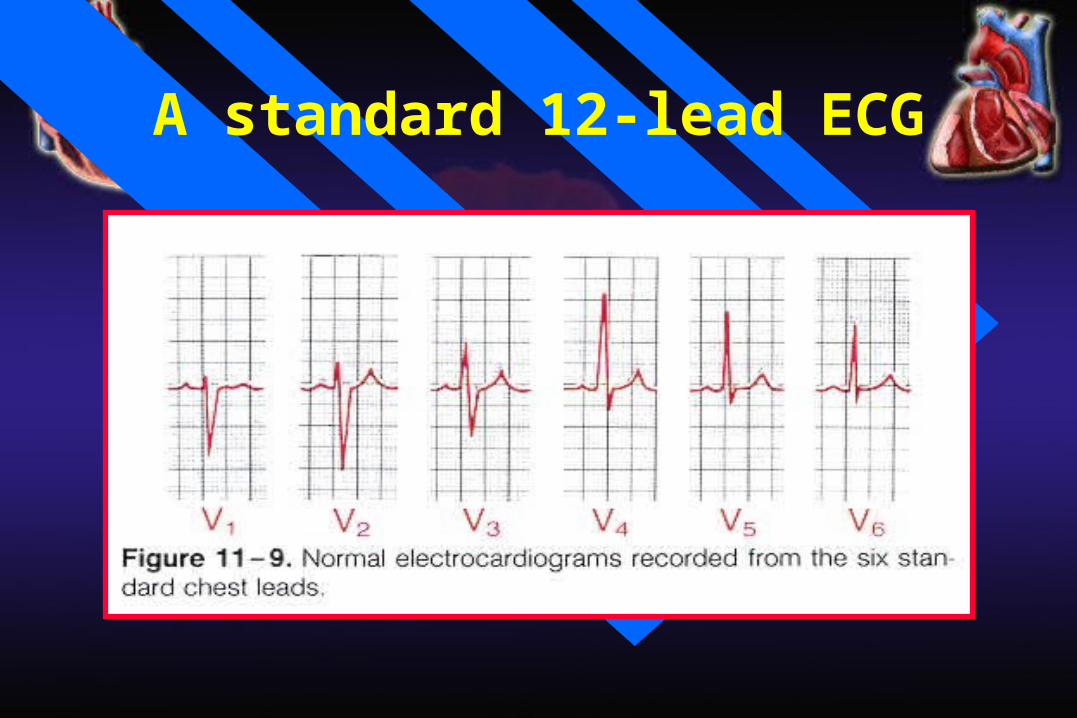
A standard 12-lead ECG
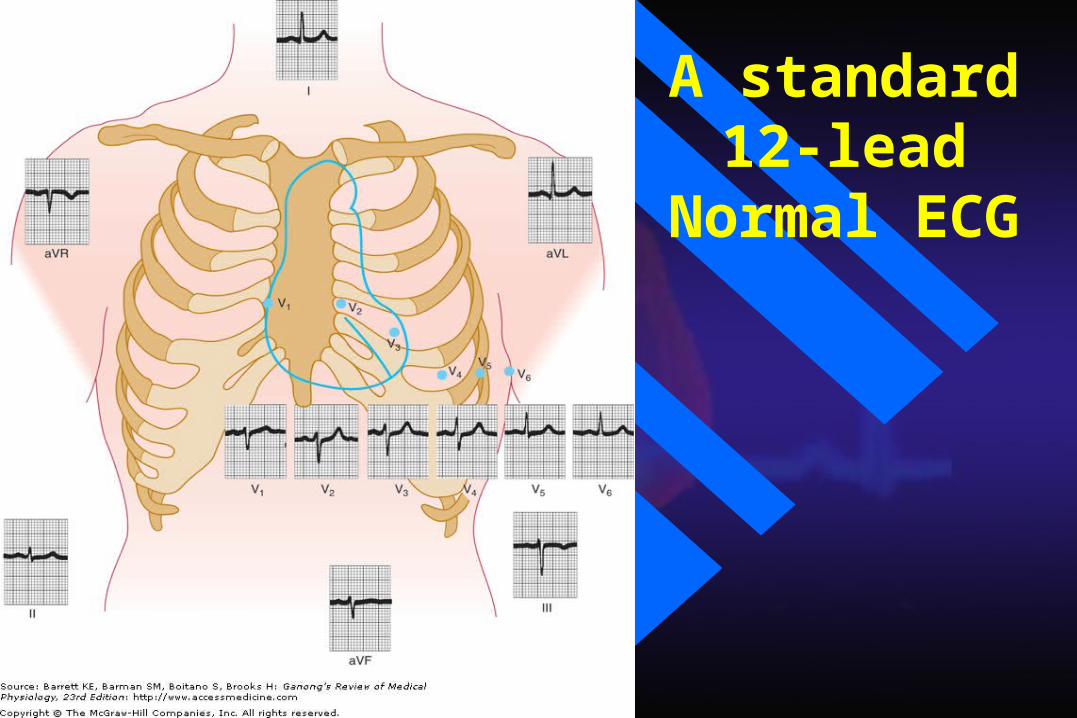
A standard 12-lead Normal
ECG
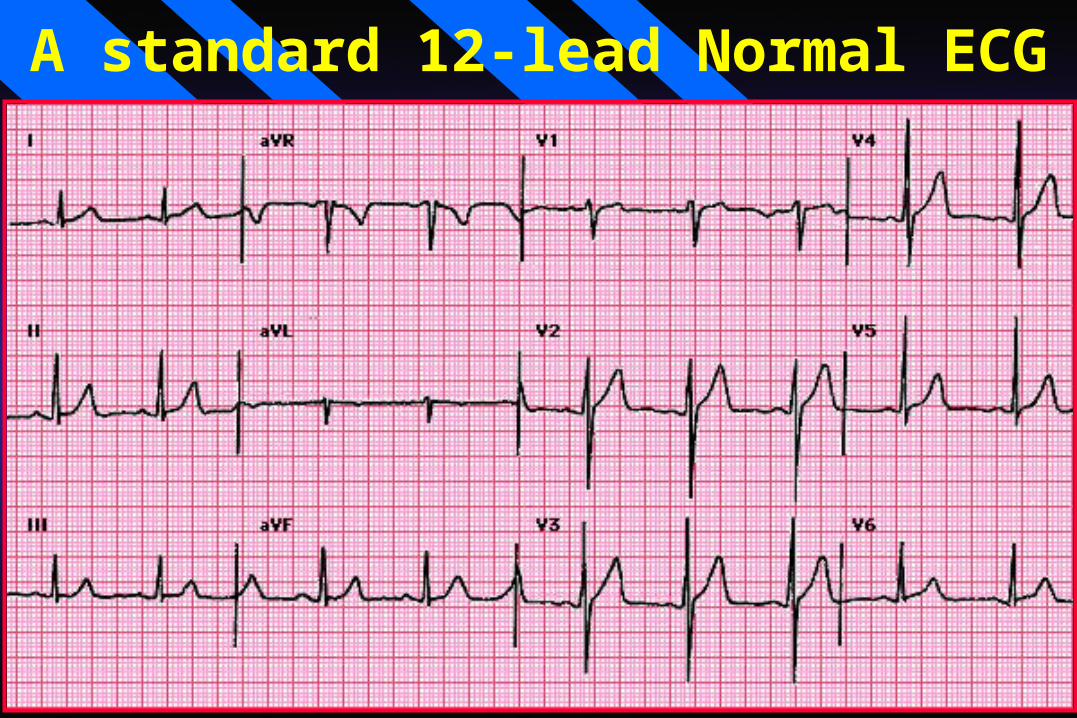
A standard 12-lead Normal ECG

ECG Interpretation Rate
Rhythm
Axis
Hypertrophy
Myocardial ischemia, injury and Infarction
The ECG provides NO information about pumping or mechanical events in the heart.
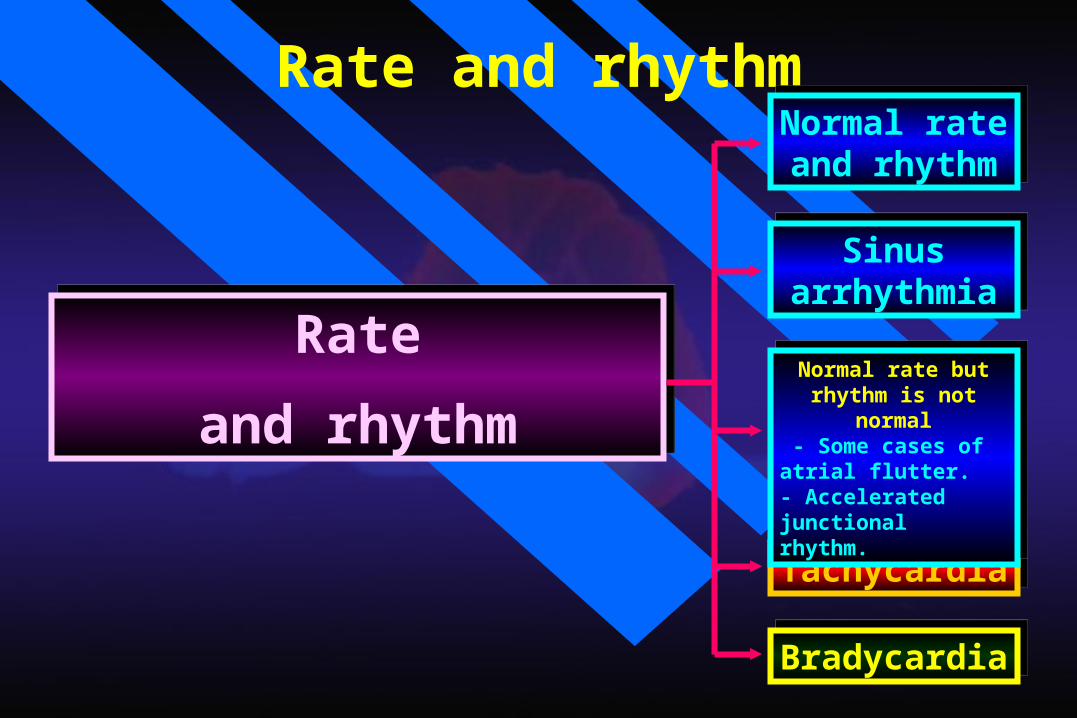
Rate and rhythm
Rate
and rhythm
Rate
and rhythm
Normal rate and rhythm
Normal rate and rhythm
TachycardiaTachycardia
BradycardiaBradycardia
Sinus arrhythmia
Sinus arrhythmia
Normal rate but rhythm is not normal
- Some cases of atrial flutter.- Accelerated junctional rhythm.
Normal rate but rhythm is not normal
- Some cases of atrial flutter.- Accelerated junctional rhythm.

Normal rate and rhythm
Sinus rhythm
Each P followed by QRS with resulting P:QRS ratio 1:1.
Impulses originate in the SA node regularly at a rate of 60-100 per minute in adults.
P waves upright and of uniform size and contour from beat to beat.
All complexes are evenly spaced

Normal rate and rhythm
Sinus rhythm

Diagnostic use of the cardiac electrical axis
Deviation to the Right
Increased Right Ventricular Mass
Chronic obstructive lung diseasePulmonary embolismCongenital heart defectsSevere pulmonary hypertension
Deviation to the Left
Increased Left Ventricular Mass
HypertensionAortic stenosisIschemic heat disease
The normal direction of the mean QRS vector is generally said to be –30 to +110° . Left or right axis deviation is said to be present if the calculated axis falls to the left of –30° or to the right of +110°, respectively.
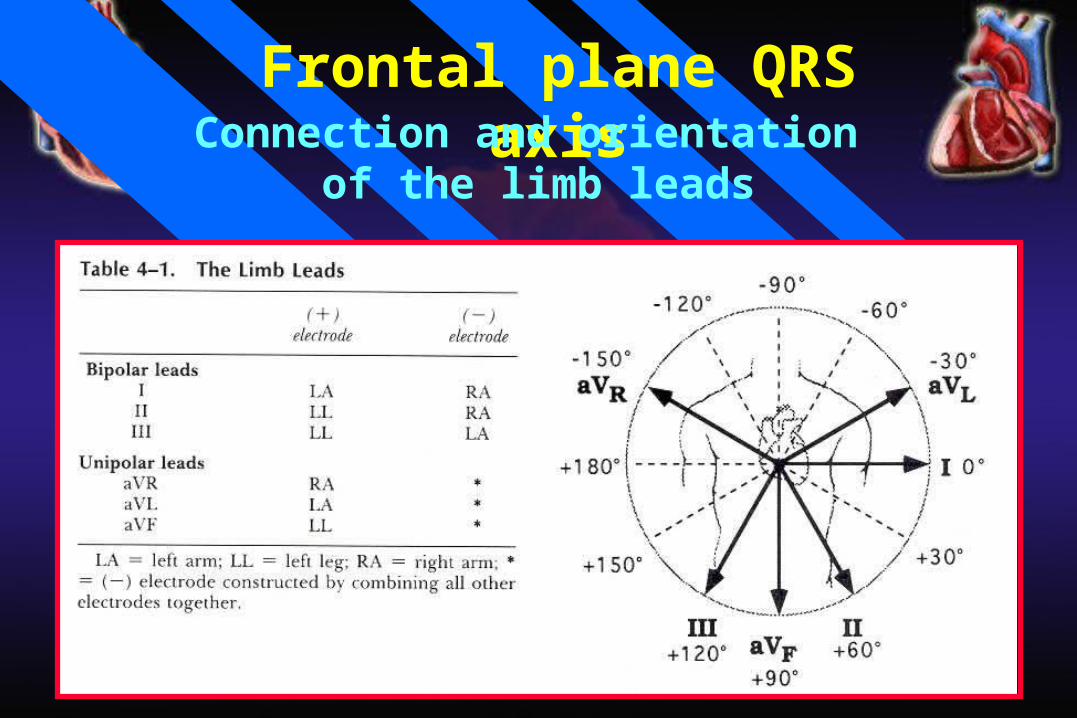
Frontal plane QRS axisConnection and orientation
of the limb leads
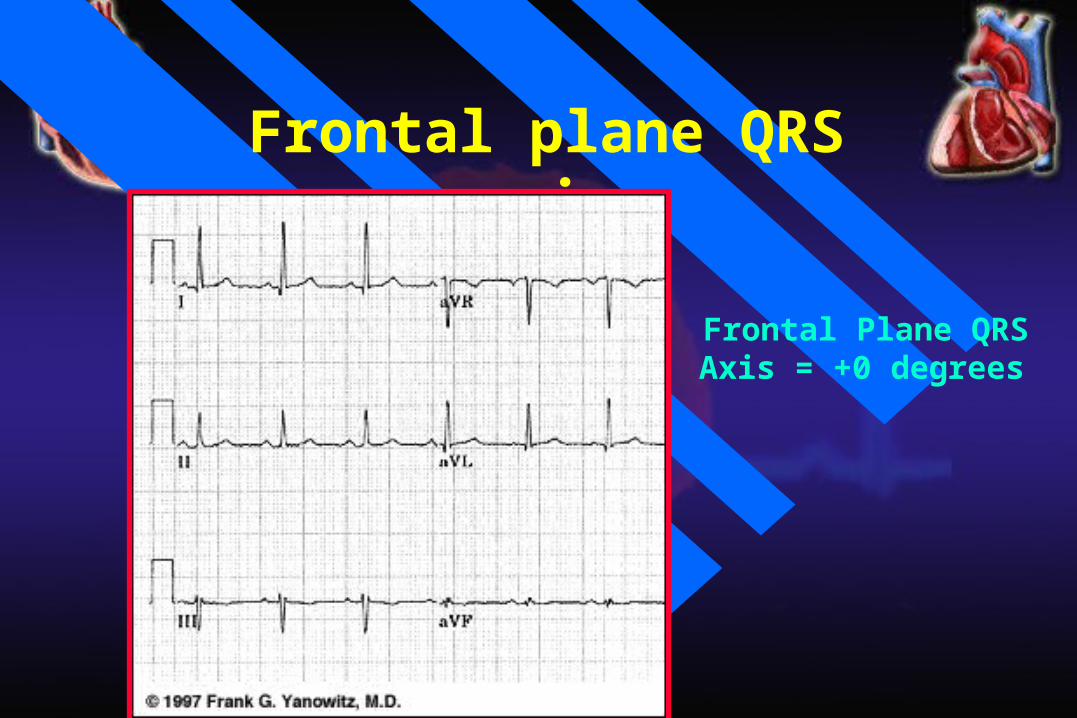
Frontal plane QRS axis
Frontal Plane QRS Axis = +0 degrees
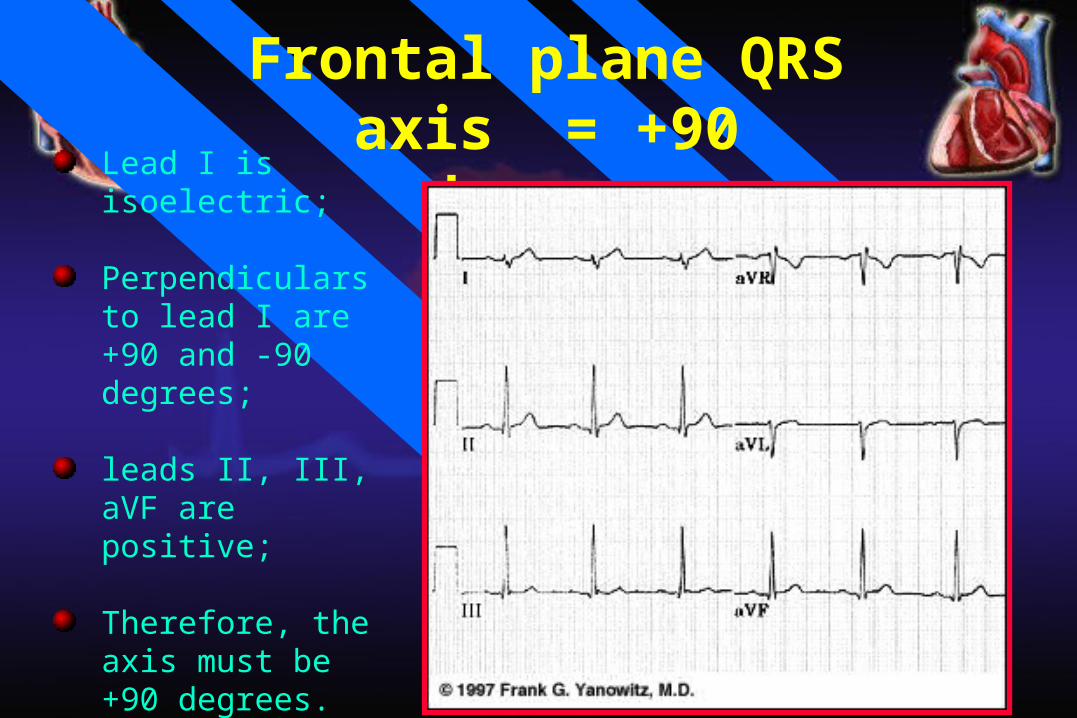
Frontal plane QRS axis = +90 degrees
Lead I is isoelectric;
Perpendiculars to lead I are +90 and -90 degrees;
leads II, III, aVF are positive;
Therefore, the axis must be +90 degrees.
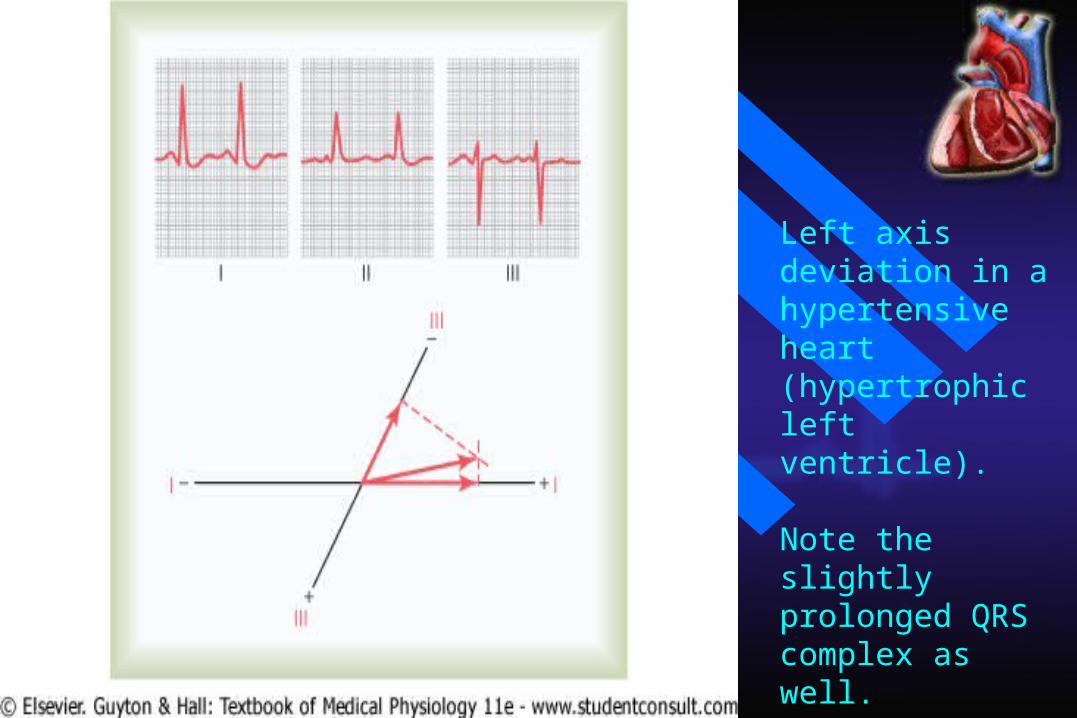
Left axis deviation in a hypertensive heart (hypertrophic left ventricle).
Note the slightly prolonged QRS complex as well.

Right axis deviation in a patient with right ventricular hypertrophy.


