Download - Case Study Pepsi v Coca Cola
Authors: Eva-Lena Andersson 820517
Evelina Arvidsson 820410 Cecilie Lindström 820404
School of Management and Economics Fed 323; International Marketing Strategy Master’s thesis, spring 2006 Examiner: Anders Pehrsson
Coca-Cola or Pepsi; that is the Question
- A study about different factors affecting consumer preferences
ABSTRACT
Abstract
Master thesis, School of Management and Economics, Växjö University FED 323; International Marketing Strategy, spring 2006 Authors: Eva-Lena Andersson, Evelina Arvidsson, and Cecilie Lindström Examiner: Anders Pehrsson Title: Coca-Cola or Pepsi; that is the question – A study about different factors affecting consumer preferences
Background: Today, advertising is a multi-billion industry, employing hundreds of thousands
of people and affecting billions of people’s lives worldwide. Yet, seeing as advertising clutter
has increased tremendously and is more intense than ever, it is vital that companies
differentiate themselves from competitors by creating even more powerful, entertaining and
innovative advertisement messages, as well as sponsoring different events. Examples of such
companies that spend billion of dollars on marketing strategies in order to stay key players in
their industry are The Coca-Cola Company and PepsiCo.
Purpose: The overall purpose of this paper is to gain a deeper understanding of different
international and local factors affecting consumer preferences on a local market.
Method: A quantitative method was applied, and thus a questionnaire with 150 respondents on
the local market was conducted. The respondents were divided into three different age groups:
≤ 18, 19-34, and ≥ 35, and represent a diverse set of people who are at different stages in their
lives.
Conclusions: International advertising and international sponsorship respectively influence the
local target group in different ways, but they also affect international brand in that they have
an impact on brand image and brand equity. Moreover, depending on a person’s age,
consumers view brands differently, and thus have an effect on international brand alone, but
also in combination with international advertisement and international sponsorship. Together,
these factors influence the way in which a brand is perceived, and consequently influence
consumer preferences.
ACKNOWLEDGEMENTS
Acknowledgements
“We shall not fail or falter; we shall not weaken or tire...Give us the tools and we will
finish the job”
- Sir Winston Churchill, 1941
This Master’s thesis was written during the spring of 2006, and is the result of ten weeks
of hard work and dedication. Although it was challenging at times, the process was
interesting and motivating, and provided us with a deeper knowledge in the area within
consumer preferences.
This thesis however, would not have been made possible if it had not been for a number
of people. First and foremost, we would like to take the opportunity to express our
gratitude to our mentor, Anders Pehrsson, professor at the School of Management and
Economics, Växjö University, for his help and guidance throughout the process of this
thesis. We would also like to thank those who helped us in finalizing the questionnaire
and gave us concrete feedback in how to modify the questionnaire to perfection. Finally,
we would like to thank all of the 150 respondents who took time out of their busy
schedules to participate in this study and therefore made this thesis possible.
Växjö, May 29, 2006
Eva-Lena Andersson Evelina Arvidsson Cecilie Lindström
- 1 -
Table of contents 1. Introduction ........................................................................................................................... 4
1.1 Background ................................................................................................................................. 4 1.2 Problem Discussion ..................................................................................................................... 5 1.3 Purpose......................................................................................................................................... 7 1.4 Delimitations................................................................................................................................ 7
2. Theoretical Framework......................................................................................................... 8 2.1 Consumer Preferences................................................................................................................ 8 2.2 Target Group............................................................................................................................. 10
2.2.1 Age ......................................................................................................................................................... 10
2.3 Brand.......................................................................................................................................... 12 2.3.1 Brand Equity .......................................................................................................................................... 12
2.4 Advertisement............................................................................................................................ 14 2.4.1 Standardization vs. Adaptation.............................................................................................................. 15 2.4.2 The language used in advertising campaigns........................................................................................ 16
2.5 Sponsorship ............................................................................................................................... 16 2.5.1 Event Sponsorship ................................................................................................................................. 17 2.5.2 Sports Sponsorship ................................................................................................................................ 18 2.5.3 Celebrity Endorsement .......................................................................................................................... 19
2.6 Analysis Model .......................................................................................................................... 20 2.6.1 Hypotheses............................................................................................................................................. 20
3. Methodology ........................................................................................................................ 22 3.1 Choice of Subject....................................................................................................................... 22 3.2 Research Approach................................................................................................................... 23 3.3 Data Collection .......................................................................................................................... 23
3.3.1 Questionnaire ......................................................................................................................................... 24 3.3.2 Sample Selection ................................................................................................................................... 24 3.3.3 Operational Measures of Theoretical Framework ................................................................................ 25
3.4 Value of Study ........................................................................................................................... 27 3.4.1 Validity .................................................................................................................................................. 27 3.4.2 Reliability............................................................................................................................................... 28
3.5 Revision of the Chosen Methodology ...................................................................................... 28 4. Empirical Data .................................................................................................................... 30
5. Analysis ................................................................................................................................ 39 5.1 International Advertising ......................................................................................................... 40 5.2 International Sponsorship........................................................................................................ 42 5.3 International Brand .................................................................................................................. 45 5.4 Local Target Group .................................................................................................................. 47 5.5 Hypotheses ................................................................................................................................. 54
- 2 -
6. Conclusions......................................................................................................................... 56 6.1 Research Question..................................................................................................................... 56 6.2 Reflections.................................................................................................................................. 58 6.3 Proposed Future Research ....................................................................................................... 59
8. References............................................................................................................................ 60
Appendix 1: The Coca-Cola Company
Appendix 2: PepsiCo
Appendix 3: The Cola War
Appendix 4: Questionnaire - English
Appendix 5: Questionnaire - Swedish
Appendix 6: Significant Difference Table - Chi-square test
Table of figures Figure 2.1; Factors influencing consumer behaviour 8
Figure 2.4; Possible advertising objectives 14
Figure 2.5.1; A model of image creation and image transfer in
event sponsorship 17
Figure 2.6; Analysis model 20
Figure 4.1; Glasses/Week 30
Figure 4.2; Choice of Brand 30
Figure 4.3; Factors affecting choice of brand 31
Figure 4.4; Views on Brands 31
Figure 4.5; Brand Associations 32
Figure 4.6; Logo & Slogan Associations 32
Figure 4.7; Knowledge of Coca-Cola’s & Pepsi’s Advertisement 33
Figure 4.8; Advertisements' influence on choice of cola product 34
Figure 4.9; Prefer Advertisement in Swedish 34
Figure 4.10; Views on Celebrity Endorsement 35
Figure 4.11; Views on David Beckham 35
Figure 4.12; Opinions about Sports- and Music Events 36
Figure 4.13; Knowledge of Coca-Cola’s & Pepsi’s Sponsorship 36
Figure 4.14; Opinions about Coca-Cola's Sponsorship of
the Olympic Games 2006 37
Figure 4.15; Blind Taste Test 38
- 3 -
Figure 5; Brand Preference vs. Blind Taste Test 39
Figure 5.1.1; the Relationship between Various Advertisement Factors 40
Figure 5.1.2; Prefer Advertisement in Swedish vs.
Advertisement’s influence on choice of product 41
Figure 5.2.1; the Relationship between Various Sponsorship Factors 42
Figure 5.2.2; Opinions about Coca-Cola’s Sponsorship of the Olympic Games
vs. Influence consumption of Coca-Cola 43
Figure 5.2.3; Opinions about Pepsi’s Sponsorship of David Beckham vs.
Influence consumption of Pepsi 44
Figure 5.3.1; Quality Associations vs. Blind Taste Test 45
Figure 5.3.2; Brand Preference vs. Factors 46
Figure 5.4.1; Age vs. Glasses/ Week 47
Figure 5.4.2; Age vs. Reason for Preference 48
Figure 5.4.3; Age vs. Associations to Coca-Cola and Pepsi 49
Figure 5.4.4; Age vs. Preferring Advertising in Swedish 49
Figure 5.4.5; Age vs. Positive View on Brands 50
Figure 5.4.6; Age vs. Knowledge of Brands’ Advertisement 51
Figure 5.4.7; Age vs. Sponsorship’s Influence on Product Choice 52
Figure 5.4.8; Age vs. Coca-Cola's Sponsorship of the Olympic Games 2006 53
Figure 5.4.9; Age vs. Blind Taste Test 53
Figure 6.1; Modified Analysis Model 58
- 4 -
1. Introduction This Master thesis initiates with a brief description of the background to our chosen field of study;
thereafter a problem discussion follows, which is then funnelled down to the purpose. Finally, the chapter
ends with the limitations that have been taken into consideration.
1.1 Background “Advertising can be traced back to the very beginnings of recorded history. Archaeologists
working in the countries around the Mediterranean Sea dug up signs announcing various
events and offers. The Romans painted walls to announce gladiator fights […] during the
Golden Age in Greece, town criers announced the sale of cattle, crafted items and even
cosmetics […]” (Kotler et al. 2002, p. 661).
Today, advertising is a multi-billion industry, employing hundreds of thousands of people and
affecting billions of people’s lives worldwide (http://encarta.msn.com). In 2000, international
advertisement spending exceeded $414 billion (Kotler et al. 2002), and according to Zenith
Optimedia (www.marketwatch.com), it is believed that spending will maintain a 6 per cent
growth rate for the next couple of years, increasing to an estimated $427 billion this year and
to $451 billion next year.
However, as a consequence of long-term changes, such as the increase of a larger and more
diverse range of media, as well as the arrival of new technologies, particularly the Internet,
consumers have become better informed than ever, and as a result, some of the traditional
advertising methods are no longer as effective as they used to be (www.economist.com).
Instead, firms have increasingly employed other marketing tools, such as corporate
sponsorship of sports, arts and cultural events to name a few (Ruth et al. 2003). Sponsorship
is claimed to be the world’s fastest growing form of marketing, and in 2001, worldwide
spending was estimated to be as much as $24.6 billion. Moreover, sponsorship activities are
applied with the belief that companies can enter international markets and appeal to local
consumer preferences (Dolphin 2003). This promotional tool has proved to be successful in
reaching a large global audience, and seeing as consumer behaviours differ greatly in
preferences and product choices, it is apparent why sponsorship has outperformed other
marketing methods (http://geoff.cox.free.fr).
- 5 -
INTRODUCTION
Yet, as a result of globalization, the use of advertisement across cultural borders has grown
immensely, and while one expert claims that the average person is daily exposed to 1,600
advertisements, another expert estimates the total number to be as much as 5,000 a day
(Armstrong et al. 2005), “from billboards to bumper stickers to logos on caps and T-shirts”
(www.thegredecompany.com). Seeing as advertising clutter has increased tremendously and
is more intense than ever, it is vital that companies differentiate themselves from competitors
by creating even more powerful, entertaining, and innovative advertisement messages.
However, this has proven to be very costly, especially within highly competitive product
markets, such as the soft-drink industry, which requires higher advertising budgets just to stay
even with competitors. Examples of such companies that spend billion of dollars on
advertising in order to stay key players in their industry are The Coca-Cola Company and
PepsiCo (http://business.enotes.com) (see Appendix 1 and 2).
Not only are Coca-Cola and Pepsi dominant market leaders on the worldwide beverage
market, but they are also two of the most notable and widely sold commercial brands in the
world (http://en.wikipedia.org), and annually spend billions of dollars on advertising
campaigns. In 2004, Coca-Cola’s worldwide advertising budget exceeded $1.5 billion, while
Pepsi’s advertising expenditure totalled $1.3 billion (www.mind-advertising.com). Coca-
Cola’s advertising has always been celebrated globally, and introduced its first advertising
theme in the early 1900's and has since seen plenty of popular themes that have become
recognised worldwide (www.coke.com). Today, Coca-Cola depends heavily on “images of
happiness and togetherness, tradition and nationalism”, whereas Pepsi relies more on the
appeal of celebrities, popular music, and young people in their television commercials
(www.geocities.com).
1.2 Problem Discussion
Not only can it be difficult to understand consumer behaviour and target groups’ needs on the
domestic market, but for multi-national companies, this is an even greater struggle. Despite
the fact that most of the world’s consumers have certain things in common, their values and
attitudes, as well as behaviour often differ. As a result, it is vital that international marketers
understand these differences and adapt their marketing strategies accordingly. Failure to do so
could result in disaster for a company’s international products and marketing programs. More
- 6 -
INTRODUCTION
specifically, the degree to which international advertisement should be adjusted in accordance
to distinctive consumer characteristics in different countries is of great concern for many
companies (Armstrong et al. 2005). Consequently, the debate about whether to standardize or
adapt an advertising campaign has come to dominate the area within the international
marketing literature for decades (Harris et al. 2003).
Although some notable international advertising campaigns have been successful, most multi-
national companies have difficulties in targeting and stimulating consumers from various
countries through a standardized marketing program. Moreover, as today’s economies are
becoming more entwined than ever, any possible method that can be used in supporting the
building of global brands is appealing. One of the primary objectives that international
marketers have is to create an image that is familiar worldwide, but at the same time
associated with explicit meanings (Fahy et al. 2004). Although advertising is still the number
one communication tool for businesses, immense changes within, for instance, technology has
required companies to implement other promotional strategies other than traditional
marketing communication tools. Moreover, employing a mixture of all marketing
communications components in order to sustain and build competitive advantages (Erdogan et
al. 1998).
One such promotional strategy is that of sponsorship, which to some extent share similar
objectives to advertising, such as sustaining and building corporate awareness. Although both
advertisement and sponsorship messages are delivered to a greater audience, the later
persuades its contexts more indirectly and implicitly. Moreover, Erdogan et al. (1998, p. 372)
claim that “messages sent by companies, are controlled to a greater extent in the case of
advertising than in the case of sponsorship even though sponsorships are being designed to
offer more precise, less cluttered ways for marketers to promote products and services
through sampling, demonstration, contests, and many interactive, educational, and family
activities”. Although it is believed by many that sponsorship has the potential to become the
marketing communication tool of the 21st century, research remains without theoretical base
and a clear definition of sponsorship does not exist (Dolphin, 2003).
The majority of the advertisement research that exist merely suggest which advertisement is
the best amid those that are evaluated, and despite the fact that one advertisement might be
- 7 -
INTRODUCTION
more memorable or cause more attention than others, this does not imply that there is a
definite relationship to consumer preferences and sales success (Hartley, 2001). The majority
of the sponsorship research has focused on “consumer awareness of sponsors and perceptions
of the sponsor’s image” (Carrillat, et al. 2005, p. 51), and accordingly there is little evidence
concerning the effect a company’s sponsorship activities have on consumers’ attitudes and
buying behaviour. Although demographic segmentation continues to have an influential role
within the marketing theory, the majority of the research focuses on the way in which
demographic variables affect marketing communications, particularly that of gender and
advertising. Merely little research can be found within the other demographic variables and
thus age segmentation theory is relatively limited (FitzGerald et al. 1996). As a result, more
knowledge about factors affecting consumer buying behaviour is needed. Thus we propose
the following question: to what extent do advertising, sponsorship, brand, and age affect
consumer preferences?
1.3 Purpose
The overall purpose of this paper is to gain a deeper understanding of different international
and local factors affecting consumer preferences on a local market. Specifically, we want to
explore the effect international well-recognized advertising campaigns have on consumers’
buying process. We also want to study whether or not there is a relationship between the
above mentioned factors’ influence on the choice of homogenous products.
1.4 Delimitations
We have limited our research to the cola drink industry, rather than the entire soft-drink
industry. Although we examine consumer perceptions on international brands’ marketing
strategies, the focus of the investigation will be on Coca-Cola’s and Pepsi’s advertisement and
sponsorship as well as their brands. Moreover, the study encompasses three specific target
groups in Sweden that have been divided in accordance to age, and thus we do not look at the
entire consumer population and as a result, generalization is not obtained. Finally, we have
concentrated on age segmentation, and thus other demographic variables are not observed.
- 8 -
2. Theoretical Framework Chapter two introduces the theories that are relevant to the purpose of this thesis. The following theories
that are presented below are: consumer preferences, target group, brand, advertisement and sponsorship.
Finally, the chapter ends with the analysis model and hypothesis.
2.1 Consumer Preferences
The consumer market amounts to a total of 6.3 billion people, and thus there is great demand
for an enormous variety of goods and services, especially as consumers differ from one
another in that of age, gender, income, education level, and tastes. Moreover, the relationships
between different consumers, as well as their contact with other elements of the world
surroundings, affect their choice of products, services, and companies (Kotler et al. 2005).
The reason why consumers buy what they do is often deeply rooted in their minds,
consequently consumers do not truly know what affects their purchases as “ninety-five
percent of the thought, emotion, and learning [that drive our purchases] occur in the
unconscious mind- that is without our awareness” (Armstrong et al. 2005, p. 143).
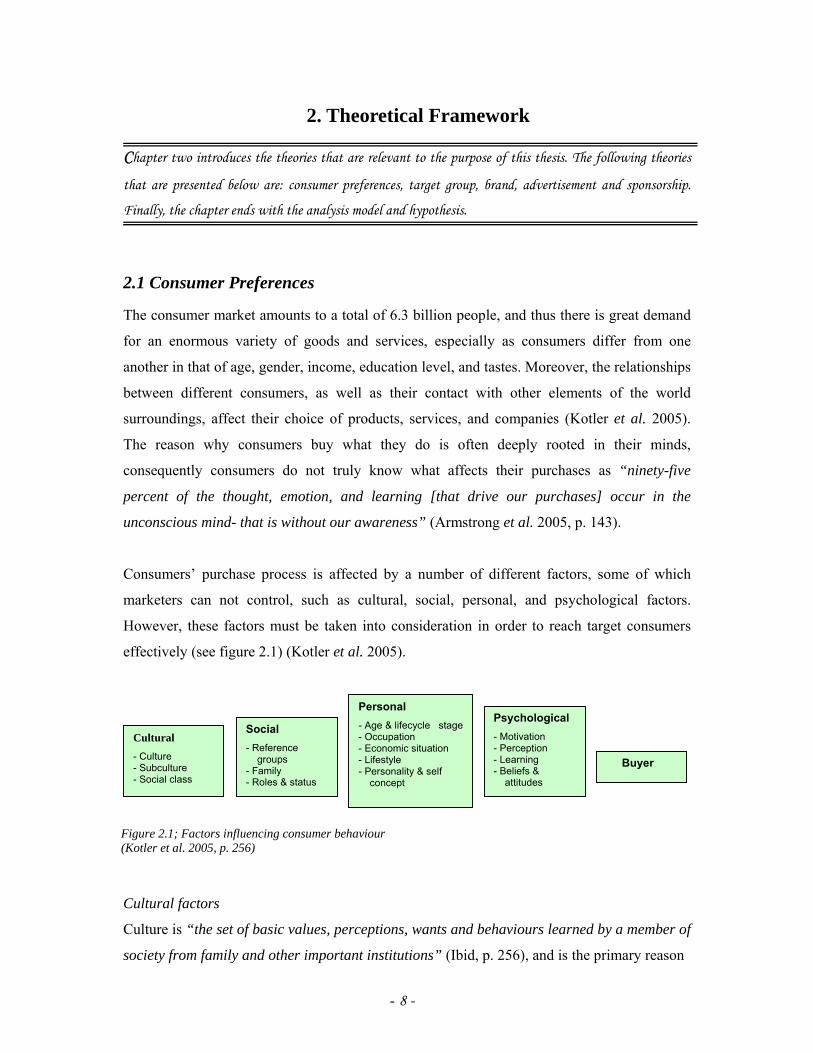
Consumers’ purchase process is affected by a number of different factors, some of which
marketers can not control, such as cultural, social, personal, and psychological factors.
However, these factors must be taken into consideration in order to reach target consumers
effectively (see figure 2.1) (Kotler et al. 2005).
Cultural factors
Culture is “the set of basic values, perceptions, wants and behaviours learned by a member of
society from family and other important institutions” (Ibid, p. 256), and is the primary reason
Social - Reference
groups - Family - Roles & status
Personal - Age & lifecycle stage - Occupation - Economic situation - Lifestyle - Personality & self
concept
Psychological - Motivation - Perception - Learning - Beliefs &
attitudes
Buyer
Cultural - Culture - Subculture - Social class
Figure 2.1; Factors influencing consumer behaviour (Kotler et al. 2005, p. 256)
- 9 -
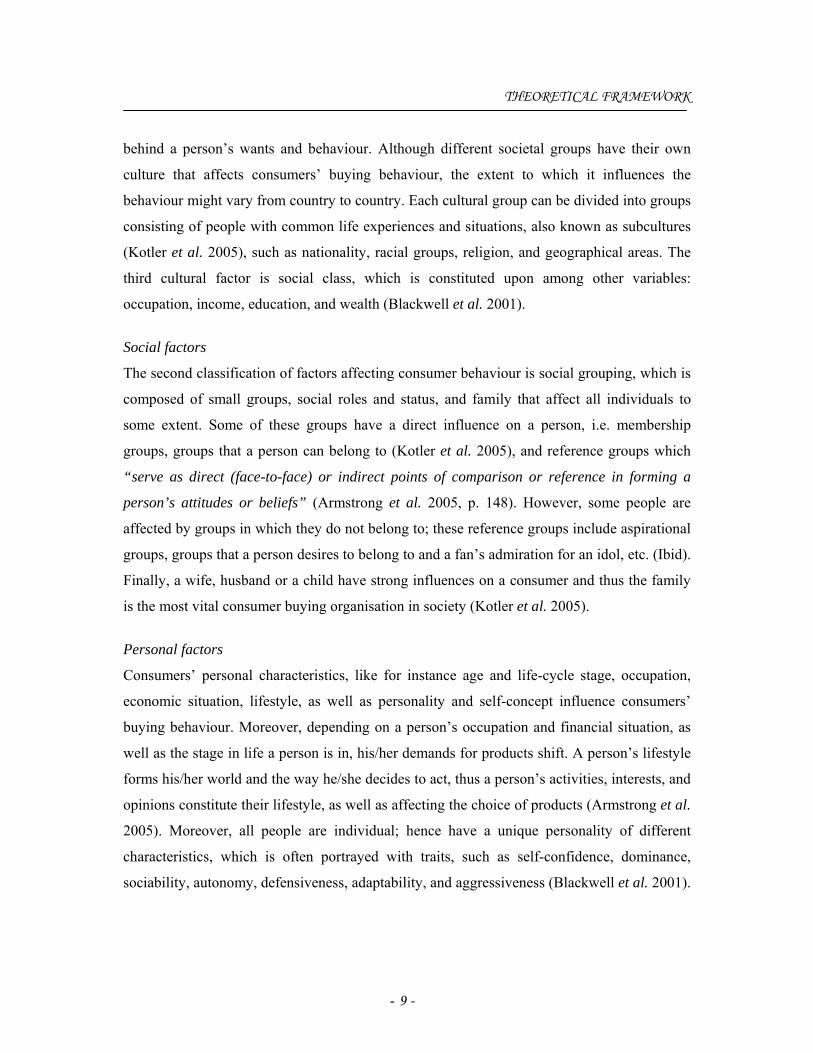
THEORETICAL FRAMEWORK
behind a person’s wants and behaviour. Although different societal groups have their own
culture that affects consumers’ buying behaviour, the extent to which it influences the
behaviour might vary from country to country. Each cultural group can be divided into groups
consisting of people with common life experiences and situations, also known as subcultures
(Kotler et al. 2005), such as nationality, racial groups, religion, and geographical areas. The
third cultural factor is social class, which is constituted upon among other variables:
occupation, income, education, and wealth (Blackwell et al. 2001).
Social factors
The second classification of factors affecting consumer behaviour is social grouping, which is
composed of small groups, social roles and status, and family that affect all individuals to
some extent. Some of these groups have a direct influence on a person, i.e. membership
groups, groups that a person can belong to (Kotler et al. 2005), and reference groups which
“serve as direct (face-to-face) or indirect points of comparison or reference in forming a
person’s attitudes or beliefs” (Armstrong et al. 2005, p. 148). However, some people are
affected by groups in which they do not belong to; these reference groups include aspirational
groups, groups that a person desires to belong to and a fan’s admiration for an idol, etc. (Ibid).
Finally, a wife, husband or a child have strong influences on a consumer and thus the family
is the most vital consumer buying organisation in society (Kotler et al. 2005).
Personal factors
Consumers’ personal characteristics, like for instance age and life-cycle stage, occupation,
economic situation, lifestyle, as well as personality and self-concept influence consumers’
buying behaviour. Moreover, depending on a person’s occupation and financial situation, as
well as the stage in life a person is in, his/her demands for products shift. A person’s lifestyle
forms his/her world and the way he/she decides to act, thus a person’s activities, interests, and
opinions constitute their lifestyle, as well as affecting the choice of products (Armstrong et al.
2005). Moreover, all people are individual; hence have a unique personality of different
characteristics, which is often portrayed with traits, such as self-confidence, dominance,
sociability, autonomy, defensiveness, adaptability, and aggressiveness (Blackwell et al. 2001).
- 10 -
THEORETICAL FRAMEWORK
Psychological factors
Four objects constitute this group of factors, namely motivation, perception, learning, and
beliefs & attitudes. When a person is motivated, he/she acts accordingly and the actions taken
are affected by the person’s perception of the situation. Perception is the individual selection,
organization and interpretation of the information which flows through people’s senses, and
consequently a meaningful picture of the world is formed. When people experience new
things, changes take place in their behaviour, i.e. they learn new things when they take action.
As a result, beliefs and attitudes are acquired and hence affect the buying behaviour
(Armstrong et al. 2005).
2.2 Target Group
Companies today recognize that they cannot appeal to all consumers in the marketplace since
consumers are too numerous, too widely scattered, and too varied in their needs and buying
practices. Therefore, companies must identify those parts of the market that they can best
serve, and thus build the right relationship with the right customers. This is also known as
target marketing and is the process of evaluating each market segment’s attractiveness and
selecting one or more segments to enter (Armstrong et al. 2005). One such segmentation is
demographic segmentation, where the market is divided into groups based upon demographic
variables such as age, sex, family size, religion, race, etc. Moreover, buyers within this
segment share common needs or characteristics that the company in turn decides to serve
(Kotler et al. 2002). This thesis will focus specifically on demographic segmentation,
particularly that of age.
2.2.1 Age
Seeing as consumers’ needs and interests for products vary depending on age, companies
employ age segmentation, offering different products or using different marketing approaches
for different age groups (Armstrong et al. 2005). Blackwell et al. (2001) divide the different
age groups into the following: children, teenagers, young adults, and baby boomers, thus the
thesis will concentrate on teenagers, young adults, and baby boomers.
- 11 -
THEORETICAL FRAMEWORK
Teenagers
This group of consumers have a variety of needs, such as a need for belonging, independence,
approval, and responsibility, as well as having the need for experimentation (Solomon et al.
2001). Teenagers are increasingly given the task of buying products for the family since they
not only have more spare time but also enjoy shopping more than their parents do. As a result,
marketers are targeting their ads primarily at teenagers. In order to gain teenagers’ attention
more effectively, advertising campaigns must be honest, have clear messages, and use
humour. Moreover, teenagers tend to be fickle and are likely to switch brand preference
quicker than any other age group, as they have a high need to be accepted by their friends
(Blackwell et al. 2001). Finally, teenagers are “easier targets, because they have grown up in
a culture of pure consumerism. Because of this, they are way more tuned into media because
there is so much more media to be tuned into” (Bush et al. 2004, p. 109).
Young adults
18 to 34-year-olds are included within the young adults group. This group view themselves as
being too young to worry about “grown up” issues, and live their lives for the “moment”
rather than for “tomorrow” (Ibid). Seeing as this age group is involved in most of the family
shopping, marketers have found them to evaluate advertising and products in a very
sophisticated manner. Moreover, as they have grown up in the era of media and technology,
“they see advertising as a form of entertainment but are turned of by overcommercialization”
(Solomon et al. 2001, p. 413).
Baby boomers
Baby boomers are the large cohort of people born after World War II. They have created a
permanent propensity to consume, given that they delay getting married and having children,
in order to focus on their careers, and thus creating a financial platform. Baby boomers buy
more and save less than past generations, and therefore marketers have aimed to satisfy their
wants (Blackwell et al. 2001). Finally, an advertisement that emits intense information is
more likely to be received by this age cohort than an image-oriented advertisement (Harmon
et al. 1999).
- 12 -
THEORETICAL FRAMEWORK
2.3 Brand
A brand can be defined as a “name, term, symbol, or design, or a combination of them, which
is intended to signify the goods or services of one seller or group of sellers and to differentiate
them from those of competitors” (Keller 1993, p. 2). Brand image takes place when brand
associations held in the mind of consumers are conveyed onto a consumer’s perception about
a brand. These associations can either be developed from direct experience with the product,
from the information communicated by the company, or from previous associations held
about the company and origin, etc. (Martinez et al. 2003).
2.3.1 Brand Equity
Brand equity is, according to Aaker (2005, p. 173) “a set of assets and liabilities to a brand’s
name and symbol that adds to or subtracts from the value provided by a product or service to
a firm and/or a firm’s customers”. These assets and liabilities can be grouped into four
categories: brand loyalty, brand awareness, perceived quality, and brand associations.
Brand Loyalty
Brand loyalty is a “form of repeat purchasing behaviour reflecting a conscious decision to
continue buying the same brand” (Solomon et al. 2001, p. 259). Moreover, in order for brand
loyalty to take place, customers must have a positive attitude towards a brand, as well as
being involved in repeated buying. If, in actual fact, a brand has been greatly advertised and
been around for some time, it can generate an emotional attachment by either being integrated
into the consumer’s self-image or linked to past experiences (Ibid).
Brand Awareness
Brand awareness entails that recognition is communicated onto a brand, which allows
consumers to identify with the brand product, and thus providing companies with constant
competitive advantage (Aaker, 2005). For low involvement products, products “bought
frequently and with a minimum of thought and effort” (buseco.monash,edu.au), awareness can
affect a consumer’s buying decision through a sense of familiarity, whereas for high
involvement products, brand awareness provides consumers with a sense of presence and
assurance (Aaker, 2005).
- 13 -
THEORETICAL FRAMEWORK
Perceived Quality
Perceived quality can be defined as “the customer’s perception of the overall quality or
superiority of a product or service with respect to its intended purpose, relative to
alternatives” (Aaker, 1991 p. 85). Perceived quality is initially a consumer’s perception about
a product, and thus is a tangible overall opinion about a brand. Nevertheless, this feeling is
usually based upon fundamental dimensions, such as product features and performance.
Furthermore, perceived quality is often differentiated from the actual quality, and can derive
from past experiences involving former products or services (Ibid).
Brand Association
Brand association can either be linked directly or indirectly with a customer’s thought about a
brand. Those associations that have the clearest significance are built upon product attributes,
such as physical product characteristics and non-material product characteristics (Armstrong
et al. 2005), and customer benefits - “the desirable consequences consumers seek when
buying and using products and brands” (Peter et al. 1994, p. 87), which provide customers
with a motive to buy the product, consequently resulting in brand loyalty (Aaker, 1991).
2.3.2 Brand positioning
Positioning refers to “consumers’ perception of a brand as compared with that of
competitors’ brands, that is, the mental image that a brand, or the company as a whole,
evokes” (Czinkota et al. 2001, p. 313). Moreover, researchers claim that positioning can
provide benefits to the consumer through a set of different product attributes (Albaum et al.
2002). Thus, companies must position their brands/products clearly in the minds of the target
consumers. This can be done through the positioning on product attributes, however,
companies must bear in mind that these attributes are easily copied by competitors. More
specifically, consumers are often not interested in attributes as such, but are rather concerned
with what the attributes will actually do for them (Armstrong et al. 2005). Another way in
which marketers can position brands is by associating a brand with a name that encompasses
pleasing and desired benefits (Peter et al. 1994). However, strong brands go beyond attribute
or benefit positioning, and instead are positioned on strong beliefs and values. (Armstrong et
al. 2005).
- 14 -
THEORETICAL FRAMEWORK
2.4 Advertisement
Advertising informs consumers about the existence and benefits of products and services, and
tries to persuade consumers to buy them (MacKenzie, 2004). Moreover, Kotler et al. (2005),
claim that advertising aims at attaining target consumers to either think or react to the product
or brand. As a method of achieving advertisement goals, advertisements as well as their
content play a vital role in the process of commercial communication. More specifically, it is
the advertised product and brand as well as the content of the advertisement that determine
greater or lesser memory retention among the consumers (Royo-Vela, 2005).
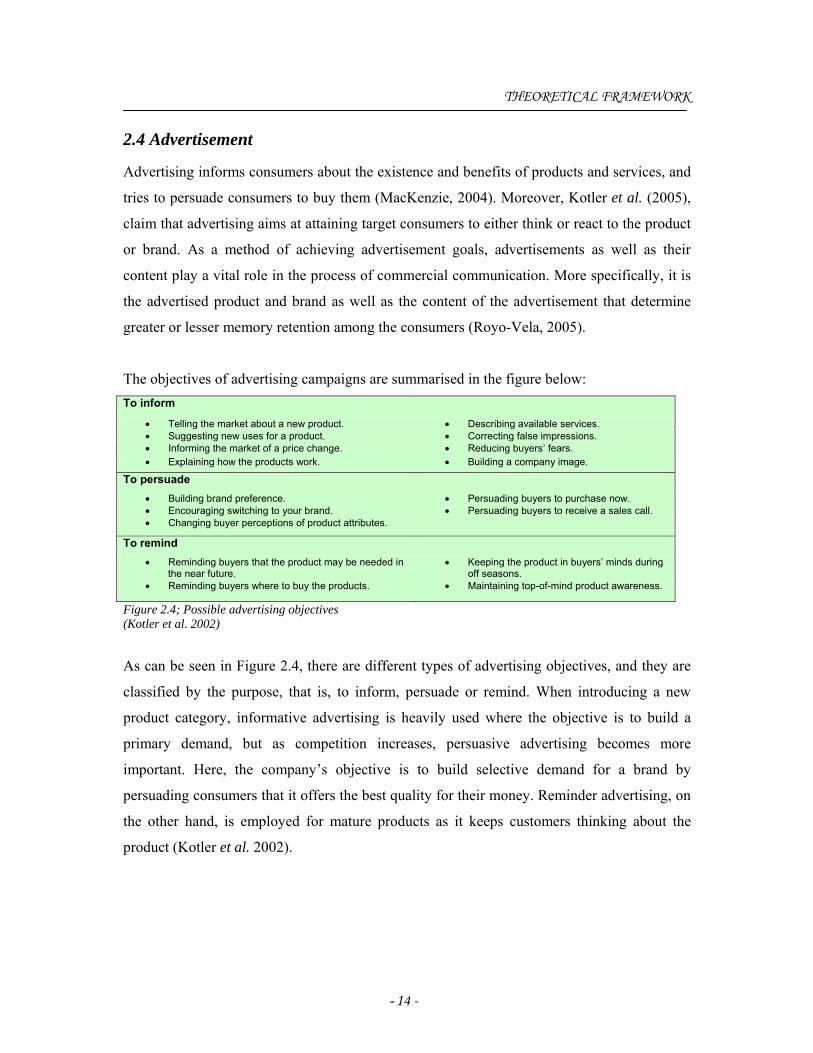
The objectives of advertising campaigns are summarised in the figure below: To inform
• Telling the market about a new product. • Describing available services. • Suggesting new uses for a product. • Correcting false impressions. • Informing the market of a price change. • Reducing buyers’ fears. • Explaining how the products work. • Building a company image.
To persuade • Building brand preference. • Persuading buyers to purchase now. • Encouraging switching to your brand. • Persuading buyers to receive a sales call. • Changing buyer perceptions of product attributes.
To remind • Reminding buyers that the product may be needed in the near future.
• Keeping the product in buyers’ minds during off seasons.
• Reminding buyers where to buy the products. • Maintaining top-of-mind product awareness.
Figure 2.4; Possible advertising objectives (Kotler et al. 2002)
As can be seen in Figure 2.4, there are different types of advertising objectives, and they are
classified by the purpose, that is, to inform, persuade or remind. When introducing a new
product category, informative advertising is heavily used where the objective is to build a
primary demand, but as competition increases, persuasive advertising becomes more
important. Here, the company’s objective is to build selective demand for a brand by
persuading consumers that it offers the best quality for their money. Reminder advertising, on
the other hand, is employed for mature products as it keeps customers thinking about the
product (Kotler et al. 2002).
- 15 -
THEORETICAL FRAMEWORK
2.4.1 Standardization vs. Adaptation
International marketers and advertisers can approach the market in different ways when
advertising a product or service internationally. They can either take a standardized approach,
an adapted approach or a mixture of the two approaches. While an international standardized
advertisising campaign is used for all markets, an adapted campaign considers the use of
different advertisements that are adapted for different markets because of local conditions.
However, many different opinions exist about the best way to achieve success in advertising
campaigns, and even though research has shown that advertisements of certain products can
be standardized worldwide, both of the approaches provide their own unique benefits and
weaknesses (Barnes et al. 2004).
A primary motivation for a company to standardize its advertising is the desire to create a
more homogenous image of the firm and its brand in multiple markets, as a uniformed brand
image across markets can lead to enhanced global brand equity. Other advantages of
standardization include, economic benefits related to cost savings, the abilities to implement a
coordinated strategy and to appeal to cross-markets segments (Taylor, 2006). Moreover, if an
international brand is well known, it is more likely to be successful with a standardized
approach, as advertisements of these brands are made more to remind and strengthen than to
communicate product benefits (Pae et al. 2002). However, many scholars point out difficulties
in using a standardized approach, and therefore support market tailoring and adaptation to fit
the “unique dimensions” of different international markets. Moreover, it has been argued that
different countries and regions differ when it comes to factors such as: culture, consumer
tastes, race, disposable income, law, nationalism, technology, society, and occupations. As a
result, advocates of the adaptation approach insist that multinational companies must find out
how to adjust their advertisement in accordance to these factors (Barnes et al. 2004).
However, both strategies are rejected by various ressearchers whom emphasize the difficulty
in applying them in practice (Vrontis, 2005). Instead, a mixed approach, also known as a
contingency approach, can be used as it offers the potential for variance, depending on the
situation (Barnes et al. 2004).
- 16 -
THEORETICAL FRAMEWORK
2.4.2 The language used in advertising campaigns When advertising across borders, advertisers have to decide upon whether or not to use the
native language in the campaign. There are several reasons that drive companies to use
foreign languages in advertisements, such as financial- and image-related reasons.
Advertising costs are reduced when using existing foreign language television commercials
rather than producing new commercials into the native language. Furthermore, in some
situations, a product’s image benefits from using a foreign language as it is more effective
(Wang et al. 2006).
In non-English speaking countries, English is the most frequently used foreign language in
advertisements. A global marketing company can deploy an English-language advertisement
in numerous countries worldwide seeing as most countries regard English as their first foreign
language. Additionally, as a translation of English to a local language is not absolutely
required, as money is saved when using English in a global campaign (Ibid).
2.5 Sponsorship
Previous research has shown that although various definitions of sponsorship exist, they all
certify that sponsorship is primarily a commercial activity, where the sponsoring company
attains the right to promote an association with the sponsored object in return for benefit
(Polonsky et al. 2001). More specifically, Javalgi et al. (1994 p. 48) claim that “sponsorship
is the underwriting of a special event to support corporate objectives by enhancing corporate
image, increasing awareness of brands, or directly stimulating sales of products and
services”.
Sponsorship activities are used for a number of reasons, but three of the most common
objectives comprehend overall corporate communications, which include building and
strengthening brand awareness, brand image, and corporate image (Gwinner et al. 1999).
More specifically, strategies that are aimed at increasing brand recognition, are typically
employed using a wide range of advertising tools which are designed to expose the
sponsoring brand to as many potential customers as possible (Cornwell et al. 2001). However,
certain factors such as the sponsor industry and company size influence the choice of
sponsorship activity and thus the objectives vary between companies. For example,
- 17 -
THEORETICAL FRAMEWORK
manufacturers often look for extensive publicity opportunities and media coverage, whereas
service sponsors are more motivated to enhance employees’ morale (Björn, 2003).
2.5.1 Event Sponsorship
As a result of the amount of leisure events in today’s society, event sponsorship has become
extremely popular. By connecting a brand with an event via sponsorship, companies can
better gain consumers’ attention and interest by associating with an event that is important to
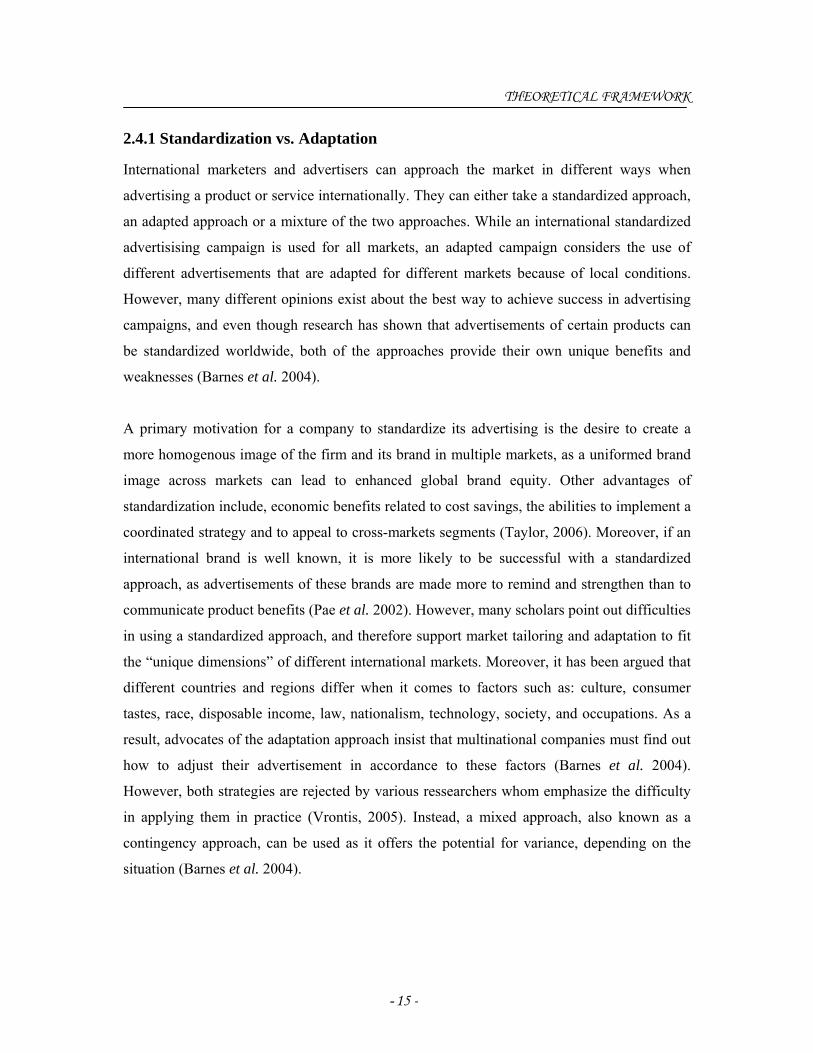
consumers (Roy et al. 2003). More specifically, event image can be transferred through
association to the sponsoring product and is created from a number of external and internal
factors as indicated in figure 2.5.1.
Figure 2.5.1; A model of image creation and image transfer in event sponsorship (Gwinner 1997, p. 148)
Event Type
Different types of events exist, such as sports, music and festival related, and affect event
image in a number of ways. An event’s image is strongly influenced by an individual’s
attitude towards the event, through past sponsorships or other types of exposure. Event image
can also be impacted by non-evaluative perceptions of an event that are formed through
associations held in the consumer’s memory (Gwinner, 1997).
Event Image
Brand Image
Moderating Variables• Degree of similarity • Level of sponsorship • Event frequency • Product involvement
Event Type • Sports related • Music related • Festival/fair related • Fine arts related • Professional meeting/ trade
show related Event Characteristics
• Event size • Professional status • Event history • Event venue • Promotional appearance
Individual Factors
• Number of meanings • Strength of meanings • Past history w/ event
- 18 -
THEORETICAL FRAMEWORK
Event Characteristics
A number of characteristics within a particular event type differ from event to event. Event
size can for instance be regarded along a number of dimensions, such as length of event and
level of media exposure. Moreover, it is believed that the performers’ professional status or
the venue of the event, such as temperature and convenience, will influence recipients’ overall
assessment of the event’s image (Ibid).
Individual Factors
An event may entail different images for different people as a result of the different factors
that affect event image and the way in which recipients may interpret those factors. Examples
of such events are those that are regarded as having a number of images, and thus are more
difficult to associate with than an event with one identity. Furthermore, a person’s history
with a certain event could also influence one’s perception of an event’s image, as a
longhistory will generally cause a more deep-rooted and constant image (Ibid). Moderating Variables
Sponsor-event similarity entails that the sponsoring product in question is in fact used by
participants during the event, or when the event’s image is linked directly to the brand’s
image. An event can either have one sponsor or hundreds of sponsors at many different levels.
However, events with multiple sponsors decrease the likelihood that a specific brand will
solely be associated with the event, due to the extra stimuli each consumer has to consider and
address. Event frequency can also affect the image transfer process, in that an event can either
occur one-time or on a recurring basis (Ibid).
2.5.2 Sports Sponsorship
Sports sponsorship is the most common sponsorship activity, as it can emanate very strong
images through for instance, extensive television press coverage, as well as being appealing to
all classes in society and consequently has a mass international audience (Jobber, 2004).
Moreover, it can transcend languages, hence national boundaries, as it is comprised of a range
of nonverbal components, such as “universal messages of hope, pain or victory” (Quester et
al. 1998, p. 540). As a result of this, many international marketers are looking to create icons
associated with specific meanings, which are universally recognized (Fahy et al. 2004). The
- 19 -
THEORETICAL FRAMEWORK
increasing amount of money spent on sports events, such as the Olympics as well as the
growth in the number of sports-oriented radio talk shows and television networks, such as
Sports Programming Network (ESPN), clearly illustrate the growing importance of sports in
today’s society. Not only will sports sponsorship continue to be a popular and growing form
of marketing, but according to Gwinner et al. (2003, p. 275), “sport generates fanship that is
more intense, more obtrusive, and more enduring than it is for other forms of entertaining
social activities without direct participation in the spectated events”.
2.5.3 Celebrity Endorsement
Celebrity endorsement has developed tremendously in the past decades and has been
acclaimed as “a ubiquitous feature of modern marketing” (Hsu et al. 2002, p. 19). According
to McCracken (1989, p. 20), a celebrity endorser is “any individual who uses his or her public
recognition on behalf of a consumer good by appearing with it in an advertisement”. Based
on the notion that celebrities are successful spokespersons for a company’s brand or product,
in that they deliver a company’s advertising message and persuade consumers to purchase the
sponsored brand, a substantial amount of money is annually spent on celebrity endorsement.
Accordingly, it has been confirmed by scholars and marketers that celebrity endorsement is a
very effective marketing tool, as celebrities have considerable influence on consumers’
attitudes and purchase intentions (Hsu et al. 2002).
Advantages of celebrity endorsement include its ability to differentiate an advertisement from
surrounding advertisement clutter by providing the product(s) with instant character and
appeal. Furthermore, celebrities who are particular popular and recognized worldwide, have
the capacity to enter international markets, and thus go beyond cultural borders (Erdogen,
1999). However, a risk with celebrity endorsement is that a celebrity’s image may have a
negative impact on the brand or product that he/she endorses as a result of negative news or
publicicty, or simply not appealing to everyone, seeing as a celebrity’s image often transmits
itself to the endorsed brand, and accordingly the brand’s image transmits itself to the endorser
(Till et al. 1998).
- 20 -
THEORETICAL FRAMEWORK
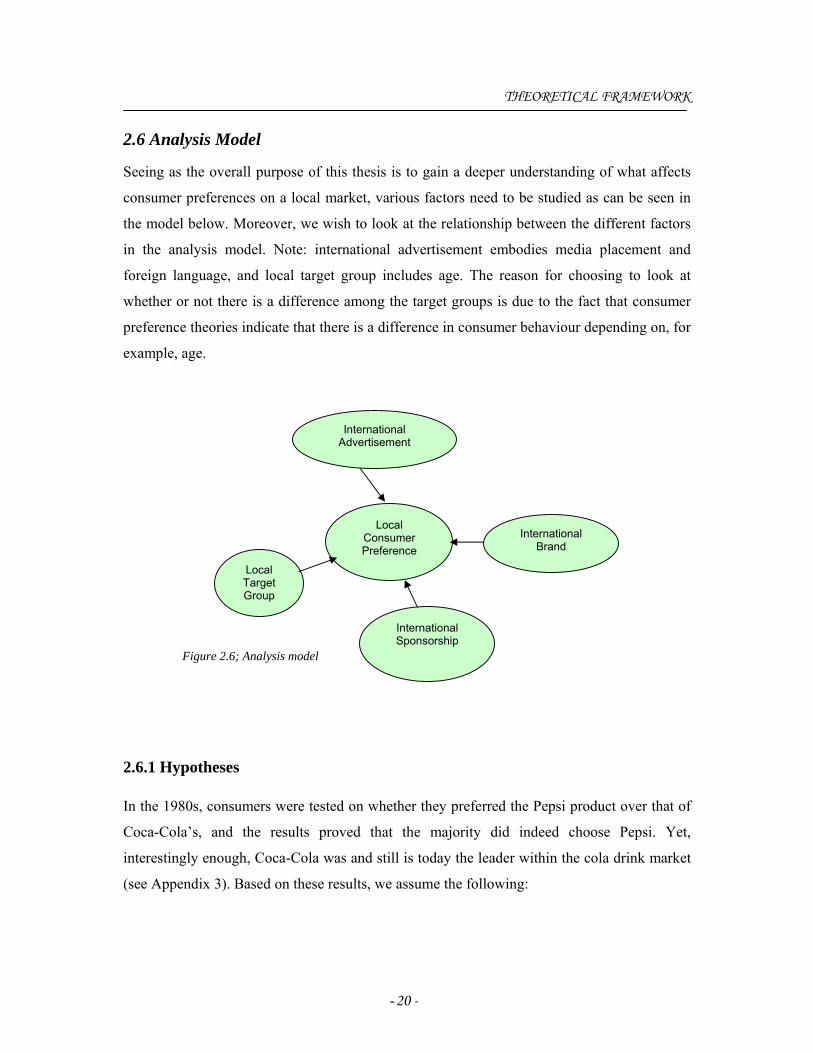
2.6 Analysis Model
Seeing as the overall purpose of this thesis is to gain a deeper understanding of what affects
consumer preferences on a local market, various factors need to be studied as can be seen in
the model below. Moreover, we wish to look at the relationship between the different factors
in the analysis model. Note: international advertisement embodies media placement and
foreign language, and local target group includes age. The reason for choosing to look at
whether or not there is a difference among the target groups is due to the fact that consumer
preference theories indicate that there is a difference in consumer behaviour depending on, for
example, age.
2.6.1 Hypotheses In the 1980s, consumers were tested on whether they preferred the Pepsi product over that of
Coca-Cola’s, and the results proved that the majority did indeed choose Pepsi. Yet,
interestingly enough, Coca-Cola was and still is today the leader within the cola drink market
(see Appendix 3). Based on these results, we assume the following:
Figure 2.6; Analysis model
Local Consumer Preference
Local Target Group
International Sponsorship
International Brand
International Advertisement

- 21 -
THEORETICAL FRAMEWORK
H1: Consumers explicitly prefer one brand but actually favour the taste of another.
Coca-Cola’s and Pepsi’s marketing strategies differ widely, specifically in that of their
advertisements, where Coca-Cola depends heavily on tradition, while Pepsi relies more on the
appeal of celebrities and young people (www.geocities.com). As a result, we suggest the
following:
H2: Seeing as Coca-Cola and Pepsi seem to target different consumers through their
advertisements and sponsorships, we believe that depending on a person’s age, the choice of
cola product differs, as well as their taste preference. More specifically, that the youngest age
group particularly have a more positive attitude towards Pepsi on the whole, whereas the
oldest age group are more positive towards Coca-Cola.
According to theory, teenagers have a high need for belonging, independence and approval to
name a few, but more importantly they need to feel accepted, particularly by their peers
(Solomon et al. 2001). Consequently, they switch brand preference often and are easy targets
for marketers. Thus advertisement is primarily targeted at them, as they are vulnerable to
consumerism and media (Blackwell et al. 2001). As a result, we propose the following:
H3: People aged eighteen and younger have the highest level of knowledge of brand
advertisement, hence they are more influenced by it in their choice of products than any other
age group.
- 22 -
3. Methodology
The following chapter discusses and validates the choice of methodology used in the thesis, which has
guided us in how we should approach the subject, as well as how we should collect and process the required
information. It includes choice of subject, research approach, data collection, value of study, and revision of
the chosen methodolgy.
3.1 Choice of Subject
Today, people are daily overwhelmed by numerous of advertising campaigns on television,
radio, and magazines to name a few. The increase of ads is especially evident during large
events, such as music concerts and sports events. As a result of the recent Winter Olympics in
Torino 2006 and the fact that the three of us are very interested in sports, the sponsors of the
event did not go unnoticed. One such sponsor that explicitly caught our attention during the
Games was that of Coca-Cola. A discussion about Coca-Cola’s advertising was then initiated
where we began reminiscing about the different Coca-Cola slogans and commercials that
have been present throughout our lives. Thereafter it became clear that although the majority
of the group members drink Coca-Cola, one in fact prefers Pepsi. This led to the next question
of why people choose one brand over another, seeing as in this case the products are
homogenous. We found this to be interesting and began discussing possible explanations of
such. What we did eventually agree on was that although the tastes are relatively alike, the
dominating factor was their advertising campaigns respectively. This, along with the
compelling amount of advertisement emitted at consumers in an attempt to persuade them to
buy products, led us into the subject area. Thus we decided to explore the extent in which
advertising campaigns affect consumer preference. More specifically, we thought it would be
engaging to study why consumers explicitly prefer one brand to another. Another reason for
the chosen subject was due to the fact that as products are becoming more homogenous,
competition and advertisement clutter increases and thus companies must find new ways to
differentiate themselves from others, and accordingly we found it appealing to explore what
other factors than advertising affect consumer preferences.
- 23 -
METHODOLOGY
3.2 Research Approach
When conducting a research, the researcher can choose between two approaches; qualitative
and quantitative method. The qualitative method involves the gathering of a lot of information
from few examination units through interviews and observations, while the quantitative
method entails that the researcher collects little information from many investigation units
through, for instance questionnaires (Halvorsen, 1992). Seeing as the overall purpose of this
paper was to gain a deeper understanding of different factors affecting consumer preferences
on a local market, the quantitative method was applied, and thus a questionnaire (quantitative
data was collected) was conducted in accordance to our purpose (Appendix 4).
We began our research with describing different concepts, such as consumer preference,
advertisement and sponsorship, and thereafter moved towards concrete empirical evidence,
that involved studying the extent in which different international and local factors influence
local consumer preferences. Finally, we analyzed the findings in relation to theory. As a
result, a deductive approach was applied, which implies that the researcher “begins with a
theoretical or applied research problem and ends with empirical measurement and data
analysis” (Neuman 2003, p. 267). In contrast, an inductive approach “begins with detailed
observations of the world and move toward more abstract generalizations and ideas” (Ibid, p.
51). Given that we did not want to generalize our findings to the entire local consumer
market, but rather observe a specific group of consumers on the Swedish market, the latter
approach was not applicable.
3.3 Data Collection
Data is one out of two types, either primary which is collected by the researcher/s, or
secondary data which is gathered by other researches (Andersen, 1998). We decided to use a
questionnaire as our main source of data collection (primary data), as our aim was to measure
consumers’ understanding and experience of global advertising campaigns.
- 24 -
METHODOLOGY
3.3.1 Questionnaire
The questionnaire (see Appendix 4) allowed us to gather specific information on how
different consumers perceive international advertising campaigns, as well as the different
factors that influence consumer preference. According to Ruane (2005, p. 123), a
questionnaire is a “self-contained, self-administered instrument for asking questions”. The
questionnaire was divided into structured and unstructured questions accordingly. A
structured question may either entail multiple choices, dichotomous questions, or a scale,
whereas an unstructured question is an open-ended question, which implies that the
respondents answer in their own words (Malhotra, 2004).
The structured questions that were asked were either dichotomous or scales. In dichotomous
questions, the respondents could only choose between two response alternatives, such as Yes
or No, making it easy to code and analyze. A ratio scale was also used which allowed the
respondents to classify or rank order the objects, i.e. 1 – 5, where 5 represents “very good”
and 1 indicates “very bad”. Finally, in combination with the structured questions, unstructured
questions were asked, where the respondents were able to clarify and express in detail their
responses and opinions (Neuman, 2003).
One of the main objectives of a questionnaire is to “uplift, motivate, and encourage the
respondent to become involved in the interview, to cooperate, and to complete the interview”
(Malhotra 2004, p. 281). This was achieved through asking interesting questions in
combination with visual images to help clarify the questions. More specifically, the
respondents were asked to perform blind taste tests at the end of the questionnaire, which
captivated their motivation in wanting to participate in the study. Moreover, three variables
were used in the test: X, Y and Z, where X represented the Swedish ICA cola, Y represented
Coca-Cola, and Z Pepsi.
3.3.2 Sample Selection
The population we chose to investigate in order to reach our purpose was the chosen local
market; Swedish consumers, and thus we decided upon a combination of quota sampling and
convenience sampling from this population. Quota sampling implies that a researcher can
choose to have a specified proportion of the investigated elements in the study.
- 25 -
METHODOLOGY
This partition into different stratums can include different categories, such as gender, age,
lifestyle, and ethnicity (Nardi, 2003). When the researcher has decided upon which categories
to use in the partition, as well as the number of respondents to investigate, convenience
sampling is used to collect them (Neuman, 2003). When convenience sampling is utilized,
there is a lack of a clear sampling strategy and the researcher decides which elements to study
depending on the ease of access (Ritchie et al. 2003).
The quotas that were chosen for this thesis were divided into three different age groups in
accordance to Blackwell et al. (2001): ≤ 18, 19-34, and ≥ 35. The chosen groups represented a
diverse set of people, who are at different stages in their lives, and thus we believed their
perception of international advertising campaigns and sponsorship activities, as well as
international brands would vary. Consequently, we wanted to study whether age impacts the
way in which consumers are open-minded to advertisement and whether there was a
significant difference between the groups.
Fifty respondents were chosen from each age group:
• ≤ 18: the majority were seventh to ninth graders from Teleborg Centrum, Växjö, and
the remaining were students from the upper secondary school Procivitas in Växjö.
• 19-34: students from Växjö University.
• ≥ 35: family, friends, and others from Båstad, Karlskrona and Växjö.
These respondents were chosen as a result of easy access, as the majority were either friends
or family. Although we did not have a personal relationship with the majority of the youngest
age group, we still found it to be convenient and had easy access to them seeing as Teleborg
Centrum is nearby, as well as being the easiest and most reluctant group to participate in the
study.
3.3.3 Operational Measures of Theoretical Framework
The questions in the questionnaire were based upon our theoretical framework, and thus the
questions can be divided into the following groups: consumer preferences, brand,
advertisement, sponsorship, and finally others.
- 26 -
METHODOLOGY
Consumer preferences
The questionnaire initiated with an introduction to the consumption of the cola drink and
hence the questions were designed in such a way to give an overall view of the respondents’
relationship to cola as a soft drink.
Brand
Questions 7 to 10 encompass the respondents’ viewpoints on Coca-Cola and Pepsi as a brand
respectively, as well as the associations that go with them. These questions were of great
relevance since it illustrated whether the respondents held favourable or non-favourable
attitudes towards the brands, and thus it could be depicted whether brand equity, such as
brand awareness and brand loyalty exist. Questions 11 and 12 were specifically about the two
brand’s logos and slogans, indicating once again which of the two brands were preferred over
the other. These questions were especially relevant concerning theory about brand
positioning, seeing as we wanted to find out the different perceptions of a brand to that of a
competitor’s. Overall, the questions supplied us with information about the way in which the
respondents perceive the two specific brands.
Advertisement
Questions 13 to 15 are linked to the advertisement theory, and provided us with knowledge
about respondents’ attitudes towards advertisement in general, and the extent in which
advertisement influences consumers in their choice of products. Moreover, the questions
provided us with insight into how familiar and open the respondents were of Coca-Cola’s and
Pepsi’s advertising campaigns. By finding out the way in which the respondents viewed the
brands’ advertisement and if it affects their perception of the brands, we could detect if
advertising campaigns are an effective marketing tool, moreover, if it persuades the
consumption of products.
Sponsorship
Questions 16 to 28 are in accordance to the theory regarding sponsorship. These questions
provide us with knowledge about the relationship between sponsorship and brand image, and
whether it is successful to sponsor different events. Moreover, we wanted to gain more
knowledge about whether or not sponsorship affects one’s attitude towards the product in
question, and if this differs from that of the brand.
- 27 -
METHODOLOGY
Others
Finally, the respondents were asked to fill in their age and preferred activity as we wanted to
gain information about the respondents. More specifically, we wanted to see whether the
theory about age correlates to the different age groups’ responses. The blind taste test was
used as we wanted to observe if consumers actually prefer the taste of their favoured brand in
comparison to other brands.
3.4 Value of Study
3.4.1 Validity
Validity is the ability to measure what one intended to measure, and construct validity
involves the operational measures for the studied subjects. More precisely, it includes the way
in which the researcher translates theory information into operational and measurable
questions, and variables (Yin, 2003). Our operational measures can be found in the previous
section, 3.3.3. In order to gain as high validity as possible, multiple sources of evidence were
used in collecting the data, consisting of academic articles, textbooks, and web pages.
Internal validity suggests that the study examines what it is suppose to examine, whereas
external validity is the possibility to generalize the study results in other populations
(Hollensen, 2001). We sought to conduct the questions in the questionnaire in such a way that
we were provided with the most relevant information so as to answer our research question.
The design of the questions was that of a simple structure with a clear and easy language in
order to make them as understandable as possible and thus decreasing any misunderstandings.
Furthermore, the questionnaire was standardised, which implies that the same questionnaire
was presented to all chosen respondents for the study. However, seeing as we limited our
sample groups to fifty people from each quota, the external validity of this thesis could be
questioned, and thus generalization was not obtained.

- 28 -
METHODOLOGY
3.4.2 Reliability
In order for reliability to be achieved, the same study should have similar results if it is
conducted at a different point in time (Andersen, 1998). In order to attain reliability in a study,
different precautions can be taken, such as making sure that the questions are interpreted in
the way in which the researcher/s planned (Patel et al. 1994). In order to achieve reliability in
our master’s thesis and making sure that the questions were interpreted as we wanted them to
be, we conducted the questionnaire on a test group consisting of five respondents. This test
group was asked to inform us how they interpreted the questions and any adjustments
necessary where made before it was tested on yet another group of people. After the modified
version was tested, the questionnaire felt complete and all possible misunderstandings had
been eliminated, it was carried out on our sample subjects. Furthermore, we were present at
all times during the answering of the questionnaires and accordingly, any uncertainties were
solved on the spot. Finally, in order to ensure reliability, scientific literature was used for our
theoretical framework.
3.5 Revision of the Chosen Methodology Although the three soft drinks (Ica, Coca-Cola and Pepsi) were all purchased at the same time,
the carbon acid was weaker and disappeared easily in some of the drinks, while in others it
was much more apparent and lasted longer. As a result, the taste could easily have been
affected by this, and thus influencing the blind taste test results. Another factor that could
have affected the results was the temperature of the drinks. While in some cases the drinks
were icy cold, they were at other times at room temperature, which could have affected the
respondents’ taste buds and preferences, and thus a deviation in the results is possible.
Moreover, the product that the respondents normally consume is often refrigerated and thus
cold, as well as having a higher dose of carbon acid, and as a result, if these variables are
altered, the taste could very much have been different from what the respondents are used to,
and hence impacting their choice of brands.
Another factor that can be questioned is the consistency of the respondents. We found that the
youngest group of respondents, ≤ 18, was easily influenced by one another, in that they
discussed the questions among each other. Thus, the credibility of some of the answers can be

- 29 -
METHODOLOGY
questioned. Finally, we found the oldest group of respondents, ≤ 35, to be most difficult to
cooperate with, as they were very sceptical and reluctant to participate in the study. As a
result, one could question the sincerity of their answers, and whether they rushed through the
questionnaire and therefore did not answer the question as wholeheartedly as we would have
hoped.
- 30 -
4. Empirical Data This chapter encompasses the empirical data collected through the questionnaires with the 150 respondents.
However, some of the questions will not be presented as their aim was to introduce the subject to the
respondents, and thus are not relevant to describe.
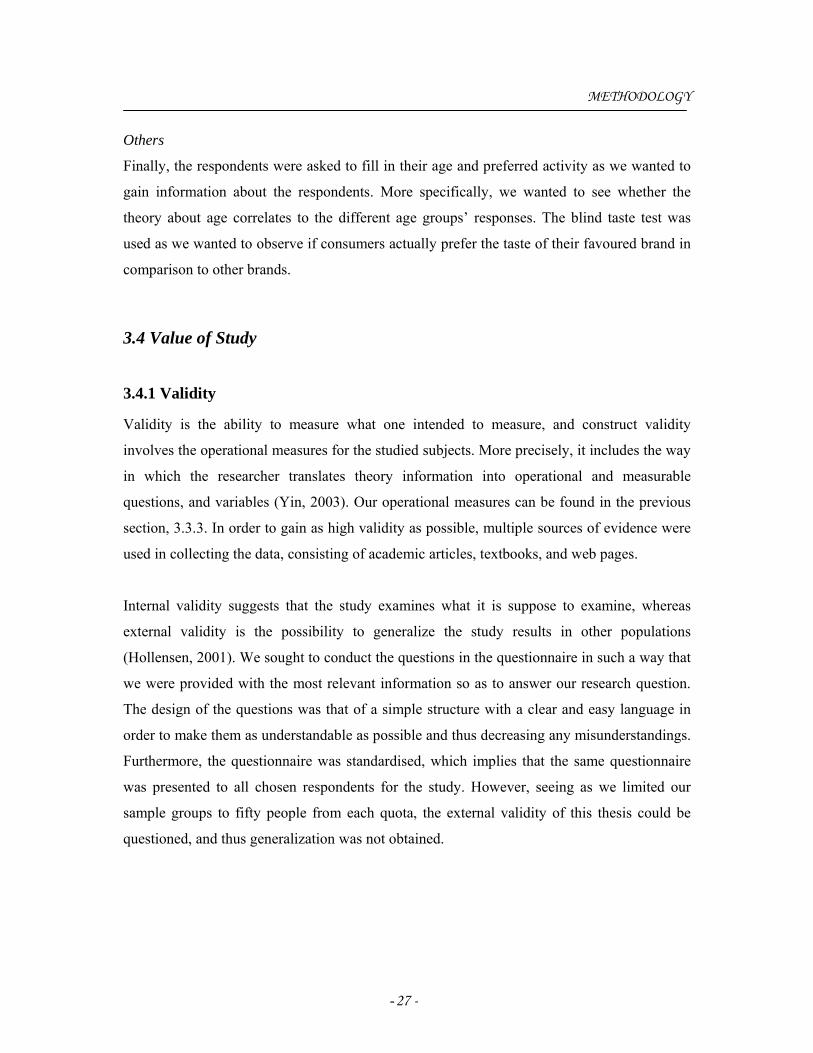
1. Do you drink cola soft drinks?
2. How many glasses of cola do you drink per week?
Glasses/ week
0
10
20
30
40
≤1 1-3 4-6 7-9 ≥10
Glasses
Perc
enta
ge
According to our empirical findings, 92 percent of the respondents drank cola soft drinks. Out
of this total, the majority (61.3 percent) drank a maximum of three glasses per week, whereas
only 18.6 percent drank seven or more glasses per week (see figure 4.1).
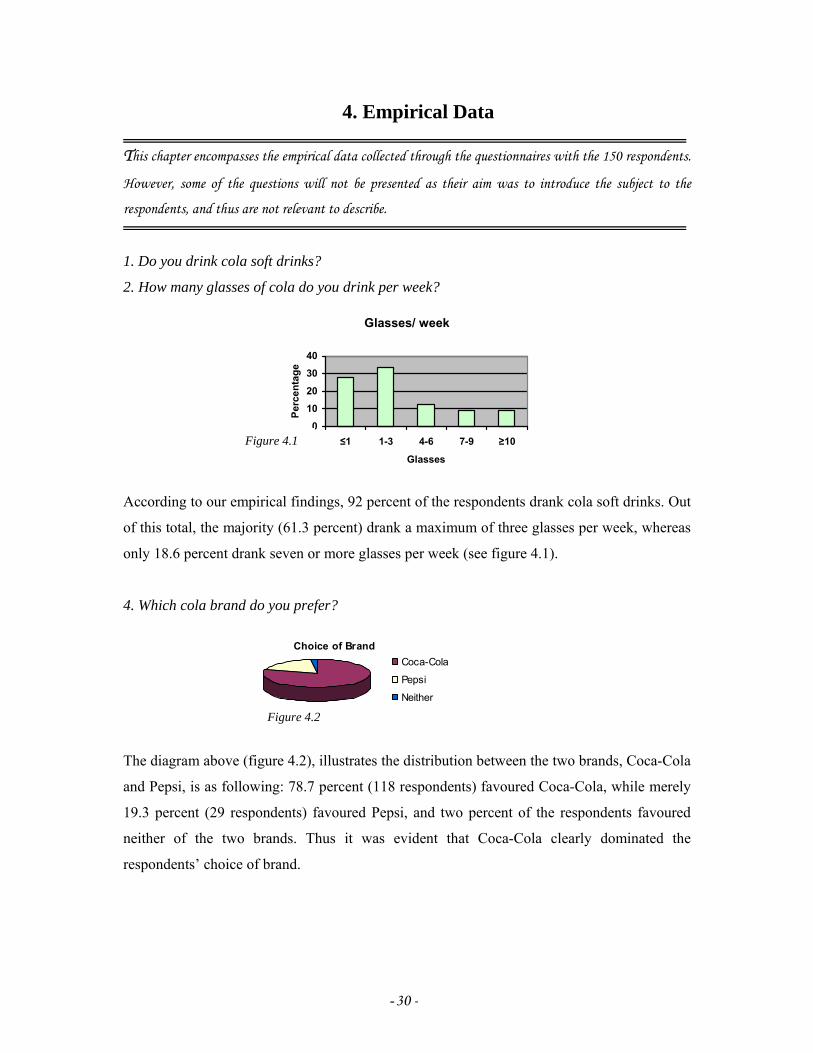
4. Which cola brand do you prefer?
The diagram above (figure 4.2), illustrates the distribution between the two brands, Coca-Cola
and Pepsi, is as following: 78.7 percent (118 respondents) favoured Coca-Cola, while merely
19.3 percent (29 respondents) favoured Pepsi, and two percent of the respondents favoured
neither of the two brands. Thus it was evident that Coca-Cola clearly dominated the
respondents’ choice of brand.
Choice of BrandCoca-Cola
Pepsi
Neither
Figure 4.2
Figure 4.1
- 31 -
EMPIRICAL DATA
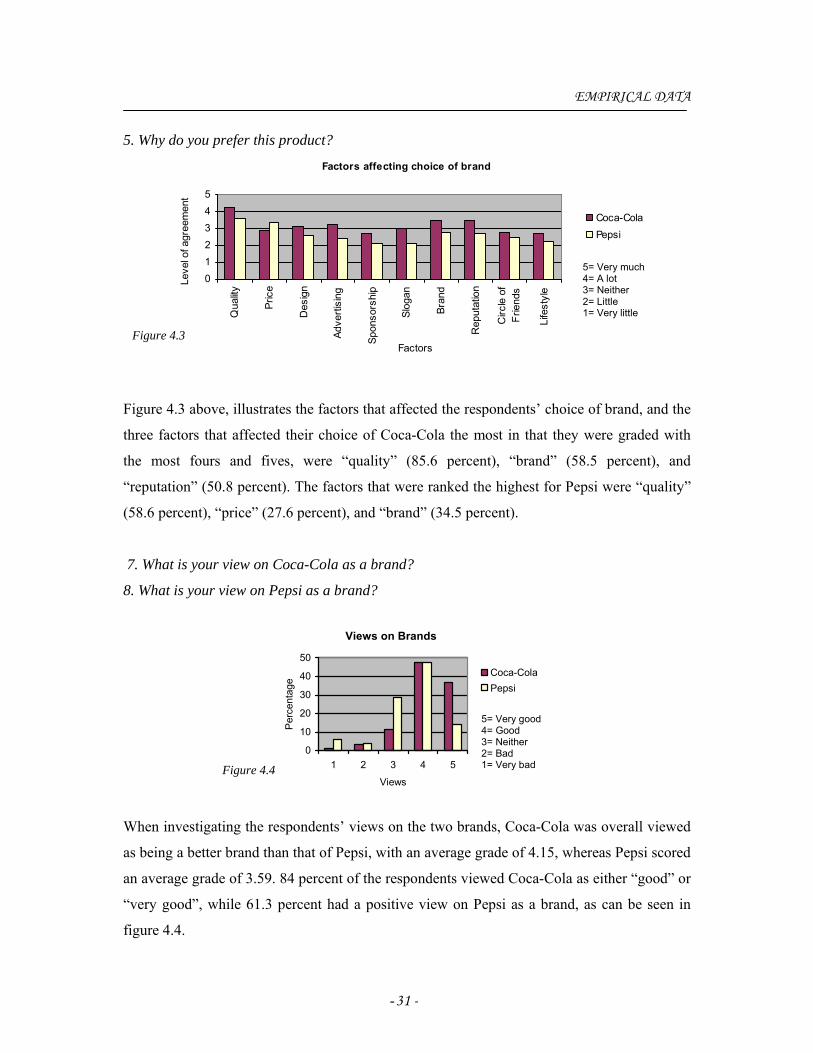
5. Why do you prefer this product?
Factors affecting choice of brand
012345
Qua
lity
Pric
e
Des
ign
Adve
rtisi
ng
Spon
sors
hip
Slog
an
Bran
d
Rep
utat
ion
Circ
le o
fFr
iend
s
Life
styl
e
Factors
Leve
l of a
gree
men
t
Coca-ColaPepsi
Figure 4.3 above, illustrates the factors that affected the respondents’ choice of brand, and the
three factors that affected their choice of Coca-Cola the most in that they were graded with
the most fours and fives, were “quality” (85.6 percent), “brand” (58.5 percent), and
“reputation” (50.8 percent). The factors that were ranked the highest for Pepsi were “quality”
(58.6 percent), “price” (27.6 percent), and “brand” (34.5 percent).
7. What is your view on Coca-Cola as a brand?
8. What is your view on Pepsi as a brand?
Views on Brands
0
10
20
30
40
50
1 2 3 4 5
Views
Per
cent
age
Coca-ColaPepsi
When investigating the respondents’ views on the two brands, Coca-Cola was overall viewed
as being a better brand than that of Pepsi, with an average grade of 4.15, whereas Pepsi scored
an average grade of 3.59. 84 percent of the respondents viewed Coca-Cola as either “good” or
“very good”, while 61.3 percent had a positive view on Pepsi as a brand, as can be seen in
figure 4.4.
5= Very much 4= A lot 3= Neither 2= Little 1= Very little
Figure 4.3
5= Very good 4= Good 3= Neither 2= Bad 1= Very bad Figure 4.4
- 32 -
Figure 4.6
Figure 4.5
EMPIRICAL DATA
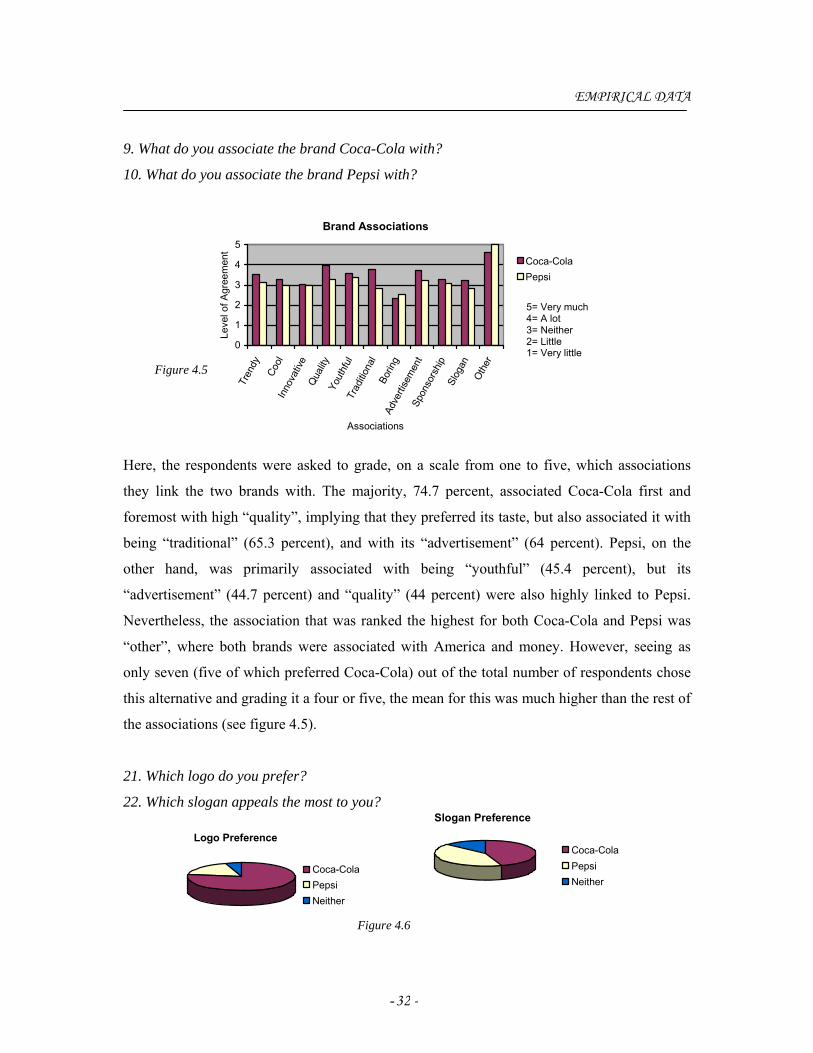
9. What do you associate the brand Coca-Cola with?
10. What do you associate the brand Pepsi with?
Brand Associations
0
1
2
3
4
5Tr
endy
Cool
Inno
vativ
eQ
uality
Yout
hful
Trad
itiona
lBo
ring
Adve
rtise
men
tSp
onso
rshi
pSl
ogan
O
ther
Associations
Leve
l of A
gree
men
t
Coca-ColaPepsi
Here, the respondents were asked to grade, on a scale from one to five, which associations
they link the two brands with. The majority, 74.7 percent, associated Coca-Cola first and
foremost with high “quality”, implying that they preferred its taste, but also associated it with
being “traditional” (65.3 percent), and with its “advertisement” (64 percent). Pepsi, on the
other hand, was primarily associated with being “youthful” (45.4 percent), but its
“advertisement” (44.7 percent) and “quality” (44 percent) were also highly linked to Pepsi.
Nevertheless, the association that was ranked the highest for both Coca-Cola and Pepsi was
“other”, where both brands were associated with America and money. However, seeing as
only seven (five of which preferred Coca-Cola) out of the total number of respondents chose
this alternative and grading it a four or five, the mean for this was much higher than the rest of
the associations (see figure 4.5).
21. Which logo do you prefer?
22. Which slogan appeals the most to you?
Logo Preference
Coca-ColaPepsiNeither
Slogan Preference
Coca-ColaPepsiNeither
5= Very much 4= A lot 3= Neither 2= Little 1= Very little
- 33 -
Figure 4.7
EMPIRICAL DATA
There was a substantial difference between the way in which the respondents preferred one
logo over the other, with as much as 77.3 percent preferred Coca-Cola’s and only 18 percent
preferred Pepsi’s. When asked which slogan the respondents favoured the most, the difference
was not as evident with only a 2.7 percent deviation, where 44.7 percent preferred Coca-
Cola’s and 42 percent preferred Pepsi’s (see figure 4.6). Those who did prefer Coca-Cola’s
logo did so because it is, for example, “more known”, “traditional”, “classical”, “genuine
and better looking with more details”, “more tasteful with the red colour”, and finally
because it is “the original cola”. In contrast, Pepsi’s logo was described as “clumsy and out
of date”. However, those that did prefer Pepsi’s logo did so because it is “classy”, “retro”,
and “youthful”. Interestingly enough, both slogans were rather unknown to the respondents,
due to the fact that they have not yet been extensively used and thus are not the most familiar
slogans in the companies’ history. Although they were both overall described as being “cool
and easy”, Coca-Cola’s was referred to as being funnier and Pepsi’s being clearer and more
concise.
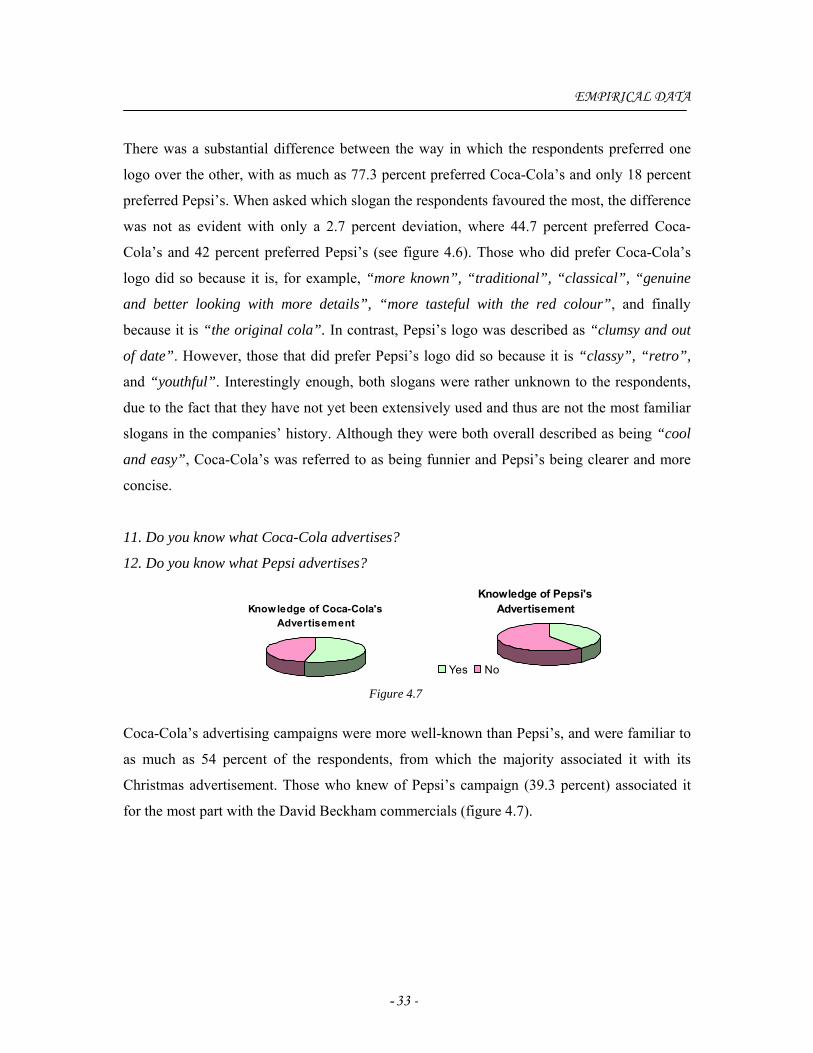
11. Do you know what Coca-Cola advertises?
12. Do you know what Pepsi advertises?
Knowledge of Pepsi's Advertisement
Yes No
Coca-Cola’s advertising campaigns were more well-known than Pepsi’s, and were familiar to
as much as 54 percent of the respondents, from which the majority associated it with its
Christmas advertisement. Those who knew of Pepsi’s campaign (39.3 percent) associated it
for the most part with the David Beckham commercials (figure 4.7).
Knowledge of Coca-Cola's Advertisement
- 34 -
Figure 4.9
Figure 4.8
EMPIRICAL DATA
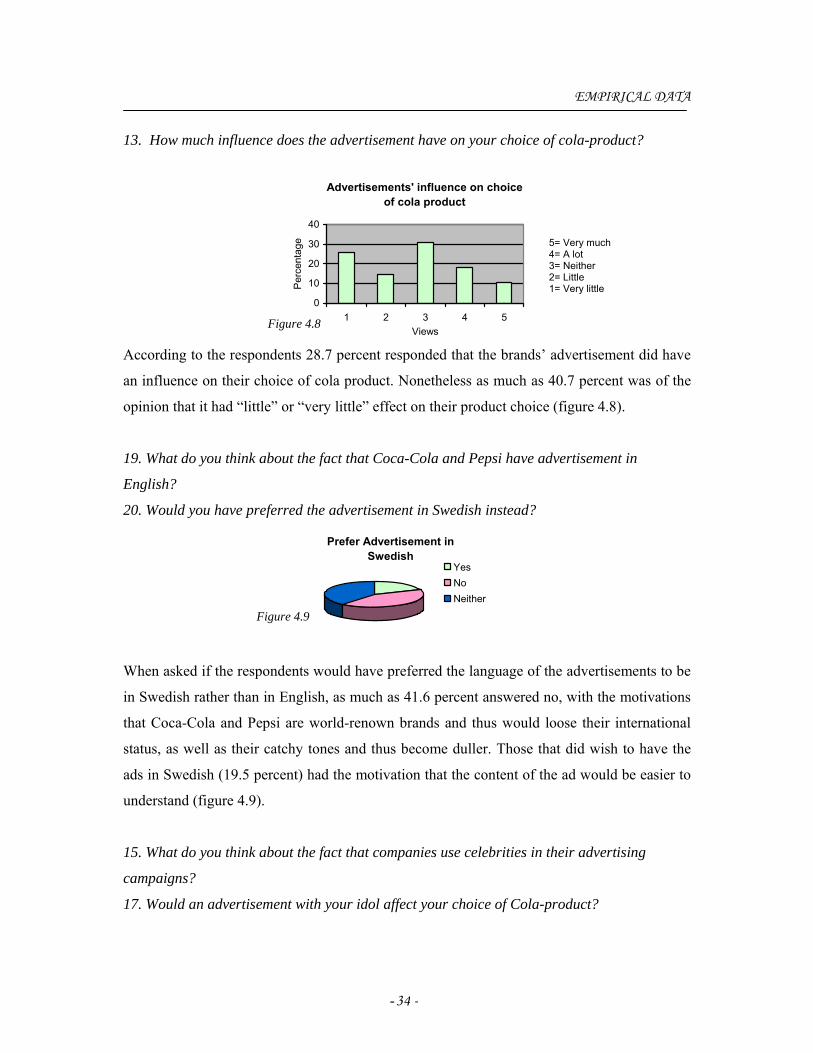
13. How much influence does the advertisement have on your choice of cola-product?
Advertisements' influence on choice of cola product
0
10
20
30
40
1 2 3 4 5Views
Per
cent
age
According to the respondents 28.7 percent responded that the brands’ advertisement did have
an influence on their choice of cola product. Nonetheless as much as 40.7 percent was of the
opinion that it had “little” or “very little” effect on their product choice (figure 4.8).
19. What do you think about the fact that Coca-Cola and Pepsi have advertisement in
English?
20. Would you have preferred the advertisement in Swedish instead?
Prefer Advertisement in Swedish
YesNoNeither
When asked if the respondents would have preferred the language of the advertisements to be
in Swedish rather than in English, as much as 41.6 percent answered no, with the motivations
that Coca-Cola and Pepsi are world-renown brands and thus would loose their international
status, as well as their catchy tones and thus become duller. Those that did wish to have the
ads in Swedish (19.5 percent) had the motivation that the content of the ad would be easier to
understand (figure 4.9).
15. What do you think about the fact that companies use celebrities in their advertising
campaigns?
17. Would an advertisement with your idol affect your choice of Cola-product?
5= Very much 4= A lot 3= Neither 2= Little 1= Very little
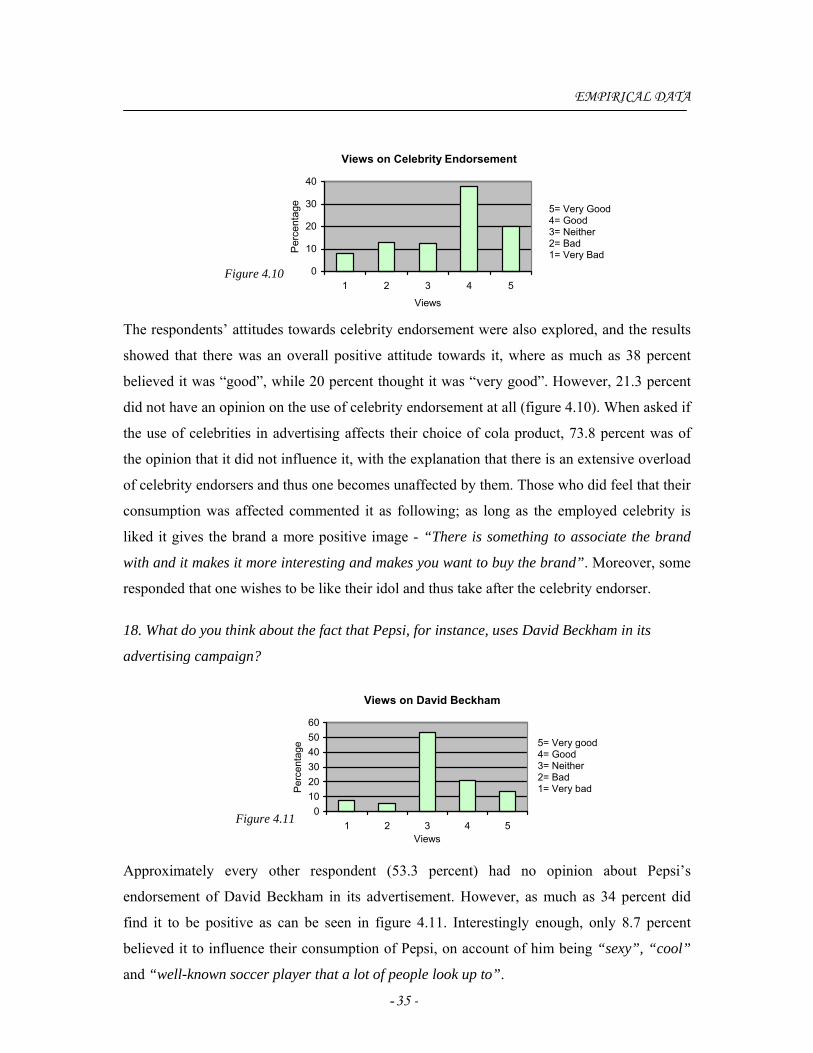
- 35 -
EMPIRICAL DATA
Views on Celebrity Endorsement
0
10
20
30
40
1 2 3 4 5
ViewsP
erce
ntag
e
The respondents’ attitudes towards celebrity endorsement were also explored, and the results
showed that there was an overall positive attitude towards it, where as much as 38 percent
believed it was “good”, while 20 percent thought it was “very good”. However, 21.3 percent
did not have an opinion on the use of celebrity endorsement at all (figure 4.10). When asked if
the use of celebrities in advertising affects their choice of cola product, 73.8 percent was of
the opinion that it did not influence it, with the explanation that there is an extensive overload
of celebrity endorsers and thus one becomes unaffected by them. Those who did feel that their
consumption was affected commented it as following; as long as the employed celebrity is
liked it gives the brand a more positive image - “There is something to associate the brand
with and it makes it more interesting and makes you want to buy the brand”. Moreover, some
responded that one wishes to be like their idol and thus take after the celebrity endorser.
18. What do you think about the fact that Pepsi, for instance, uses David Beckham in its
advertising campaign?
Views on David Beckham
0102030405060
1 2 3 4 5Views
Per
cent
age
Approximately every other respondent (53.3 percent) had no opinion about Pepsi’s
endorsement of David Beckham in its advertisement. However, as much as 34 percent did
find it to be positive as can be seen in figure 4.11. Interestingly enough, only 8.7 percent
believed it to influence their consumption of Pepsi, on account of him being “sexy”, “cool”
and “well-known soccer player that a lot of people look up to”.
5= Very Good 4= Good 3= Neither 2= Bad 1= Very Bad
5= Very good 4= Good 3= Neither 2= Bad 1= Very bad
Figure 4.11
Figure 4.10
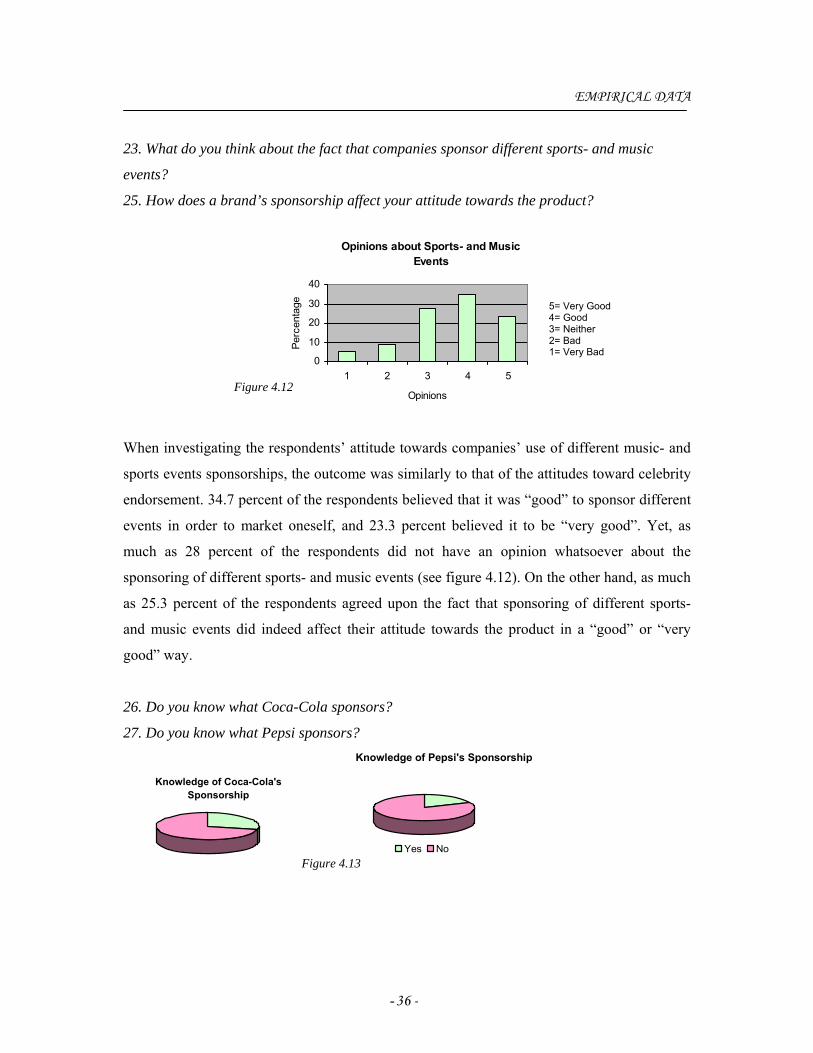
- 36 -
Figure 4.12
EMPIRICAL DATA
23. What do you think about the fact that companies sponsor different sports- and music
events?
25. How does a brand’s sponsorship affect your attitude towards the product?
Opinions about Sports- and Music Events
0
10
20
30
40
1 2 3 4 5
Opinions
Perc
enta
ge
When investigating the respondents’ attitude towards companies’ use of different music- and
sports events sponsorships, the outcome was similarly to that of the attitudes toward celebrity
endorsement. 34.7 percent of the respondents believed that it was “good” to sponsor different
events in order to market oneself, and 23.3 percent believed it to be “very good”. Yet, as
much as 28 percent of the respondents did not have an opinion whatsoever about the
sponsoring of different sports- and music events (see figure 4.12). On the other hand, as much
as 25.3 percent of the respondents agreed upon the fact that sponsoring of different sports-
and music events did indeed affect their attitude towards the product in a “good” or “very
good” way.
26. Do you know what Coca-Cola sponsors?
27. Do you know what Pepsi sponsors?
Knowledge of Coca-Cola's Sponsorship
Knowledge of Pepsi's Sponsorship
Yes No
5= Very Good 4= Good 3= Neither 2= Bad 1= Very Bad
Figure 4.13
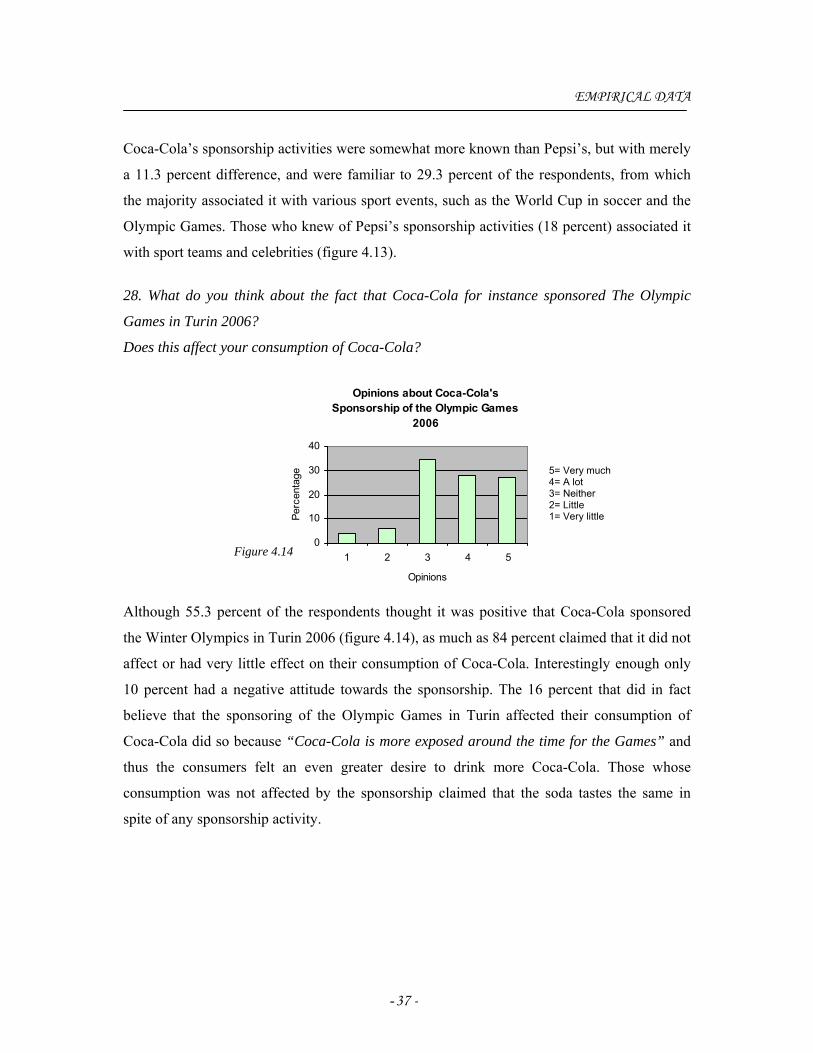
- 37 -
Figure 4.14
EMPIRICAL DATA
Coca-Cola’s sponsorship activities were somewhat more known than Pepsi’s, but with merely
a 11.3 percent difference, and were familiar to 29.3 percent of the respondents, from which
the majority associated it with various sport events, such as the World Cup in soccer and the
Olympic Games. Those who knew of Pepsi’s sponsorship activities (18 percent) associated it
with sport teams and celebrities (figure 4.13).
28. What do you think about the fact that Coca-Cola for instance sponsored The Olympic
Games in Turin 2006?
Does this affect your consumption of Coca-Cola?
Opinions about Coca-Cola's Sponsorship of the Olympic Games
2006
0
10
20
30
40
1 2 3 4 5
Opinions
Perc
enta
ge
Although 55.3 percent of the respondents thought it was positive that Coca-Cola sponsored
the Winter Olympics in Turin 2006 (figure 4.14), as much as 84 percent claimed that it did not
affect or had very little effect on their consumption of Coca-Cola. Interestingly enough only
10 percent had a negative attitude towards the sponsorship. The 16 percent that did in fact
believe that the sponsoring of the Olympic Games in Turin affected their consumption of
Coca-Cola did so because “Coca-Cola is more exposed around the time for the Games” and
thus the consumers felt an even greater desire to drink more Coca-Cola. Those whose
consumption was not affected by the sponsorship claimed that the soda tastes the same in
spite of any sponsorship activity.
5= Very much 4= A lot 3= Neither 2= Little 1= Very little
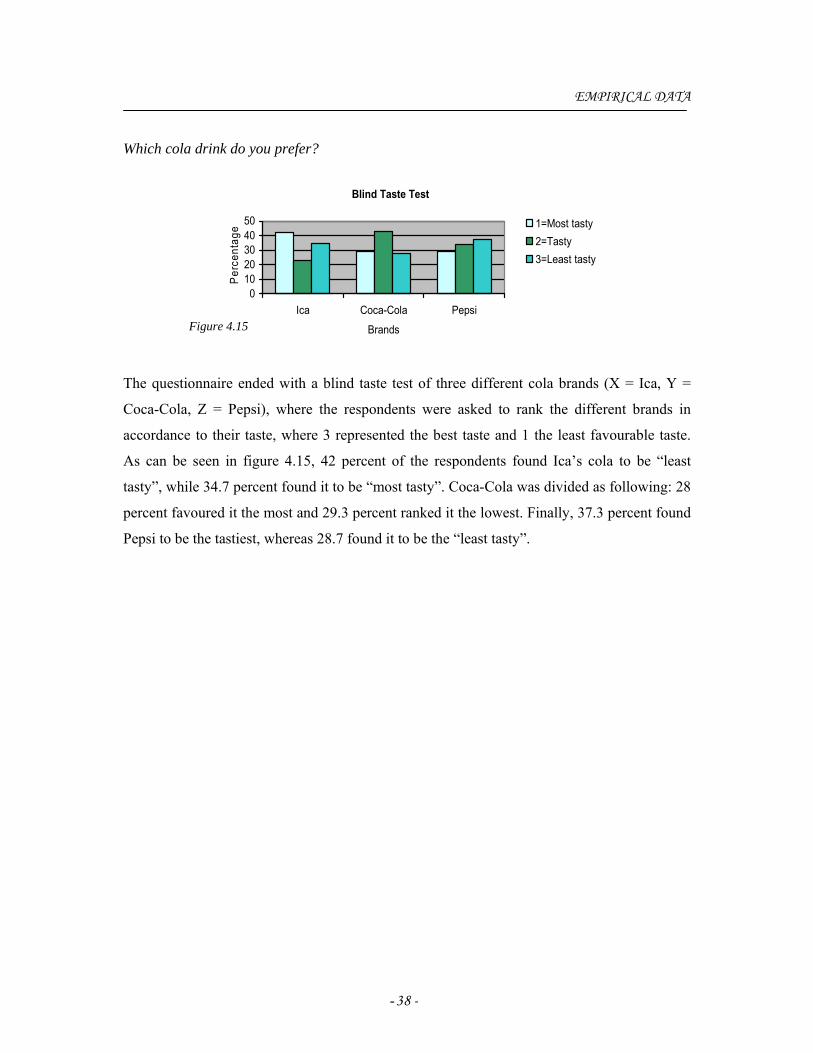
- 38 -
EMPIRICAL DATA
Which cola drink do you prefer?
Blind Taste Test
01020304050
Ica Coca-Cola Pepsi
Brands
Per
cent
age 1=Most tasty
2=Tasty3=Least tasty
The questionnaire ended with a blind taste test of three different cola brands (X = Ica, Y =
Coca-Cola, Z = Pepsi), where the respondents were asked to rank the different brands in
accordance to their taste, where 3 represented the best taste and 1 the least favourable taste.
As can be seen in figure 4.15, 42 percent of the respondents found Ica’s cola to be “least
tasty”, while 34.7 percent found it to be “most tasty”. Coca-Cola was divided as following: 28
percent favoured it the most and 29.3 percent ranked it the lowest. Finally, 37.3 percent found
Pepsi to be the tastiest, whereas 28.7 found it to be the “least tasty”.
Figure 4.15
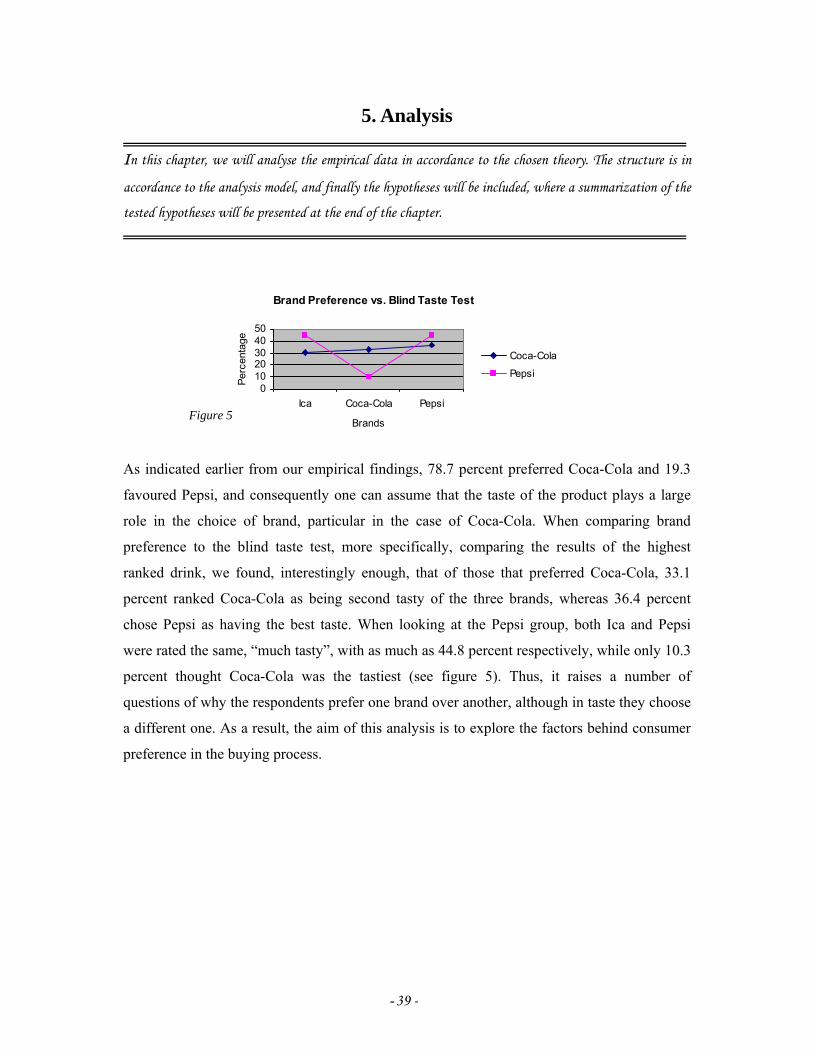
- 39 -
5. Analysis In this chapter, we will analyse the empirical data in accordance to the chosen theory. The structure is in
accordance to the analysis model, and finally the hypotheses will be included, where a summarization of the
tested hypotheses will be presented at the end of the chapter.
Brand Preference vs. Blind Taste Test
01020304050
Ica Coca-Cola Pepsi
Brands
Perc
enta
ge
Coca-Cola
Pepsi
As indicated earlier from our empirical findings, 78.7 percent preferred Coca-Cola and 19.3
favoured Pepsi, and consequently one can assume that the taste of the product plays a large
role in the choice of brand, particular in the case of Coca-Cola. When comparing brand
preference to the blind taste test, more specifically, comparing the results of the highest
ranked drink, we found, interestingly enough, that of those that preferred Coca-Cola, 33.1
percent ranked Coca-Cola as being second tasty of the three brands, whereas 36.4 percent
chose Pepsi as having the best taste. When looking at the Pepsi group, both Ica and Pepsi
were rated the same, “much tasty”, with as much as 44.8 percent respectively, while only 10.3
percent thought Coca-Cola was the tastiest (see figure 5). Thus, it raises a number of
questions of why the respondents prefer one brand over another, although in taste they choose
a different one. As a result, the aim of this analysis is to explore the factors behind consumer
preference in the buying process.
Figure 5
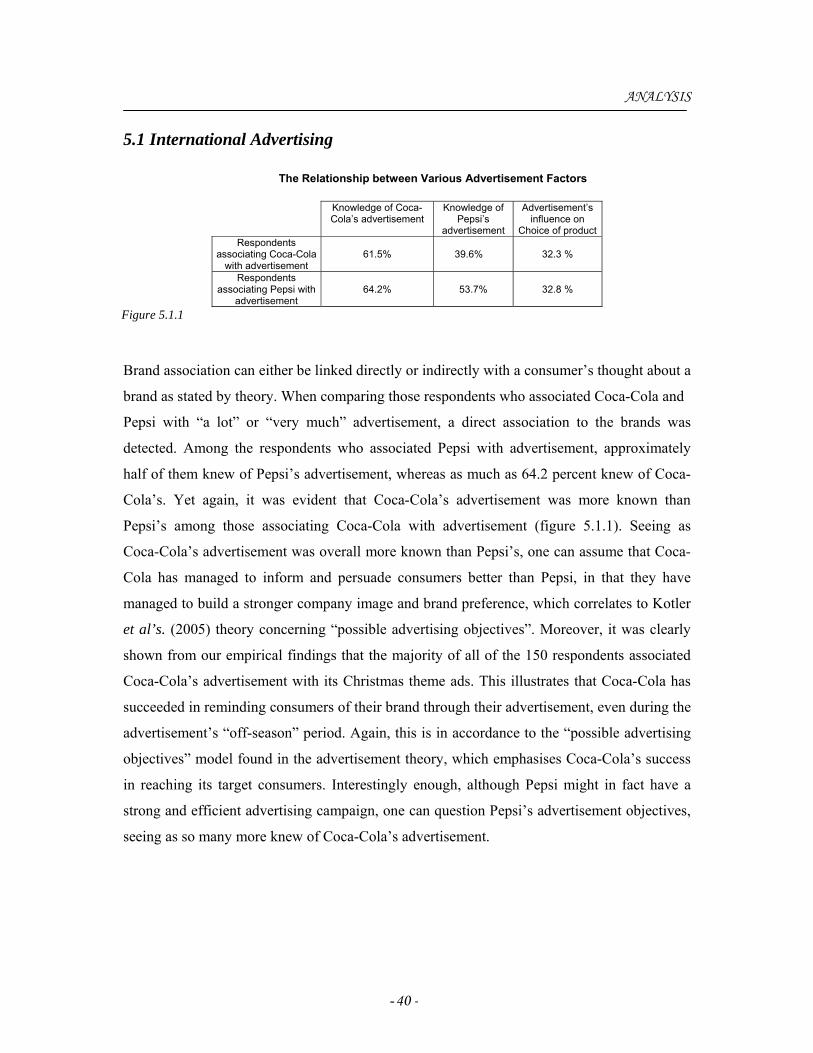
- 40 -
ANALYSIS
5.1 International Advertising
Brand association can either be linked directly or indirectly with a consumer’s thought about a
brand as stated by theory. When comparing those respondents who associated Coca-Cola and
Pepsi with “a lot” or “very much” advertisement, a direct association to the brands was
detected. Among the respondents who associated Pepsi with advertisement, approximately
half of them knew of Pepsi’s advertisement, whereas as much as 64.2 percent knew of Coca-
Cola’s. Yet again, it was evident that Coca-Cola’s advertisement was more known than
Pepsi’s among those associating Coca-Cola with advertisement (figure 5.1.1). Seeing as
Coca-Cola’s advertisement was overall more known than Pepsi’s, one can assume that Coca-
Cola has managed to inform and persuade consumers better than Pepsi, in that they have
managed to build a stronger company image and brand preference, which correlates to Kotler
et al’s. (2005) theory concerning “possible advertising objectives”. Moreover, it was clearly
shown from our empirical findings that the majority of all of the 150 respondents associated
Coca-Cola’s advertisement with its Christmas theme ads. This illustrates that Coca-Cola has
succeeded in reminding consumers of their brand through their advertisement, even during the
advertisement’s “off-season” period. Again, this is in accordance to the “possible advertising
objectives” model found in the advertisement theory, which emphasises Coca-Cola’s success
in reaching its target consumers. Interestingly enough, although Pepsi might in fact have a
strong and efficient advertising campaign, one can question Pepsi’s advertisement objectives,
seeing as so many more knew of Coca-Cola’s advertisement.
Knowledge of Coca-Cola’s advertisement
Knowledge of Pepsi’s
advertisement
Advertisement’s influence on
Choice of product Respondents
associating Coca-Cola with advertisement
61.5%
39.6%
32.3 %
Respondents associating Pepsi with
advertisement
64.2%
53.7%
32.8 %
The Relationship between Various Advertisement Factors
Figure 5.1.1
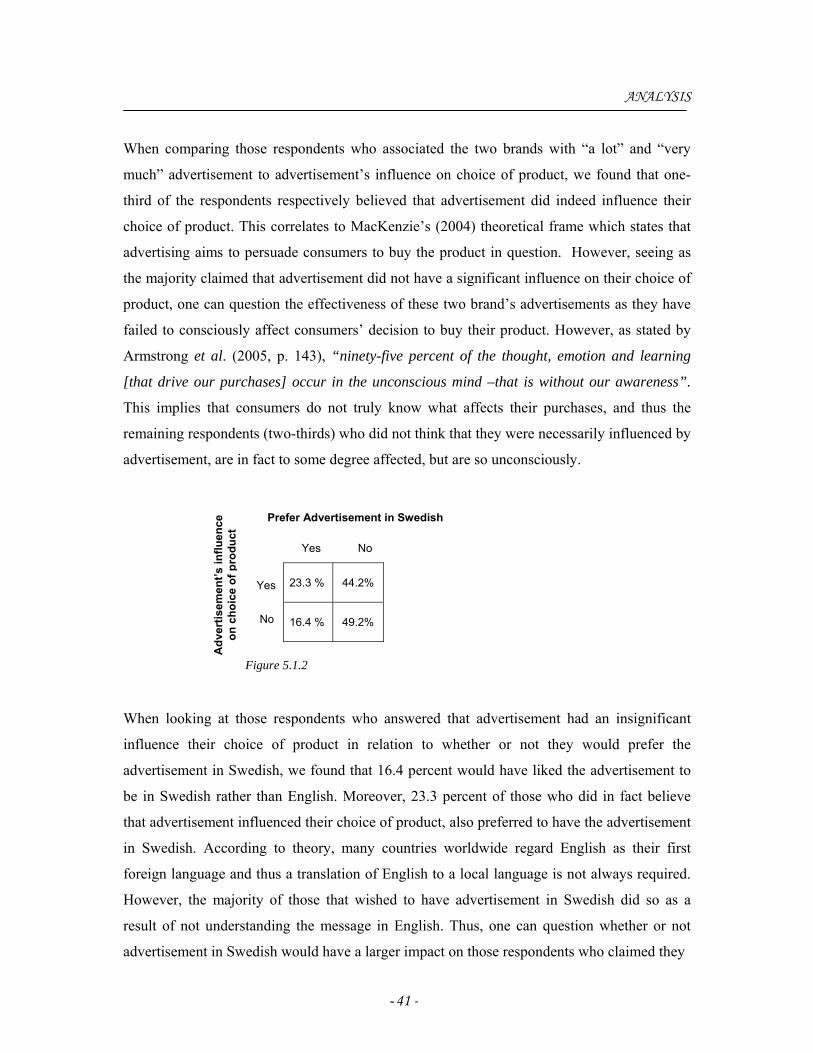
- 41 -
Yes
No
NoYes
ANALYSIS
When comparing those respondents who associated the two brands with “a lot” and “very
much” advertisement to advertisement’s influence on choice of product, we found that one-
third of the respondents respectively believed that advertisement did indeed influence their
choice of product. This correlates to MacKenzie’s (2004) theoretical frame which states that
advertising aims to persuade consumers to buy the product in question. However, seeing as
the majority claimed that advertisement did not have a significant influence on their choice of
product, one can question the effectiveness of these two brand’s advertisements as they have
failed to consciously affect consumers’ decision to buy their product. However, as stated by
Armstrong et al. (2005, p. 143), “ninety-five percent of the thought, emotion and learning
[that drive our purchases] occur in the unconscious mind –that is without our awareness”.
This implies that consumers do not truly know what affects their purchases, and thus the
remaining respondents (two-thirds) who did not think that they were necessarily influenced by
advertisement, are in fact to some degree affected, but are so unconsciously.
When looking at those respondents who answered that advertisement had an insignificant
influence their choice of product in relation to whether or not they would prefer the
advertisement in Swedish, we found that 16.4 percent would have liked the advertisement to
be in Swedish rather than English. Moreover, 23.3 percent of those who did in fact believe
that advertisement influenced their choice of product, also preferred to have the advertisement
in Swedish. According to theory, many countries worldwide regard English as their first
foreign language and thus a translation of English to a local language is not always required.
However, the majority of those that wished to have advertisement in Swedish did so as a
result of not understanding the message in English. Thus, one can question whether or not
advertisement in Swedish would have a larger impact on those respondents who claimed they
23.3 %
44.2%
16.4 %
49.2%
Adv
ertis
emen
t’s in
fluen
ce
on c
hoic
e of
pro
duct
Prefer Advertisement in Swedish
Figure 5.1.2
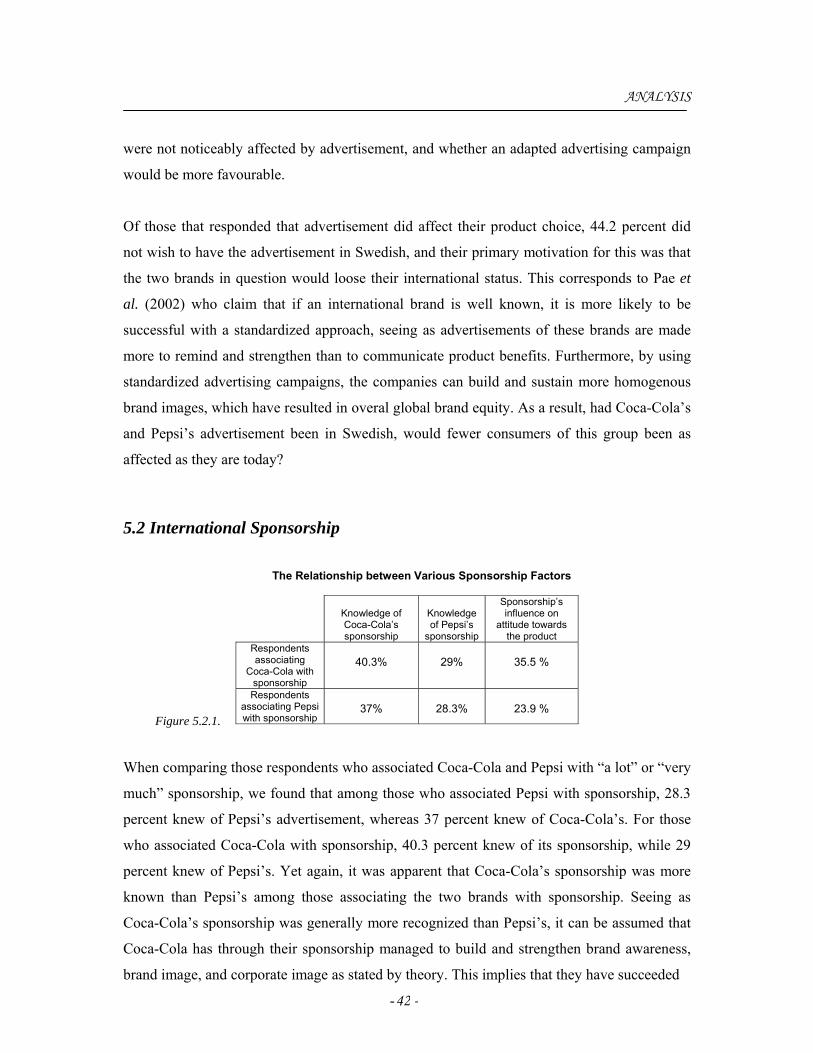
- 42 -
Figure 5.2.1.
ANALYSIS
were not noticeably affected by advertisement, and whether an adapted advertising campaign
would be more favourable.
Of those that responded that advertisement did affect their product choice, 44.2 percent did
not wish to have the advertisement in Swedish, and their primary motivation for this was that
the two brands in question would loose their international status. This corresponds to Pae et
al. (2002) who claim that if an international brand is well known, it is more likely to be
successful with a standardized approach, seeing as advertisements of these brands are made
more to remind and strengthen than to communicate product benefits. Furthermore, by using
standardized advertising campaigns, the companies can build and sustain more homogenous
brand images, which have resulted in overal global brand equity. As a result, had Coca-Cola’s
and Pepsi’s advertisement been in Swedish, would fewer consumers of this group been as
affected as they are today?
5.2 International Sponsorship
When comparing those respondents who associated Coca-Cola and Pepsi with “a lot” or “very
much” sponsorship, we found that among those who associated Pepsi with sponsorship, 28.3
percent knew of Pepsi’s advertisement, whereas 37 percent knew of Coca-Cola’s. For those
who associated Coca-Cola with sponsorship, 40.3 percent knew of its sponsorship, while 29
percent knew of Pepsi’s. Yet again, it was apparent that Coca-Cola’s sponsorship was more
known than Pepsi’s among those associating the two brands with sponsorship. Seeing as
Coca-Cola’s sponsorship was generally more recognized than Pepsi’s, it can be assumed that
Coca-Cola has through their sponsorship managed to build and strengthen brand awareness,
brand image, and corporate image as stated by theory. This implies that they have succeeded
Knowledge of Coca-Cola’s sponsorship
Knowledge of Pepsi’s
sponsorship
Sponsorship’s influence on
attitude towards the product
Respondents associating
Coca-Cola with sponsorship
40.3%
29%
35.5 %
Respondents associating Pepsi with sponsorship
37%
28.3%
23.9 %
The Relationship between Various Sponsorship Factors
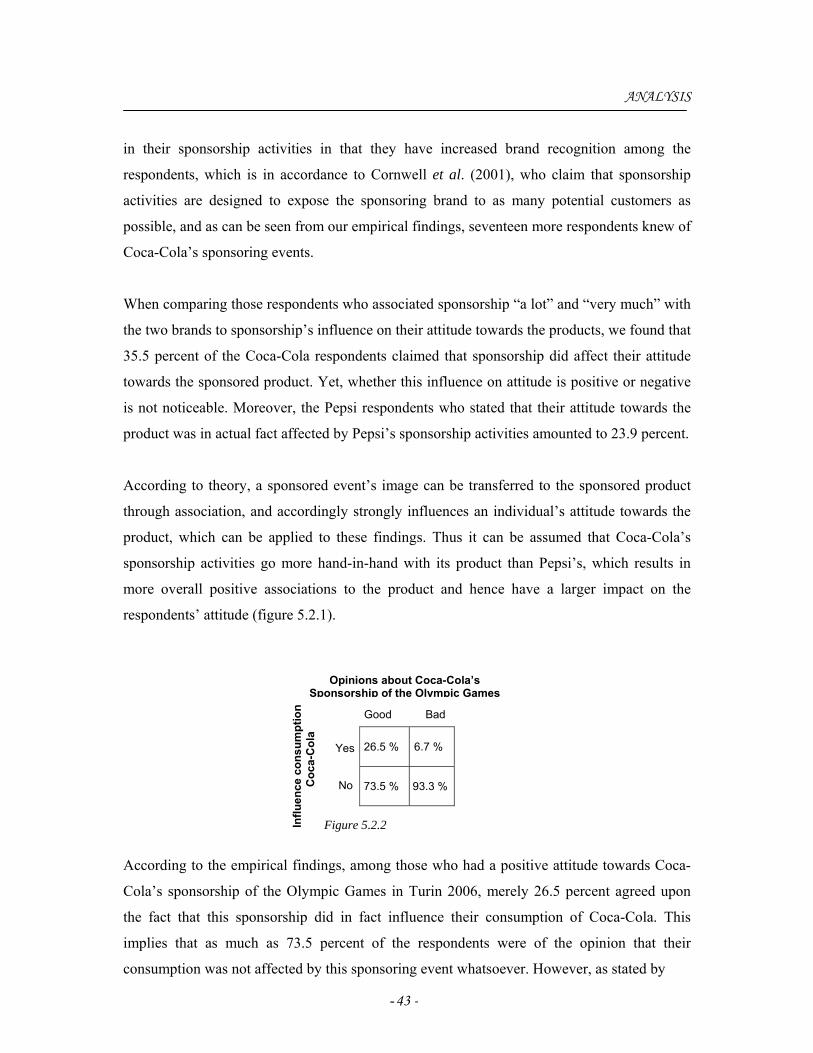
- 43 -
Good Bad
Yes
No
Influ
ence
con
sum
ptio
n of
C
oca-
Col
a
ANALYSIS
in their sponsorship activities in that they have increased brand recognition among the
respondents, which is in accordance to Cornwell et al. (2001), who claim that sponsorship
activities are designed to expose the sponsoring brand to as many potential customers as
possible, and as can be seen from our empirical findings, seventeen more respondents knew of
Coca-Cola’s sponsoring events.
When comparing those respondents who associated sponsorship “a lot” and “very much” with
the two brands to sponsorship’s influence on their attitude towards the products, we found that
35.5 percent of the Coca-Cola respondents claimed that sponsorship did affect their attitude
towards the sponsored product. Yet, whether this influence on attitude is positive or negative
is not noticeable. Moreover, the Pepsi respondents who stated that their attitude towards the
product was in actual fact affected by Pepsi’s sponsorship activities amounted to 23.9 percent.
According to theory, a sponsored event’s image can be transferred to the sponsored product
through association, and accordingly strongly influences an individual’s attitude towards the
product, which can be applied to these findings. Thus it can be assumed that Coca-Cola’s
sponsorship activities go more hand-in-hand with its product than Pepsi’s, which results in
more overall positive associations to the product and hence have a larger impact on the
respondents’ attitude (figure 5.2.1).
According to the empirical findings, among those who had a positive attitude towards Coca-
Cola’s sponsorship of the Olympic Games in Turin 2006, merely 26.5 percent agreed upon
the fact that this sponsorship did in fact influence their consumption of Coca-Cola. This
implies that as much as 73.5 percent of the respondents were of the opinion that their
consumption was not affected by this sponsoring event whatsoever. However, as stated by
26.5 %
6.7 %
73.5 % 93.3 %
Opinions about Coca-Cola’s Sponsorship of the Olympic Games
Figure 5.2.2
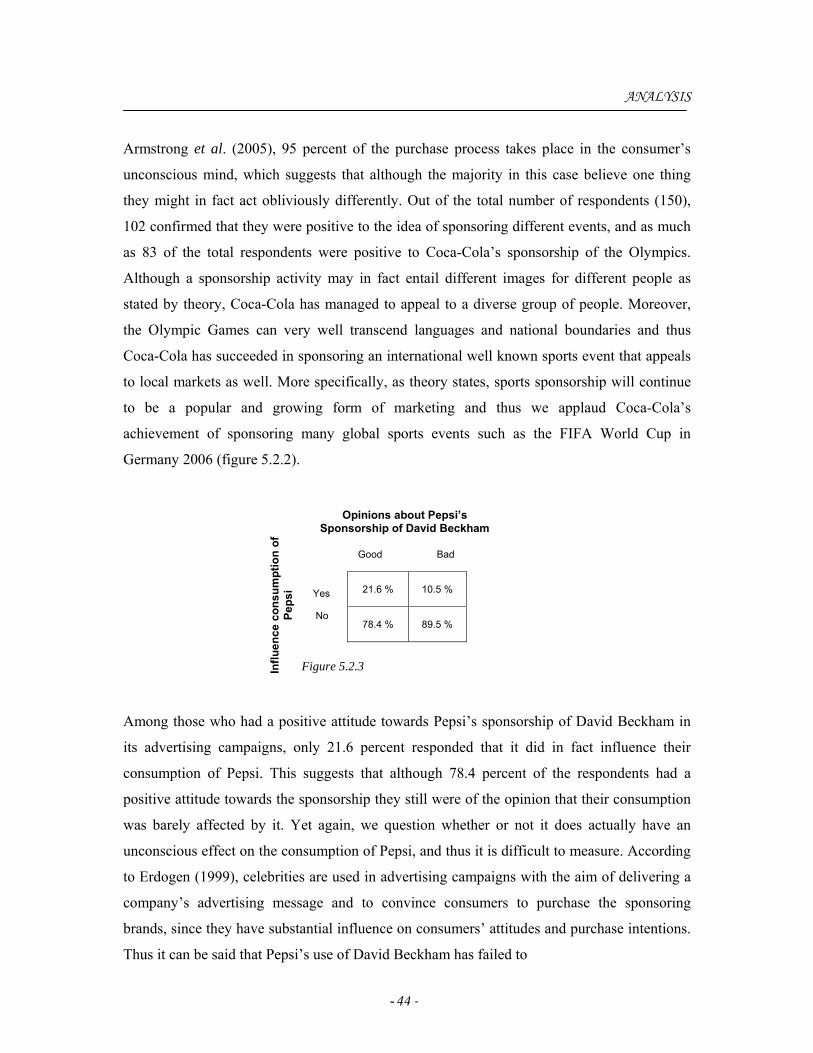
- 44 -
Yes
No
Good Bad
ANALYSIS
Armstrong et al. (2005), 95 percent of the purchase process takes place in the consumer’s
unconscious mind, which suggests that although the majority in this case believe one thing
they might in fact act obliviously differently. Out of the total number of respondents (150),
102 confirmed that they were positive to the idea of sponsoring different events, and as much
as 83 of the total respondents were positive to Coca-Cola’s sponsorship of the Olympics.
Although a sponsorship activity may in fact entail different images for different people as
stated by theory, Coca-Cola has managed to appeal to a diverse group of people. Moreover,
the Olympic Games can very well transcend languages and national boundaries and thus
Coca-Cola has succeeded in sponsoring an international well known sports event that appeals
to local markets as well. More specifically, as theory states, sports sponsorship will continue
to be a popular and growing form of marketing and thus we applaud Coca-Cola’s
achievement of sponsoring many global sports events such as the FIFA World Cup in
Germany 2006 (figure 5.2.2).
Among those who had a positive attitude towards Pepsi’s sponsorship of David Beckham in
its advertising campaigns, only 21.6 percent responded that it did in fact influence their
consumption of Pepsi. This suggests that although 78.4 percent of the respondents had a
positive attitude towards the sponsorship they still were of the opinion that their consumption
was barely affected by it. Yet again, we question whether or not it does actually have an
unconscious effect on the consumption of Pepsi, and thus it is difficult to measure. According
to Erdogen (1999), celebrities are used in advertising campaigns with the aim of delivering a
company’s advertising message and to convince consumers to purchase the sponsoring
brands, since they have substantial influence on consumers’ attitudes and purchase intentions.
Thus it can be said that Pepsi’s use of David Beckham has failed to
21.6 %
10.5 %
78.4 %
89.5 %
Opinions about Pepsi’s Sponsorship of David Beckham
Influ
ence
con
sum
ptio
n of
Pe
psi
Figure 5.2.3
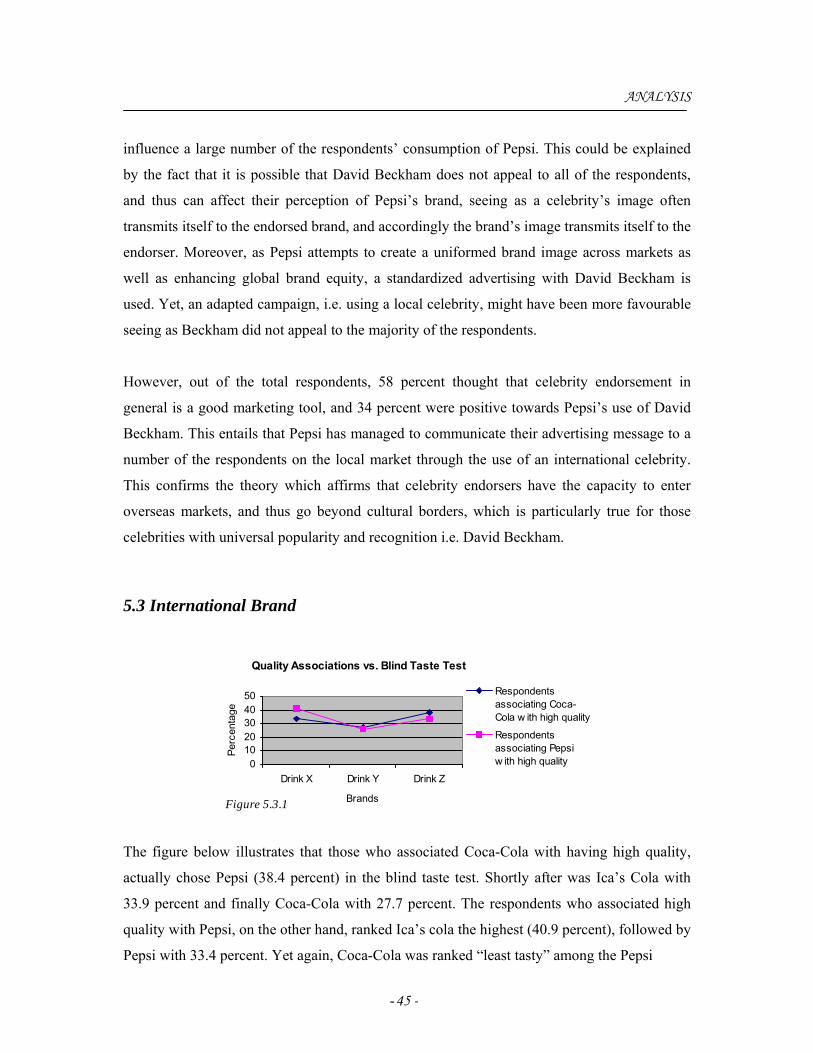
- 45 -
ANALYSIS
influence a large number of the respondents’ consumption of Pepsi. This could be explained
by the fact that it is possible that David Beckham does not appeal to all of the respondents,
and thus can affect their perception of Pepsi’s brand, seeing as a celebrity’s image often
transmits itself to the endorsed brand, and accordingly the brand’s image transmits itself to the
endorser. Moreover, as Pepsi attempts to create a uniformed brand image across markets as
well as enhancing global brand equity, a standardized advertising with David Beckham is
used. Yet, an adapted campaign, i.e. using a local celebrity, might have been more favourable
seeing as Beckham did not appeal to the majority of the respondents.
However, out of the total respondents, 58 percent thought that celebrity endorsement in
general is a good marketing tool, and 34 percent were positive towards Pepsi’s use of David
Beckham. This entails that Pepsi has managed to communicate their advertising message to a
number of the respondents on the local market through the use of an international celebrity.
This confirms the theory which affirms that celebrity endorsers have the capacity to enter
overseas markets, and thus go beyond cultural borders, which is particularly true for those
celebrities with universal popularity and recognition i.e. David Beckham.
5.3 International Brand
Quality Associations vs. Blind Taste Test
01020304050
Drink X Drink Y Drink Z
Brands
Perc
enta
ge
Respondentsassociating Coca-Cola w ith high quality
Respondentsassociating Pepsiw ith high quality
Figure 5.3.1
The figure below illustrates that those who associated Coca-Cola with having high quality,
actually chose Pepsi (38.4 percent) in the blind taste test. Shortly after was Ica’s Cola with
33.9 percent and finally Coca-Cola with 27.7 percent. The respondents who associated high
quality with Pepsi, on the other hand, ranked Ica’s cola the highest (40.9 percent), followed by
Pepsi with 33.4 percent. Yet again, Coca-Cola was ranked “least tasty” among the Pepsi
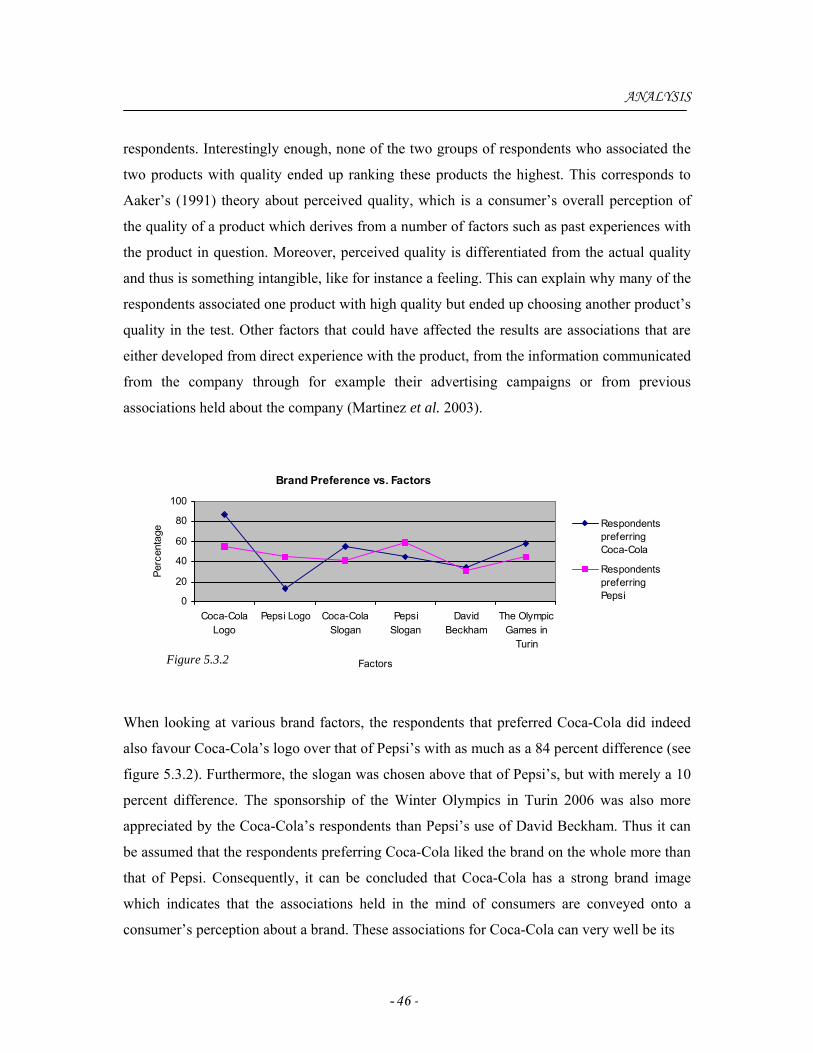
- 46 -
ANALYSIS
respondents. Interestingly enough, none of the two groups of respondents who associated the
two products with quality ended up ranking these products the highest. This corresponds to
Aaker’s (1991) theory about perceived quality, which is a consumer’s overall perception of
the quality of a product which derives from a number of factors such as past experiences with
the product in question. Moreover, perceived quality is differentiated from the actual quality
and thus is something intangible, like for instance a feeling. This can explain why many of the
respondents associated one product with high quality but ended up choosing another product’s
quality in the test. Other factors that could have affected the results are associations that are
either developed from direct experience with the product, from the information communicated
from the company through for example their advertising campaigns or from previous
associations held about the company (Martinez et al. 2003).
Brand Preference vs. Factors
0
20
40
60
80
100
Coca-ColaLogo
Pepsi Logo Coca-ColaSlogan
PepsiSlogan
DavidBeckham
The OlympicGames in
Turin
Factors
Perc
enta
ge
RespondentspreferringCoca-Cola
RespondentspreferringPepsi
When looking at various brand factors, the respondents that preferred Coca-Cola did indeed
also favour Coca-Cola’s logo over that of Pepsi’s with as much as a 84 percent difference (see
figure 5.3.2). Furthermore, the slogan was chosen above that of Pepsi’s, but with merely a 10
percent difference. The sponsorship of the Winter Olympics in Turin 2006 was also more
appreciated by the Coca-Cola’s respondents than Pepsi’s use of David Beckham. Thus it can
be assumed that the respondents preferring Coca-Cola liked the brand on the whole more than
that of Pepsi. Consequently, it can be concluded that Coca-Cola has a strong brand image
which indicates that the associations held in the mind of consumers are conveyed onto a
consumer’s perception about a brand. These associations for Coca-Cola can very well be its
Figure 5.3.2
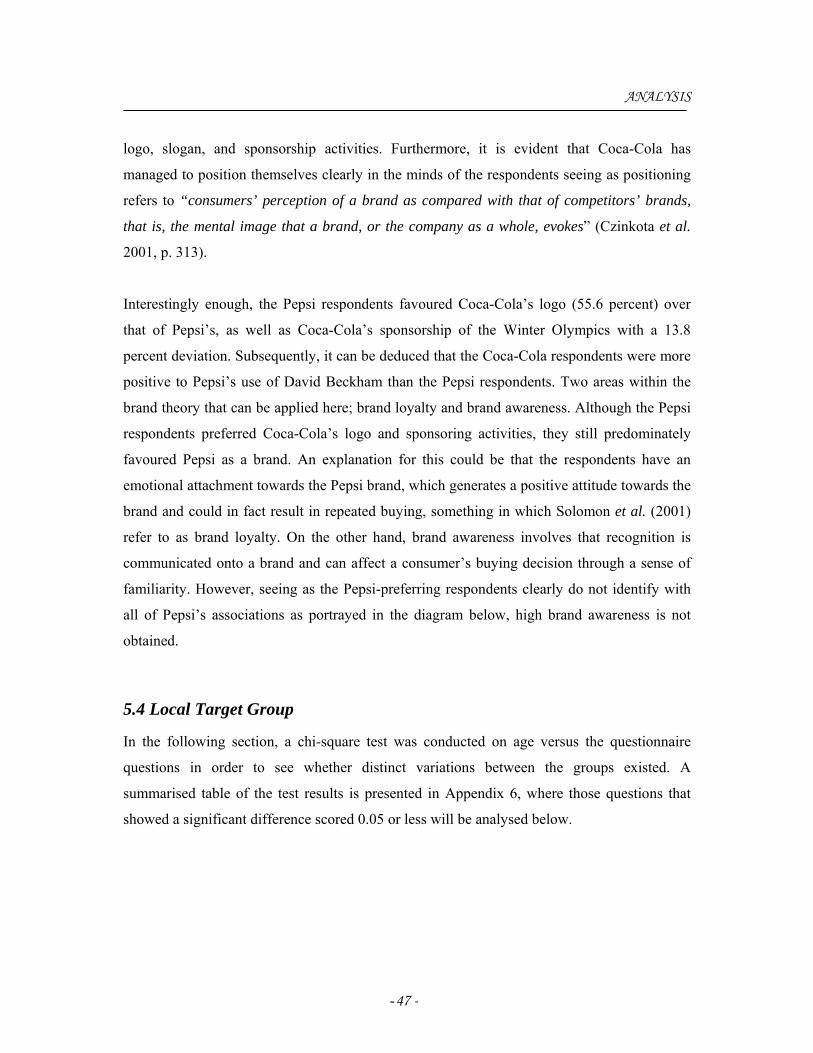
- 47 -
ANALYSIS
logo, slogan, and sponsorship activities. Furthermore, it is evident that Coca-Cola has
managed to position themselves clearly in the minds of the respondents seeing as positioning
refers to “consumers’ perception of a brand as compared with that of competitors’ brands,
that is, the mental image that a brand, or the company as a whole, evokes” (Czinkota et al.
2001, p. 313).
Interestingly enough, the Pepsi respondents favoured Coca-Cola’s logo (55.6 percent) over
that of Pepsi’s, as well as Coca-Cola’s sponsorship of the Winter Olympics with a 13.8
percent deviation. Subsequently, it can be deduced that the Coca-Cola respondents were more
positive to Pepsi’s use of David Beckham than the Pepsi respondents. Two areas within the
brand theory that can be applied here; brand loyalty and brand awareness. Although the Pepsi
respondents preferred Coca-Cola’s logo and sponsoring activities, they still predominately
favoured Pepsi as a brand. An explanation for this could be that the respondents have an
emotional attachment towards the Pepsi brand, which generates a positive attitude towards the
brand and could in fact result in repeated buying, something in which Solomon et al. (2001)
refer to as brand loyalty. On the other hand, brand awareness involves that recognition is
communicated onto a brand and can affect a consumer’s buying decision through a sense of
familiarity. However, seeing as the Pepsi-preferring respondents clearly do not identify with
all of Pepsi’s associations as portrayed in the diagram below, high brand awareness is not
obtained.
5.4 Local Target Group
In the following section, a chi-square test was conducted on age versus the questionnaire
questions in order to see whether distinct variations between the groups existed. A
summarised table of the test results is presented in Appendix 6, where those questions that
showed a significant difference scored 0.05 or less will be analysed below.
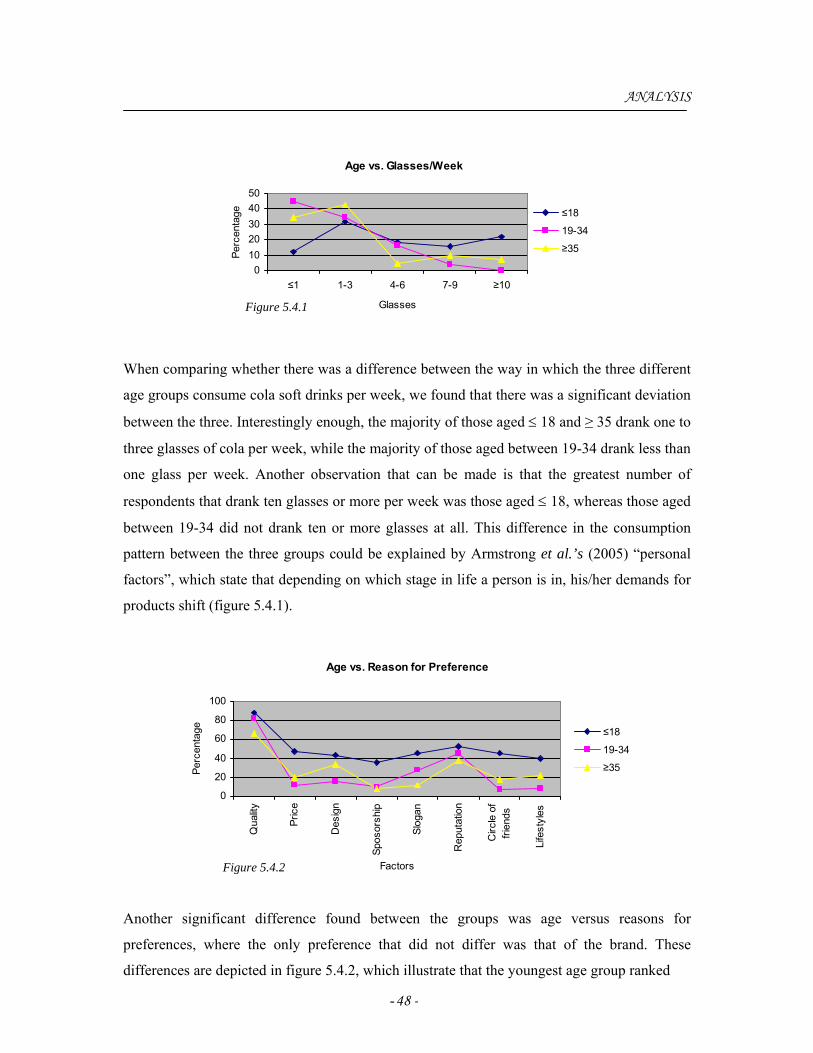
- 48 -
ANALYSIS
Age vs. Glasses/Week
01020304050
≤1 1-3 4-6 7-9 ≥10
Glasses
Perc
enta
ge ≤18
19-34
≥35
When comparing whether there was a difference between the way in which the three different
age groups consume cola soft drinks per week, we found that there was a significant deviation
between the three. Interestingly enough, the majority of those aged ≤ 18 and ≥ 35 drank one to
three glasses of cola per week, while the majority of those aged between 19-34 drank less than
one glass per week. Another observation that can be made is that the greatest number of
respondents that drank ten glasses or more per week was those aged ≤ 18, whereas those aged
between 19-34 did not drank ten or more glasses at all. This difference in the consumption
pattern between the three groups could be explained by Armstrong et al.’s (2005) “personal
factors”, which state that depending on which stage in life a person is in, his/her demands for
products shift (figure 5.4.1).
Age vs. Reason for Preference
0
20
40
60
80
100
Qua
lity
Pric
e
Des
ign
Spos
orsh
ip
Slog
an
Rep
utat
ion
Circ
le o
ffri
ends
Life
styl
es
Factors
Perc
enta
ge ≤18
19-34
≥35
Another significant difference found between the groups was age versus reasons for
preferences, where the only preference that did not differ was that of the brand. These
differences are depicted in figure 5.4.2, which illustrate that the youngest age group ranked
Figure 5.4.1
Figure 5.4.2
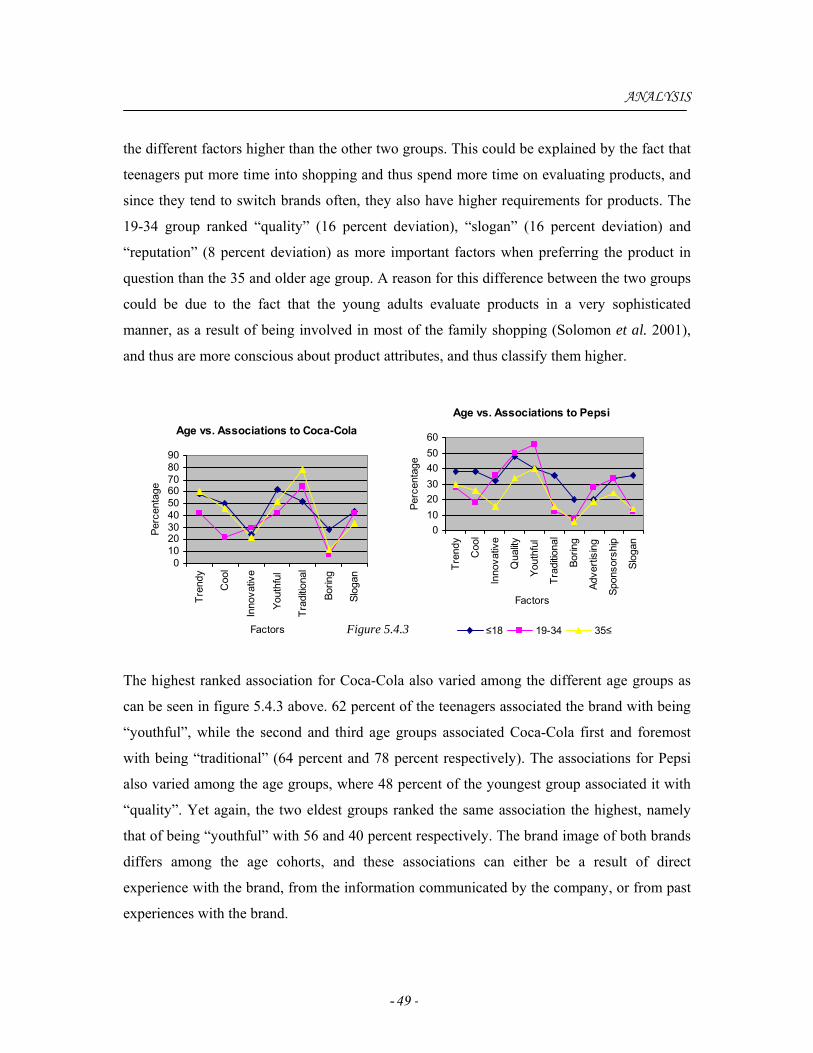
- 49 -
ANALYSIS
the different factors higher than the other two groups. This could be explained by the fact that
teenagers put more time into shopping and thus spend more time on evaluating products, and
since they tend to switch brands often, they also have higher requirements for products. The
19-34 group ranked “quality” (16 percent deviation), “slogan” (16 percent deviation) and
“reputation” (8 percent deviation) as more important factors when preferring the product in
question than the 35 and older age group. A reason for this difference between the two groups
could be due to the fact that the young adults evaluate products in a very sophisticated
manner, as a result of being involved in most of the family shopping (Solomon et al. 2001),
and thus are more conscious about product attributes, and thus classify them higher.
Age vs. Associations to Coca-Cola
0102030405060708090
Tren
dy
Coo
l
Inno
vativ
e
Yout
hful
Trad
itiona
l
Borin
g
Slog
an
Factors
Perc
enta
ge
Age vs. Associations to Pepsi
0102030405060
Tren
dy
Coo
l
Inno
vativ
e
Qua
lity
Yout
hful
Trad
itiona
l
Borin
g
Adve
rtisi
ng
Spon
sors
hip
Slog
an
Factors
Perc
enta
ge
≤18 19-34 35≤
The highest ranked association for Coca-Cola also varied among the different age groups as
can be seen in figure 5.4.3 above. 62 percent of the teenagers associated the brand with being
“youthful”, while the second and third age groups associated Coca-Cola first and foremost
with being “traditional” (64 percent and 78 percent respectively). The associations for Pepsi
also varied among the age groups, where 48 percent of the youngest group associated it with
“quality”. Yet again, the two eldest groups ranked the same association the highest, namely
that of being “youthful” with 56 and 40 percent respectively. The brand image of both brands
differs among the age cohorts, and these associations can either be a result of direct
experience with the brand, from the information communicated by the company, or from past
experiences with the brand.
Figure 5.4.3
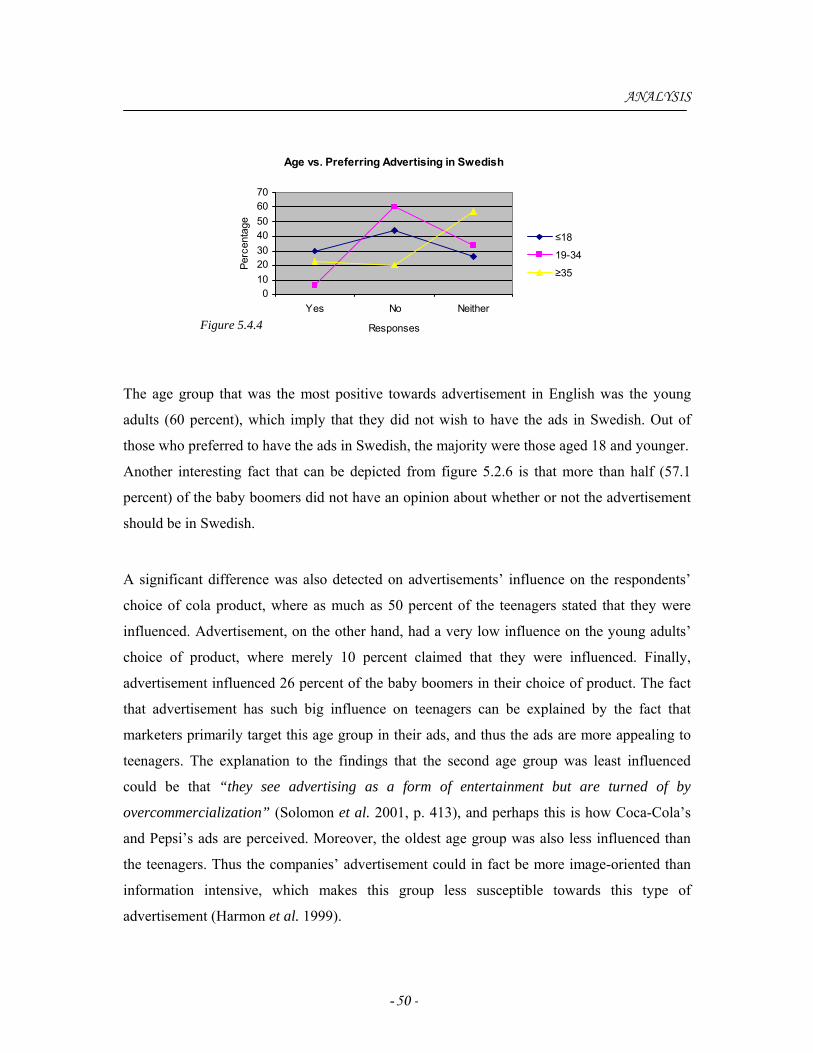
- 50 -
ANALYSIS
Age vs. Preferring Advertising in Swedish
010203040506070
Yes No Neither
Responses
Perc
enta
ge≤18
19-34
≥35
The age group that was the most positive towards advertisement in English was the young
adults (60 percent), which imply that they did not wish to have the ads in Swedish. Out of
those who preferred to have the ads in Swedish, the majority were those aged 18 and younger.
Another interesting fact that can be depicted from figure 5.2.6 is that more than half (57.1
percent) of the baby boomers did not have an opinion about whether or not the advertisement
should be in Swedish.
A significant difference was also detected on advertisements’ influence on the respondents’
choice of cola product, where as much as 50 percent of the teenagers stated that they were
influenced. Advertisement, on the other hand, had a very low influence on the young adults’
choice of product, where merely 10 percent claimed that they were influenced. Finally,
advertisement influenced 26 percent of the baby boomers in their choice of product. The fact
that advertisement has such big influence on teenagers can be explained by the fact that
marketers primarily target this age group in their ads, and thus the ads are more appealing to
teenagers. The explanation to the findings that the second age group was least influenced
could be that “they see advertising as a form of entertainment but are turned of by
overcommercialization” (Solomon et al. 2001, p. 413), and perhaps this is how Coca-Cola’s
and Pepsi’s ads are perceived. Moreover, the oldest age group was also less influenced than
the teenagers. Thus the companies’ advertisement could in fact be more image-oriented than
information intensive, which makes this group less susceptible towards this type of
advertisement (Harmon et al. 1999).
Figure 5.4.4
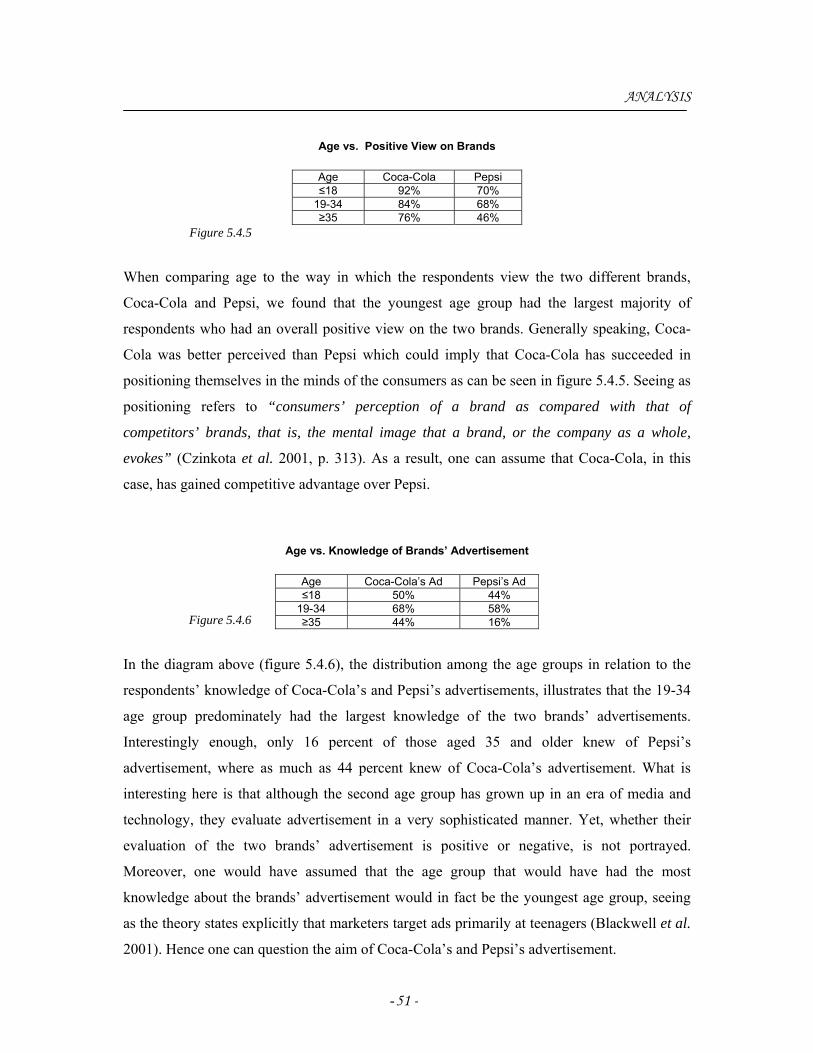
- 51 -
ANALYSIS
Age vs. Positive View on Brands
Age Coca-Cola Pepsi ≤18 92% 70%
19-34 84% 68% ≥35 76% 46%
When comparing age to the way in which the respondents view the two different brands,
Coca-Cola and Pepsi, we found that the youngest age group had the largest majority of
respondents who had an overall positive view on the two brands. Generally speaking, Coca-
Cola was better perceived than Pepsi which could imply that Coca-Cola has succeeded in
positioning themselves in the minds of the consumers as can be seen in figure 5.4.5. Seeing as
positioning refers to “consumers’ perception of a brand as compared with that of
competitors’ brands, that is, the mental image that a brand, or the company as a whole,
evokes” (Czinkota et al. 2001, p. 313). As a result, one can assume that Coca-Cola, in this
case, has gained competitive advantage over Pepsi.
Age vs. Knowledge of Brands’ Advertisement
Age Coca-Cola’s Ad Pepsi’s Ad ≤18 50% 44%
19-34 68% 58% ≥35 44% 16%
In the diagram above (figure 5.4.6), the distribution among the age groups in relation to the
respondents’ knowledge of Coca-Cola’s and Pepsi’s advertisements, illustrates that the 19-34
age group predominately had the largest knowledge of the two brands’ advertisements.
Interestingly enough, only 16 percent of those aged 35 and older knew of Pepsi’s
advertisement, where as much as 44 percent knew of Coca-Cola’s advertisement. What is
interesting here is that although the second age group has grown up in an era of media and
technology, they evaluate advertisement in a very sophisticated manner. Yet, whether their
evaluation of the two brands’ advertisement is positive or negative, is not portrayed.
Moreover, one would have assumed that the age group that would have had the most
knowledge about the brands’ advertisement would in fact be the youngest age group, seeing
as the theory states explicitly that marketers target ads primarily at teenagers (Blackwell et al.
2001). Hence one can question the aim of Coca-Cola’s and Pepsi’s advertisement.
Figure 5.4.5
Figure 5.4.6
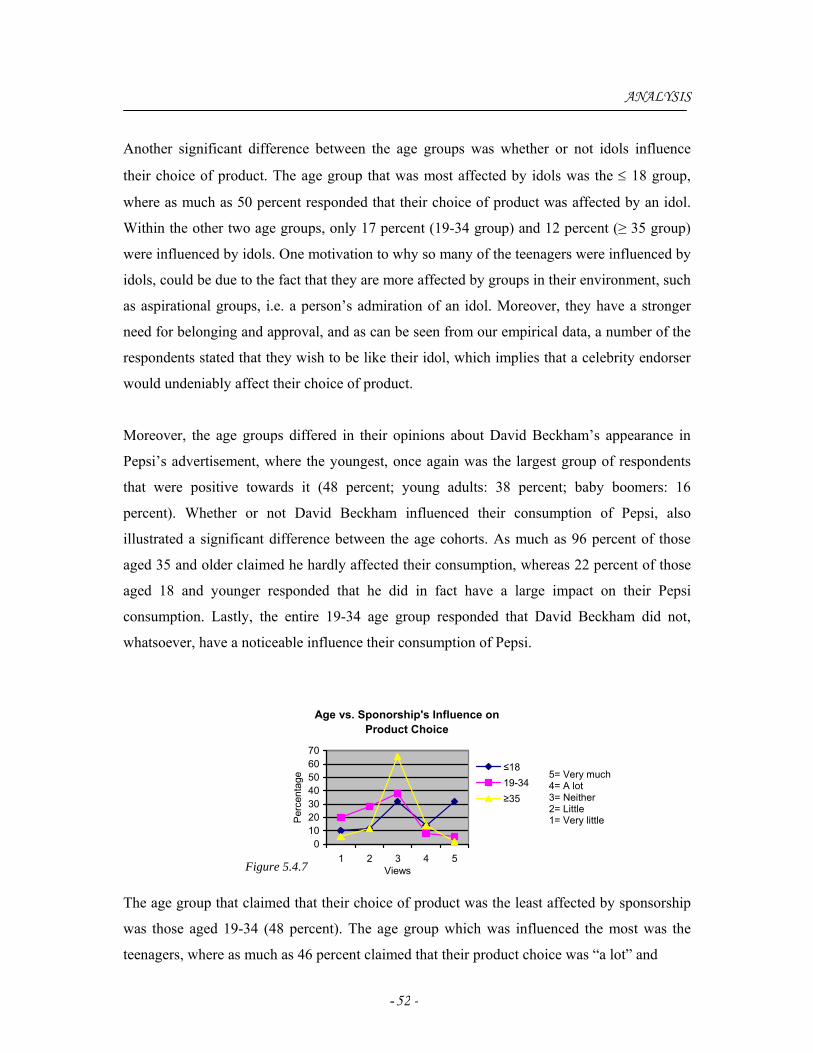
- 52 -
ANALYSIS
Another significant difference between the age groups was whether or not idols influence
their choice of product. The age group that was most affected by idols was the ≤ 18 group,
where as much as 50 percent responded that their choice of product was affected by an idol.
Within the other two age groups, only 17 percent (19-34 group) and 12 percent (≥ 35 group)
were influenced by idols. One motivation to why so many of the teenagers were influenced by
idols, could be due to the fact that they are more affected by groups in their environment, such
as aspirational groups, i.e. a person’s admiration of an idol. Moreover, they have a stronger
need for belonging and approval, and as can be seen from our empirical data, a number of the
respondents stated that they wish to be like their idol, which implies that a celebrity endorser
would undeniably affect their choice of product.
Moreover, the age groups differed in their opinions about David Beckham’s appearance in
Pepsi’s advertisement, where the youngest, once again was the largest group of respondents
that were positive towards it (48 percent; young adults: 38 percent; baby boomers: 16
percent). Whether or not David Beckham influenced their consumption of Pepsi, also
illustrated a significant difference between the age cohorts. As much as 96 percent of those
aged 35 and older claimed he hardly affected their consumption, whereas 22 percent of those
aged 18 and younger responded that he did in fact have a large impact on their Pepsi
consumption. Lastly, the entire 19-34 age group responded that David Beckham did not,
whatsoever, have a noticeable influence their consumption of Pepsi.
Age vs. Sponorship's Influence on Product Choice
010203040506070
1 2 3 4 5Views
Per
cent
age
≤1819-34≥35
The age group that claimed that their choice of product was the least affected by sponsorship
was those aged 19-34 (48 percent). The age group which was influenced the most was the
teenagers, where as much as 46 percent claimed that their product choice was “a lot” and
5= Very much 4= A lot 3= Neither 2= Little 1= Very little
Figure 5.4.7
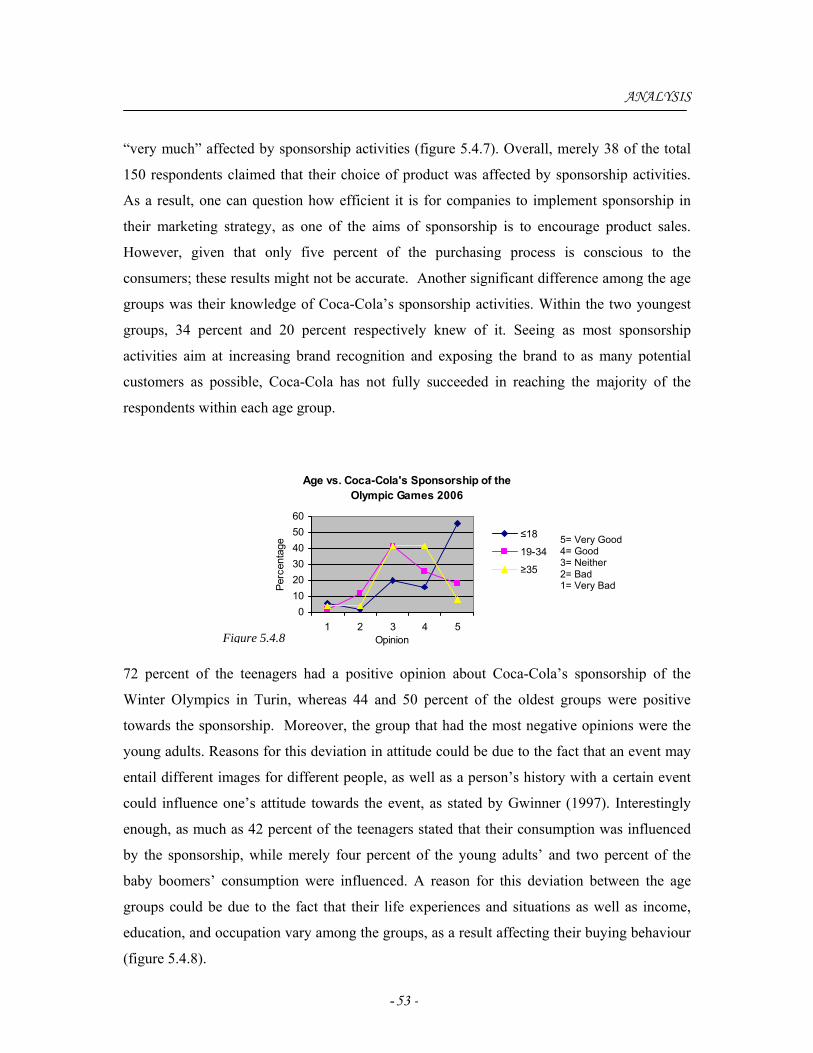
- 53 -
ANALYSIS
“very much” affected by sponsorship activities (figure 5.4.7). Overall, merely 38 of the total
150 respondents claimed that their choice of product was affected by sponsorship activities.
As a result, one can question how efficient it is for companies to implement sponsorship in
their marketing strategy, as one of the aims of sponsorship is to encourage product sales.
However, given that only five percent of the purchasing process is conscious to the
consumers; these results might not be accurate. Another significant difference among the age
groups was their knowledge of Coca-Cola’s sponsorship activities. Within the two youngest
groups, 34 percent and 20 percent respectively knew of it. Seeing as most sponsorship
activities aim at increasing brand recognition and exposing the brand to as many potential
customers as possible, Coca-Cola has not fully succeeded in reaching the majority of the
respondents within each age group.
Age vs. Coca-Cola's Sponsorship of the Olympic Games 2006
0102030405060
1 2 3 4 5Opinion
Perc
enta
ge
≤18
19-34
≥35
72 percent of the teenagers had a positive opinion about Coca-Cola’s sponsorship of the
Winter Olympics in Turin, whereas 44 and 50 percent of the oldest groups were positive
towards the sponsorship. Moreover, the group that had the most negative opinions were the
young adults. Reasons for this deviation in attitude could be due to the fact that an event may
entail different images for different people, as well as a person’s history with a certain event
could influence one’s attitude towards the event, as stated by Gwinner (1997). Interestingly
enough, as much as 42 percent of the teenagers stated that their consumption was influenced
by the sponsorship, while merely four percent of the young adults’ and two percent of the
baby boomers’ consumption were influenced. A reason for this deviation between the age
groups could be due to the fact that their life experiences and situations as well as income,
education, and occupation vary among the groups, as a result affecting their buying behaviour
(figure 5.4.8).
5= Very Good 4= Good 3= Neither 2= Bad 1= Very Bad
Figure 5.4.8
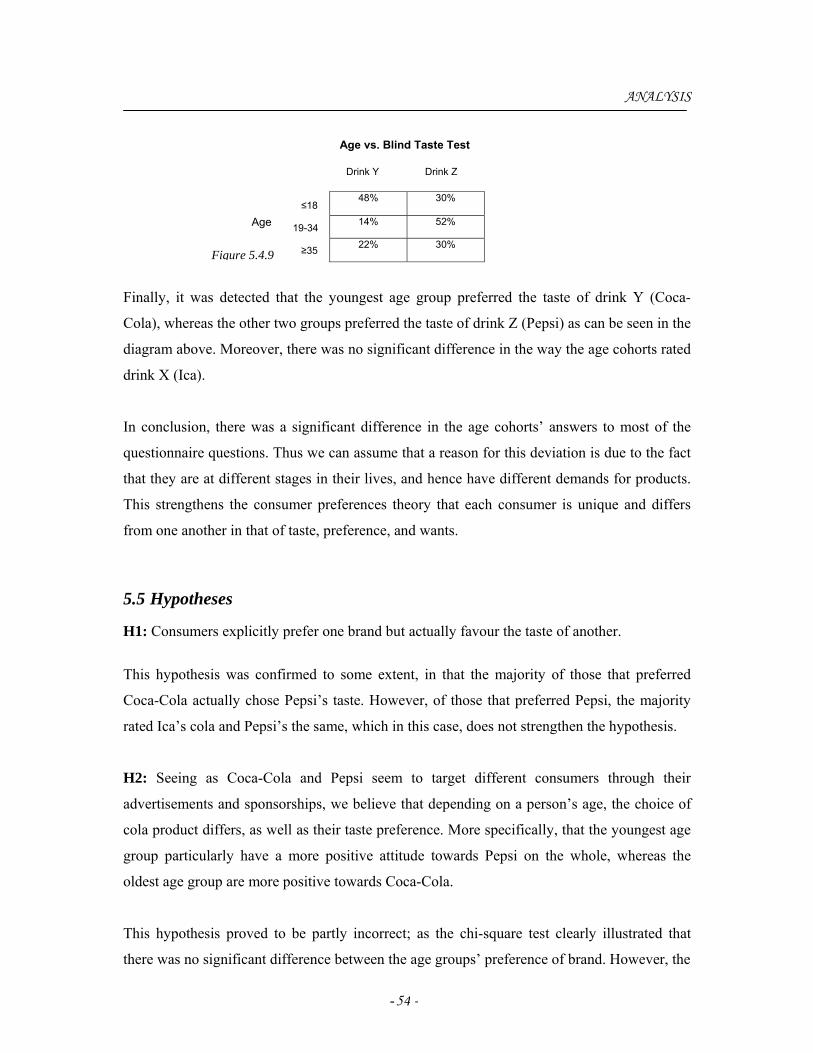
- 54 -
≤18
≥35 19-34
Figure 5.4.9
ANALYSIS
Finally, it was detected that the youngest age group preferred the taste of drink Y (Coca-
Cola), whereas the other two groups preferred the taste of drink Z (Pepsi) as can be seen in the
diagram above. Moreover, there was no significant difference in the way the age cohorts rated
drink X (Ica).
In conclusion, there was a significant difference in the age cohorts’ answers to most of the
questionnaire questions. Thus we can assume that a reason for this deviation is due to the fact
that they are at different stages in their lives, and hence have different demands for products.
This strengthens the consumer preferences theory that each consumer is unique and differs
from one another in that of taste, preference, and wants.
5.5 Hypotheses
H1: Consumers explicitly prefer one brand but actually favour the taste of another.
This hypothesis was confirmed to some extent, in that the majority of those that preferred
Coca-Cola actually chose Pepsi’s taste. However, of those that preferred Pepsi, the majority
rated Ica’s cola and Pepsi’s the same, which in this case, does not strengthen the hypothesis.
H2: Seeing as Coca-Cola and Pepsi seem to target different consumers through their
advertisements and sponsorships, we believe that depending on a person’s age, the choice of
cola product differs, as well as their taste preference. More specifically, that the youngest age
group particularly have a more positive attitude towards Pepsi on the whole, whereas the
oldest age group are more positive towards Coca-Cola.
This hypothesis proved to be partly incorrect; as the chi-square test clearly illustrated that
there was no significant difference between the age groups’ preference of brand. However, the
48% 30%
14% 52%
22% 30%
Age vs. Blind Taste Test
Drink Y Drink Z
Age
- 55 -
ANALYSIS
results of the blind taste test showed that the teenagers actually preferred the taste of Coca-
Cola, while the baby boomers preferred Pepsi. Finally, all of the age groups were more
positive towards Coca-Cola than Pepsi, which confirms the hypothesis to a certain extent, in
that the baby boomers preferred Coca-Cola on the whole.
H3: People aged eighteen and younger have the highest level of knowledge of brand
advertisement, hence they are more influenced by it in their choice of products than any other
age group.
This hypothesis was unconfirmed in that the eighteen and younger age group did not have the
highest level of knowledge of the brands’ advertisements. Moreover, the results indicated that
advertisement’s role in consumers’ choice of product did not vary among the age groups and
thus the hypothesis is not supported.
- 56 -
6. Conclusions
In the following chapter, we summarize our results and draw conclusions about our study. Furthermore, we present a modified analysis model, our own reflections as well as suggesting future research.
6.1 Research Question
In this chapter we intend to answer our research question:
To what extent do advertising, sponsorship, brand, and age affect consumer
preferences?
On basis of our analysis, we have drawn the following conclusion that advertising,
sponsorship, brand and age all affect consumer preferences to some extent, as will be
explained in the text below.
International advertising
We found that some consumers, who associate a brand with advertisement as well as having
actual knowledge about the brand’s ads, do indeed feel that their choice of product is to a
large degree influenced by brand advertisement. The use of a local market’s language in an
international campaign, on the other hand, has little effect on consumers’ choice of product;
whereas it was found that an English campaign has a greater influence on consumer
preferences. In addition, strong international brands that are often associated and recognized
for their extensive advertising campaigns, do not always imply that consumers actually know
of their campaigns. From this we can conclude that it is not as apparent as whether or not
advertising alone influences the buying process, as one would have assumed.
International sponsorship
Regarding international sponsorship, it can be concluded that of those who associate a brand
with sponsorship and at the same time know of what the brand sponsors, only a small
proportion of the consumers’ attitudes towards the sponsored product is influenced. However,
it can not be depicted whether it affects their attitude in a positive or negative way, and thus it
is difficult to define a clear relationship between the influenced attitude and consumer
preferences. Out of those consumers who have a positive opinion about a specific sponsored
event, only a few claim that their consumption of the sponsored brand is affected. Finally, it
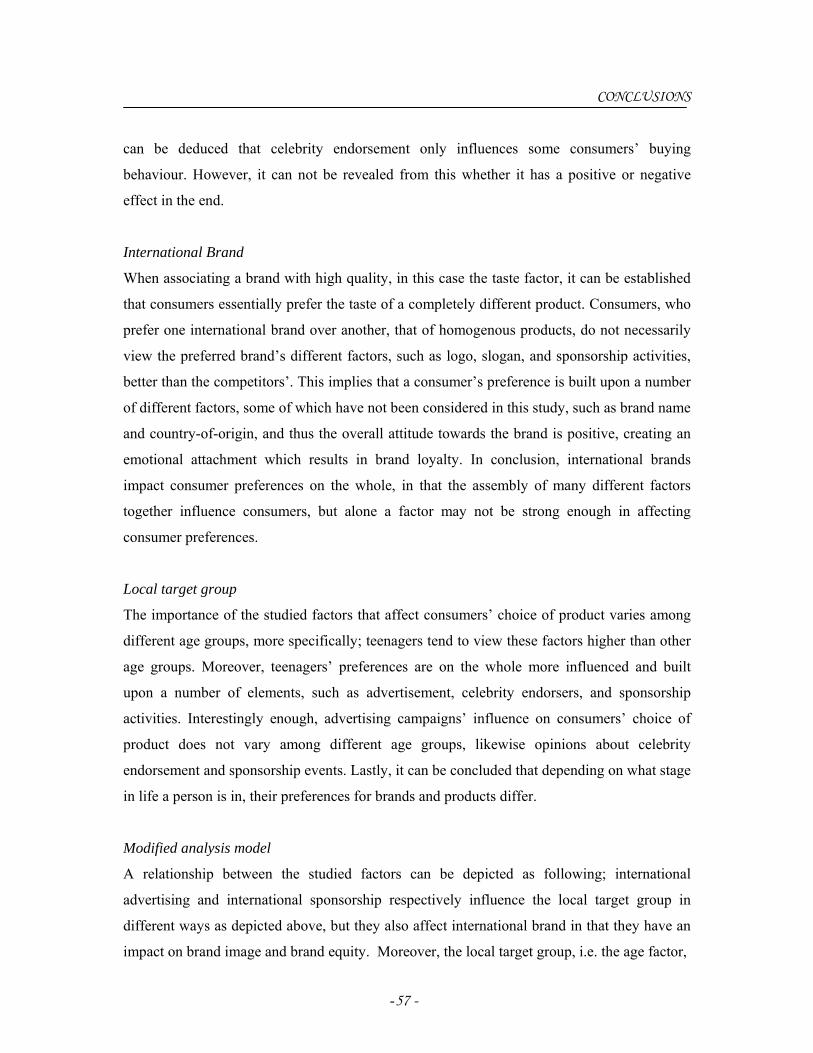
- 57 -
CONCLUSIONS
can be deduced that celebrity endorsement only influences some consumers’ buying
behaviour. However, it can not be revealed from this whether it has a positive or negative
effect in the end.
International Brand
When associating a brand with high quality, in this case the taste factor, it can be established
that consumers essentially prefer the taste of a completely different product. Consumers, who
prefer one international brand over another, that of homogenous products, do not necessarily
view the preferred brand’s different factors, such as logo, slogan, and sponsorship activities,
better than the competitors’. This implies that a consumer’s preference is built upon a number
of different factors, some of which have not been considered in this study, such as brand name
and country-of-origin, and thus the overall attitude towards the brand is positive, creating an
emotional attachment which results in brand loyalty. In conclusion, international brands
impact consumer preferences on the whole, in that the assembly of many different factors
together influence consumers, but alone a factor may not be strong enough in affecting
consumer preferences.
Local target group
The importance of the studied factors that affect consumers’ choice of product varies among
different age groups, more specifically; teenagers tend to view these factors higher than other
age groups. Moreover, teenagers’ preferences are on the whole more influenced and built
upon a number of elements, such as advertisement, celebrity endorsers, and sponsorship
activities. Interestingly enough, advertising campaigns’ influence on consumers’ choice of
product does not vary among different age groups, likewise opinions about celebrity
endorsement and sponsorship events. Lastly, it can be concluded that depending on what stage
in life a person is in, their preferences for brands and products differ.
Modified analysis model
A relationship between the studied factors can be depicted as following; international
advertising and international sponsorship respectively influence the local target group in
different ways as depicted above, but they also affect international brand in that they have an
impact on brand image and brand equity. Moreover, the local target group, i.e. the age factor,
- 58 -
CONCLUSIONS
views brands differently and thus have an effect on international brand alone, but also in
combination with international advertisement and international sponsorship. Finally, these
factors together influence the way in which a brand is perceived, and consequently influence
consumer preferences, which is illustrated in the diagram below.
From this study, it can be concluded that in order for international companies to be successful
and gain competitive advantage on the local market, it is vital that they implement a
combination of the studied factors in their marketing strategy so to best reach target groups.
More specifically, the strategies should be tailored in accordance to the target groups’ age,
seeing as consumer preferences vary depending on a person’s age. Lastly, although
advertising campaigns are still efficient in reminding and persuading consumers of brands and
products, companies must differentiate themselves in their messages and techniques, etc. as
advertisement clutter is at a rise.
6.2 Reflections
When we began working with this thesis we believed that consumers choose products on the
basis of quality, i.e. the taste. This turned out to be quite the opposite in that the majority of
the respondents did not choose their preferred brand in the blind taste test. Furthermore, we
had preconceived opinions about the effect Coca-Cola’s and Pepsi’s advertisements alone had
on consumers’ choice of product, and also that their advertising campaigns were more known
on the local market. However, our study not only proved that advertisement is much more
Consumer Preferences
International Brand
Local Target Group
International Sponsorship
International Advertisement
Figure 6.1; Modified Analysis Model
- 59 -
CONCLUSIONS
efficient in combination with other marketing factors, but it also demonstrated that the
majority of the consumers on the local market did not specifically know of the two
companies’ advertising campaigns.
6.3 Proposed Future Research
Investigating the chosen subject from a company perspective.
Study the relationship between the studied factors and other demographic variables,
such as gender, and how they together influence consumer preferences.
Seeing as little research has been done within the area of age and advertisement, an
interesting future study would be on how marketers can best tailor an advertising
campaign for different age groups. More specifically, which features appeal to each
age group the most?
- 60 -
8. References
Literature Aaker, D.A. 2005. Strategic market management. London: Simon & Schuster, cop. Aaker, D.A. 1991. Managing brand equity: capitalizing on the value of a brand name. New
York: Free press; Toronto: Maxwell Macmillan Canada; New York: Maxwell Macmillan International, cop.
Albaum, G., Strandskov, J. & Duerr, E. 2002. International marketing and export
management. Harlow: Prentice Hall Andersen, I. 1998. Den uppenbara verkligheten: val av samhällsvetenskaplig metod. Lund:
Studentlitteratur Armstrong, G. & Kotler, P. 2005. Marketing: An Introduction. New Jersey: Pearson
Education, Inc. Blackwell, R., Miniard, P. and Engel, J. 2001. Consumer Behaviour. Ohio: South-Western Czinkota, M.R. & Ronkainen, I.A. 2001. International marketing. Fort Worth, Tex. : Harcourt
College, cop. Halvorsen, K. 1992. Samhällsvetenskaplig metod. Lund: Studentlitteratur Hartley, R.F. 2001. Marketing mistakes and successes. New York: John Wiley & Sons, Inc Hollensen, S. 2001. Global marketing: a market-responsive approach. Harlow: Financial
Times Prentice Hall Jobber, D. 2004. Principles and practice of marketing. Maidenhead: McGraw-Hill, cop. Kotler, P.; Armstrong, G.; Saunders, J. & Wong, V. 2002. Principles of Marketing, Harlow,
England; Financial Times/Prentice-Hall Kotler, P.; Wong, V.; Saunders, J. & Armstrong, G. 2005. Principles of Marketing. Harlow:
Pearson Education Limited MacKenzie, I. 2004. English for Business Studies – A course for Business Studies and
Economics students. Cambridge, United Kingdom; Cambridge University Press Malhotra, N.K. (2004): Marketing research: an applied orientation. Upper Saddle River, NJ:
McGraw-Hill, cop. Nardi, P. 2003. Doing Survey Research- A Guide to Quantitative Methods. Boston: Pearson
Education Inc. Neuman, W. L. 2003. Social Research Methods- Qualitative and Quantitative Approaches.
Boston: Pearson Education Inc.
- 61 -
REFERENCES
Patel, R. & Davidsson, B. 1994. Forskningsmetodikens grunder – att planera, genomföra och
rapportera en undersökning. Lund: Studentlitteratur Peter, J.P. & Olson, J.C. 1994. Understanding consumer behavior. Burr Ridge, III.: Irwin,
cop. Ritchie, J. & Lewis, J. 2003. Qualitative research practice: a guide for social science students
and researchers. London: SAGE Ruane, J.M. 2005. Essentials of research methods: a guide to social science research.
Malden, MA: Blackwell Pub. Solomon, M.; Bamossy, G. & Askegaard, S. 2001. Consumer behaviour: a European
perspective. Harlow, England; New York: Financial Times/Prentice-Hall Yin, R.K. 2003. Case study research: design and methods. Thousand Oaks, Calif: Sage
Publications, cop. Articles Barnes, B.R.; Kitchen, P.J.; Spickett-Jones, G. & Yu, Q. 2004. Investigating the impact of
international cosmetics advertising in China. International Journal of Advertising 23: 361-387
Björn, W. 2003. An international review of sponsorship research: extension and update.
International Journal of Advertising 22: 5-40 Bush, A.J.; Martin, C.A. & Bush, V.D. 2004. Sports Celebrity Influence of the Behavioral
Intentions of Generation Y. Journal of Advertising Research 44: 108-118 Carrillat, F.A.; Lafferty, B.A. & Harris, E.G. 2005. Investigating sponsorship effectiveness.
Do less familiar brands have an advantage over more familiar brands have an advantage over more familiar brands in single and multiple sponsorship arrangements? Journal of Brand Management 13: 13p
Cornwell, T.B.; Roy, D.P. & Steinard II, E.A. 2001. Exploring manager’s perceptions of the
impact of sponsorship on brand equity. Journal of Advertising 30: 41-52 Dolphin, R.R. 2003. Sponsorship: perspectives on its strategic role. An International Journal
8:173-186 Erdogan, B.Z. 1999. Celebrity endorsement: a literature review. Journal of Marketing
Management 15: 24p Fahy, J.; Farrelly, F. & Quester, P. 2004. Competitive advantage through sponsorship: A
conceptual model and research propositions. European Journal of Marketing 38: 1013-1030
- 62 -
REFERENCES
FitzGerald, M. & Arnott, D. 1996. Understanding demographic effects on marketing
communications in services. International Journal of Service Industry Management 7: 31-45
Gwinner, K.P. & Eaton, J. 1999. Building brand image through event sponsorship: the role of
image transfer. Journal of Advertising 28:11p Harmon, H.H.; Webster, R.L. & Weyenberg, S. 1999. Marketing medium impact: differences
between baby boomers and generation Xers in their information search in a variety of purchase decision situations. Journal of Marketing Communications 5: 29-38
Harris, G., Attour, S. 2003. The international advertising practices of multinational
companies; A content analysis study. European Journal of Marketing. Volume 37, no.1/2: 154-168
Hsu, C. & McDonald, D. 2002. An examination on multiple celebrity endorsers in
advertising. Journal of Product & brand Management 11:19-30 Javalgi, R.G.; Traylor, M.B.; Gross, A.C. & Lampman, E. 1994. Awareness of sponsorship
and corporate image: an empirical investigation. Journal of Advertising 23: 12p Keller, K.L. 1993. Conceptualizing, measuring, managing customer-based brand equity.
Journal of Marketing 57: 22p Martinez, E. & Pina, J.M. 2003. The negative impact of brand extensions on parent brand
image. Journal of Product and Brand Management 12: 432-448 McCracken, G. 1989. Who is the Celebrity Endorser? Cultural Foundations of the
Endorsement Process. Journal of Consumer Research 16: 12p Pae, J.H., Samiee, S. & Tai, S. (2002), “The moderating role of brand familiarity and
execution style”, International Marketing Review, Vol. 19: 176-189 Polonsky, M.J. & Speed, R. 2001. Linking sponsorship and cause related marketing.
European Journal of Marketing 35: 1361-1385 Quester, P. & Farrelly, F. 1998. Brand association and memory decay effects of sponsorship:
the case of the Australian Formula One Grand Prix. Journal of Product & brand Management 7: 539-556
Roy, D.P. & Cornwell, T.B. 2003. Brand equity’s influence on responses to even
sponsorships. Journal of Product & Brand Management 12: 377-393 Royo-Vela, M. 2005. Emotional and Informational Content of Commericals: Visual and
Auditory Circumplex Spaces, Product Information and their Effects on Audience Evaluation. Journal of Current Issues & Research in Advertising 27: 13-38
Ruth, J.A. & Simonin, B.L. 2003. Brought to you by brand A and brand B. Journal of
Advertising 32: 19-30
- 63 -
REFERENCES
Taylor, C.R. & Okazaki, S. 2006. Who Standardizes Advertising More Frequenlty, and Why
Do They Do So? A Comparison of U.S. and Japanese Subsidiaries’ Advertising Practices in the European Union. Journal of International Marketing 14: 98-120
Till, B.D. & Shimp, T.A. 1998. Endorsers in advertising: the case of negative celebrity
information. Journal of Advertising 27: 67-83 Vrontis, D. & Kitchen P.J. 2005. Entry methods and international marketing decision making:
an empirical investigation. International Journal of Business Studies 13: 87-110 Wang, C.C. & Yun-Hsiou, Y. 2006. A Content Analysis of Taiwanese Television
Commercials Containing the Japanese Language. The Journal of American Academy of Business 8: 176-183
Internet http://business.enotes.com/business-finance-encyclopedia/advertising, 2006-04-08, 13.16 http://en.mimi.hu/marketingweb/lowinvolvement_products.html 2006-04-25, 14.12 http://encarta.msn.com/encyclopedia_761564279/Advertising.html 2006-04-04, 11.36 http://geoff.cox.free.fr/Docs/Text7.pdf 2006-04-10, 10.00 http://susning.nu/Pepsi 2006-04-12, 10.56 The Coca-Cola Company: www2.coca-cola.com/investors/form_10K_2005.html 2006-04-12, 11.54 www.coke.com.au/about_advert.asp Wikipedia, the free encyclopaedia: http://en.wikipedia.org/wiki/Cola_wars 2006-04-08, 13.46 http://sv.wikipedia.org/wiki/Pepsi 2006-04-12, 11.01 http://sv.wikipedia.org/wiki/Coca-cola 2006-04-12, 11.00
www.economist.com/business/displaystory.cfm?story_id=2787854 2006-04-09, 9.06 www.geocities.com/colacentury/ 2006-04-08, 14.15 www.louisville.edu/~rljohn10/pepsi.html 2006-04-11, 16.50 www.marketwatch.com/News/Story/Story.aspx?guid=%7B943CBB2D-9AAC-4DAA-A928-5B5A8D74E3BE%7D&siteid=mktw 2006-04-04, 10.15 www.mind-advertising.com/advertiser_index.htm 2006-04-09, 10.06 www.pepsi.com/help/faqs/faq.php?category=ads_and_history&page=highlights 2006-04-12, 11.52

- 64 -
REFERENCES
www.thegredecompany.com/docs/Rising%20Above%20Advertising%20Clutter.pdf 2006-04-10, 09.45
APPENDIX 1
Appendix 1: The Coca-Cola Company
“The Coca-Cola Company exists to benefit and refresh everyone it touches”
(www.cocacola.com), and is the world leading producer of non-alcoholic beverage
concentrates and syrups; operating in more than 200 countries worldwide (Ibid). The
company entered the Swedish market in 1953 and initially had production at different
breweries around the country. In 1996, Coca-Cola Drycker AB was founded and today, all of
the company’s manufacturing for the Swedish market takes place at the factory in Jordbro,
Sweden (http://sv.wikipedia.org).
Most of the company’s success is due to their marketing and they spent as much as 2.5 billion
dollars on advertising in 2005 (www2.coca-cola.com). The organization uses real-to-life
scenarios in their advertisement rather than celebrities, and one example of such is the
following: “Six weeks before their high school graduation, five teenagers rest on a subway
train after an exciting night at a concert. A young man observes his sleeping friends while
holding a can of Coca-Cola firmly in one hand and narrates, “…It hit me, that was the best
night of my life. And I kind of wished we could all stay on that train forever.” A soothing
woman’s voice then sings in the background, “Life tastes good, Coca-Cola” as the camera
directs the viewer’s attention not at the teenagers, but to a moving subway train and the name
Coca-Cola in the lower right hand corner of the screen” (www.louisville.edu). The idea with
this is that every person can relate to the feeling described above, at least once in their
lifetime. Thus, the aim of Coca-Cola’s advertising is that each time a consumer is encountered
with an emotional and pleasant situation, they automatically think of Coca-Cola (Ibid).
Some of Coca-Cola’s slogans used during the last decades:
2003- “Real”
2002- “All the world Loves a coke”
2001- “Life Tastes Good”
2000- “Enjoy”
1993- “Always Coca-Cola”
1989- “You can’t beat the real thing”
(http://sv.wikipedia.org)
APPENDIX 2
Appendix 2: PepsiCo
PepsiCo operates in 200 countries around the world, and has been present on the Swedish
market since the 1960s (www.susning.se). The production for the Swedish market is since the
year of 2000 controlled by Carlsberg Sverige and is carried out at their breweries.
(http://sv.wikipedia.org).
Pepsi and Coca-Cola are arch-rivals, and as opposed to Coca-Cola, Pepsi has put a lot of
effort into using celebrity endorsement in their advertising in order to gain the attention of all
groups of consumers, and in 2004, advertisement spending amounted to 1.3 billions in 2005
(www.mind-advertising.com). Moreover, it has been claimed that “Pepsi was the first
consumer product to use a celebrity endorser when Barney Oldfield, auto racing pioneer,
appear[ed] in ads in 1909” (www.louisville.edu), and has since employed a number of
different celebrities in its advertising campaings. Examples of celebrities that have been used
are David Beckham, Britney Spears, Jennifer Lopez, Halle Barry and Jackie Chan.
(http://en.wikipedia.org). A resent example for a Pepsi advertisement is the “Now and Then”
commercial featuring Britney Spears as she sings “Pepsi, for those who think young” and in
order to solve the problem of reaching young as well as old consumers by “show[ing] Britney
in the ‘60s and the ’00s and give[ing] the generations something to bond over”
(www.louisville.edu). Pepsi uses this advertisement in order to reach a broad variety of
consumers’ through employing an icon of today’s music industry with a range of different
generations, and thus communicating that everyone benefits from the “joy of Pepsi” (ibid).
Some of the campaigns that Pepsi has carried out during the last decades:
2003- "Pepsi. It's the Cola"
2001- "The Joy of Pepsi", Britney Spears
1999- "The Joy of Cola", Marlon Brando, Aretha Franklin
1996- "Nothing Else Is A Pepsi”
1993- "Be Young, Have Fun, Drink Pepsi", Shaquille O'Neal
1989- "The Choice of A New Generation"
(www.pepsi.com)
APPENDIX 3
Appendix 3: The Cola War
“Intense competition between Pepsi and Coca-Cola has characterized the soft-drink industry
for decades. If anything could be called a “war” outside of actual bloodshed, this was it”
(Hartley 2001, p. 11). The Cola war refers to Coca-Cola’s and Pepsi’s mutually-targeted
television advertising campaigns in the 1980s, which started with blind taste tests on
consumers with the aim of testing whether people preferred one product over the other, and
continued with the use of famous spokespersons in promotion of their products
(http://en.wikipedia.org).
Coca-Cola was introduced to the market in 1886 and was shortly followed by Pepsi in 1898.
Coca-Cola dominated on the market for years, and Pepsi was not a threat. However, when the
market expanded and became more profitable, the role of professional advertising became
crucial, these two multi-national soda producers have been leading the way in advertising ever
since. However, they have taken two extremely different turns in their advertising, where
Pepsi has turned more to celebrity endorsement, popular music and young people in their
commercials, while Coca-Cola advocates tradition and nationalism, aiming at happiness and
togetherness similar to that of their original approach. More precisely, Pepsi’s strategy
adduces the new and Coca-Cola’s the old (www.geocities.com). However, television
advertising is not exclusively used, but they also have unique product packaging.
The Cola war makes it possible for new edgy advertising techniques to be broadcasted in
television commercials, and although the two companies use very different marketing
strategies, they are both successful in selling their products (Ibid). Interestingly enough,
despite the fact that Pepsi has increased its sales four times quicker than that of its rival, Coca-
Cola remains the leading seller. The battle between these two will undoubtedly prolong the
cola war, but at the same time bring forth new advertising techniques. “Pepsi uses excellent
marketing strategies, such as celebrity appearances and contemporary product packaging, to
sell their product, whereas Coca-Cola’s realistic approach has placed them at the top of the
soft drink industry. Although Pepsi is “simply irresistible”, according to the soda loving
customers, it is “always Coca-Cola, Yeah” (Ibid).
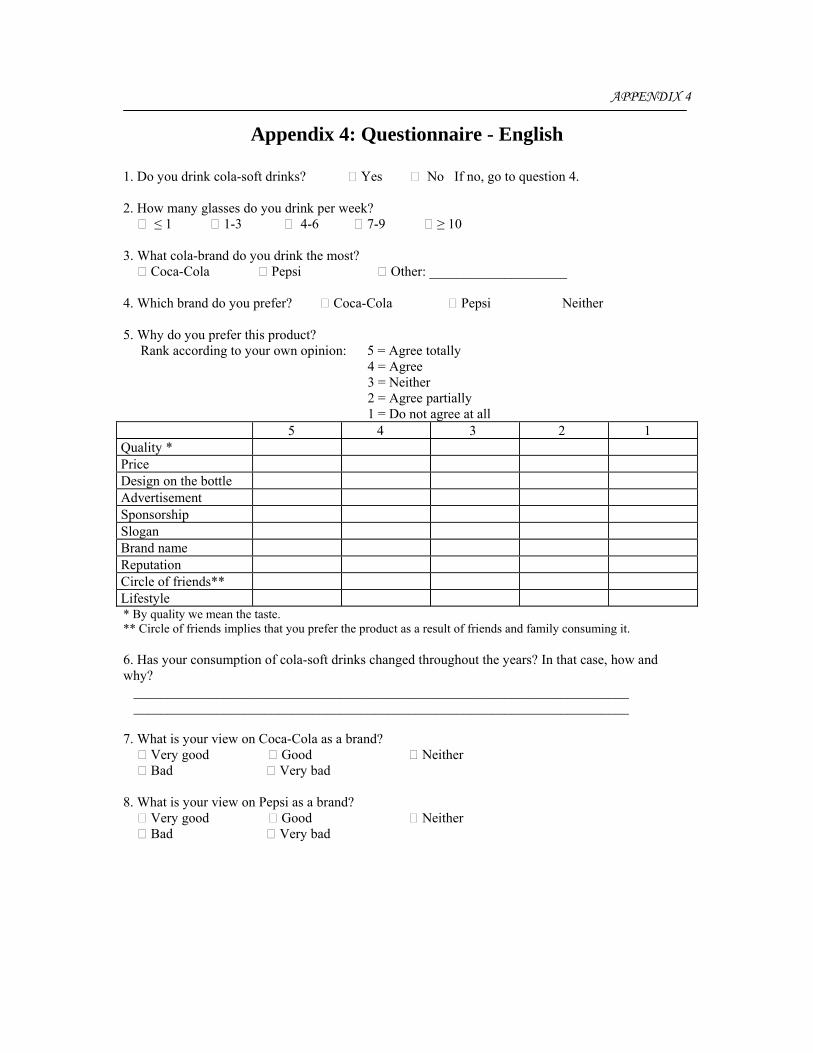
APPENDIX 4
Appendix 4: Questionnaire - English
1. Do you drink cola-soft drinks? Yes No If no, go to question 4. 2. How many glasses do you drink per week? ≤ 1 1-3 4-6 7-9 ≥ 10 3. What cola-brand do you drink the most? Coca-Cola Pepsi Other: ____________________ 4. Which brand do you prefer? Coca-Cola Pepsi Neither 5. Why do you prefer this product? Rank according to your own opinion: 5 = Agree totally 4 = Agree 3 = Neither 2 = Agree partially 1 = Do not agree at all 5 4 3 2 1 Quality * Price Design on the bottle Advertisement Sponsorship Slogan Brand name Reputation Circle of friends** Lifestyle * By quality we mean the taste. ** Circle of friends implies that you prefer the product as a result of friends and family consuming it. 6. Has your consumption of cola-soft drinks changed throughout the years? In that case, how and why? ________________________________________________________________________ ________________________________________________________________________ 7. What is your view on Coca-Cola as a brand? Very good Good Neither Bad Very bad 8. What is your view on Pepsi as a brand? Very good Good Neither Bad Very bad
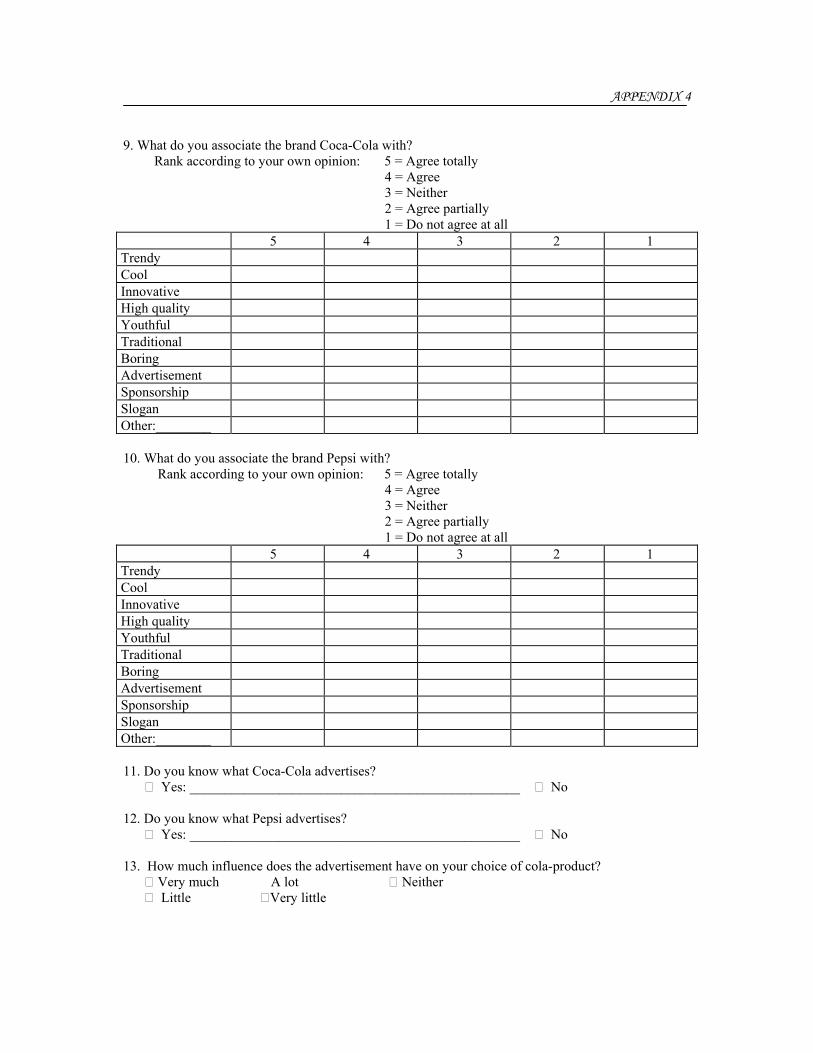
APPENDIX 4 9. What do you associate the brand Coca-Cola with? Rank according to your own opinion: 5 = Agree totally 4 = Agree 3 = Neither 2 = Agree partially 1 = Do not agree at all 5 4 3 2 1 Trendy Cool Innovative High quality Youthful Traditional Boring Advertisement Sponsorship Slogan Other:________ 10. What do you associate the brand Pepsi with? Rank according to your own opinion: 5 = Agree totally 4 = Agree 3 = Neither 2 = Agree partially 1 = Do not agree at all 5 4 3 2 1 Trendy Cool Innovative High quality Youthful Traditional Boring Advertisement Sponsorship Slogan Other:________ 11. Do you know what Coca-Cola advertises? Yes: ________________________________________________ No 12. Do you know what Pepsi advertises? Yes: ________________________________________________ No 13. How much influence does the advertisement have on your choice of cola-product? Very much A lot Neither Little Very little
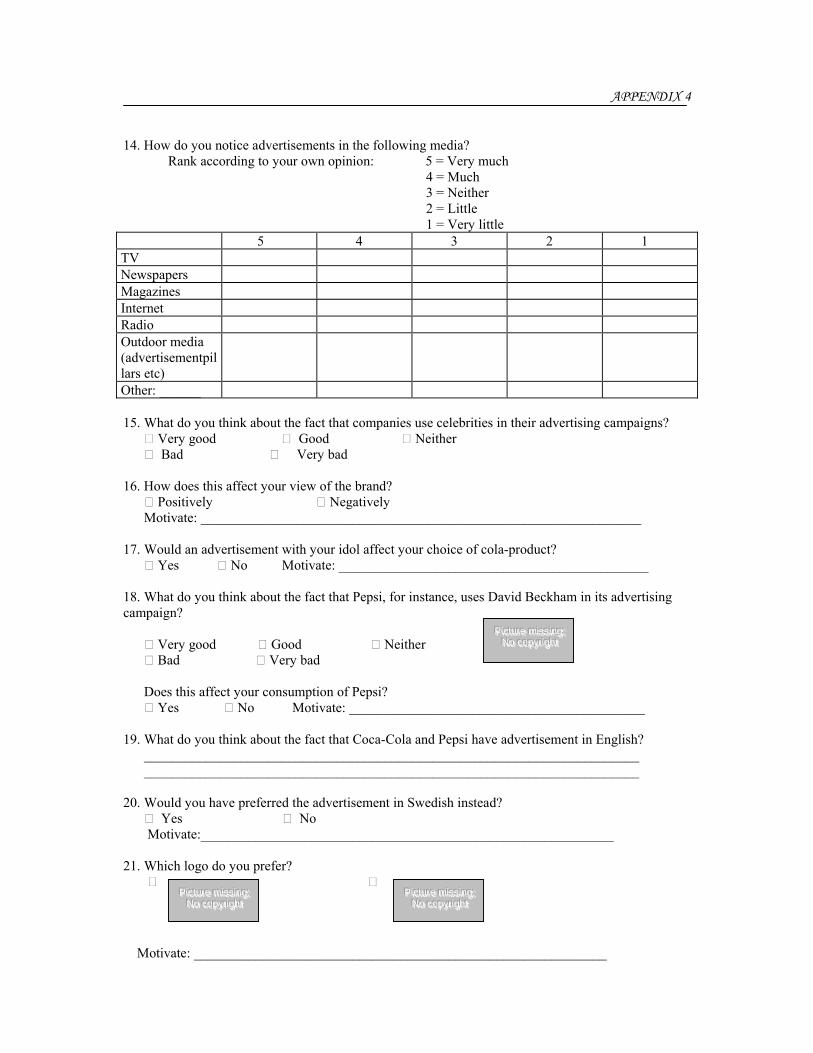
APPENDIX 4 14. How do you notice advertisements in the following media? Rank according to your own opinion: 5 = Very much 4 = Much 3 = Neither 2 = Little 1 = Very little 5 4 3 2 1 TV Newspapers Magazines Internet Radio Outdoor media (advertisementpillars etc)
Other: ______ 15. What do you think about the fact that companies use celebrities in their advertising campaigns? Very good Good Neither Bad Very bad 16. How does this affect your view of the brand? Positively Negatively Motivate: ________________________________________________________________ 17. Would an advertisement with your idol affect your choice of cola-product? Yes No Motivate: _____________________________________________ 18. What do you think about the fact that Pepsi, for instance, uses David Beckham in its advertising campaign?
Very good Good Neither Bad Very bad Does this affect your consumption of Pepsi? Yes No Motivate: ___________________________________________ 19. What do you think about the fact that Coca-Cola and Pepsi have advertisement in English? ________________________________________________________________________ ________________________________________________________________________ 20. Would you have preferred the advertisement in Swedish instead? Yes No Motivate:____________________________________________________________ 21. Which logo do you prefer?
Motivate: ____________________________________________________________
PPPiii ccc tttuuu rrreee mmmiii ssssss iii nnnggg ;;; NNNooo cccoooppp yyyrrr iii ggghhh ttt
PPPiii ccc ttt uuurrreee mmmiii ssssss iii nnnggg;;; NNNooo cccooopppyyyrrr iii ggghhhttt
PPPiii ccc tttuuu rrreee mmmiii ssssss iii nnnggg ;;; NNNooo cccoooppp yyyrrr iii ggghhh ttt
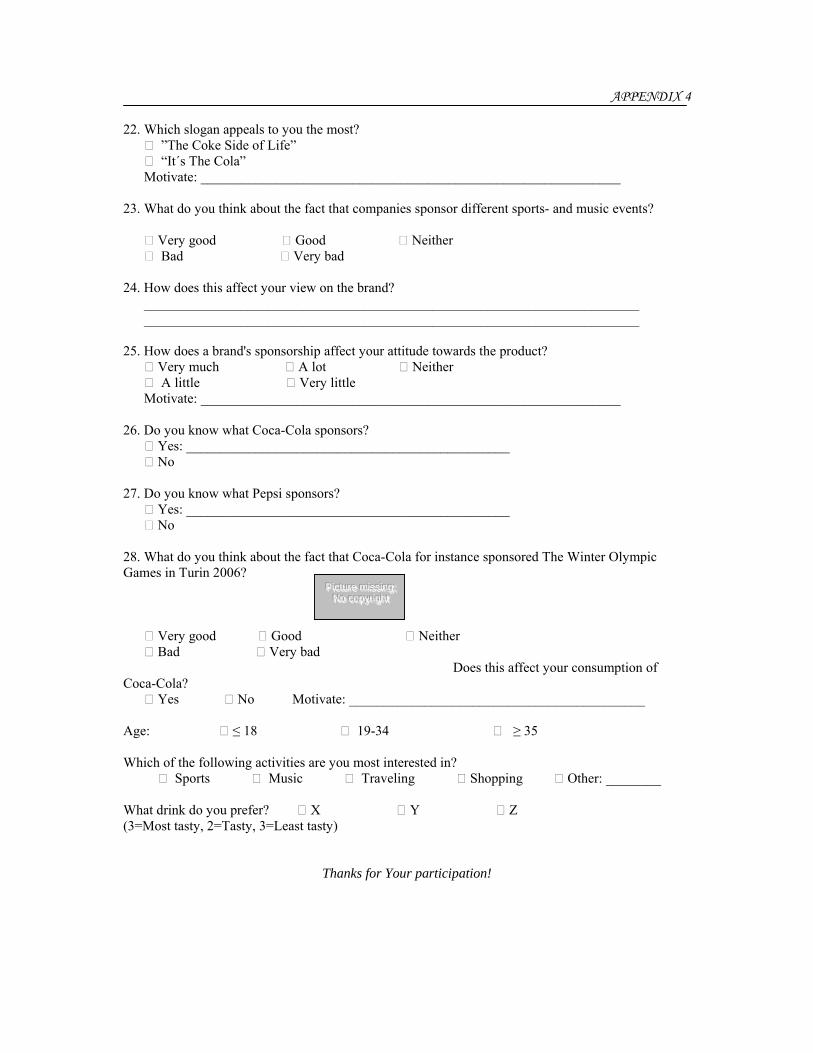
APPENDIX 4 22. Which slogan appeals to you the most? ”The Coke Side of Life” “It´s The Cola” Motivate: _____________________________________________________________ 23. What do you think about the fact that companies sponsor different sports- and music events? Very good Good Neither Bad Very bad 24. How does this affect your view on the brand? ________________________________________________________________________ ________________________________________________________________________ 25. How does a brand's sponsorship affect your attitude towards the product? Very much A lot Neither A little Very little Motivate: _____________________________________________________________ 26. Do you know what Coca-Cola sponsors? Yes: _______________________________________________ No 27. Do you know what Pepsi sponsors? Yes: _______________________________________________ No 28. What do you think about the fact that Coca-Cola for instance sponsored The Winter Olympic Games in Turin 2006? Very good Good Neither Bad Very bad Does this affect your consumption of Coca-Cola? Yes No Motivate: ___________________________________________ Age: ≤ 18 19-34 ≥ 35 Which of the following activities are you most interested in? Sports Music Traveling Shopping Other: ________ What drink do you prefer? X Y Z (3=Most tasty, 2=Tasty, 3=Least tasty)
Thanks for Your participation!
PPPiii ccc ttt uuurrreee mmmiii ssssss iii nnnggg ;;; NNNooo cccoooppp yyyrrr iii ggghhh ttt
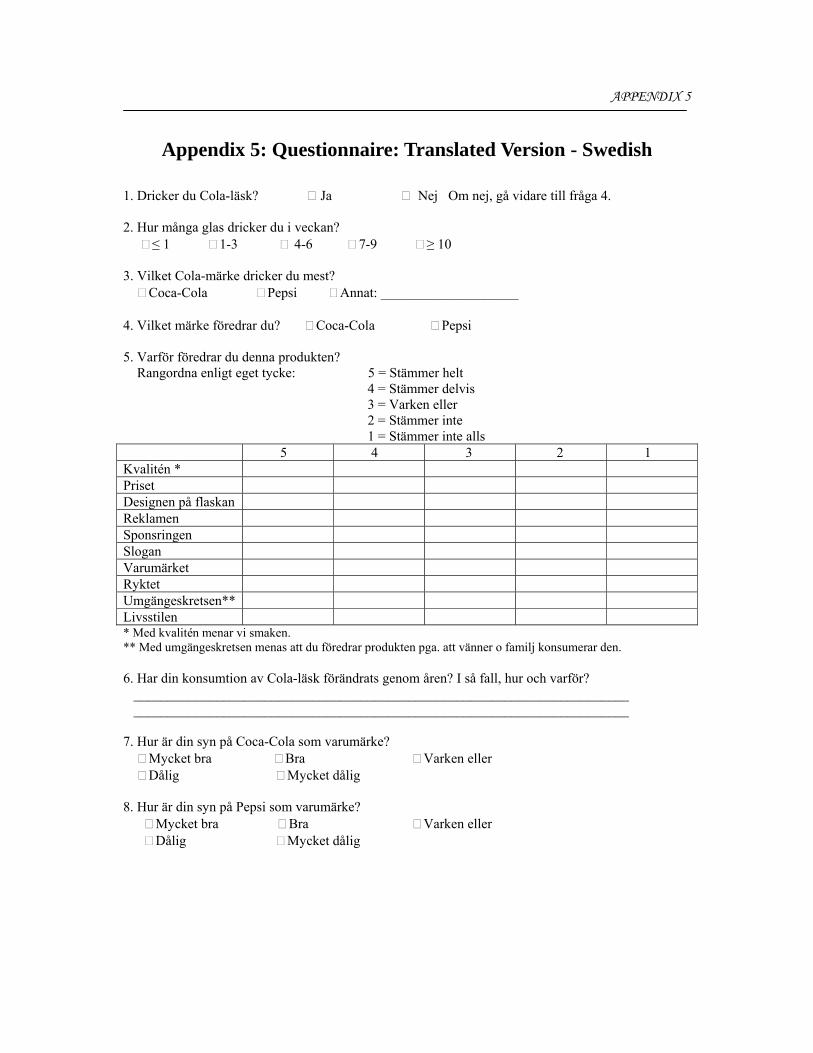
APPENDIX 5
Appendix 5: Questionnaire: Translated Version - Swedish
1. Dricker du Cola-läsk? Ja Nej Om nej, gå vidare till fråga 4. 2. Hur många glas dricker du i veckan? ≤ 1 1-3 4-6 7-9 ≥ 10 3. Vilket Cola-märke dricker du mest? Coca-Cola Pepsi Annat: ____________________ 4. Vilket märke föredrar du? Coca-Cola Pepsi 5. Varför föredrar du denna produkten? Rangordna enligt eget tycke: 5 = Stämmer helt 4 = Stämmer delvis 3 = Varken eller 2 = Stämmer inte 1 = Stämmer inte alls 5 4 3 2 1 Kvalitén * Priset Designen på flaskan Reklamen Sponsringen Slogan Varumärket Ryktet Umgängeskretsen** Livsstilen * Med kvalitén menar vi smaken. ** Med umgängeskretsen menas att du föredrar produkten pga. att vänner o familj konsumerar den. 6. Har din konsumtion av Cola-läsk förändrats genom åren? I så fall, hur och varför? ________________________________________________________________________ ________________________________________________________________________ 7. Hur är din syn på Coca-Cola som varumärke? Mycket bra Bra Varken eller Dålig Mycket dålig 8. Hur är din syn på Pepsi som varumärke? Mycket bra Bra Varken eller Dålig Mycket dålig
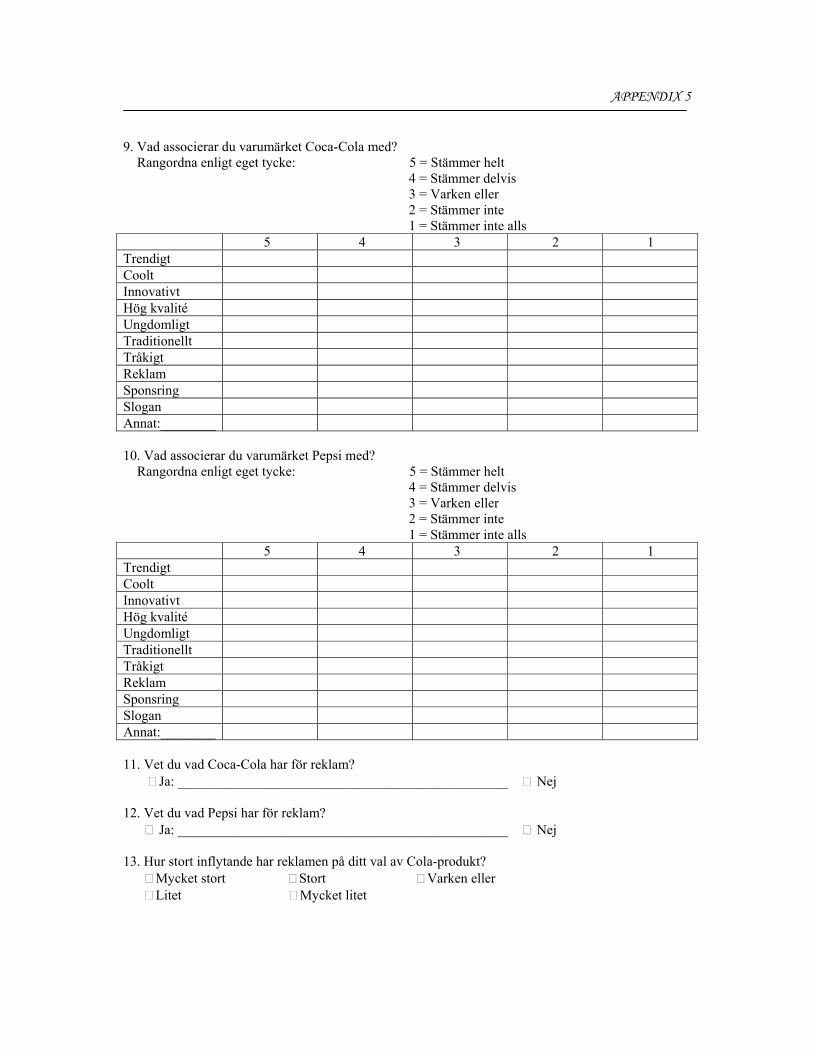
APPENDIX 5 9. Vad associerar du varumärket Coca-Cola med? Rangordna enligt eget tycke: 5 = Stämmer helt 4 = Stämmer delvis 3 = Varken eller 2 = Stämmer inte 1 = Stämmer inte alls 5 4 3 2 1 Trendigt Coolt Innovativt Hög kvalité Ungdomligt Traditionellt Tråkigt Reklam Sponsring Slogan Annat:________ 10. Vad associerar du varumärket Pepsi med? Rangordna enligt eget tycke: 5 = Stämmer helt 4 = Stämmer delvis 3 = Varken eller 2 = Stämmer inte 1 = Stämmer inte alls 5 4 3 2 1 Trendigt Coolt Innovativt Hög kvalité Ungdomligt Traditionellt Tråkigt Reklam Sponsring Slogan Annat:________ 11. Vet du vad Coca-Cola har för reklam? Ja: ________________________________________________ Nej 12. Vet du vad Pepsi har för reklam? Ja: ________________________________________________ Nej 13. Hur stort inflytande har reklamen på ditt val av Cola-produkt? Mycket stort Stort Varken eller Litet Mycket litet
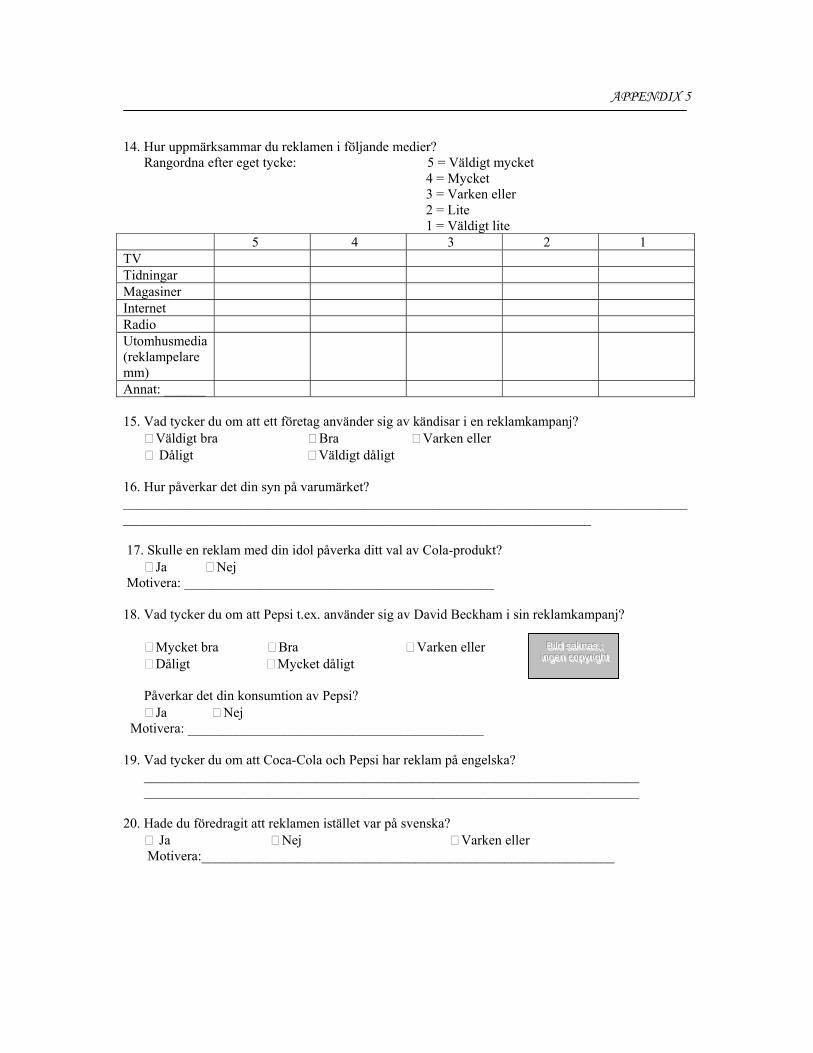
APPENDIX 5 14. Hur uppmärksammar du reklamen i följande medier? Rangordna efter eget tycke: 5 = Väldigt mycket 4 = Mycket 3 = Varken eller 2 = Lite 1 = Väldigt lite 5 4 3 2 1 TV Tidningar Magasiner Internet Radio Utomhusmedia (reklampelare mm)
Annat: ______ 15. Vad tycker du om att ett företag använder sig av kändisar i en reklamkampanj? Väldigt bra Bra Varken eller Dåligt Väldigt dåligt 16. Hur påverkar det din syn på varumärket? ______________________________________________________________________________________________________________________________________________________ 17. Skulle en reklam med din idol påverka ditt val av Cola-produkt? Ja Nej Motivera: _____________________________________________ 18. Vad tycker du om att Pepsi t.ex. använder sig av David Beckham i sin reklamkampanj? Mycket bra Bra Varken eller Dåligt Mycket dåligt Påverkar det din konsumtion av Pepsi? Ja Nej Motivera: ___________________________________________ 19. Vad tycker du om att Coca-Cola och Pepsi har reklam på engelska? ________________________________________________________________________ ________________________________________________________________________ 20. Hade du föredragit att reklamen istället var på svenska? Ja Nej Varken eller Motivera:____________________________________________________________
BBBiii lll ddd sssaaakkknnnaaasss ,,, ;;; iii nnngggeeennn cccoooppp yyyrrr iii ggghhh ttt
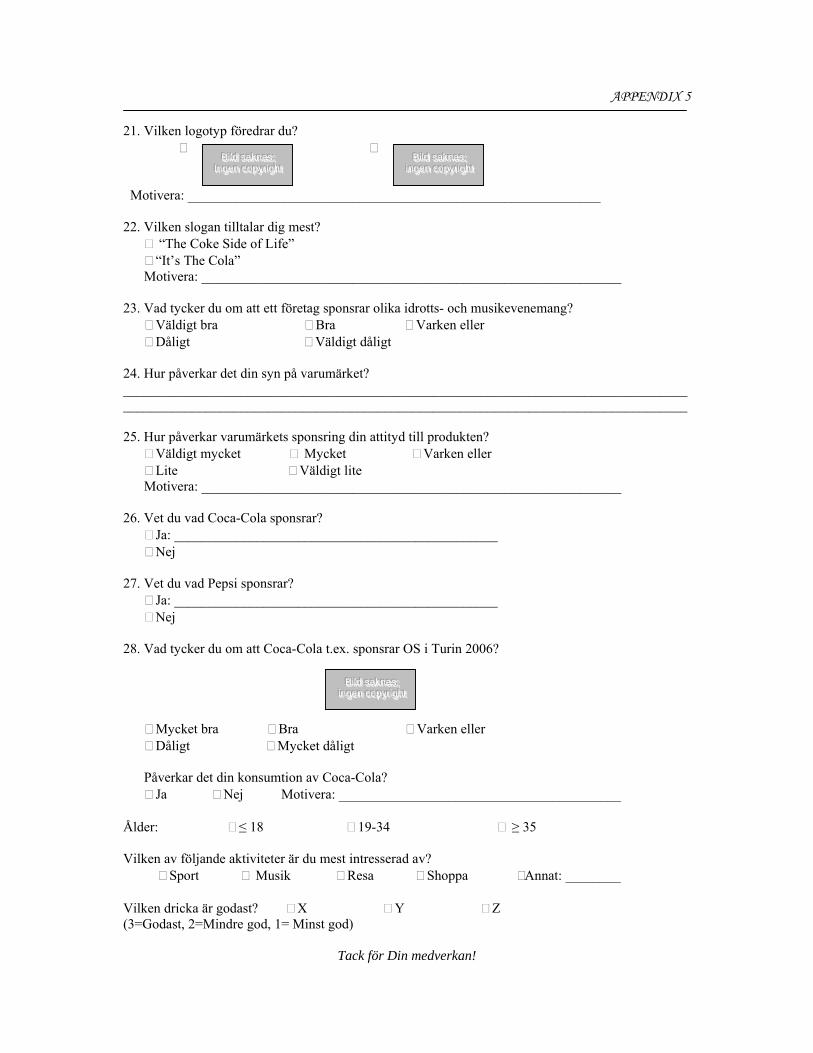
APPENDIX 5 21. Vilken logotyp föredrar du? Motivera: ____________________________________________________________ 22. Vilken slogan tilltalar dig mest? “The Coke Side of Life” “It’s The Cola” Motivera: _____________________________________________________________ 23. Vad tycker du om att ett företag sponsrar olika idrotts- och musikevenemang? Väldigt bra Bra Varken eller Dåligt Väldigt dåligt 24. Hur påverkar det din syn på varumärket? ____________________________________________________________________________________________________________________________________________________________________ 25. Hur påverkar varumärkets sponsring din attityd till produkten? Väldigt mycket Mycket Varken eller Lite Väldigt lite Motivera: _____________________________________________________________ 26. Vet du vad Coca-Cola sponsrar? Ja: _______________________________________________ Nej 27. Vet du vad Pepsi sponsrar? Ja: _______________________________________________ Nej 28. Vad tycker du om att Coca-Cola t.ex. sponsrar OS i Turin 2006? Mycket bra Bra Varken eller Dåligt Mycket dåligt Påverkar det din konsumtion av Coca-Cola? Ja Nej Motivera: _________________________________________ Ålder: ≤ 18 19-34 ≥ 35 Vilken av följande aktiviteter är du mest intresserad av? Sport Musik Resa Shoppa Annat: ________ Vilken dricka är godast? X Y Z (3=Godast, 2=Mindre god, 1= Minst god)
Tack för Din medverkan!
BBBiii lll ddd sssaaakkknnnaaasss ;;; IIInnngggeeennn cccoooppp yyyrrr iii ggghhh ttt
BBBiii lll ddd sssaaakkknnnaaasss ;;; iii nnngggeeennn cccooopppyyyrrr iii ggghhh ttt
BBBiii lll ddd sssaaakkknnnaaasss ;;; iii nnngggeeennn cccooopppyyyrrr iii ggghhhttt
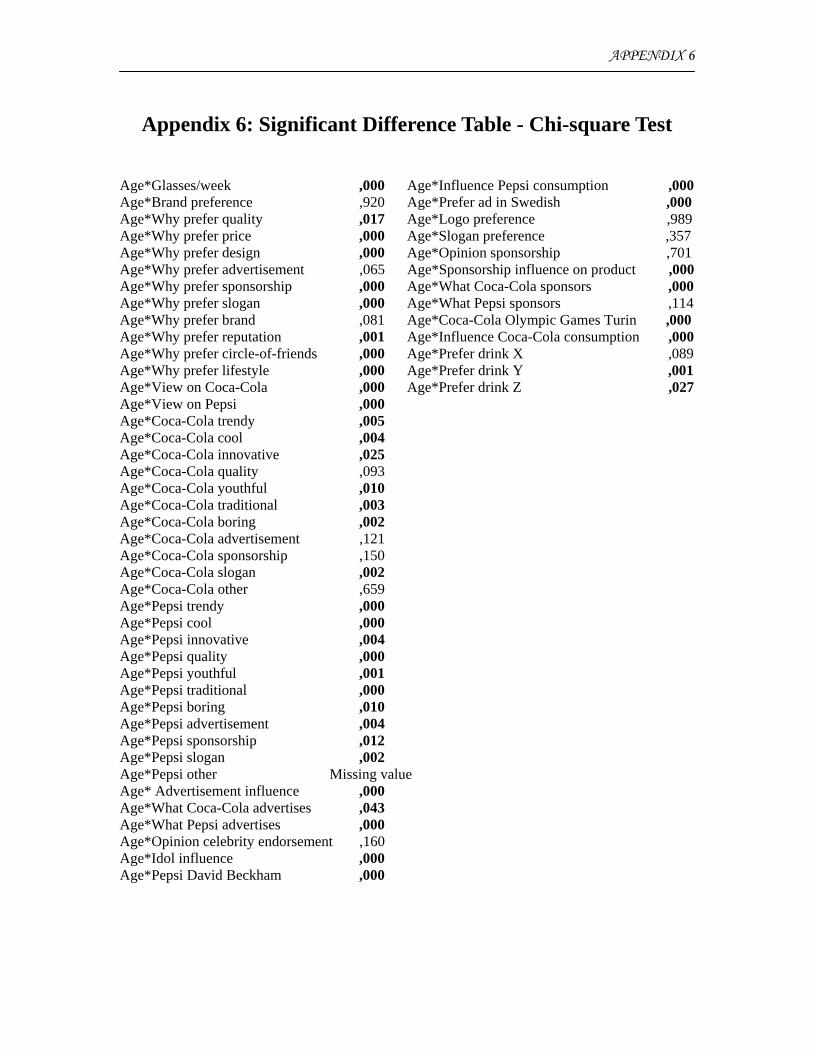
APPENDIX 6
Appendix 6: Significant Difference Table - Chi-square Test Age*Glasses/week ,000 Age*Influence Pepsi consumption ,000 Age*Brand preference ,920 Age*Prefer ad in Swedish ,000 Age*Why prefer quality ,017 Age*Logo preference ,989 Age*Why prefer price ,000 Age*Slogan preference ,357 Age*Why prefer design ,000 Age*Opinion sponsorship ,701 Age*Why prefer advertisement ,065 Age*Sponsorship influence on product ,000 Age*Why prefer sponsorship ,000 Age*What Coca-Cola sponsors ,000 Age*Why prefer slogan ,000 Age*What Pepsi sponsors ,114 Age*Why prefer brand ,081 Age*Coca-Cola Olympic Games Turin ,000 Age*Why prefer reputation ,001 Age*Influence Coca-Cola consumption ,000 Age*Why prefer circle-of-friends ,000 Age*Prefer drink X ,089 Age*Why prefer lifestyle ,000 Age*Prefer drink Y ,001 Age*View on Coca-Cola ,000 Age*Prefer drink Z ,027 Age*View on Pepsi ,000 Age*Coca-Cola trendy ,005 Age*Coca-Cola cool ,004 Age*Coca-Cola innovative ,025 Age*Coca-Cola quality ,093 Age*Coca-Cola youthful ,010 Age*Coca-Cola traditional ,003 Age*Coca-Cola boring ,002 Age*Coca-Cola advertisement ,121 Age*Coca-Cola sponsorship ,150 Age*Coca-Cola slogan ,002 Age*Coca-Cola other ,659 Age*Pepsi trendy ,000 Age*Pepsi cool ,000 Age*Pepsi innovative ,004 Age*Pepsi quality ,000 Age*Pepsi youthful ,001 Age*Pepsi traditional ,000 Age*Pepsi boring ,010 Age*Pepsi advertisement ,004 Age*Pepsi sponsorship ,012 Age*Pepsi slogan ,002 Age*Pepsi other Missing value Age* Advertisement influence ,000 Age*What Coca-Cola advertises ,043 Age*What Pepsi advertises ,000 Age*Opinion celebrity endorsement ,160 Age*Idol influence ,000 Age*Pepsi David Beckham ,000


