
From: Cason, Elizabeth A.To: Boparai, Poonam; Slovick, MarkCc: Patrick BROWN ([email protected]); Rosenbaum, S. Wayne; Waterman, Ryan R.; Jason Paukovits
([email protected]); Page, Michael (EDAW) ([email protected])Subject: Rugged Solar Project updated GHG report, AB 900Date: Monday, February 11, 2013 1:36:08 PMAttachments: 11280175 Rugged GHG Tech Study - 2-8-12.pdf
11280175 Rugged GHG Tech Study - 2-8-12.docSoitec Solar Energy Project comments - Response Matrix final.docx
Poonam and Mark, attached please find the revised GHG Technical Study for the Rugged SolarProject per comments received. We have attached a word document in strike-out/underline, as wellas a clean PDF and response to comment table (you previously received the comment table alongwith the Tierra del Sol submission on Friday). Please let me know if you have any questions orcomments, and thanks so much for your assistance. Best regards,Elizabeth Cason
Elizabeth A. CasonSTOEL RIVES LLP | 12255 El Camino Real | San Diego, CA 92130-2037Phone: (858) 794-4115 | Cell: (858) 602-9392 | Fax: (858) [email protected] | www.stoel.com

1
Soitec Solar Boulevard, CA Projects Responses to California Air Resources Board (CARB) Comments
CARB Comment Soitec Response Need to bolster methodology descriptions—including clearly identifying assumptions and basis of assumptions.
Additional assumptions were more clearly described in the document and all other assumptions are included in the Appendix including equipment, travel distances and construction schedule details.
Application does not address hydrofluorocarbons (HFCs) or perfluorocarbons (PFCs)
HFCs and PFCs are not typically estimated for a project of this nature. HFCs are often used as refrigerants for automotive and residential and commercial air conditioning units. The extent of loss of HFCs from project vehicles and building air conditioning would be speculative, but they would be emitted in minimal amounts for a project such as this. PFCs are generally associated with specific industrial uses, such as semiconductor manufacturing, and not expected to be associated with the proposed project. The current emission estimation models such as California Emissions Estimator Model (CalEEMod) do not estimate these emissions.
Generation appears to assume to displace electricity from SDG&E, but didn’t identify if Project has contract with SDG&E. Nor, if the project is to replace future growth or displace current resources.
The project would provide solar-generated energy to a SDG&E substation where the energy can be distributed to consumers. For the purpose of this analysis, the CO2 emissions for SDG&E’s overall power generation mix were used to estimate the CO2 emissions from fossil-fuel-generated electricity.

2
CARB Rugged Comments Soitec - Rugged Comment
Responses CARB Tierra del Sol Comments Soitec - Tierra del Sol Comment
Responses CO2 only, no other pollutants appear to have been evaluated except for in water usage. App states the CH4 and N2O small compare to CO2
CH4 and N2O emissions are not calculated as part of the URBEMIS or Road Construction Emissions model. Emission estimates calculated using Excel spreadsheets do include emissions for CH4 and N2O, where emission factors are readily available. The maximum estimate for CH4 and N2O would be between 3% and 5% of the total emissions for the project and would not change the findings of the GHG report.
Evaluated CO2, CH4, and N2O for all combustion sources
N/A
Energy – using projected SDG&E 2020 forecast factor based on 2009 data, which skews emissions low
See Tierra Del Sol response. Based on SDG&E 2010 data for 33% renewables
The SDG&E data are for 2008. The intent of the adjustment was to estimate the GHG emissions from electrical generation in 2020. The San Diego County reviewer found that approach to be acceptable.
Includes emissions from wastewater treatment
N/A Didn’t address Minor emissions from wastewater treatment (septic tank) now included.
3
CARB Rugged Comments Soitec - Rugged Comment
Responses CARB Tierra del Sol Comments Soitec - Tierra del Sol Comment
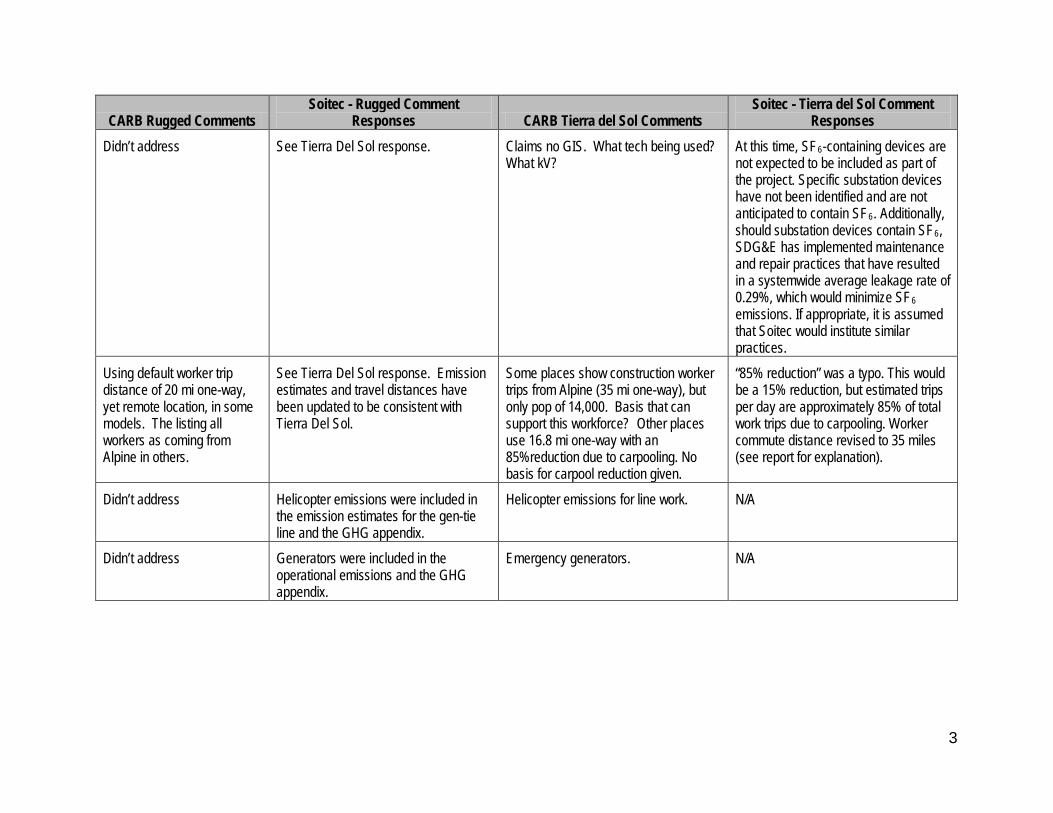
Responses Didn’t address See Tierra Del Sol response. Claims no GIS. What tech being used?
What kV? At this time, SF6-containing devices are not expected to be included as part of the project. Specific substation devices have not been identified and are not anticipated to contain SF6. Additionally, should substation devices contain SF6, SDG&E has implemented maintenance and repair practices that have resulted in a systemwide average leakage rate of 0.29%, which would minimize SF6 emissions. If appropriate, it is assumed that Soitec would institute similar practices.
Using default worker trip distance of 20 mi one-way, yet remote location, in some models. The listing all workers as coming from Alpine in others.
See Tierra Del Sol response. Emission estimates and travel distances have been updated to be consistent with Tierra Del Sol.
Some places show construction worker trips from Alpine (35 mi one-way), but only pop of 14,000. Basis that can support this workforce? Other places use 16.8 mi one-way with an 85%reduction due to carpooling. No basis for carpool reduction given.
“85% reduction” was a typo. This would be a 15% reduction, but estimated trips per day are approximately 85% of total work trips due to carpooling. Worker commute distance revised to 35 miles (see report for explanation).
Didn’t address Helicopter emissions were included in the emission estimates for the gen-tie line and the GHG appendix.
Helicopter emissions for line work. N/A
Didn’t address Generators were included in the operational emissions and the GHG appendix.
Emergency generators. N/A

4
CARB Rugged Comments Soitec - Rugged Comment
Responses CARB Tierra del Sol Comments Soitec - Tierra del Sol Comment
Responses Project location listed as in SCAQMD, what other inputs weren’t updated?
URBEMIS does not include an option to estimate emissions for San Diego County. South Coast AQMD is the most representative area in that model. San Diego County was used when emission factors were available (e.g., EMFAC 2011).
N/A N/A
Building construction has no worker trip emissions, yet the coating of it does
Emissions related to worker trips were not calculated in URBEMIS; thus, those emissions were zero. Worker trip emissions were calculated using estimated daily trips, mileage, and EMFAC 2011 emission factors.
N/A N/A
Used SMAQMD model, yet soils in the two places may not be similar (no basis given that they are) and may need different amount of work, thereby causing different emissions.
Agreed. However, the approach estimates the general amount of equipment effort necessary to develop the project and particulate matter emissions. At this time, it is not possible to accurately estimate any differences in GHG emissions due to on-site equipment activity based on variation in soil types.
N/A N/A
Didn’t address Concrete truck emissions were included in the overall on-road truck estimates. Concrete will now be provided by an on-site batch plant. The revised GHG report will include an estimate of on-site equipment and hauling emissions.
Concrete trucks coming from Alpine—can Alpine support projects concrete needs?
Concrete trucks for Tierra del Sol now estimate from location of concrete batch plant on Rugged site. Concrete use for Tierra del Sol would follow that for Rugged.

5
CARB Rugged Comments Soitec - Rugged Comment
Responses CARB Tierra del Sol Comments Soitec - Tierra del Sol Comment
Responses Full model outputs N/A Only summary of model outputs Because a model (e.g., URBEMIS) was
not used, and emission factors were generated from EMFAC and OFFROAD models, all outputs display raw data in Excel format. Appendices are not a summary and do include fully quantified emission estimates and explanations for assumptions.

RUGGED SOLAR LLC PROJECT CLIMATE CHANGE AND
GREENHOUSE GAS EMISSIONS ANALYSIS
Major Use Permit 3300-12-007
Prepared for:
County of San Diego Department of Planning and Land Use
Contact: Larry Hofreiter 5201 Ruffin Road, Suite B
San Diego, California 92123 (858) 694-2960
Project Proponent:
Rugged Solar LLC c/o Soitec Solar Development LLC 4250 Executive Square, Suite 770
San Diego, California 92037
Prepared by:
AECOM 1420 Kettner Boulevard, Suite 500
San Diego, California 92101 (619) 233-1454
February 2013


Rugged Solar LLC Project GHG Analysis Page i 11280175 Rugged GHG Tech Study - 2-8-12.doc 2/8/2013
TABLE OF CONTENTS Section Page
ACRONYMS AND ABBREVIATIONS ............................................................................. iii
CHAPTER 1.0 – INTRODUCTION .................................................................................. 1
CHAPTER 2.0 – AFFECTED ENVIRONMENT ............................................................... 3 Project Location .................................................................................................... 3 Project Description ............................................................................................... 3 Environmental Setting .......................................................................................... 6
Global Climate Trends and Associated Impacts ........................................ 8 Greenhouse Gas Emission Sources ........................................................ 11
Regulatory Setting .............................................................................................. 14 Federal Plans, Policies, Regulations, and Laws ...................................... 14 State Plans, Policies, Regulations, and Laws .......................................... 15 Regional and Local Plans, Policies, Regulations, and Ordinances .......... 20
CHAPTER 3.0 – ENVIRONMENTAL CONSEQUENCES AND MITIGATION MEASURES .................................................................................................................. 23
Analysis Methodology ......................................................................................... 23 Construction Emissions ........................................................................... 24 Operational Emissions ............................................................................. 25
Criteria for Determining Significance of Effects .................................................. 26 Impact Analysis .................................................................................................. 28
CHAPTER 4.0 – EFFECTS OF GLOBAL CLIMATE CHANGE ON THE PROJECT ..... 32
CHAPTER 5.0 – BIBLIOGRAPHY ................................................................................ 34
APPENDIX A. Model Assumptions and Outputs

Page ii Rugged Solar LLC Project GHG Analysis 11280175 Rugged GHG Tech Study - 2-8-12.doc 2/8/2013
LIST OF FIGURES Figure Page 1 Regional Map ....................................................................................................... 4 2 Vicinity Map .......................................................................................................... 5 3 2008 California GHG Emissions by Sector (2000–2008 Emission Inventory) .... 13 4 San Diego County’s Greenhouse Gas Emissions by Economic Sector (2006) .. 14
LIST OF TABLES
Table Page 1 Project Size Thresholds ...................................................................................... 27 2 Project GHG Emissions ...................................................................................... 29

Rugged Solar LLC Project GHG Analysis Page iii 11280175 Rugged GHG Tech Study - 2-8-12.doc 2/8/2013
ACRONYMS AND ABBREVIATIONS AB Assembly Bill APN Assessor’s Parcel Numbers APS Alternative Planning Strategy ARB California Air Resources Board CAA Clean Air Act CAL/EPA California Environmental Protection Agency CAPCOA California Air Pollution Control Officers Association CCAA California Clean Air Act CCCC California Climate Change Center CEC California Energy Commission CPV concentrating photovoltaic CEQA California Environmental Quality Act CH4 methane CO2 carbon dioxide CO2e carbon dioxide equivalent DOT Department of Transportation DPLU Department of Planning and Land Use DWR California Department of Water Resources EPA Environmental Protection Agency GHG greenhouse gas GWP global warming potential HFC hydrofluorocarbon IPCC Intergovernmental Panel on Climate Change kV kilovolt MMT million metric tons MW megawatt MPO Metropolitan Planning Organization MT metric tons N2O nitrous oxide PFCs perfluorocarbons RPS Renewable Portfolio Standard RTP Regional Transportation Plan SANDAG San Diego Association of Governments SB Senate Bill SCS Sustainable Communities Strategy SF6 sulfur hexafluoride TAC toxic air contaminants

Page iv Rugged Solar LLC Project GHG Analysis 11280175 Rugged GHG Tech Study - 2-8-12.doc 2/8/2013
This page intentionally left blank.

Rugged Solar LLC Project GHG Analysis Page 1 11280175 Rugged GHG Tech Study - 2-8-12.doc 2/8/2013
CHAPTER 1.0 – INTRODUCTION
Rugged Solar LLC proposes the development of an 80 megawatts (MW) AC concentrating photovoltaic (CPV) renewable energy project (Project) near Boulevard, California, an unincorporated community in San Diego County. The purpose of this report is to discuss global climate change and existing greenhouse gas (GHG) emission sources; summarize applicable federal, state, and local regulations; and analyze potential GHG impacts to global climate change associated with the construction and operation of the Project. Emissions of GHGs have the potential to adversely affect the environment because such emissions contribute, on a cumulative basis, to global climate change. Global climate change also has the potential to result in sea level rise (resulting in flooding of low-lying areas), affect rainfall and snowfall (leading to changes in water supply and runoff), affect temperatures and habitats (affecting biological and agricultural resources), and result in many other adverse effects. Legislation, regulations, and executive orders on the subject of climate change have established federal and statewide contexts and processes for developing an enforceable cap on GHG emissions. Given the nature of environmental consequences from GHGs and global climate change, the California Environmental Quality Act (CEQA) requires that lead agencies evaluate the cumulative impacts of GHGs, even relatively small additions, on a global basis. Small contributions to this cumulative impact of global climate change (from which significant effects are occurring and are expected to worsen over time) may be potentially significant. The Project would provide non-fossil-fuel-based electricity and would support the state’s goal to obtain 33% of all electricity from renewable sources. The amount of carbon savings that would be derived from implementation of the Project, as opposed to implementation of a carbon-based power plant, is estimated at 106,990 MT CO2e per year. After accounting for annual operational emissions and amortized construction emissions of 650 MT CO2e per year, the Project would result in net carbon savings of 106,340 MT CO2e per year.

Page 2 Rugged Solar LLC Project GHG Analysis 11280175 Rugged GHG Tech Study - 2-8-12.doc 2/8/2013
This page intentionally left blank.

Rugged Solar LLC Project GHG Analysis Page 3 11280175 Rugged GHG Tech Study - 2-8-12.doc 2/8/2013
CHAPTER 2.0 – AFFECTED ENVIRONMENT
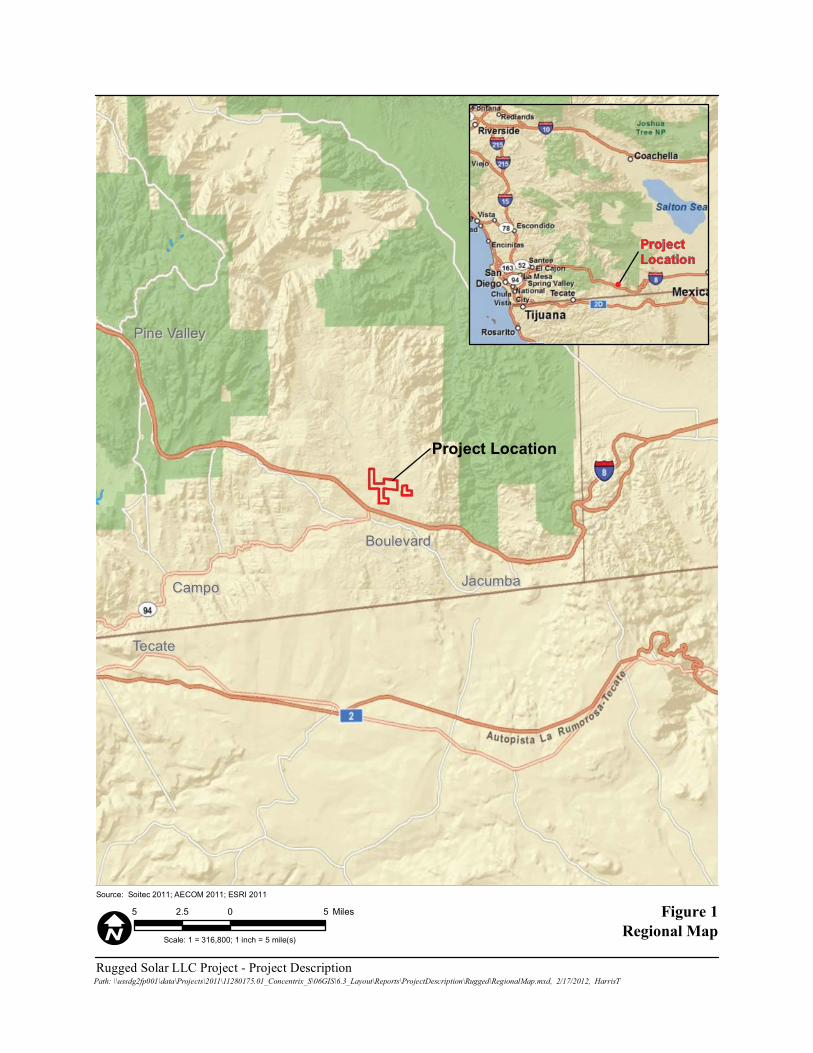
PROJECT LOCATION Figure 1 shows the Project’s relationship to San Diego County, which is located in southern California in the unincorporated community of Boulevard. Figure 2 shows the project’s relationship to the surrounding unincorporated community of Boulevard and provides the context of local geography/major landforms/points of interest. The project site is located approximately 1.25 miles north of Interstate 8 (I-8) and extends roughly 2 miles between Ribbonwood Road and approximately 0.5 mile east of McCain Valley Road. PROJECT DESCRIPTION The Project would produce up to 80 megawatts (MW) of alternating current (AC) solar generating capacity. The Project would consist of approximately 3,588 concentrating photovoltaic electric generation systems utilizing dual axis tracking CPV trackers on 765 acres in southeastern San Diego County in the unincorporated community of Boulevard, California. In addition to the CPV trackers and inverter transformer units, the Project includes the following primary components:
A collection system linking the CPV trackers to the on-site Project substation composed of (i) 1,000-volt (V) direct current underground conductors leading to (ii) 34.5-kilovolt (kV) underground and overhead AC conductors.
A 7,500-square-foot (sf) (60 feet by 125 feet) operations and maintenance (O&M) building.
A 2-acre on-site private collector substation site with a pad area of 6,000 sf (60 feet by 100 feet) with maximum height of 35 feet and includes a 450-sf (15 feet by 30 feet) control house.
61 Inverter/Transformer enclosures. The dimensions of each inverter unit are 10 feet by 25 or 40 feet (250 or 400 sf each) with a total structure height of up to 12 feet.
Pine ValleyPine Valley
BoulevardBoulevard
JacumbaJacumbaCampoCampo
TecateTecate
Project Location
Figure 1Regional Map
Rugged Solar LLC Project - Project Description
Source: Soitec 2011; AECOM 2011; ESRI 2011
Scale: 1 = 316,800; 1 inch = 5 mile(s)
Path: \\ussdg2fp001\data\Projects\2011\11280175.01_Concentrix_S\06GIS\6.3_Layout\Reports\ProjectDescription\Rugged\RegionalMap.mxd, 2/17/2012, HarrisT
5 0 52.5 Miles
I
ProjectLocation

Project Area
Figure 2Vicinity Map
Rugged Solar LLC Project - Project Description
Source: USGS; Soitec 2011; AECOM 2011
Path: \\ussdg2fp001\data\Projects\2011\11280175.01_Concentrix_S\06GIS\6.3_Layout\Reports\ProjectDescription\Rugged\VicinityMap.mxd, 2/17/2012, HarrisT
0.5 0 0.50.25 Miles
I 1 inch = 0.5 mile(s)1:31,680
Live Oak Springs USGS Quadrangle, San Diego County
Old Hwy 80
Ribbonw
ood Rd.
Mccain Valley Rd.
§̈¦8
Page 6 Rugged Solar LLC Project GHG Analysis 11280175 Rugged GHG Tech Study - 2-8-12.doc 2/8/2013
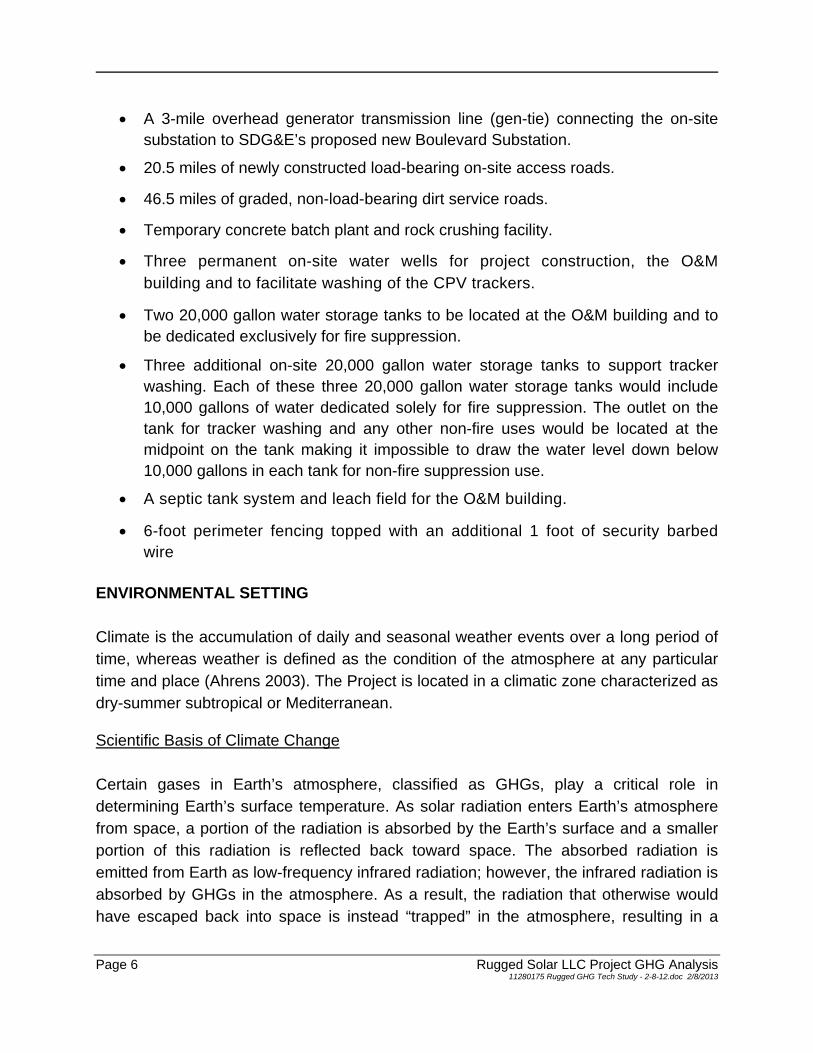
A 3-mile overhead generator transmission line (gen-tie) connecting the on-site substation to SDG&E’s proposed new Boulevard Substation.
20.5 miles of newly constructed load-bearing on-site access roads.
46.5 miles of graded, non-load-bearing dirt service roads.
Temporary concrete batch plant and rock crushing facility.
Three permanent on-site water wells for project construction, the O&M building and to facilitate washing of the CPV trackers.
Two 20,000 gallon water storage tanks to be located at the O&M building and to be dedicated exclusively for fire suppression.
Three additional on-site 20,000 gallon water storage tanks to support tracker washing. Each of these three 20,000 gallon water storage tanks would include 10,000 gallons of water dedicated solely for fire suppression. The outlet on the tank for tracker washing and any other non-fire uses would be located at the midpoint on the tank making it impossible to draw the water level down below 10,000 gallons in each tank for non-fire suppression use.
A septic tank system and leach field for the O&M building.
6-foot perimeter fencing topped with an additional 1 foot of security barbed wire
ENVIRONMENTAL SETTING Climate is the accumulation of daily and seasonal weather events over a long period of time, whereas weather is defined as the condition of the atmosphere at any particular time and place (Ahrens 2003). The Project is located in a climatic zone characterized as dry-summer subtropical or Mediterranean. Scientific Basis of Climate Change Certain gases in Earth’s atmosphere, classified as GHGs, play a critical role in determining Earth’s surface temperature. As solar radiation enters Earth’s atmosphere from space, a portion of the radiation is absorbed by the Earth’s surface and a smaller portion of this radiation is reflected back toward space. The absorbed radiation is emitted from Earth as low-frequency infrared radiation; however, the infrared radiation is absorbed by GHGs in the atmosphere. As a result, the radiation that otherwise would have escaped back into space is instead “trapped” in the atmosphere, resulting in a
Rugged Solar LLC Project GHG Analysis Page 7 11280175 Rugged GHG Tech Study - 2-8-12.doc 2/8/2013
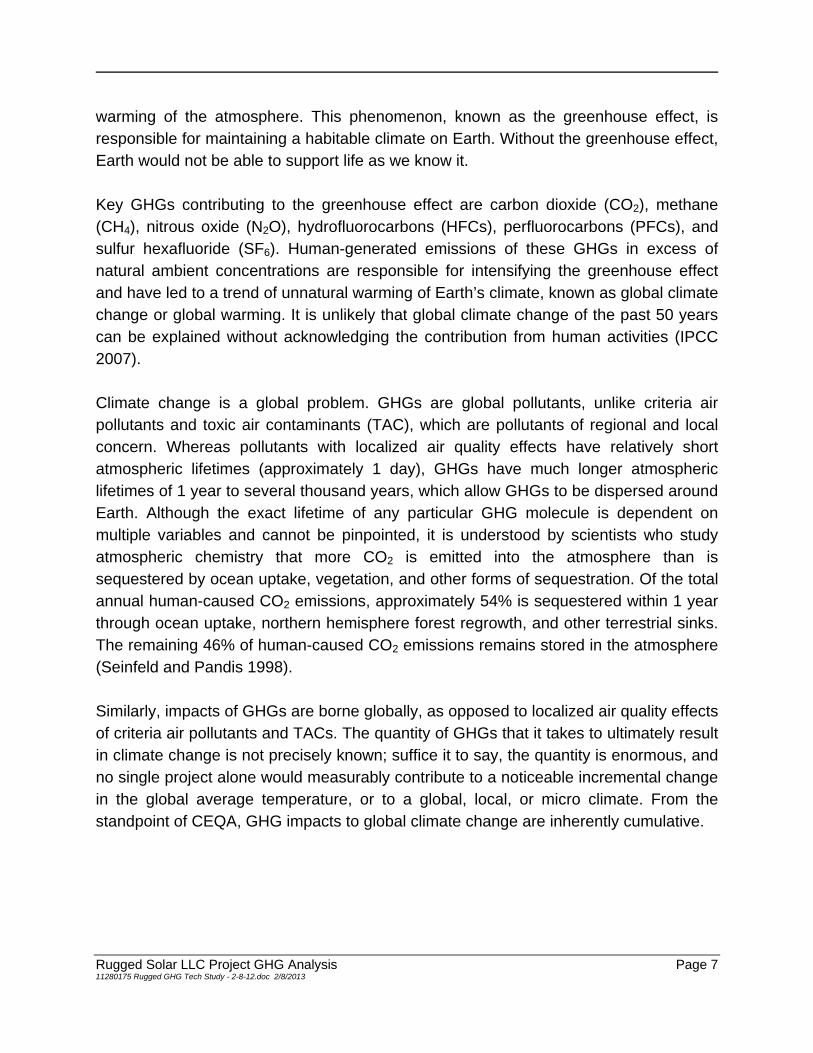
warming of the atmosphere. This phenomenon, known as the greenhouse effect, is responsible for maintaining a habitable climate on Earth. Without the greenhouse effect, Earth would not be able to support life as we know it. Key GHGs contributing to the greenhouse effect are carbon dioxide (CO2), methane (CH4), nitrous oxide (N2O), hydrofluorocarbons (HFCs), perfluorocarbons (PFCs), and sulfur hexafluoride (SF6). Human-generated emissions of these GHGs in excess of natural ambient concentrations are responsible for intensifying the greenhouse effect and have led to a trend of unnatural warming of Earth’s climate, known as global climate change or global warming. It is unlikely that global climate change of the past 50 years can be explained without acknowledging the contribution from human activities (IPCC 2007). Climate change is a global problem. GHGs are global pollutants, unlike criteria air pollutants and toxic air contaminants (TAC), which are pollutants of regional and local concern. Whereas pollutants with localized air quality effects have relatively short atmospheric lifetimes (approximately 1 day), GHGs have much longer atmospheric lifetimes of 1 year to several thousand years, which allow GHGs to be dispersed around Earth. Although the exact lifetime of any particular GHG molecule is dependent on multiple variables and cannot be pinpointed, it is understood by scientists who study atmospheric chemistry that more CO2 is emitted into the atmosphere than is sequestered by ocean uptake, vegetation, and other forms of sequestration. Of the total annual human-caused CO2 emissions, approximately 54% is sequestered within 1 year through ocean uptake, northern hemisphere forest regrowth, and other terrestrial sinks. The remaining 46% of human-caused CO2 emissions remains stored in the atmosphere (Seinfeld and Pandis 1998). Similarly, impacts of GHGs are borne globally, as opposed to localized air quality effects of criteria air pollutants and TACs. The quantity of GHGs that it takes to ultimately result in climate change is not precisely known; suffice it to say, the quantity is enormous, and no single project alone would measurably contribute to a noticeable incremental change in the global average temperature, or to a global, local, or micro climate. From the standpoint of CEQA, GHG impacts to global climate change are inherently cumulative.

Page 8 Rugged Solar LLC Project GHG Analysis 11280175 Rugged GHG Tech Study - 2-8-12.doc 2/8/2013
Global Climate Trends and Associated Impacts Trends of Climate Change Warming of the climate system is now considered to be unequivocal (IPCC 2007), with global surface temperature increasing approximately 1.33 degrees Fahrenheit (°F) over the last 100 years. The rate of increase in global average surface temperature over the last 100 years has not been consistent; the last three decades have warmed at a much faster rate—on average, 0.32°F per decade. Nine of the 10 warmest years in the instrumental record of global average surface temperature have occurred since 2000 (NOAA 2011). Continued warming is projected to increase the global average temperature by 2°F to 11°F over the next 100 years. The causes of this warming have been identified as both natural processes and as the result of human actions. The Intergovernmental Panel on Climate Change (IPCC) concluded that variations in natural phenomena, such as solar radiation and volcanoes, produced most of the warming from pre-industrial times to 1950, and had a small cooling effect afterward. However, after 1950, increasing GHG concentrations resulting from human activity, such as fossil fuel burning and deforestation, have been responsible for most of the observed temperature increase. Impacts of Climate Change Over the same period that increased global warming has occurred, many other changes have occurred or are predicted to occur in other natural systems. Sea levels have risen; precipitation patterns throughout the world have shifted, with some areas becoming wetter and others drier; wildfires are predicted to increase in number and intensity; extreme weather events such as heat waves have increased; and numerous other conditions have been observed. Although it is difficult to prove a definitive cause-and-effect relationship between global warming and other observed changes to natural systems, there is a high level of confidence within the scientific community that these changes are a direct result of increased global temperatures caused by increased presence of GHGs in the atmosphere (IPCC 2007). Historical trends and predictions of future climate change effects in the above topic areas are discussed below.

Rugged Solar LLC Project GHG Analysis Page 9 11280175 Rugged GHG Tech Study - 2-8-12.doc 2/8/2013
Precipitation and Snowpack An analysis of trends in total annual precipitation in the western United States by the National Weather Service’s Climate Prediction Center provides evidence that annual precipitation has increased in much of California, the Colorado River Basin, and elsewhere in the west since the mid-1960s (DWR 2006). When these same precipitation data are sorted into three regions—northern, central, and southern California—trends show that precipitation in the northern portion of the state appears to have increased slightly from 1890 to 2002, and precipitation in the central and southern portions of the state show slightly decreasing trends. Although existing data indicate some level of change in precipitation trends in California, more analysis is needed to determine whether changes in California’s regional annual precipitation totals have occurred as the result of climate change or other factors (DWR 2006). As a result of climate change, global average precipitation is expected to increase during the 21st century. While precipitation is generally expected to increase on a global scale, significant regional variations in precipitation trends can be expected. Specifically in California, precipitation is projected to increase in the northern region during the winter months. Various California climate models provide mixed results regarding forecasted changes in total annual precipitation in the state through the end of this century. Therefore, no conclusion on an increase or decrease can be provided (IPCC 2007). Although global climate change models generally predict an increase in overall precipitation on a worldwide scale, there is no such consistency among the results of regional models applied to California. An increase in the global average temperature is expected to result in a decreased volume of precipitation falling as snow in California and an overall reduction in snowpack in the Sierra Nevada Mountains. Snowpack in the Sierra Nevada provides both water supply (runoff) and storage (within the snowpack before melting), and is a major water source for the state. According to the California Energy Commission (CEC) (2006a), the snowpack portion of the water supply could potentially decline from 30% to 90% by the end of the 21st century. California’s annual snowpack, on average, has the greatest accumulations from November through the end of March. The snowpack typically melts from April through
Page 10 Rugged Solar LLC Project GHG Analysis 11280175 Rugged GHG Tech Study - 2-8-12.doc 2/8/2013
July. As temperatures rise, a declining proportion of total precipitation falls as snow, more winter runoff occurs, and remaining snow melts sooner and faster in spring. In some basins, spring peak runoff may increase; in others, runoff volumes may shift to earlier in the spring and winter months (DWR 2006). In some instances, runoff peak levels may increase and occur earlier. California’s reservoir managers use snowmelt to help fill reservoirs once the threat of large winter and early spring storms and related flooding risks have passed. An analysis conducted by the California Department of Water Resources (DWR) (2006) on the effect of rising temperatures on snowpack shows that a 5.4°F rise in average annual temperature would likely cause snowlines to rise approximately 1,500 feet. This would result in an annual loss of approximately 5 million acre-feet of water storage in the snowpack. This would represent a loss of approximately 23% of the total storage capacity of all key reservoirs in California (DWR 2012). Sea Level Rise Another major area of concern related to global climate change is sea level rise. Worldwide average sea level appears to have risen approximately 0.4 to 0.7 feet over the past century based on data collected from tide gauges around the globe, coupled with satellite measurements taken over approximately the last 15 years (IPCC 2007). Various gauge stations along the California coast show an increase similar to the global trends. Rising average sea level over the past century has been attributed primarily to warming of the world’s oceans, the related thermal expansion of ocean waters, and the addition of water to the world’s oceans from the melting of land-based polar ice (IPCC 2007). Melting sea-based polar ice will have a much smaller impact on sea level rise, and is not currently modeled in sea level rise estimates (Shepherd et al. 2010). A consistent rise in sea level has been recorded worldwide over the last 100 years. According to IPCC, sea level rise is expected to continue, and increase by up to 23 inches by the year 2099 (IPCC 2007). Other climate models estimate an even greater increase in sea level rise of 55 inches by the year 2100 (DWR 2008). Although these projections are on a global scale, the rate of relative sea level rise experienced at many locations along California’s coast correlates well with the worldwide average rate of rise observed over the past century. Therefore, it is reasonable to expect that changes in worldwide average sea level will also be experienced along California’s coast through
Rugged Solar LLC Project GHG Analysis Page 11 11280175 Rugged GHG Tech Study - 2-8-12.doc 2/8/2013
this century (DWR 2006); however, the amount and timing of the expected sea level rise that will be experienced along California’s coast is uncertain. Heat Waves Historically, extreme warm temperatures in the San Diego region have mostly occurred in July and August, but as climate warming continues, the occurrences of these events will likely begin in June and could continue to take place into September. All simulations indicate that hot daytime and nighttime temperatures (heat waves) will increase in frequency, magnitude, and duration (San Diego Foundation 2008). Wildfires Different climate change models yield somewhat different predictions about the frequency, timing, and severity of future Santa Ana wind conditions (which are a major driver of large wildfires in San Diego County), leading to uncertainty about how fire regimes may change in the future. Analyses by the California Climate Change Center (CCCC) show that significant increases in large wildfire occurrences and burned areas are likely to occur by mid-century, with very large increases by 2085. The latter is mainly due to the effects of projected temperature increases on evapotranspiration, compounded by reduced precipitation (CCCC 2009). Greenhouse Gas Emission Sources Emissions of GHGs contributing to global climate change are attributable in large part to human activities associated with the transportation, industrial/manufacturing, electric utility, residential, commercial, and agricultural sectors. Emissions of CO2 are byproducts of fossil fuel combustion, and CH4, a highly potent GHG, is the primary component in natural gas and is associated with agricultural practices and landfills. N2O is also largely attributable to agricultural practices and soil management. For purposes of accounting for and regulating GHG emissions, sources of GHG emissions are grouped into emissions sectors. The California Air Resources Board (ARB) identifies the following main GHG emissions sectors that account for most anthropogenic GHG emissions generated within California:
Transportation: On-road motor vehicles, recreational vehicles, aviation, ships, and rail
Page 12 Rugged Solar LLC Project GHG Analysis 11280175 Rugged GHG Tech Study - 2-8-12.doc 2/8/2013
Electricity: Use and production of electrical energy
Industry: Mainly stationary sources (e.g., boilers and engines) associated with process emissions
Commercial and Residential: Area sources, such as landscape maintenance equipment, fireplaces, and consumption of natural gas for space and water heating
Agriculture: Agricultural sources that include off-road farm equipment; irrigation pumps; crop residue burning (CO2); and emissions from flooded soils, livestock waste, crop residue decomposition, and fertilizer volatilization (CH4 and N2O)
High Global Warming Potential (GWP) Gases: Refrigerants and electrical insulation (e.g., SF6), among other sources
Recycling and Waste: Waste management facilities and landfills; primary emissions are CO2 from combustion and CH4 from landfills and wastewater treatment
State Greenhouse Gas Emissions Inventory ARB performs an annual GHG inventory for emissions and sinks of the six major GHGs (CO2, CH4, N2O, hydrofluorocarbons, chlorofluorocarbons, and SF6). As shown in Figure 3, California produced 477.7 million gross metric tons (MT) of CO2 equivalent (CO2e) in 2008 (ARB 2010a). CO2e is a measurement used to account for the fact that different GHGs have different potential to retain infrared radiation in the atmosphere and contribute to the greenhouse effect. This potential, known as the global warming potential (GWP) of a GHG, is dependent on the lifetime, or persistence, of the gas molecule in the atmosphere. Expressing emissions in CO2e takes the contributions of all GHG emissions to the greenhouse effect and converts them to a single unit equivalent to the effect that would occur if only CO2 were being emitted. The inventory is divided into the ARB-created categories or sectors of emissions: transportation, electricity generation, industrial, commercial, residential, agriculture and forestry, and not specified (i.e., recycling and waste, and high GWP gases). Combustion of fossil fuel in the transportation sector was the single largest source of California’s

Rugged Solar LLC Project GHG Analysis Page 13 11280175 Rugged GHG Tech Study - 2-8-12.doc 2/8/2013
Figure 3 2008 California GHG Emissions by Sector (2000–2008 Emission Inventory)
MMT=million metric tons
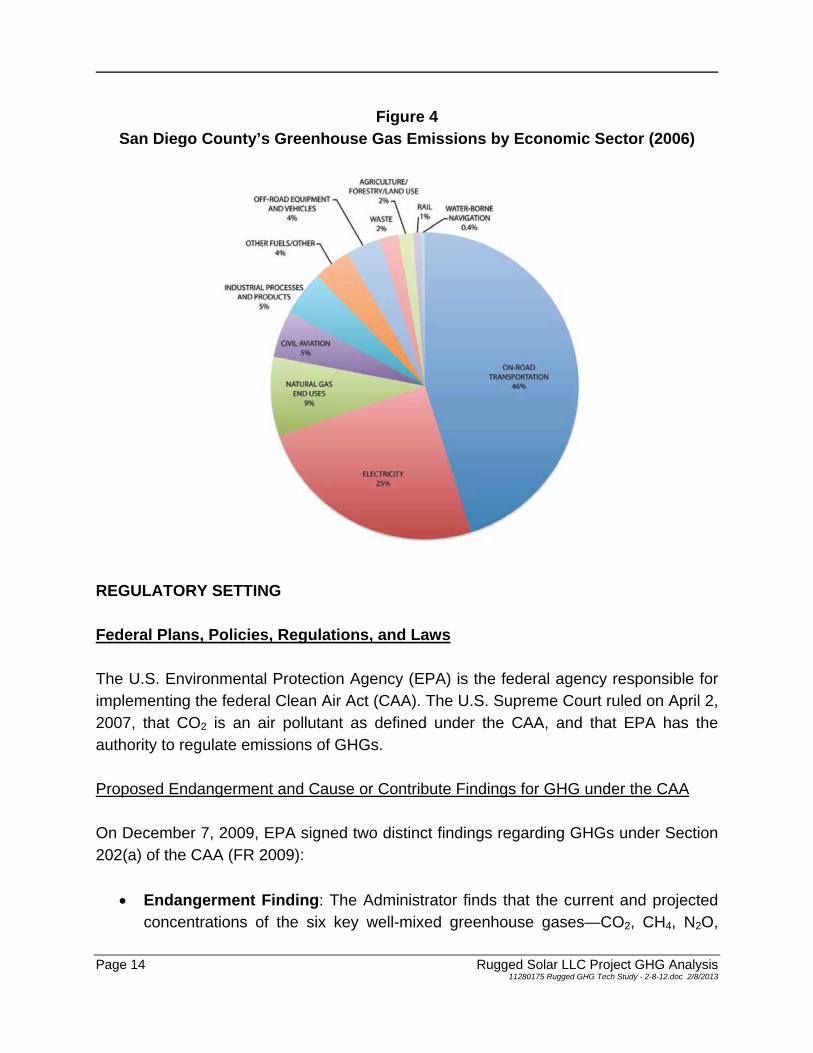
GHG emissions in 2008, accounting for 36% of total GHG emissions in the state. The transportation sector was followed by the electric power sector, which accounts for 24% of total GHG emissions in the state (including in- and out-of-state sources), and the industrial sector, which accounts for 21% of total GHG emissions in the state (ARB 2010a). Regional Greenhouse Gas Emission Inventory The University of San Diego School of Law, Energy Policy Initiative Center prepared a GHG inventory for San Diego County (Anders et al. 2008). The inventory included estimates of GHG emissions for 1990, 2006, and 2020. Based on the existing inventory and the projections for the region, the University of San Diego found that emissions of GHGs must be reduced to 33% below “business-as-usual” conditions to achieve 1990 emission levels by the year 2020. As shown in Figure 4, total GHG emissions in San Diego County in 2006 were estimated to be 34 million metric tons (MMT) of CO2e. Transportation is the largest emissions sector, accounting for 16 MMT of CO2e, or 46% of total emissions. Energy consumption, including electricity and natural gas use, is the next largest source of emissions, at 34% of the total.
Page 14 Rugged Solar LLC Project GHG Analysis 11280175 Rugged GHG Tech Study - 2-8-12.doc 2/8/2013
Figure 4 San Diego County’s Greenhouse Gas Emissions by Economic Sector (2006)
REGULATORY SETTING Federal Plans, Policies, Regulations, and Laws The U.S. Environmental Protection Agency (EPA) is the federal agency responsible for implementing the federal Clean Air Act (CAA). The U.S. Supreme Court ruled on April 2, 2007, that CO2 is an air pollutant as defined under the CAA, and that EPA has the authority to regulate emissions of GHGs. Proposed Endangerment and Cause or Contribute Findings for GHG under the CAA On December 7, 2009, EPA signed two distinct findings regarding GHGs under Section 202(a) of the CAA (FR 2009):
Endangerment Finding: The Administrator finds that the current and projected concentrations of the six key well-mixed greenhouse gases—CO2, CH4, N2O,
Rugged Solar LLC Project GHG Analysis Page 15 11280175 Rugged GHG Tech Study - 2-8-12.doc 2/8/2013
HFCs, PFCs, and SF6—in the atmosphere threaten the public health and welfare of current and future generations.
Cause or Contribute Finding: The Administrator finds that the combined emissions of these well-mixed greenhouse gases from new motor vehicles and new motor vehicle engines contribute to the greenhouse gas pollution, which threatens public health and welfare.
These findings do not themselves impose any requirements on industry or other entities. However, this action was a prerequisite to finalizing EPA’s proposed GHG emissions standards for light-duty vehicles. On November 16, 2011, the Department of Transportation’s (DOT) and EPA proposed stringent federal GHG and fuel economy standards for model years 2017 to 2025 passenger cars and light-duty trucks. In addition to the standards for light-duty vehicles, DOT and EPA announced standards on August 9, 2011, to reduce GHG emissions and improve the fuel efficiency of heavy-duty trucks and buses. Mandatory Greenhouse Gas Reporting Rule On September 22, 2009, EPA published the Final Mandatory Greenhouse Gas Reporting Rule (Reporting Rule) in the Federal Register (FR 2010b). The Reporting Rule requires reporting of GHG data and other relevant information from fossil fuel and industrial GHG suppliers, vehicle and engine manufacturers, and all facilities that would emit 25,000 MT or more of CO2e per year. Facility owners are required to submit an annual report with detailed calculations of facility GHG emissions due on March 31 for emissions in the previous calendar year. The Reporting Rule also mandates recordkeeping and administrative requirements to enable EPA to verify the annual GHG emissions reports. Owners of existing facilities that commenced operation prior to January 1, 2011, are required to submit an annual report for calendar year 2011. State Plans, Policies, Regulations, and Laws ARB is the agency responsible for coordination and oversight of state and local air pollution control programs in California and for implementing the California Clean Air Act (CCAA).

Page 16 Rugged Solar LLC Project GHG Analysis 11280175 Rugged GHG Tech Study - 2-8-12.doc 2/8/2013
Assembly Bill 1493 Assembly Bill (AB) 1493 (ARB 2002), signed in 2002, required that ARB develop and adopt, by January 1, 2005, regulations that achieve “the maximum feasible reduction of greenhouse gases emitted by passenger vehicles and light-duty trucks and other vehicles determined by ARB to be vehicles whose primary use is noncommercial personal transportation in the state.” In 2004, ARB adopted standards requiring automobile manufacturers to meet fleet-average GHG emissions limits for all passenger cars, light-duty trucks within various weight criteria, and medium-duty passenger vehicle weight classes (i.e., any medium-duty vehicle with a gross vehicle weight rating less than 10,000 pounds that is designed primarily for the transportation of persons) beginning with the 2009 model year. For passenger cars and light-duty trucks, the GHG emissions limits for the 2016 model year are approximately 37% lower than the limits for the first year of the regulations, the 2009 model year. Before the regulations could go into effect, EPA had to grant California a waiver under the CAA, allowing California to regulate GHG emissions from motor vehicles within the state. EPA granted the waiver in 2009. In April 2010, DOT and EPA established GHG gas emissions and fuel economy standards for model years 2012–2016 light-duty cars and trucks. In the fall of 2010, California accepted compliance with these federal GHG standards as meeting similar state standards as adopted in 2004, resulting in the first coordinated national program. Executive Order S-3-05 Executive Order S-3-05 (Caltrans 2005), signed in June 2005, proclaimed that the State of California is vulnerable to the impacts of climate change. Executive Order S-3-05 declared that increased temperatures could reduce the Sierra Nevada’s snowpack, further exacerbate California’s air quality problems, and potentially cause a rise in sea levels. To combat those concerns, the Executive Order established total GHG emissions targets. Specifically, emissions are to be reduced to the 2000 level by 2010, the 1990 level by 2020, and to 80% below the 1990 level by 2050. Executive Order S-3-05 directed the Secretary of the California Environmental Protection Agency (CAL/EPA) to (1) coordinate a multi-agency effort to reduce GHG emissions to the target levels and (2) submit biannual reports to the governor and the

Rugged Solar LLC Project GHG Analysis Page 17 11280175 Rugged GHG Tech Study - 2-8-12.doc 2/8/2013
State Legislature describing progress made toward reaching the emission targets, impacts of global warming on California’s resources, and mitigation and adaptation plans to combat these impacts. The Secretary of the CAL/EPA created the California Climate Action Team, made up of members from various state agencies and commissions, which is responsible for implementing global warming emissions-reduction programs. The California Climate Action Team is also responsible for reporting on the progress made toward meeting the statewide GHG targets. Assembly Bill 32 Climate Change Proposed Scoping Plan In December 2008, ARB adopted its Climate Change Scoping Plan (Scoping Plan), which was revised in 2011 to account for new economic activity levels. The Scoping Plan contains the main strategies California will implement to achieve reduction of approximately 80 MMT of CO2e, or 16% from California’s projected 2020 emissions level of 507 MMT of CO2e under a “business-as-usual” scenario. The Scoping Plan also includes ARB-recommended GHG reductions for each emissions sector of California’s GHG inventory. The Scoping Plan calls for the largest reductions in GHG emissions to be achieved by implementing the following measures and standards:
Improved emissions standards for light-duty vehicles (26.1 MMT CO2e)
The Low-Carbon Fuel Standard (15.0 MMT CO2e)
Energy efficiency measures in buildings and appliances, and the widespread development of combined heat and power systems (16.7 MMT CO2e)
A renewable portfolio standard for electricity production (12 MMT CO2e) The Scoping Plan does state that land use planning and urban growth decisions will play an important role in the state’s GHG reductions, since local governments have primary authority to plan, zone, approve, and permit land development to accommodate population growth and the changing needs of their jurisdictions. The Scoping Plan expects a reduction of approximately 5.0 MMT CO2e per year from local land use changes associated with implementation of Senate Bill (SB) 375, discussed below. The Scoping Plan does not include any direct discussion about GHG emissions generated by construction activity.

Page 18 Rugged Solar LLC Project GHG Analysis 11280175 Rugged GHG Tech Study - 2-8-12.doc 2/8/2013
Cap and Trade As a key part of the ARB Scoping Plan, the final adoption of regulations for the Cap and Trade program (ARB 2011) by the ARB board is an important step to the state meeting its GHG reduction goals. This program will first set an aggressive cap, or maximum limit, on emissions; sources covered by the program then receive authorizations to emit in the form of emissions allowances, with the total amount of allowance limited by the cap. Each source can design its own compliance strategy to meet the overall reduction requirement, including sale or purchase of allowances, installation of pollution controls, and implementation of efficiency measures. Individual control requirements are not specified under a cap and trade program, but each emissions source must surrender allowances equal to its actual emissions to comply. Sources must also completely and accurately measure and report all emissions in a timely manner to guarantee that the overall cap is achieved. In the first compliance period, which will be in place from 2013 through 2014, the regulations will impose allowance obligations on the electricity distribution entities in California (both for in-state generation and out-of-state generation imported into the state) and certain large industrial facilities in specified industries whose GHG emissions exceed 25,000 MT CO2e. In the second compliance period, starting January 1, 2015, producers and importers of natural gas and other fossil fuels will become subject to the regulations. Executive Order S-1-07 Executive Order S-1-07 (ARB 2007), signed in 2007, establishes a goal that the carbon intensity of transportation fuels sold in California should be reduced by a minimum of 10% by 2020. ARB identified this Low Carbon Fuel Standard as a discrete early action item under AB 32. The final ARB resolution (No. 09-31) was issued on April 23, 2009. Senate Bill 1078, Senate Bill 107, and Senate Bill X1-2 SB 1078 (CEC 2002) requires retail sellers of electricity, including investor-owned utilities and community choice aggregators, to provide at least 20% of their supply from renewable sources by 2017. SB 107 changed the target date to 2010. Executive Order S-14-08 expands the state’s Renewable Energy Standard to 33% renewable power by 2020. This new goal was codified in 2011 with the passage of SB X1-2. In 2009, San

Rugged Solar LLC Project GHG Analysis Page 19 11280175 Rugged GHG Tech Study - 2-8-12.doc 2/8/2013
Diego Gas & Electric (SDG&E), which provides electricity and natural gas to the Project site, used 10% renewable energy to provide electricity to customers (SDG&E 2009). To meet the goals set out in SB X1-2, a significant effort will be needed to reduce overall energy used in the state through energy efficiency efforts and a large effort to increase the amount of renewable energy generated and purchased by SDG&E. Senate Bill 97 Signed in August 2007, SB 97 (OPR 2007) acknowledges that climate change is a prominent environmental issue that requires analysis under CEQA. This bill directed the California Office of Planning and Research to prepare, develop, and transmit to the California Natural Resources Agency guidelines for the feasible mitigation of GHG emissions or the effects of GHG emissions under CEQA (CNRA 2009). On February 16, 2010, the Office of Administrative Law approved the CEQA amendments and filed them with the Secretary of State for inclusion in the California Code of Regulations. The CEQA amendments became effective on March 18, 2010. The amended guidelines establish two new guidance questions in the Environmental Checklist of CEQA Guidelines Appendix G. The amendments do not establish a GHG emissions threshold, but allow a lead agency to develop, adopt, and apply its own threshold of significance or use those developed by other agencies or experts. Senate Bill 375 Signed in September 2008, SB 375 (LC 2008) aligns regional transportation planning efforts, regional GHG-reduction targets, and land use and housing allocations. It requires Metropolitan Planning Organizations (MPOs), such as the San Diego Association of Governments (SANDAG), to adopt a Sustainable Communities Strategy (SCS) or Alternative Planning Strategy (APS), which would prescribe land use allocations in that MPO’s Regional Transportation Plan (RTP). ARB has established reduction targets for GHGs emitted by passenger cars and light trucks in the region for the years 2020 and 2035. These reduction targets are to be updated every 8 years, but can be updated every 4 years if advancements in emissions technologies affect the reduction strategies to achieve the targets. ARB is also charged with reviewing each MPO’s SCS or APS for consistency with its assigned targets.
SANDAG became the first MPO in the state to adopt an SCS when it adopted the 2050 RTP in October 2011. This regional planning document included an SCS that will

Page 20 Rugged Solar LLC Project GHG Analysis 11280175 Rugged GHG Tech Study - 2-8-12.doc 2/8/2013
achieve the GHG emissions reduction goals set by ARB of 7% per capita GHG reductions from passenger vehicles by 2020 and 13% by 2035. SB 375 also extends the minimum period for the Regional Housing Needs Allocation cycle from 5 years to 8 years for local governments located within an MPO that meets certain requirements. City or county land use policies (including general plans) are not required to be consistent with the RTP (and associated SCS or APS). However, new provisions of CEQA would incentivize qualified projects that are consistent with an approved SCS or APS, which would be categorized as “transit priority projects.” ARB adopted regional targets on September 23, 2010 (ARB 2010b). Regional and Local Plans, Policies, Regulations, and Ordinances ARB’s Scoping Plan (ARB 2008) states that local governments are “essential partners” in the effort to reduce GHG emissions. The Scoping Plan also acknowledges that local governments have “broad influence and, in some cases, exclusive jurisdiction” over activities that contribute to significant direct and indirect GHG emissions through their planning and permitting processes, local ordinances, outreach and education efforts, and municipal operations. Many of the proposed measures to reduce GHG emissions rely on local government actions. The Scoping Plan encourages local governments to reduce GHG emissions by approximately 15% from current levels, which were 469 MMT CO2e at the time the Scoping Plan was created and are expected to rise to 507 MMT CO2e by 2020 under a “business-as-usual” scenario (ARB 2008). San Diego Air Pollution Control District The San Diego Air Pollution Control District has no regulations relative to GHG emissions. San Diego County San Diego County has no regulations relative to GHG emissions, but it does have a Green Building Incentive Program that is a voluntary program to promote energy- and resource-efficient building design. Incentives, in the form of fast-track plan checking and fee reductions, are offered to developers who use recycled materials in construction, install irrigation systems that use greywater, build projects that exceed California’s Title 24 guidelines (i.e., the energy efficiency standards), or install photovoltaic electricity

Rugged Solar LLC Project GHG Analysis Page 21 11280175 Rugged GHG Tech Study - 2-8-12.doc 2/8/2013
generation systems (solar power). The San Diego County General Plan Update was adopted by the County of San Diego Board of Supervisors in August 2011. The General Plan contains numerous policies in the Land Use, Mobility, Conservation and Open Space, and Housing Elements to address climate change. Adopted policies in the General Plan Update address the following major strategies:
Reduce vehicle trips generated, gasoline/energy consumption, and GHGs.
Reduce non-renewable electrical and natural gas energy consumption and generation (energy efficiency).
Increase generation and use of renewable energy sources.
Reduce water consumption.
Reduce and maximize reuse of solid wastes.
Promote CO2-consuming landscapes.
Maximize preservation of open spaces, natural areas, and agricultural lands.
Reduce risk from wildfire, flooding, and other hazards resulting from climate change.
Conserve and improve water supply due to shortage from climate change.
Promote agricultural lands for local food production.
Provide education and leadership.

Page 22 Rugged Solar LLC Project GHG Analysis 11280175 Rugged GHG Tech Study - 2-8-12.doc 2/8/2013
This page intentionally left blank.

Rugged Solar LLC Project GHG Analysis Page 23 11280175 Rugged GHG Tech Study - 2-8-12.doc 2/8/2013
CHAPTER 3.0 – ENVIRONMENTAL CONSEQUENCES AND
MITIGATION MEASURES ANALYSIS METHODOLOGY A single project is unlikely to have a significant impact on the environment related to climate change. However, the cumulative effect of various human activities involving emissions of GHGs has been clearly linked to quantifiable changes in the composition of the atmosphere, which in turn have been shown to be the main cause of global climate change (IPCC 2007). Although it is extremely unlikely that a single project would contribute significantly to climate change, the analysis of the environmental effects of GHG emissions from the Project is addressed as a cumulative impact analysis because cumulative emissions from many projects would affect global GHG concentrations and the climate system. Pursuant to full disclosure and according to CEQA Guidelines that state, “A lead agency should make a good-faith effort, based to the extent possible on scientific and factual data, to describe, calculate, or estimate the amount of greenhouse gas emissions resulting from a project,” both the total GHG emissions associated with the Project and the net change in GHG emissions from existing conditions are quantified. These are used as criteria to determine whether the associated emissions would substantially help or hinder the state’s ability to attain the goals identified in AB 32 (i.e., reduction of statewide GHG emissions to 1990 levels by 2020). The analysis of GHG emissions in this report recognizes that the impact that GHG emissions have on global climate change does not depend on whether the emissions are generated by stationary, mobile, or area sources, or whether they are generated in one region or another. Land uses need to be “GHG efficient” to attain AB 32 goals. Projects that meet specified minimum performance standards, such as those described in an existing plan or mitigation program for the reduction of emissions or specific measures adopted as part of a general plan, long-range development plan, or GHG emissions-reduction plan—can be identified as projects that are consistent with or surpass the goals of AB 32.
Page 24 Rugged Solar LLC Project GHG Analysis 11280175 Rugged GHG Tech Study - 2-8-12.doc 2/8/2013
Construction Emissions Construction-related GHG emissions would be associated with typical construction activities, such as site grading, CPV unit installation, embedded emissions in the water that will be used during construction, and vehicle engine exhaust from construction equipment, vendor trips, and construction employee commute trips. Generation of construction-related emissions would be temporary and would subside after completion of the Project. Construction at the project site would require up to about 12 months and is anticipated to begin in April 2014. Construction activities would generally occur for 8 hours per day and 6 days per week. In order to provide construction materials for the proposed solar facilities, a temporary batch plant and rock crushing facility will be constructed onsite. The temporary facility will be used for preparing and mixing the concrete used for the foundations for the solar trackers, the transformers at the substation, the O&M building, and other project facilities. Source materials (e.g., sand) for the concrete batch plant would be purchased from a commercial source approximately 55 miles from the project site. Water would be provided by on-site wells, and aggregate materials would be obtained from within the development footprint. Emissions from construction equipment and construction vehicles related to hauling materials and workers to and within the site were estimated using URBEMIS 2007 Version 9.2.4 (URBEMIS), Road Construction Emissions Model, Version 7.1.2, OFFROAD 2007 (OFFROAD), and EMFAC 2011 (EMFAC). URBEMIS is designed to estimate construction and operational emissions from land use development projects. The Road Construction Emissions Model was developed to estimate the emissions from linear projects, such as bridges, roads, or pipelines. OFFROAD and EMFAC were developed by ARB for the purposes of estimating CO2 emissions from off-road equipment and on-road vehicle activity. Additionally, emission factors used from EMFAC account for statewide GHG reduction programs for the transportation sector such as the Low Carbon Fuel Standard and Pavely fuel efficiency regulations. URBEMIS was used to estimate off-road construction equipment and fugitive dust emissions associated with (1) site clearing and grading, (2) trenching and construction of electrical transmission facilities, (3) solar CPV assembly and installation, and (4) construction of the substation and O&M building. The Road Construction Emissions Model was used to estimate off-road construction equipment emissions associated with

Rugged Solar LLC Project GHG Analysis Page 25 11280175 Rugged GHG Tech Study - 2-8-12.doc 2/8/2013
construction of 20.5 miles of access roads and 46.5 miles of service roads. The Road Construction Emissions Model was also used to estimate emissions associated with construction of the gen-tie line. Haul trips associated with delivery of materials to the project site and construction worker commutes were estimated using emission factors from EMFAC. Materials were assumed to be transported from the Rancho Bernardo area of San Diego, which is the likely location for production of the solar modules. Worker commutes were conservatively estimated at 35 miles (one way) based on the travel distance from Alpine, Detailed modeling outputs and assumptions are available in Appendix A. Operational Emissions After construction, day-to-day activities associated with operation of the Project would generate minimal GHG emissions from a limited number of sources. GHG emissions were estimated using Project-based activity data, provided by the applicant, and the most recent and relevant emissions factors. Emissions estimates for employee vehicle trips to and from the facility were made using OFFROAD and EMFAC emission factors. EMFAC emission factors account for statewide GHG reduction programs such as the Low-Carbon Fuel Standard and Pavley fuel efficiency regulations. For emissions resulting from energy used at the facility, an emission factor was calculated that forecasts the emission factor in 2020, provided it meets the Renewable Portfolio Standard (RPS) and provides 33% of electricity from renewable sources. A forecasted emissions factor was created for 2020 as that is the year established by AB 32 as a target for achieving reduced statewide GHG emissions (ARB 2008). This forecasted emissions factor was based on the utility-specific emissions factor for SDG&E from 2009, attained from the Power Generation/Electric Utility Reporting Protocol report submitted to the California Climate Action Registry by SDG&E (CCAR 2009) and the 2009 annual Power Content Label (SDG&E 2009) reported to CEC. There is no stationary use of any other fuels. On-site operations activity would include in-place panel washing not more frequently than every 6 to 8 weeks by mobile crews who would also be available for dispatch whenever on-site repairs or other maintenance are required (approximately 9 washes per year). A tanker truck and smaller “satellite” panel washing trucks would be used for panel washing. On-site water storage tanks, installed to provide water for fire protection will include additional capacity available for panel washing.

Page 26 Rugged Solar LLC Project GHG Analysis 11280175 Rugged GHG Tech Study - 2-8-12.doc 2/8/2013
Operational activities associated with maintenance of the gen-tie line would include light- and heavy-duty vehicles for pole structure brushing, herbicide application, and equipment repair. Electric transmission lines may be inspected several times a year via helicopter. Helicopter emissions were estimated using emission factors from the California Climate Action Registry. Operational emissions would also result from intermittent use of two diesel-powered emergency generators for maintenance and testing purposes. Each generator would be run for testing and maintenance approximately one hour each week for a total of 50 hours per year. While the water used for this project will come from local wells, at this time there is no information about the depth of the wells. This would be required to determine the energy required to pump water to the surface and the associated GHG emissions. Because of this limitation, a more conservative estimate of GHG emissions associated with the water used for the project was used that estimates emissions for the transportation, conveyance, and treatment of water that would be used on-site. To estimate these emissions, emission factors from the CEC’s 2006 report, Refining Estimates of Water-Related Energy Use in California (CEC 2006b), were used. A limited amount of wastewater would be conveyed to a water reclamation facility. To be conservative, the IPCC method for estimating emissions from wastewater facilities, as found in the Wastewater Treatment and Discharge chapter of the IPCC Guidelines for National Greenhouse Gas Inventories (IPCC 2006), was used to estimate emissions from the treatment of wastewater generated at the facility. This likely overestimates wastewater emissions because, unlike municipal wastewater, no organic material, which drives GHG emissions in wastewater treatment, would be added to the wastewater coming from the Project. CRITERIA FOR DETERMINING SIGNIFICANCE OF EFFECTS There are no quantitative federal or state significance criteria for global climate change impacts or GHG emissions that pertain to this Project. At the state level, climate change must be addressed in CEQA documents according to Appendix G of the CEQA Guidelines. The selection of significance criteria for this analysis is based on the environmental checklist in Appendix G of the CEQA Guidelines. According to the

Rugged Solar LLC Project GHG Analysis Page 27 11280175 Rugged GHG Tech Study - 2-8-12.doc 2/8/2013
guidelines, the Project under consideration would result in a significant impact related to climate change if it would result in either of the following:
generate GHG emissions, either directly or indirectly, that may have a significant cumulative impact on the environment, or
conflict with an applicable plan, policy, or regulation of an agency adopted for the purpose of reducing the emissions of GHGs.
The County of San Diego Department of Planning and Land Use (DPLU) developed an interim approach for evaluating GHG emissions impacts. The California Air Pollution Control Officers Association (CAPCOA) published various screening thresholds for determining when a climate change analysis would be needed. DPLU recommends using the 900 MT of CO2e per year screening criteria referenced in the CAPCOA white paper (CAPCOA 2008) for determining which projects require further analysis and mitigation. Table 1 describes the general sizes of projects that would generally require a more detailed climate change analysis.
Table 1 Project Size Thresholds
Project Type Size
Single-Family Residential 50 units Apartments / Condominiums 70 units General Commercial Office Space 35,000 square feet Retail Space 11,000 square feet Supermarket / Grocery Space 6,300 square feet
Source: County of San Diego DPLU 2010 If a project meets the above size criteria or does not exceed 900 MT of CO2e per year, then the climate change impacts would be considered less than significant. If a project exceeds 900 MT of CO2e per year, DPLU recommends that the significance be based on whether the project would impede the implementation of AB 32. To demonstrate that a project would not impede the implementation of AB 32, the guidance recommends that a project should demonstrate how the carbon emissions generated by the project would be reduced to 33% below projected “business-as-usual” levels in 2020. The 33% reduction target is based on the San Diego County Greenhouse Gas Inventory: An Analysis of Regional Emissions and Strategies to Achieve AB 32 Targets (Anders et al. 2008).

Page 28 Rugged Solar LLC Project GHG Analysis 11280175 Rugged GHG Tech Study - 2-8-12.doc 2/8/2013
At the time of this writing, no federal, state, regional, or local air quality regulatory agency has adopted a quantitative threshold of significance for construction-related GHG emissions. Many California air districts recommend that construction emissions associated with a project be amortized over the life of the project (typically 30 years) and added to the operational emissions. Therefore, modeled construction-related GHG emissions associated with the Project are discussed first, then operational GHG emissions are totaled and the amortized construction emissions are added to the operational emissions. IMPACT ANALYSIS Impact 1: Generation of Construction-Related and Operational Greenhouse Gas Emissions That Have a Cumulative Effect on the Environment GHG emissions generated by construction of the Project would be primarily in the form of CO2. Although emissions of other GHGs, such as CH4 and N2O, are important with respect to global climate change, the emissions levels of these other GHGs from on- and off-road vehicles used during construction are relatively small compared to the level of CO2 emissions, even when factoring in the relatively larger GWP of CH4 and N2O. Construction-related GHG emissions would be generated by sources such as heavy-duty off-road equipment, trucks hauling materials to the site, and worker commutes during construction of the Project. Construction of the Project would involve localized clearing and grading, construction of primary and secondary access roads, installation of CPV foundations, trenching within each building block for the collection system and communications system, installation of small concrete footing at each pair of inverters and attendant transformer, and installation of a secondary 34.5 kV collection system, including a wood pole mounted 34.5 kV “trunk line,” leading to the 34.5/69 kV project step-up substation and an on-site operations and maintenance facility. While GHG emissions persist in the atmosphere for extended periods of time, construction-related emissions would only be generated during the construction period, which is expected to be up to about 18 months. The maximum construction emissions over the construction period for the Project would be approximately 4,476 MT CO2e.
Rugged Solar LLC Project GHG Analysis Page 29 11280175 Rugged GHG Tech Study - 2-8-12.doc 2/8/2013
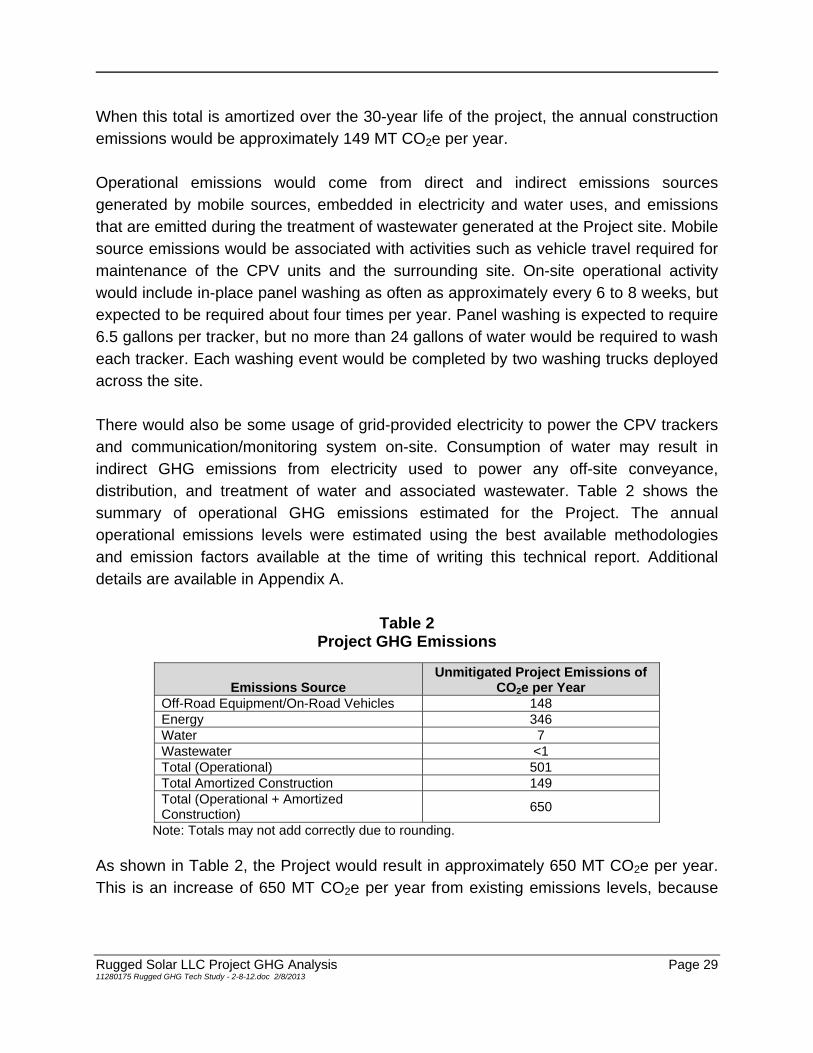
When this total is amortized over the 30-year life of the project, the annual construction emissions would be approximately 149 MT CO2e per year. Operational emissions would come from direct and indirect emissions sources generated by mobile sources, embedded in electricity and water uses, and emissions that are emitted during the treatment of wastewater generated at the Project site. Mobile source emissions would be associated with activities such as vehicle travel required for maintenance of the CPV units and the surrounding site. On-site operational activity would include in-place panel washing as often as approximately every 6 to 8 weeks, but expected to be required about four times per year. Panel washing is expected to require 6.5 gallons per tracker, but no more than 24 gallons of water would be required to wash each tracker. Each washing event would be completed by two washing trucks deployed across the site. There would also be some usage of grid-provided electricity to power the CPV trackers and communication/monitoring system on-site. Consumption of water may result in indirect GHG emissions from electricity used to power any off-site conveyance, distribution, and treatment of water and associated wastewater. Table 2 shows the summary of operational GHG emissions estimated for the Project. The annual operational emissions levels were estimated using the best available methodologies and emission factors available at the time of writing this technical report. Additional details are available in Appendix A.
Table 2 Project GHG Emissions
Emissions Source Unmitigated Project Emissions of
CO2e per Year Off-Road Equipment/On-Road Vehicles 148 Energy 346 Water 7 Wastewater <1 Total (Operational) 501 Total Amortized Construction 149 Total (Operational + Amortized Construction) 650
Note: Totals may not add correctly due to rounding. As shown in Table 2, the Project would result in approximately 650 MT CO2e per year. This is an increase of 650 MT CO2e per year from existing emissions levels, because

Page 30 Rugged Solar LLC Project GHG Analysis 11280175 Rugged GHG Tech Study - 2-8-12.doc 2/8/2013
the existing site is currently used for grazing with minimal GHG emissions resulting from this activity. As shown in Table 2, the total construction-related and operational CO2e emissions associated with the Project would be less than the screening criteria of 900 MT CO2e recommended by DPLU. Therefore, the Project would not require further quantification and would not be anticipated to impede the implementation of AB 32. The Project would not generate GHG emissions, either directly or indirectly, that would have a significant impact on the environment. The impact would be less than significant. Mitigation Measure: No mitigation is required. Impact 2: Conflict with an Applicable Plan, Policy, or Regulation Adopted to Reduce Greenhouse Gas Emissions ARB’s Scoping Plan is the most applicable state plan to evaluate the Project’s actions because it provides the outline for actions to reduce California’s GHG emissions and meet the goals set in AB 32. For more information regarding the Scoping Plan see “Assembly Bill 32 Climate Change Proposed Scoping Plan” on page 20. The Scoping Plan includes measures that would indirectly address GHG emissions levels associated with construction activity, including the phasing in of cleaner technology for diesel engine fleets (including construction equipment) and the development of a Low Carbon Fuel Standard. Policies formulated under the mandate of AB 32, either directly or indirectly applicable to construction-related activities, are assumed to be implemented during construction of the Project if those policies and laws are developed before construction begins. Therefore the Project construction would not conflict with the Scoping Plan. Although construction and operation of the Project would result in an increase of GHG emissions, it is aligned with the goals of AB 32. The Project would provide non-fossil-fuel-based electricity and would support the state’s goal to obtain 33% of all electricity from renewable sources and, therefore, help to achieve 1990 statewide emissions levels by 2020. Because the electricity generated by the Project may be provided to a utility company in an effort to meet that company’s RPS mandate, the Project is not able to take credit for the emissions reductions that would come from supplying clean, carbon-free electricity
Rugged Solar LLC Project GHG Analysis Page 31 11280175 Rugged GHG Tech Study - 2-8-12.doc 2/8/2013
instead of electricity from a typical power plant. However, to demonstrate that the Project is aligned with and supporting the goals of AB 32, the Scoping Plan, and the RPS, the amount of carbon savings that would be derived from implementation of the Project, as opposed to implementation of a carbon-based power plant, was estimated for this report. The total amount of carbon savings from implementation of the Project is estimated at 106,990 MT CO2e per year. After accounting for annual operational emissions and amortized construction emissions of 650 MT CO2e per year (as shown in Table 2), the Project would result in net carbon savings of 106,340 MT CO2e per year. As these emissions reductions are accounted for by a utility that will be using them to meet its RPS goal, the reductions are not factored into the significance findings for this report; however, quantifying them does demonstrate that the Project will assist the state in meeting its RPS goal. As discussed earlier, the Project would not exceed the screening criteria for GHG emissions recommended by San Diego County DPLU. The approach to developing a threshold of significance for GHG emissions is to identify the level of emissions for which a project would not be expected to substantially conflict with existing California legislation that has been adopted to reduce statewide GHG emissions. The Project’s estimated GHG emissions of 650 MT CO2e are below the 900 MT CO2e threshold and would not conflict with any applicable plan, policy, or regulation for the purpose of reducing GHG emissions. This impact would be less than significant. Mitigation Measure: No mitigation is required.

Page 32 Rugged Solar LLC Project GHG Analysis 11280175 Rugged GHG Tech Study - 2-8-12.doc 2/8/2013
CHAPTER 4.0 – EFFECTS OF GLOBAL CLIMATE CHANGE
ON THE PROJECT The level of significance of the impact of global climate change on the Project cannot be determined with certainty because of the variability in climate change models. However, an expected increase in the annual average temperature attributable to global climate change is projected to result in numerous effects in California, such as changes in precipitation patterns, snowpack, runoff, sea level rise, and water quality. Effects on precipitation and snowpack would affect runoff and surface water, but would not affect the physical conditions of the Project site. The Project is located at an elevation that would not be at or affected by a rising sea level, and increased cloud cover is not likely to cause a significant effect on operations. The Project would achieve consistency with state plans and goals, and enhance achievement of the objectives to protect California’s natural resources against the detrimental effects of climate change by generating 80 MW of renewable energy. This would help the state reach its goal, as described in SB X1-2, to obtain 33% of all electricity from renewable sources.

Rugged Solar LLC Project GHG Analysis Page 33 11280175 Rugged GHG Tech Study - 2-8-12.doc 2/8/2013
This page intentionally left blank.

Page 34 Rugged Solar LLC Project GHG Analysis 11280175 Rugged GHG Tech Study - 2-8-12.doc 2/8/2013
CHAPTER 5.0 – BIBLIOGRAPHY
Ahrens, D. C. 2003. Meteorology Today: An Introduction to Weather, Climate, and the
Environment. Brooks Cole, Inc.: Pacific Grove, California. Anders, S. J., D. O. De Haan, N. Silva-Send, S. T. Tanaka, and L. Tyner. 2008. San
Diego County Greenhouse Gas Inventory: An Analysis of Regional Emissions and Strategies to Achieve AB 32 Targets. San Diego, California. University of San Diego.
ARB. See California Air Resources Board. California Air Pollution Control Officers Association (CAPCOA). 2008. CEQA & Climate
Change. Sacramento, California. Available at http://www.climatechange.ca.gov/ publications/others/CAPCOA-1000-2008-010.pdf. Accessed February 2011.
California Air Resources Board (ARB). 2002. Climate Assembly Bill No. 1493.
Sacramento, California. Available at http://www.arb.ca.gov/cc/ccms/documents/ ab1493.pdf. Accessed December 2011.
______. 2007. Executive Order S-01-07. Sacramento, California. January. Available at
http://www.arb.ca.gov/fuels/lcfs/eos0107.pdf. ______. 2008. Climate Change Proposed Scoping Plan. Sacramento, California.
December. Available at www.arb.ca.gov/cc/scopingplan/document/scopingplan document.htm. Accessed December 2011.
______. 2010a. Greenhouse Gas Inventory Data – Graphs. Available at
http://www.arb.ca.gov/cc/inventory/data/graph/graph.htm. Accessed November 2011.
______. 2010b. Heavy-Duty Vehicle Greenhouse Gas Measure. Sacramento,
California. Available at http://www.arb.ca.gov/cc/hdghg/hdghg.htm. Accessed September 12, 2009.

Rugged Solar LLC Project GHG Analysis Page 35 11280175 Rugged GHG Tech Study - 2-8-12.doc 2/8/2013
______. 2011. California Cap on Greenhouse Gas Emissions and Market-Based Compliance Mechanisms. Available at http://www.arb.ca.gov/regact/2010/ capandtrade10/finalfro.pdf.
California Climate Action Registry (CCAR). 2009. 2009 San Diego Gas and Electric
Annual Emission Report. Available at http://www.climateregistry.org/carrot/ Reports/ CREntityEmissionReport.aspx.
California Climate Change Center (CCCC). 2009. Climate Change, Growth, and
California Wildfire. August. Available at http://www.energy.ca.gov/2009 publications/CEC-500-2009-046/CEC-500-2009-046-F.pdf. Accessed November 2011.
California Department of Transportation (Caltrans). 2005. Executive Order S-3-05.
Available at http://www.dot.ca.gov/hq/energy/ExecOrderS-3-05.htm. California Department of Water Resources (DWR). 2006. Progress on Incorporating
Climate Change into Planning and Management of California’s Water Resources, Technical Memorandum Report. Sacramento, California.
______. 2008. Managing an Uncertain Future: Climate Change Adaptation Strategies
for California’s Water. Available at http://www.water.ca.gov/climatechange/ docs/Climate ChangeWhitePaper.pdf. Accessed December 2010.
______. 2012. Executive Update Hydrologic Conditions in California (12/01/2011).
Available at http://cdec.water.ca.gov/cgi-progs/reports/EXECSUM. Accessed January 2012.
California Energy Commission (CEC). 2002. Senate Bill No. 1078. Available at
http://www.energy.ca.gov/portfolio/documents/documents/SB1078.pdf. Accessed December 2011.
______. 2006a. Our Changing Climate: Assessing the Risks to California. Publication
CEC-500-2006-077. July. Available at http://www.energy.ca.gov/2006publicat ions/CEC-500-2006-077/CEC-500-2006-077.pdf. Accessed May 2010.
Page 36 Rugged Solar LLC Project GHG Analysis 11280175 Rugged GHG Tech Study - 2-8-12.doc 2/8/2013
______. 2006b. Refining Estimates of Water-Related Energy Use in California. Publication CEC-500-2006-118. Available at http://www.energy.ca.gov/ 2006publications/CEC-500-2006-118/CEC-500-2006-118.pdf.
California Legislative Counsel (LC). 2008. Senate Bill No. 375. Available at
http://www.leginfo.ca.gov/pub/07-08/bill/sen/sb_0351-0400/sb_375_bill_2008093 0_chaptered.pdf.
California Natural Resources Agency (CNRA). 2009. CEQA Guidelines: 2009 SB 97
Rulemaking. Sacramento, California. Available at http://ceres.ca.gov/ceqa/ guidelines/. Accessed January 4, 2010.
California Office of Planning and Research (OPR). 2007. Senate Bill No. 97.
Sacramento, California. Available at http://opr.ca.gov/docs/SB_97_bill_2007 0824_chaptered.pdf.
CAPCOA. See California Air Pollution Control Officers Association. CEC. See California Energy Commission. County of San Diego Department of Planning and Land Use (DPLU). 2010. Interim
Approach to Addressing Climate Change in CEQA Documents. May. DWR. See California Department of Water Resources. Federal Register (FR). 2009. Vol. 74 No. 239. Endangerment and Cause or Contribute
Findings for Greenhouse Gases Under Section 202(a) of the Clean Air Act; Final Rule. December. Available at http://edocket.access.gpo.gov/2009/pdf/E9-29537.pdf.
______. 2010a. Vol. 75 No. 88. Light-Duty Vehicle Greenhouse Gas Emission
Standards and Corporate Average Fuel Economy Standards; Final Rule. May. Available at http://www.nhtsa.gov/staticfiles/rulemaking/pdf/cafe/CAFE-GHG_ MY_2012-2016_Final_Rule_FR.pdf. Accessed December 2011.

Rugged Solar LLC Project GHG Analysis Page 37 11280175 Rugged GHG Tech Study - 2-8-12.doc 2/8/2013
______. 2010b. Vol. 75 No.208. Mandatory Reporting of Greenhouse Gases. October. Available at http://www.gpo.gov/fdsys/pkg/FR-2010-10-28/pdf/2010-26506.pdf. Accessed December 2011.
Intergovernmental Panel on Climate Change (IPCC). 2006. Guidelines for National Greenhouse Gas Inventories, Volume 5 Waste. Available at http://www.ipcc-nggip.iges.or.jp/public/2006gl/pdf/5_Volume5/V5_6_Ch6_Wastewater.pdf.
______. 2007. Climate Change 2007: The Physical Science Basis. Contribution of
Working Group I to the Fourth Assessment Report of the IPCC. Geneva, Switzerland. February.
LC. See California Legislative Counsel. National Oceanic and Atmospheric Administration (NOAA). 2011. December. Available
at ftp://ftp.ncdc.noaa.gov/pub/data/anomalies/annual.land.90S.90N.df_1901-200 0mean.dat.
OPR. See California Office of Planning and Research. San Diego Foundation. 2008. The San Diego Foundation Regional Focus 2050 Study:
Climate Change Related Impacts in the San Diego Region by 2050. Available at http://sandiegohealth.org/sdfoundation/focus2050/Focus2050_whitepaper_final.pdf. Accessed November 2011.
San Diego Gas and Electric (SDG&E). 2009. Power Content Label. Available at
http://sdge.com/sites/default/files/FINAL092610_PowerLabel.pdf.
Seinfeld, J. H., and S. N. Pandis. 1998. Atmospheric Chemistry and Physics. John Wiley & Sons, Inc. New York, New York.
Shepherd, A., D. Wingham, D. Wallis, K. Giles, S. Laxon, and A. V. Sundal. 2010.
Recent Loss of Floating Ice and the Consequent Sea Level Contribution. Geophysical Research Letters 37. DOI10.1029/2010GL042496.

APPENDIX A
Model Assumptions and Outputs


Rugged GHG Emissions Summary
Construction
Total GHG
Emissions (MT
CO2e)2014 Mobilization 5 Clearing/Grading 339 Road Construction 429 Concrete Batch Plant ‐ Rock Crusher 292 Gen‐Tie Line 256 Trenching ‐ Electrical 748 Tracker Installation 491 O&M Building ‐ Substation 154 Water 118 On‐Road Vehicles 1,378Total ‐ 2014 4,2112015 Concrete Batch Plant ‐ Rock Crusher 24 Trenching ‐ Electrical 86 Tracker Installation 48 Clean‐Up 31 On‐Road Vehicles 100Total ‐ 2015 265Total 4,476Total Amortized Construction (30 Years) 149
Operations
Total GHG
Emissions (MT
CO2e)Off‐Road Equipment 25On‐Road Vehicles 106Gen‐Tie Line 17Total Off‐Road Equipment/On‐Road Vehicles 148Electricity 346Water 7Waste Water 0.32Total 501Total Amortized Construction 149Total (Operational + Amortized Construction) 650

Rugged Solar Farm ‐ Mobilization
Off‐Road Equipment
Total Emissions (tons)
Equipment Equipment Category Number Hours Per Day Total Days CO2 CH4 NO2 Total GHG Emissions
(Metric Tons)Off‐Road Equipment Tractors/Loaders/Backhoes Compos 5 2 7 2.34 0.00 2.13
Note: Assumes off‐road equipment will operate 2 hours per day during mobilization.
Total Emissions (tons)
Total Trips Distance
Average Daily
Mileage
Total
Mileage CO2 CH4 N2O
Total GHG Emissions
(Metric Tons)
Heavy‐Duty Trucks 10 35 350 2,450 1.201 0.0001 0.0001 1.12
Note: Assumes 2 heavy‐duty truck trips (one trip each direction) per piece of construction equipment.
Total Emissions (tons)
Total Trips Distance
Average Daily
Mileage
Total
Mileage CO2 CH4 N2O
Total GHG Emissions
(Metric Tons)
Worker Vehicles 20 35 700 4,900 1.897 0.0002 0.0002 1.79
Note: Assumes 10 workers per day to mobilize equipment.
Total Emissions (tons)
Total CO2 CH4 N2O
Total GHG Emissions
(Metric Tons)
5.44 0.00 0.00 5.04

2/8/2013 12:45:25 AM
Page: 1
Project Name: Rugged - Grading - Trenching - Electrical Transmission - Tracker Installation
On-Road Vehicle Emissions Based on: Version : Emfac2007 V2.3 Nov 1 2006
Off-Road Vehicle Emissions Based on: OFFROAD2007
Combined Annual Emissions Reports (Tons/Year)
Urbemis 2007 Version 9.2.4
Construction Unmitigated Detail Report:
CONSTRUCTION EMISSION ESTIMATES Annual Tons Per Year, Unmitigated
ROG NOx CO SO2 PM10 Dust PM10 Exhaust PM10 PM2.5 Dust PM2.5 Exhaust PM2.5 CO2
2015 TOTALS (tons/year unmitigated) 0.11 0.85 0.44 0.00 0.00 0.03 0.03 0.00 0.03 0.03 146.77
2015 TOTALS (tons/year mitigated) 0.11 0.85 0.44 0.00 0.00 0.03 0.03 0.00 0.03 0.03 146.77
Percent Reduction 0.00 0.00 0.00 0.00 0.00 0.00 0.00 0.00 0.00 0.00 0.00
Percent Reduction 0.00 0.00 0.00 0.00 74.04 0.00 70.05 74.02 0.00 59.18 0.00
2014 TOTALS (tons/year unmitigated) 1.41 11.49 5.56 0.00 8.26 0.47 8.73 1.72 0.43 2.16 1,734.69
2014 TOTALS (tons/year mitigated) 1.41 11.49 5.56 0.00 2.14 0.47 2.61 0.45 0.43 0.88 1,734.69
ROG NOx CO SO2 PM10 Dust PM10 Exhaust PM10 PM2.5 Dust PM2.5 Exhaust
PM2.5 CO2
CONSTRUCTION EMISSION ESTIMATES
Summary Report:

2/8/2013 12:45:25 AM
Page: 2
Phase: Fine Grading 4/10/2014 - 7/1/2014 - Default Fine Site Grading/Excavation Description
Phase Assumptions
2015 0.11 0.85 0.44 0.00 0.03 0.03 146.770.00 0.03 0.00 0.03
0.02Trenching 07/02/2014-01/21/2015 0.07 0.55 0.29 0.00 0.02 94.220.00 0.02 0.00 0.02
Trenching Worker Trips 0.00 0.00 0.02 0.00 0.00 0.00 0.00 0.00 0.00 0.00 3.08
Trenching Off Road Diesel 0.07 0.55 0.27 0.00 0.00 0.02 0.02 0.00 0.02 0.02 91.14
0.01Building 05/30/2014-01/21/2015 0.04 0.30 0.15 0.00 0.01 52.550.00 0.01 0.00 0.01
Building Worker Trips 0.00 0.00 0.00 0.00 0.00 0.00 0.00 0.00 0.00 0.00 0.00
Building Vendor Trips 0.00 0.00 0.00 0.00 0.00 0.00 0.00 0.00 0.00 0.00 0.00
Building Off Road Diesel 0.04 0.30 0.15 0.00 0.00 0.01 0.01 0.00 0.01 0.01 52.55
2014 1.41 11.49 5.56 0.00 8.73 2.16 1,734.698.26 0.47 1.72 0.43
0.22Trenching 07/02/2014-01/21/2015 0.62 5.34 2.62 0.00 0.20 821.810.00 0.22 0.00 0.20
Trenching Worker Trips 0.00 0.01 0.17 0.00 0.00 0.00 0.00 0.00 0.00 0.00 26.84
Trenching Off Road Diesel 0.62 5.34 2.45 0.00 0.00 0.22 0.22 0.00 0.20 0.20 794.97
0.13Building 05/30/2014-01/21/2015 0.46 3.40 1.55 0.00 0.12 540.070.00 0.13 0.00 0.12
Building Worker Trips 0.00 0.00 0.00 0.00 0.00 0.00 0.00 0.00 0.00 0.00 0.00
Building Vendor Trips 0.00 0.00 0.00 0.00 0.00 0.00 0.00 0.00 0.00 0.00 0.00
Building Off Road Diesel 0.46 3.40 1.55 0.00 0.00 0.13 0.13 0.00 0.12 0.12 540.07
8.37Fine Grading 04/10/2014-07/01/2014
0.33 2.74 1.39 0.00 1.83 372.828.26 0.12 1.72 0.11
Fine Grading On Road Diesel 0.02 0.25 0.10 0.00 0.00 0.01 0.01 0.00 0.01 0.01 53.92
Fine Grading Worker Trips 0.00 0.00 0.06 0.00 0.00 0.00 0.00 0.00 0.00 0.00 9.93
Fine Grading Dust 0.00 0.00 0.00 0.00 8.25 0.00 8.25 1.72 0.00 1.72 0.00
Fine Grading Off Road Diesel 0.31 2.49 1.23 0.00 0.00 0.11 0.11 0.00 0.10 0.10 308.96

2/8/2013 12:45:25 AM
Page: 3
1 Tractors/Loaders/Backhoes (108 hp) operating at a 0.55 load factor for 0 hours per day
1 Rubber Tired Dozers (357 hp) operating at a 0.59 load factor for 8 hours per day
1 Water Trucks (189 hp) operating at a 0.5 load factor for 8 hours per day
2 Trenchers (63 hp) operating at a 0.75 load factor for 8 hours per day
1 Forklifts (145 hp) operating at a 0.3 load factor for 8 hours per day
1 Excavators (168 hp) operating at a 0.57 load factor for 8 hours per day
1 Off Highway Trucks (479 hp) operating at a 0.57 load factor for 8 hours per day
1 Generator Sets (549 hp) operating at a 0.74 load factor for 8 hours per day
3 Forklifts (145 hp) operating at a 0.3 load factor for 8 hours per day
2 Cranes (399 hp) operating at a 0.43 load factor for 7 hours per day
Phase: Building Construction 5/30/2014 - 1/21/2015 - Default Building Construction
1 Cement and Mortar Mixers (10 hp) operating at a 0.56 load factor for 8 hours per day
Off-Road Equipment:
Off-Road Equipment:
On Road Truck Travel (VMT): 358.38
2 Rubber Tired Dozers (357 hp) operating at a 0.59 load factor for 8 hours per day
1 Off Highway Trucks (479 hp) operating at a 0.57 load factor for 8 hours per day
Maximum Daily Acreage Disturbed: 7
Total Acres Disturbed: 455
Onsite Cut/Fill: 1376.93 cubic yards/day; Offsite Cut/Fill: 0 cubic yards/day
Fugitive Dust Level of Detail: Low
Off-Road Equipment:
Phase: Trenching 7/2/2014 - 1/21/2015 - Default Trenching Description
1 Cranes (399 hp) operating at a 0.43 load factor for 8 hours per day
1 Bore/Drill Rigs (291 hp) operating at a 0.75 load factor for 8 hours per day
3 Tractors/Loaders/Backhoes (108 hp) operating at a 0.55 load factor for 7 hours per day
2 Scrapers (313 hp) operating at a 0.72 load factor for 8 hours per day
1 Water Trucks (189 hp) operating at a 0.5 load factor for 8 hours per day

2/8/2013 12:45:25 AM
Page: 4
Construction Mitigated Detail Report:
CONSTRUCTION EMISSION ESTIMATES Annual Tons Per Year, Mitigated
ROG NOx CO SO2 PM10 Dust PM10 Exhaust PM10 PM2.5 Dust PM2.5 Exhaust PM2.5 CO2
2014 1.41 11.49 5.56 0.00 2.61 0.88 1,734.692.14 0.47 0.45 0.43
0.22Trenching 07/02/2014-01/21/2015 0.62 5.34 2.62 0.00 0.20 821.810.00 0.22 0.00 0.20
Trenching Worker Trips 0.00 0.01 0.17 0.00 0.00 0.00 0.00 0.00 0.00 0.00 26.84
Trenching Off Road Diesel 0.62 5.34 2.45 0.00 0.00 0.22 0.22 0.00 0.20 0.20 794.97
0.13Building 05/30/2014-01/21/2015 0.46 3.40 1.55 0.00 0.12 540.070.00 0.13 0.00 0.12
Building Worker Trips 0.00 0.00 0.00 0.00 0.00 0.00 0.00 0.00 0.00 0.00 0.00
Building Vendor Trips 0.00 0.00 0.00 0.00 0.00 0.00 0.00 0.00 0.00 0.00 0.00
Building Off Road Diesel 0.46 3.40 1.55 0.00 0.00 0.13 0.13 0.00 0.12 0.12 540.07
2.26Fine Grading 04/10/2014-07/01/2014
0.33 2.74 1.39 0.00 0.55 372.822.14 0.12 0.45 0.11
Fine Grading On Road Diesel 0.02 0.25 0.10 0.00 0.00 0.01 0.01 0.00 0.01 0.01 53.92
Fine Grading Worker Trips 0.00 0.00 0.06 0.00 0.00 0.00 0.00 0.00 0.00 0.00 9.93
Fine Grading Dust 0.00 0.00 0.00 0.00 2.14 0.00 2.14 0.45 0.00 0.45 0.00
Fine Grading Off Road Diesel 0.31 2.49 1.23 0.00 0.00 0.11 0.11 0.00 0.10 0.10 308.96
1 Other Equipment (190 hp) operating at a 0.62 load factor for 8 hours per day
1 Generator Sets (49 hp) operating at a 0.74 load factor for 8 hours per day
2 Off Highway Trucks (479 hp) operating at a 0.57 load factor for 8 hours per day

2/8/2013 12:45:25 AM
Page: 5
2015 0.11 0.85 0.44 0.00 0.03 0.03 146.770.00 0.03 0.00 0.03
0.02Trenching 07/02/2014-01/21/2015 0.07 0.55 0.29 0.00 0.02 94.220.00 0.02 0.00 0.02
Trenching Worker Trips 0.00 0.00 0.02 0.00 0.00 0.00 0.00 0.00 0.00 0.00 3.08
Trenching Off Road Diesel 0.07 0.55 0.27 0.00 0.00 0.02 0.02 0.00 0.02 0.02 91.14
0.01Building 05/30/2014-01/21/2015 0.04 0.30 0.15 0.00 0.01 52.550.00 0.01 0.00 0.01
Building Worker Trips 0.00 0.00 0.00 0.00 0.00 0.00 0.00 0.00 0.00 0.00 0.00
Building Vendor Trips 0.00 0.00 0.00 0.00 0.00 0.00 0.00 0.00 0.00 0.00 0.00
Building Off Road Diesel 0.04 0.30 0.15 0.00 0.00 0.01 0.01 0.00 0.01 0.01 52.55
PM10: 84% PM25: 84%
For Soil Stablizing Measures, the Water exposed surfaces 3x daily watering mitigation reduces emissions by:
PM10: 61% PM25: 61%
For Soil Stablizing Measures, the Apply soil stabilizers to inactive areas mitigation reduces emissions by:
The following mitigation measures apply to Phase: Fine Grading 4/10/2014 - 7/1/2014 - Default Fine Site Grading/Excavation Description
Construction Related Mitigation Measures

2/8/2013 12:21:22 AM
Page: 1
Project Name: Rugged - O&M Building and Substation Construction
On-Road Vehicle Emissions Based on: Version : Emfac2007 V2.3 Nov 1 2006
Off-Road Vehicle Emissions Based on: OFFROAD2007
Combined Annual Emissions Reports (Tons/Year)
Urbemis 2007 Version 9.2.4
Construction Unmitigated Detail Report:
CONSTRUCTION EMISSION ESTIMATES Annual Tons Per Year, Unmitigated
ROG NOx CO SO2 PM10 Dust PM10 Exhaust PM10 PM2.5 Dust PM2.5 Exhaust PM2.5 CO2
2014 TOTALS (tons/year unmitigated) 0.29 1.06 0.50 0.00 0.00 0.04 0.04 0.00 0.04 0.04 168.71
ROG NOx CO SO2 PM10 Dust PM10 Exhaust PM10 PM2.5 Dust PM2.5 Exhaust
PM2.5 CO2
CONSTRUCTION EMISSION ESTIMATES
Summary Report:
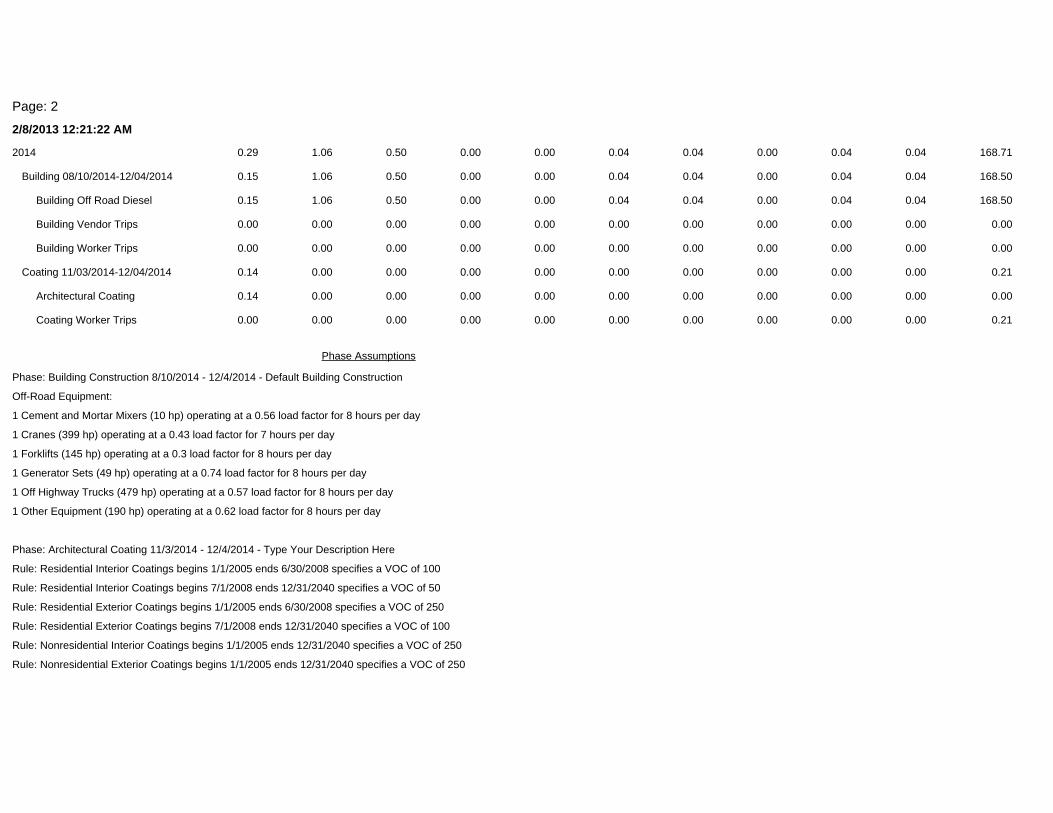
2/8/2013 12:21:22 AM
Page: 2
Rule: Residential Interior Coatings begins 1/1/2005 ends 6/30/2008 specifies a VOC of 100
Rule: Residential Interior Coatings begins 7/1/2008 ends 12/31/2040 specifies a VOC of 50
Phase: Architectural Coating 11/3/2014 - 12/4/2014 - Type Your Description Here
Rule: Nonresidential Interior Coatings begins 1/1/2005 ends 12/31/2040 specifies a VOC of 250
Rule: Nonresidential Exterior Coatings begins 1/1/2005 ends 12/31/2040 specifies a VOC of 250
Rule: Residential Exterior Coatings begins 1/1/2005 ends 6/30/2008 specifies a VOC of 250
Rule: Residential Exterior Coatings begins 7/1/2008 ends 12/31/2040 specifies a VOC of 100
Off-Road Equipment:
1 Cement and Mortar Mixers (10 hp) operating at a 0.56 load factor for 8 hours per day
1 Other Equipment (190 hp) operating at a 0.62 load factor for 8 hours per day
Phase: Building Construction 8/10/2014 - 12/4/2014 - Default Building Construction
1 Generator Sets (49 hp) operating at a 0.74 load factor for 8 hours per day
1 Off Highway Trucks (479 hp) operating at a 0.57 load factor for 8 hours per day
1 Cranes (399 hp) operating at a 0.43 load factor for 7 hours per day
1 Forklifts (145 hp) operating at a 0.3 load factor for 8 hours per day
Phase Assumptions
2014 0.29 1.06 0.50 0.00 0.04 0.04 168.710.00 0.04 0.00 0.04
0.00Coating 11/03/2014-12/04/2014 0.14 0.00 0.00 0.00 0.00 0.210.00 0.00 0.00 0.00
Coating Worker Trips 0.00 0.00 0.00 0.00 0.00 0.00 0.00 0.00 0.00 0.00 0.21
Architectural Coating 0.14 0.00 0.00 0.00 0.00 0.00 0.00 0.00 0.00 0.00 0.00
0.04Building 08/10/2014-12/04/2014 0.15 1.06 0.50 0.00 0.04 168.500.00 0.04 0.00 0.04
Building Worker Trips 0.00 0.00 0.00 0.00 0.00 0.00 0.00 0.00 0.00 0.00 0.00
Building Vendor Trips 0.00 0.00 0.00 0.00 0.00 0.00 0.00 0.00 0.00 0.00 0.00
Building Off Road Diesel 0.15 1.06 0.50 0.00 0.00 0.04 0.04 0.00 0.04 0.04 168.50

2/8/2013 12:21:22 AM
Page: 3
Construction Mitigated Detail Report:
CONSTRUCTION EMISSION ESTIMATES Annual Tons Per Year, Mitigated
Construction Related Mitigation Measures

Rugged ‐ Service & Access Roads
Emission Estimates for ‐> Total Exhaust Fugitive Dust Total Exhaust Fugitive Dust
Project Phases (English Units) ROG (lbs/day) CO (lbs/day) NOx (lbs/day) PM10 (lbs/day) PM10 (lbs/day) PM10 (lbs/day) PM2.5 (lbs/day) PM2.5 (lbs/day) PM2.5 (lbs/day) CO2 (lbs/day)
Grubbing/Land Clearing 8.6 76.4 39.6 2.7 2.7 ‐ 1.8 1.8 ‐ 14,517.7
Grading/Excavation 9.2 80.7 46.9 3.1 3.1 ‐ 2.2 2.2 ‐ 15,297.9
Drainage/Utilities/Sub‐Grade 7.6 72.8 24.3 2.2 2.2 ‐ 1.5 1.5 ‐ 13,224.2
Paving ‐ ‐ ‐ ‐ ‐ ‐ ‐ ‐ ‐ ‐
Maximum (pounds/day) 9.2 80.7 46.9 3.1 3.1 ‐ 2.2 2.2 ‐ 15,297.9
Total (tons/construction project) 0.3 2.5 1.2 0.1 0.1 ‐ 0.1 0.1 ‐ 473.4
Notes: Project Start Year ‐> 2014
Project Length (months) ‐> 3
Total Project Area (acres) ‐> 162
Maximum Area Disturbed/Day (acres) ‐> 7
Total Soil Imported/Exported (yd3/day)‐> 0
Emission Estimates for ‐> Total Exhaust Fugitive Dust Total Exhaust Fugitive Dust
Project Phases (Metric Units) ROG (kgs/day) CO (kgs/day) NOx (kgs/day) PM10 (kgs/day) PM10 (kgs/day) PM10 (kgs/day) PM2.5 (kgs/day) PM2.5 (kgs/day) PM2.5 (kgs/day) CO2 (kgs/day)
Grubbing/Land Clearing 3.9 34.7 18.0 1.2 1.2 ‐ 0.8 0.8 ‐ 6,599.0
Grading/Excavation 4.2 36.7 21.3 1.4 1.4 ‐ 1.0 1.0 ‐ 6,953.6
Drainage/Utilities/Sub‐Grade 3.4 33.1 11.1 1.0 1.0 ‐ 0.7 0.7 ‐ 6,011.0
Paving ‐ ‐ ‐ ‐ ‐ ‐ ‐ ‐ ‐ ‐
Maximum (kilograms/day) 4.2 36.7 21.3 1.4 1.4 ‐ 1.0 1.0 ‐ 6,953.6
Total (megagrams/construction project) 0.3 2.3 1.1 0.1 0.1 ‐ 0.1 0.1 ‐ 429.4
Notes: Project Start Year ‐> 2014
Project Length (months) ‐> 3
Total Project Area (hectares) ‐> 162
Maximum Area Disturbed/Day (hectares) ‐> 7
Total Soil Imported/Exported (meters3/day)‐> 0
Source: Road Construction Emissions Model, Version 7.1.2
Total PM10 emissions shown in column F are the sum of exhaust and fugitive dust emissions shown in columns H and I. Total PM2.5 emissions shown in Column J are the sume of exhaust and fugitive dust emissions shown in
Rugged ‐ Service & Access Roads
PM10 and PM2.5 estimates assume 50% control of fugitive dust from watering and associated dust control measures if a minimum number of water trucks are specified.
Total PM10 emissions shown in column F are the sum of exhaust and fugitive dust emissions shown in columns H and I. Total PM2.5 emissions shown in Column J are the sum of exhaust and fugitive dust emissions shown in
Rugged ‐ Service & Access Roads
PM10 and PM2.5 estimates assume 50% control of fugitive dust from watering and associated dust control measures if a minimum number of water trucks are specified.

Rugged Solar Farm ‐ On‐Road Vehicles ‐ 2014
Total Emissions (tons)
Total Trips Distance
Average Daily
Mileage
Total
Mileage CO2 CH4 N2O
Total GHG Emissions
(Metric Tons)
Heavy‐Duty Trucks 50 170 8,500 1,870,000 916.387 0.0586 0.0760 856.48
Note: Assumes 4 total truck trips (2 round trips) per tracker for a total of 14,352 trips for the project, or an average of 50 trips per day.
Total Emissions (tons)
Total Trips Distance
Average Daily
Mileage
Total
Mileage CO2 CH4 N2O
Total GHG Emissions
(Metric Tons)
Worker Vehicles 186 35 6,510 1,432,200 554.612 0.0449 0.0582 521.98
Notes: Assumes a maximum of 186 trips per day during the peak construction period.
Total Emissions (tons)
Total CO2 CH4 N2O
Total GHG Emissions
(Metric Tons)
1,471.00 0.10 0.13 1,378.46
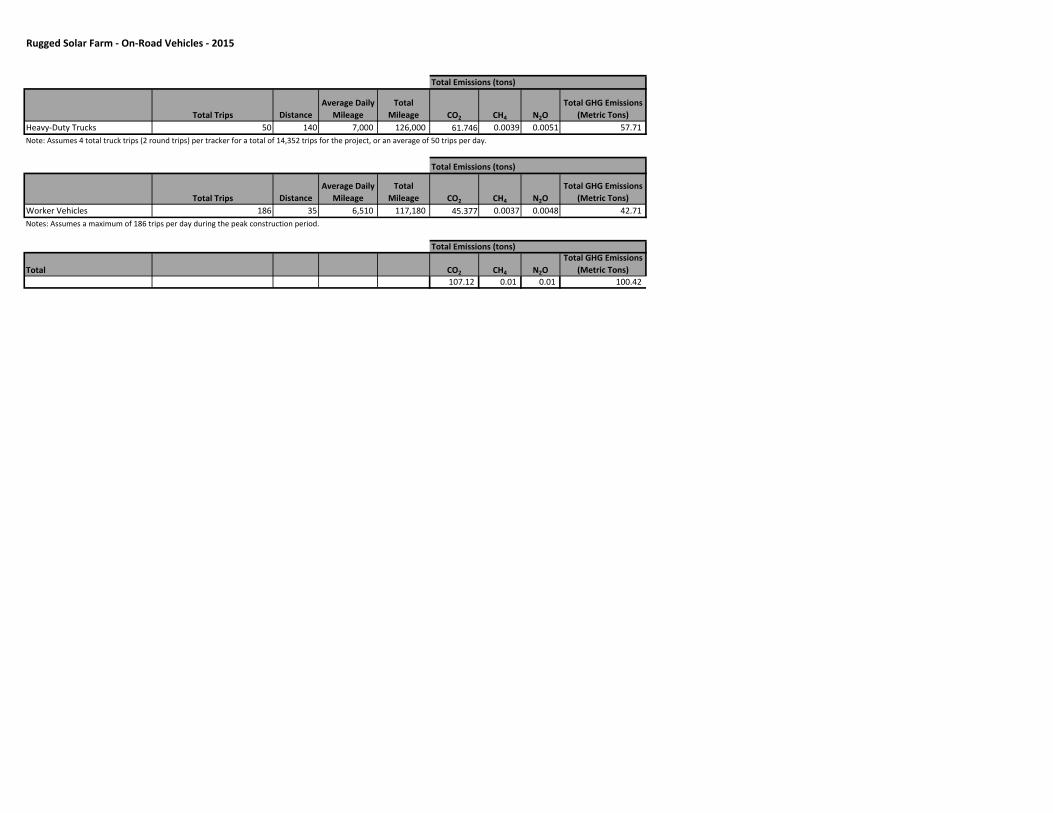
Rugged Solar Farm ‐ On‐Road Vehicles ‐ 2015
Total Emissions (tons)
Total Trips Distance
Average Daily
Mileage
Total
Mileage CO2 CH4 N2O
Total GHG Emissions
(Metric Tons)
Heavy‐Duty Trucks 50 140 7,000 126,000 61.746 0.0039 0.0051 57.71
Note: Assumes 4 total truck trips (2 round trips) per tracker for a total of 14,352 trips for the project, or an average of 50 trips per day.
Total Emissions (tons)
Total Trips Distance
Average Daily
Mileage
Total
Mileage CO2 CH4 N2O
Total GHG Emissions
(Metric Tons)
Worker Vehicles 186 35 6,510 117,180 45.377 0.0037 0.0048 42.71
Notes: Assumes a maximum of 186 trips per day during the peak construction period.
Total Emissions (tons)
Total CO2 CH4 N2O
Total GHG Emissions
(Metric Tons)
107.12 0.01 0.01 100.42

Rugged Solar ‐ Concrete Batch Plant ‐ Haul Trucks ‐ 2014
Batch Plant Capacity 11,756 cubic yard concrete
Days of Operation per Year = 220
Pounds Tons
Volume (cu
yds)
Truck Capacity
(cu yds)
Number of
Trucks
Aggregate 21,924,940 10,962 8,120 Sand 16,787,568 8,394 6,218 20 310.88 Cement 5,772,196 2,886 2,274 20 113.72 Cement supplement 858,188 429 338 20 16.91 Water 232,920 Total material 45,342,892 22,671 441.50
Note: Water quantity is listed in gallons Aggregate assumed to be produced on site. Water to be provided by on‐site wells
Heavy‐Duty Truck EmissionsTotal Emissions (tons)
Maximum
Trips per
Day Distance
Average Daily
Mileage
Total
Mileage CO2 CH4 N2O
Total
GHG
Emissions
(Metric
Sand 4 55 220 48,400 91.82 0.00027 0.00026 83.63
Cement 2 55 110 24,200 45.91 0.00014 0.00013 41.82
Cement supplement 2 55 110 24,200 45.91 0.00014 0.00013 41.82
Concrete Trucks 20 1 20 4,400 8.35 0.00002 0.00002 7.60
Total 440 96,800 183.63 0.00054 0.00051 167.26
Note: Materials are assumed to be delivered from San Diego to the project site.
Global Warming Potential
Gas
Atmospheric Lifetime
(years)
Global
Warming
Potential
(100 year
time
h i )Carbon Dioxide 50‐200 1Methane 12 ± 3 21Nitrous Oxide 120 310
Volume/weight conversionMaterials necessary to produce 1 cubic yard concrete 1 cubic yard
Pounds(1) Tons
Pounds Per
Cubic YardAggregate 1,865 0.93 Aggregate 2700Sand 1,428 0.71 Sand 2700Cement 491 0.25 Cement 2538Cement supplement 73 0.04 Cement supple 2538
Total Solid Material 3,857 1.93
Liters GallonsWater 75 19.81
Source: EPA AP‐42 Section 11.12 Concrete Batching

Rugged Batch Plant/Rock Crushing Facility ‐ Generator Emissions ‐ 2014
Off‐Road Equipment
Total Emissions (tons)
Equipment Equipment Category Number Hours Per Day Total Days CO2 CH4 NO2Total GHG Emissions
(Metric Tons)Generator Batch Plant ‐ Generator 2 8 220 137.19 0.02 125.15
Note: Assumes a total of 2 generators for the batch plant and rock crushing facility

Rugged Solar ‐ Concrete Batch Plant ‐ Haul Trucks ‐ 2015
Batch Plant Capacity 962 cubic yard concrete
Days of Operation per Year = 18
Pounds Tons
Volume (cu
yds)
Truck Capacity
(cu yds)
Number of
Trucks
Aggregate 1,794,130 897 664 Sand 1,373,736 687 509 20 25.44 Cement 472,342 236 186 20 9.31 Cement supplement 70,226 35 28 20 1.38 Water 19,060 Total material 3,710,434 1,855 36.13
Note: Water quantity is listed in gallons Aggregate assumed to be produced on site. Water to be provided by on‐site wells
Heavy‐Duty Truck EmissionsTotal Emissions (tons)
Maximum
Trips per
Day Distance
Average Daily
Mileage
Total
Mileage CO2 CH4 N2O
Total
GHG
Emissions
(Metric
Sand 4 55 220 3,960 7.51 0.00002 0.00002 6.84
Cement 2 55 110 1,980 3.76 0.00001 0.00001 3.42
Cement supplement 2 55 110 1,980 3.76 0.00001 0.00001 3.42
Concrete Trucks 20 1 20 360 0.68 0.00000 0.00000 0.62
Total 440 7,920 15.02 0.00004 0.00004 13.69
Note: Materials are assumed to be delivered from San Diego to the project site.
Global Warming Potential
Gas
Atmospheric Lifetime
(years)
Global
Warming
Potential
(100 year
time
h i )Carbon Dioxide 50‐200 1Methane 12 ± 3 21Nitrous Oxide 120 310
Volume/weight conversionMaterials necessary to produce 1 cubic yard concrete 1 cubic yard
Pounds(1) Tons
Pounds Per
Cubic YardAggregate 1,865 0.93 Aggregate 2700Sand 1,428 0.71 Sand 2700Cement 491 0.25 Cement 2538Cement supplement 73 0.04 Cement supple 2538
Total Solid Material 3,857 1.93
Liters GallonsWater 75 19.81
Source: EPA AP‐42 Section 11.12 Concrete Batching

Rugged Batch Plant/Rock Crushing Facility ‐ Generator Emissions ‐ 2015
Off‐Road Equipment
Total Emissions (tons)
Equipment Equipment Category Number Hours Per Day Total Days CO2 CH4 NO2Total GHG Emissions
(Metric Tons)Generator Batch Plant ‐ Generator 2 8 18 11.22 0.00 10.24
Note: Assumes a total of 2 generators for the batch plant and rock crushing facility

Rugged Solar Farm ‐ Clean Up
Total Emissions (tons)
Total Trips Distance
Average Daily
Mileage
Total
Mileage CO2 CH4 N2O
Total GHG Emissions
(Metric Tons)
Worker Vehicles 40 35 1,400 84,000 32.529 0.0026 0.0034 30.61
Note: Assumes 20 workers per day to complete the "punch list" and clean up the project site.

Gen‐Tie Line ‐ Off‐Road Construction/Worker Commutes
Emission Estimates for ‐> Total Exhaust Fugitive Dust Total Exhaust Fugitive Dust
Project Phases (English Units) ROG (lbs/day) CO (lbs/day) NOx (lbs/day) PM10 (lbs/day) PM10 (lbs/day) PM10 (lbs/day) PM2.5 (lbs/day) PM2.5 (lbs/day) PM2.5 (lbs/day) CO2 (lbs/day)
‐ ‐ ‐ ‐ ‐ ‐ ‐ ‐ ‐ ‐
Site Access Roads 6.4 36.0 72.1 26.1 3.3 22.8 7.8 3.0 4.7 6,962.6
Pole Installation 4.1 22.7 44.1 24.9 2.2 22.8 6.7 1.9 4.7 4,878.2
Conductor Installation 1.8 8.8 12.2 1.0 1.0 ‐ 0.9 0.9 ‐ 1,782.9
Maximum (pounds/day) 6.4 36.0 72.1 26.1 3.3 22.8 7.8 3.0 4.7 6,962.6
Total (tons/construction project) 0.1 0.7 1.4 0.6 0.1 0.6 0.2 0.1 0.1 149.9
Notes: Project Start Year ‐> 2014
Project Length (months) ‐> 3
Total Project Area (acres) ‐> 9
Maximum Area Disturbed/Day (acres) ‐> 2
Total Soil Imported/Exported (yd3/day)‐> 0
Emission Estimates for ‐> Total Exhaust Fugitive Dust Total Exhaust Fugitive Dust
Project Phases (Metric Units) ROG (kgs/day) CO (kgs/day) NOx (kgs/day) PM10 (kgs/day) PM10 (kgs/day) PM10 (kgs/day) PM2.5 (kgs/day) PM2.5 (kgs/day) PM2.5 (kgs/day) CO2 (kgs/day)
‐ ‐ ‐ ‐ ‐ ‐ ‐ ‐ ‐ ‐
Site Access Roads 2.9 16.4 32.8 11.9 1.5 10.3 3.5 1.4 2.2 3,164.8
Pole Installation 1.9 10.3 20.0 11.3 1.0 10.3 3.0 0.9 2.2 2,217.4
Conductor Installation 0.8 4.0 5.6 0.5 0.5 ‐ 0.4 0.4 ‐ 810.4
Maximum (kilograms/day) 2.9 16.4 32.8 11.9 1.5 10.3 3.5 1.4 2.2 3,164.8
Total (megagrams/construction project) 0.1 0.7 1.3 0.6 0.1 0.5 0.2 0.1 0.1 135.9
Notes: Project Start Year ‐> 2014
Project Length (months) ‐> 3
Total Project Area (hectares) ‐> 9
Maximum Area Disturbed/Day (hectares) ‐> 2
Total Soil Imported/Exported (meters3/day)‐> 0
Source: Road Construction Emissions Model, Version 7.1.2
PM10 and PM2.5 estimates assume 50% control of fugitive dust from watering and associated dust control measures if a minimum number of water trucks are specified.
Total PM10 emissions shown in column F are the sum of exhaust and fugitive dust emissions shown in columns H and I. Total PM2.5 emissions shown in Column J are the sume of exhaust and fugitive dust emissions shown in
Rugged ‐ Gen‐Tie Line
PM10 and PM2.5 estimates assume 50% control of fugitive dust from watering and associated dust control measures if a minimum number of water trucks are specified.
Total PM10 emissions shown in column F are the sum of exhaust and fugitive dust emissions shown in columns H and I. Total PM2.5 emissions shown in Column J are the sum of exhaust and fugitive dust emissions shown in
Rugged ‐ Gen‐Tie Line

Gen‐Tie LineOn‐Road Construction Emissions
Total Emissions (tons)
Total Daily Round Trips Distance
Average
Daily Total Mileage CO2 CH4 N2O
Total GHG Emissions
(Metric Tons)
Pole Installation 8 134 1,072 64,320 122 0.00036 0.00034 111 Concrete Trucks 16 5 80 4,800 9 0.00003 0.00003 8 Total 1,152 69,120 131.12 0.00 0.00 119.43
Notes:
Material delivery for pole installation assumes 67 miles per trip from San Diego to the project siteConcrete trucks are assumed to travel approximately 35 miles from Alpine to the project site
Emission factors from EMFAC 2011 for San Diego County

Activity
Time Frame
(workdays)1Water Use
(gallons) Acres
Total Estimated Water Demand
(gallons)
Total Estimated Water Demand
(acre‐feet)
Site preparation (clearing, grading)2 40 52,400 455 23,842,000 73.17
Application of Water/Soil Binding Agent3 260 3,300 455 1,501,500 4.61
Total Construction Water 25,343,500 77.78
1. Assumes 20 workdays per month
2. Assumes 0.160 acre‐feet of water per acre (ac‐ft/ac) would be used for site preparation (Project Description)
3. Assumes 0.01 acre‐feet (3,300 gallons) of water application per acre (Project Description)
Energy Factor for Outdoor water use for Southern
CA (kWh/MG) 1 MWh
Emission Factor
CO2 2
(lb/MWh)
11,110 281.57 919.64CH4
2 N2O2 (lb/MWh) Total CO2e
0.029 0.01 117.92
Total Estimated Water for Temporary Project Construction
Rugged GHG Emission From Construction Water Usage
1‐ CEC. 2006 (December).Refining Estimates of Water‐Related Energy Use in California
prepared by Navigant Consulting, Inc.
2 ‐Emission factor: LGOP 2010 V1.1 Table G.7 California Grid Average Electricity Emission
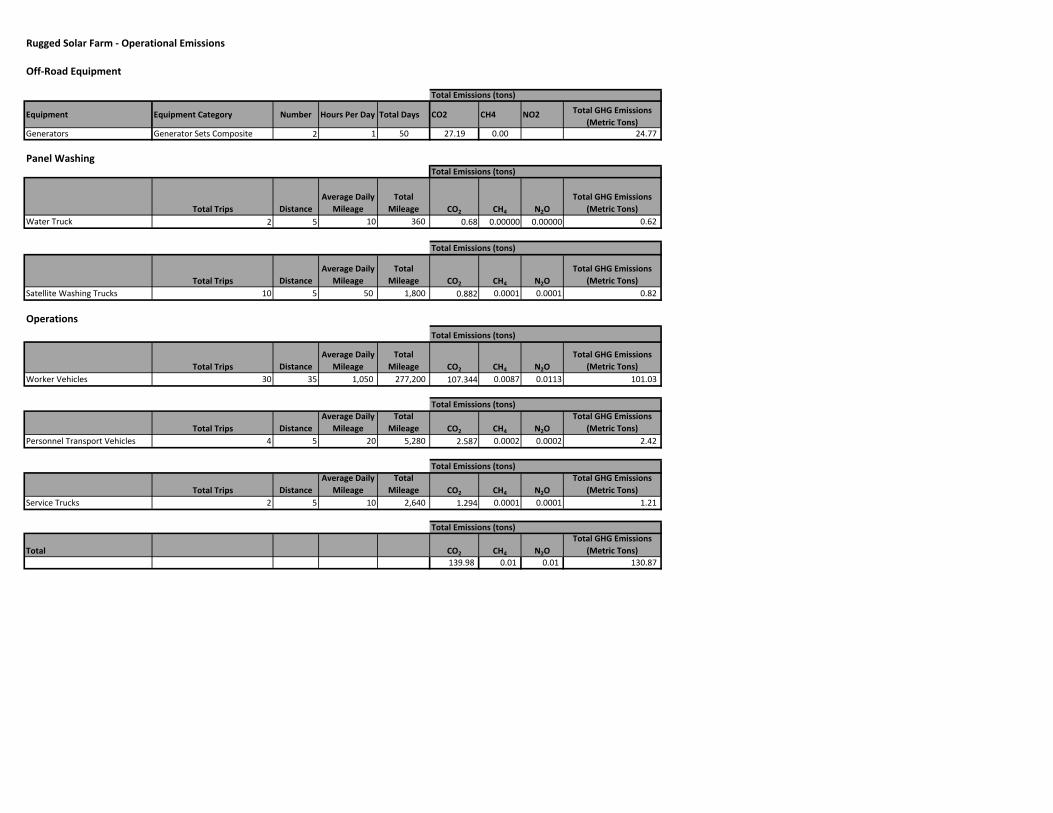
Rugged Solar Farm ‐ Operational Emissions
Off‐Road Equipment
Total Emissions (tons)
Equipment Equipment Category Number Hours Per Day Total Days CO2 CH4 NO2 Total GHG Emissions
(Metric Tons)Generators Generator Sets Composite 2 1 50 27.19 0.00 24.77
Panel WashingTotal Emissions (tons)
Total Trips Distance
Average Daily
Mileage
Total
Mileage CO2 CH4 N2O
Total GHG Emissions
(Metric Tons)
Water Truck 2 5 10 360 0.68 0.00000 0.00000 0.62
Total Emissions (tons)
Total Trips Distance
Average Daily
Mileage
Total
Mileage CO2 CH4 N2O
Total GHG Emissions
(Metric Tons)
Satellite Washing Trucks 10 5 50 1,800 0.882 0.0001 0.0001 0.82
Operations
Total Emissions (tons)
Total Trips Distance
Average Daily
Mileage
Total
Mileage CO2 CH4 N2O
Total GHG Emissions
(Metric Tons)
Worker Vehicles 30 35 1,050 277,200 107.344 0.0087 0.0113 101.03
Total Emissions (tons)
Total Trips Distance
Average Daily
Mileage
Total
Mileage CO2 CH4 N2O
Total GHG Emissions
(Metric Tons)
Personnel Transport Vehicles 4 5 20 5,280 2.587 0.0002 0.0002 2.42
Total Emissions (tons)
Total Trips Distance
Average Daily
Mileage
Total
Mileage CO2 CH4 N2O
Total GHG Emissions
(Metric Tons)
Service Trucks 2 5 10 2,640 1.294 0.0001 0.0001 1.21
Total Emissions (tons)
Total CO2 CH4 N2O
Total GHG Emissions
(Metric Tons)
139.98 0.01 0.01 130.87

Gen‐Tie Line ‐ Operational EmissionsHeavy‐Duty Vehicles
Total Emissions (tons)
Total Trips Distance
Average
Daily
Mileage
Total
Mileage CO2 CH4 N2O
Total
GHG
Emissions
(Metric
Equipment Repair Vehicles 3 38 228 1,140 2.16 0.00001 0.00001 2
Notes:
Assumes 3 HHDT for equipment repair
Mileage is based on distance from Alpine to the project site (approximately 35 miles) and length of the Gen‐Tie line (3 miles)
Light‐Duty VehiclesTotal Emissions (tons)
Total Trips Distance
Average
Daily
Mileage
Total
Mileage CO2 CH4 N2O
Total
GHG
Emissions
(Metric
Pole Structure Brushing 3 38 228 5,472 2.119 0.0002 0.0002 1.99
Notes:
Assumes 3 worker vehicles, 3 LDA vehicles for pole structure brushing, 3 employee vehicles for herbicide application, and 3 LDA vehicles for equipment repair
Mileage is based on distance from Alpine to the project site (approximately 35 miles) and length of the Gen‐Tie line (3 miles)
Total Emissions (tons)
Total Trips Distance
Average
Daily
Mileage
Total
Mileage CO2 CH4 N2O
Total
GHG
Emissions
(Metric
Herbicide Application 3 38 228 5,472 2.119 0.0002 0.0002 1.99
Notes:
Assumes 3 worker vehicles, 3 LDA vehicles for pole structure brushing, 3 employee vehicles for herbicide application, and 3 LDA vehicles for equipment repair
Mileage is based on distance from Alpine to the project site (approximately 35 miles) and length of the Gen‐Tie line (3 miles)
Total Emissions (tons)
Total Trips Distance
Average
Daily
Mileage
Total
Mileage CO2 CH4 N2O
Total
GHG
Emissions
(Metric
Equipment Repair 3 38 228 1,140 0.441 0.0000 0.0000 0.42
Notes:
Assumes 3 worker vehicles, 3 LDA vehicles for pole structure brushing, 3 employee vehicles for herbicide application, and 3 LDA vehicles for equipment repair
Mileage is based on distance from Alpine to the project site (approximately 35 miles) and length of the Gen‐Tie line (3 miles)
HelicopterTotal Emissions (tons)
Fuel Consumption Per Hour
(gal) Hours per Day
Days Per
Year Total Hours CO2 CH4 N2O
Total
GHG
Emissions
(Metric
15 8 2 16 2.003 0.002 0.000 1.86
Notes:
Helicopter assumed to be a Robinson 44 model with a fuel consumption of 15 gal/hr. U.S. Department of Interior, National Business Center, Aviation Management Directiv
Emission factors for fuel consumption from California Climate Action Registry
Total Total Trips
Average
Daily
Mileage
Total
Mileage CO2 CH4 N2O
Total
GHG
Emissions
(Metric
12 912 13,224 8.85 0.00 0.00 8.24
Total Emissions (tons)

Rugged ‐ Electricity‐Related GHG Emissions
Equipment
Electricity
Draw (watts)1 Assumptions
Annual
Energy Usage
(kWh) # of Building Block # of CPV units3
Building Block
Annual Energy
usage
Tracker annual
kWh usage
Total
Annual
kWh
Per Tracker: 61 3,588 153,094 1,222,109 1,375,203
Tracker Control Unit: 50
The control unit only uses energy
during daylight hours 219
CO2 Emission
Coefficient1
(lbs/kWh)
CH4 Emission
Coefficient2
(lbs/kWh)
N20 Emission
Coefficient2
(lbs/kWh)Tracker Motor (only one
used at a time): 250
Each tracker motor runs for one
minute every hour 18 0.55014 0.000029 0.000014
Air Drying Unit: 192
per day and for 10 hours every 3
weeks 103
Total Per Tracker 341
Per Building Block:
Field communications: 300 Operates during daylight hours 1314
Inverters: 100 The Inverter operates at night 438
PV Box Ventilation: 173 Operates during daylight hours 758
Total Per Building Block 2510
1 ‐ Equipment energy usage information and assumptions come from Rugged Solar LLC
Annual Emissions (MT
CO2e/yr)
Equipment Electricity Assumptions Rugged GHG Emission from Electricity Usage
2 ‐ LGOP Table G.7 California Grid Average Electricity Emission Factors (1990‐2007)
3 ‐ From most recent Project Description
346.26
1 ‐ Estimated 2020 SDG&E emission factor with 33% renewable energy

Energy Factor for
Outdoor water use
for Southern CA
(kWh/MG)1 MWh
Emission Factor
CO2 2
(lb/MWh)
Number of gallons/acre1 165011,110 16.95 919.64
Acres2 455 CH42 N2O
2 (lb/MWh) (MT CO2e/yr)
Water use/year (gallons) 750,750 0.029 0.01 7.10
Water use/year (acre‐feet) 2.30
Washes/year 9
Number of Trackers 3,588
Gallons/tracker/wash 24
water use/year (gallons) 775,008
water use/year (acre‐feet) 2.38
Total water use (gallons/year) 1,525,758
Total water use (acre‐feet/year) 4.68
1. Based on suppression activities of 3,300 gallons every 2 years
3. 1 acre‐foot = 325,851 gallons
Rugged Operational Water Use Rugged GHG Emission From Operational Water Usage
Dust Suppression
1‐ CEC. 2006 (December).Refining Estimates of Water‐Related Energy Use in California prepared by
N i t C lti IPanel Washing 1 ‐Emission factor: LGOP 2010 V1.1 Table G.7 California Grid Average Electricity Emission Factors
2. Based on constructed acres within the project site. Open space areas are
not included in estimates for dust suppression
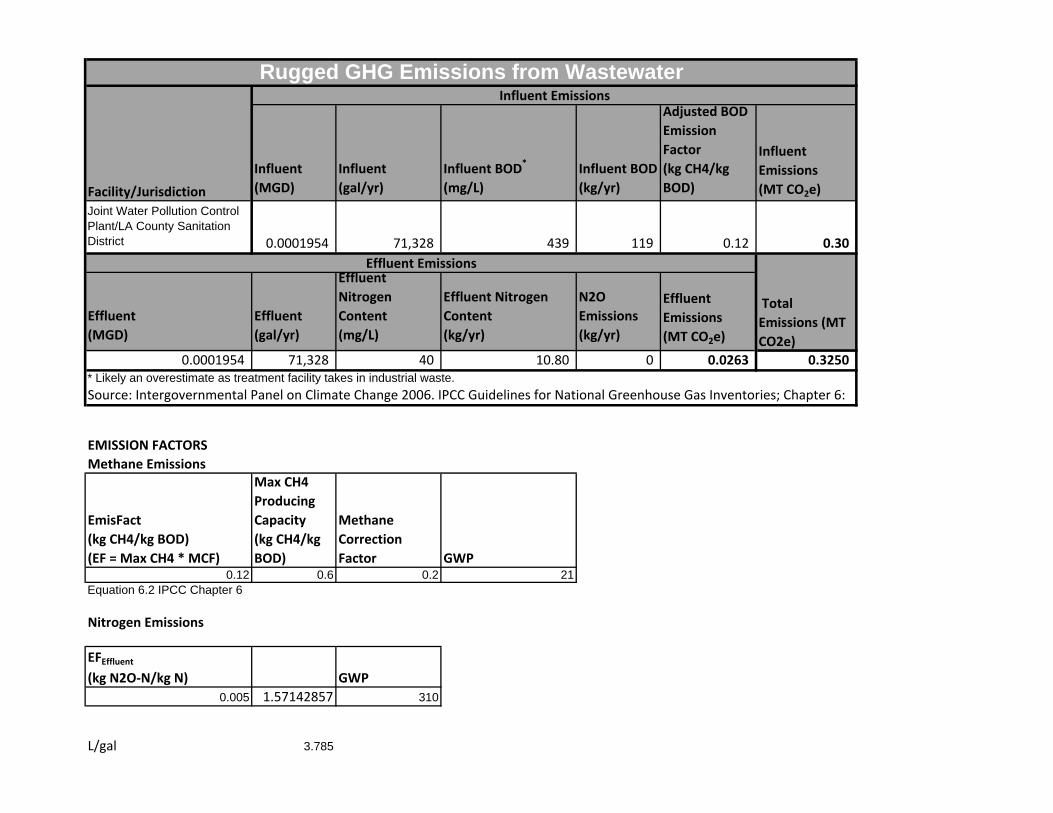
Influent
(MGD)
Influent
(gal/yr)
Influent BOD*
(mg/L)
Influent BOD
(kg/yr)
Adjusted BOD
Emission
Factor
(kg CH4/kg
BOD)
Influent
Emissions
(MT CO2e)
Joint Water Pollution Control Plant/LA County Sanitation District 0.0001954 71,328 439 119 0.12 0.30
Effluent
(MGD)
Effluent
(gal/yr)
Effluent
Nitrogen
Content
(mg/L)
Effluent Nitrogen
Content
(kg/yr)
N2O
Emissions
(kg/yr)
Effluent
Emissions
(MT CO2e)
0.0001954 71,328 40 10.80 0 0.0263 0.3250
EMISSION FACTORS
Methane Emissions
EmisFact
(kg CH4/kg BOD)
(EF = Max CH4 * MCF)
Max CH4
Producing
Capacity
(kg CH4/kg
BOD)
Methane
Correction
Factor GWP0.12 0.6 0.2 21
Equation 6.2 IPCC Chapter 6
Nitrogen Emissions
EFEffluent(kg N2O‐N/kg N) GWP
0.005 1.57142857 310
L/gal 3.785
Rugged GHG Emissions from Wastewater
* Likely an overestimate as treatment facility takes in industrial waste. Source: Intergovernmental Panel on Climate Change 2006. IPCC Guidelines for National Greenhouse Gas Inventories; Chapter 6:
Facility/Jurisdiction
Influent Emissions
Effluent Emissions
Total
Emissions (MT
CO2e)

Rugged GHG Emissions Offset
Maximum Installed Capacity (MWDC)
kWhAC per Installed kWDC
Annual Output Output (kWh)
CO2
Emission Factor
(lb/kWh)
CH4
Emission Factor
(lb/kWh)
N2O Emission
Factor (lb/kWh)
Annual GHG Offset
105.235 2,083 219,204,505 1.071 0.000029 0.000014 106,990Notes:CO2 emission factor based on 739.05 lb/MWh in 2008 andSource:http://www.sdge.com/sites/default/files/FINAL092610_PowerLabel.pdf

RUGGED SOLAR LLC PROJECT CLIMATE CHANGE AND
GREENHOUSE GAS EMISSIONS ANALYSIS
Major Use Permit 3300-12-007
Prepared for:
County of San Diego Department of Planning and Land Use
Contact: Larry Hofreiter 5201 Ruffin Road, Suite B
San Diego, California 92123 (858) 694-2960
Project Proponent:
Rugged Solar LLC c/o Soitec Solar Development LLC 4250 Executive Square, Suite 770
San Diego, California 92037
Prepared by:
AECOM 1420 Kettner Boulevard, Suite 500
San Diego, California 92101 (619) 233-1454
February 2013December 2012


Rugged Solar LLC Project GHG Analysis Page i 11280175 Rugged GHG Tech Study - 2-8-12.doc 12/13/2013
TABLE OF CONTENTS Section Page
ACRONYMS AND ABBREVIATIONS ............................................................................. iii
CHAPTER 1.0 – INTRODUCTION .................................................................................. 1
CHAPTER 2.0 – AFFECTED ENVIRONMENT ............................................................... 3 Project Location .................................................................................................... 3 Project Description ............................................................................................... 3 Environmental Setting .......................................................................................... 6
Global Climate Trends and Associated Impacts ........................................ 8 Greenhouse Gas Emission Sources ........................................................ 11
Regulatory Setting .............................................................................................. 14 Federal Plans, Policies, Regulations, and Laws ...................................... 14 State Plans, Policies, Regulations, and Laws .......................................... 15 Regional and Local Plans, Policies, Regulations, and Ordinances .......... 20
CHAPTER 3.0 – ENVIRONMENTAL CONSEQUENCES AND MITIGATION MEASURES .................................................................................................................. 23
Analysis Methodology ......................................................................................... 23 Construction Emissions ........................................................................... 24 Operational Emissions ............................................................................. 25
Criteria for Determining Significance of Effects .................................................. 26 Impact Analysis .................................................................................................. 28
CHAPTER 4.0 – EFFECTS OF GLOBAL CLIMATE CHANGE ON THE PROJECT ..... 32
CHAPTER 5.0 – BIBLIOGRAPHY................................................................................. 34
APPENDIX A. Model Assumptions and Outputs
Page ii Rugged Solar LLC Project GHG Analysis 11280175 Rugged GHG Tech Study - 2-8-12.doc 12/13/2013
LIST OF FIGURES Figure Page 1 Regional Map ....................................................................................................... 4 2 Vicinity Map .......................................................................................................... 5 3 2008 California GHG Emissions by Sector (2000–2008 Emission Inventory) .... 13 4 San Diego County’s Greenhouse Gas Emissions by Economic Sector (2006) .. 14
LIST OF TABLES
Table Page 1 Project Size Thresholds ...................................................................................... 27 2 Project GHG Emissions ...................................................................................... 29
Rugged Solar LLC Project GHG Analysis Page iii 11280175 Rugged GHG Tech Study - 2-8-12.doc 12/13/2013
ACRONYMS AND ABBREVIATIONS AB Assembly Bill APN Assessor’s Parcel Numbers APS Alternative Planning Strategy ARB California Air Resources Board CAA Clean Air Act CAL/EPA California Environmental Protection Agency CAPCOA California Air Pollution Control Officers Association CCAA California Clean Air Act CCCC California Climate Change Center CEC California Energy Commission CPV concentrating photovoltaic CEQA California Environmental Quality Act CH4 methane CO2 carbon dioxide CO2e carbon dioxide equivalent DOT Department of Transportation DPLU Department of Planning and Land Use DWR California Department of Water Resources EPA Environmental Protection Agency GHG greenhouse gas GWP global warming potential HFC hydrofluorocarbon IPCC Intergovernmental Panel on Climate Change kV kilovolt MMT million metric tons MW megawatt MPO Metropolitan Planning Organization MT metric tons N2O nitrous oxide PFCs perfluorocarbons RPS Renewable Portfolio Standard RTP Regional Transportation Plan SANDAG San Diego Association of Governments SB Senate Bill SCS Sustainable Communities Strategy SF6 sulfur hexafluoride TAC toxic air contaminants

Page iv Rugged Solar LLC Project GHG Analysis 11280175 Rugged GHG Tech Study - 2-8-12.doc 12/13/2013
This page intentionally left blank.
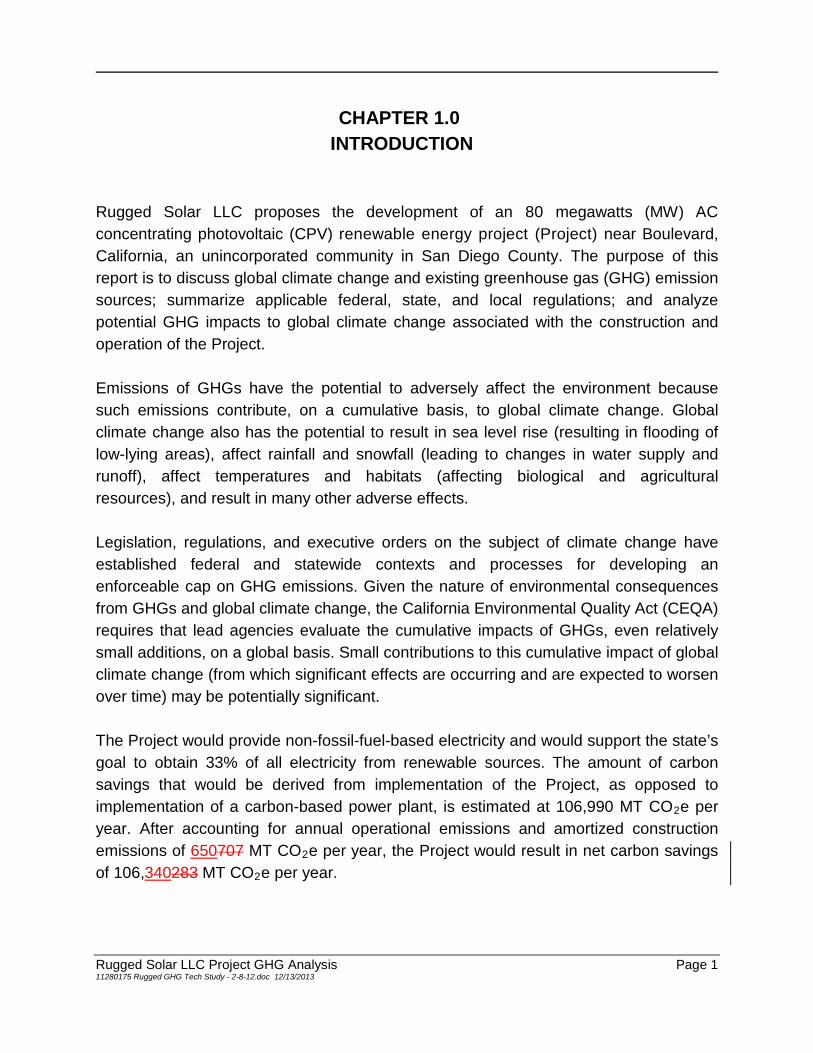
Rugged Solar LLC Project GHG Analysis Page 1 11280175 Rugged GHG Tech Study - 2-8-12.doc 12/13/2013
CHAPTER 1.0 – INTRODUCTION
Rugged Solar LLC proposes the development of an 80 megawatts (MW) AC concentrating photovoltaic (CPV) renewable energy project (Project) near Boulevard, California, an unincorporated community in San Diego County. The purpose of this report is to discuss global climate change and existing greenhouse gas (GHG) emission sources; summarize applicable federal, state, and local regulations; and analyze potential GHG impacts to global climate change associated with the construction and operation of the Project. Emissions of GHGs have the potential to adversely affect the environment because such emissions contribute, on a cumulative basis, to global climate change. Global climate change also has the potential to result in sea level rise (resulting in flooding of low-lying areas), affect rainfall and snowfall (leading to changes in water supply and runoff), affect temperatures and habitats (affecting biological and agricultural resources), and result in many other adverse effects. Legislation, regulations, and executive orders on the subject of climate change have established federal and statewide contexts and processes for developing an enforceable cap on GHG emissions. Given the nature of environmental consequences from GHGs and global climate change, the California Environmental Quality Act (CEQA) requires that lead agencies evaluate the cumulative impacts of GHGs, even relatively small additions, on a global basis. Small contributions to this cumulative impact of global climate change (from which significant effects are occurring and are expected to worsen over time) may be potentially significant. The Project would provide non-fossil-fuel-based electricity and would support the state’s goal to obtain 33% of all electricity from renewable sources. The amount of carbon savings that would be derived from implementation of the Project, as opposed to implementation of a carbon-based power plant, is estimated at 106,990 MT CO2e per year. After accounting for annual operational emissions and amortized construction emissions of 650707 MT CO2e per year, the Project would result in net carbon savings of 106,340283 MT CO2e per year.

Page 2 Rugged Solar LLC Project GHG Analysis 11280175 Rugged GHG Tech Study - 2-8-12.doc 12/13/2013
This page intentionally left blank.

Rugged Solar LLC Project GHG Analysis Page 3 11280175 Rugged GHG Tech Study - 2-8-12.doc 12/13/2013
CHAPTER 2.0 – AFFECTED ENVIRONMENT
PROJECT LOCATION Figure 1 shows the Project’s relationship to San Diego County, which is located in southern California in the unincorporated community of Boulevard. Figure 2 shows the project’s relationship to the surrounding unincorporated community of Boulevard and provides the context of local geography/major landforms/points of interest. The project site is located approximately 1.25 miles north of Interstate 8 (I-8) and extends roughly 2 miles between Ribbonwood Road and approximately 0.5 mile east of McCain Valley Road. PROJECT DESCRIPTION The Project would produce up to 80 megawatts (MW) of alternating current (AC) solar generating capacity. The Project would consist of approximately 3,588 concentrating photovoltaic electric generation systems utilizing dual axis tracking CPV trackers on 765 acres in southeastern San Diego County in the unincorporated community of Boulevard, California. In addition to the CPV trackers and inverter transformer units, the Project includes the following primary components:
• A collection system linking the CPV trackers to the on-site Project substation composed of (i) 1,000-volt (V) direct current underground conductors leading to (ii) 34.5-kilovolt (kV) underground and overhead AC conductors.
• A 7,500-square-foot (sf) (60 feet by 125 feet) operations and maintenance (O&M) building.
• A 2-acre on-site private collector substation site with a pad area of 6,000 sf (60 feet by 100 feet) with maximum height of 35 feet and includes a 450-sf (15 feet by 30 feet) control house.
• 61 Inverter/Transformer enclosures. The dimensions of each inverter unit are 10 feet by 25 or 40 feet (250 or 400 sf each) with a total structure height of up to 12 feet.
Page 4 Rugged Solar LLC Project GHG Analysis 11280175 Rugged GHG Tech Study - 2-8-12.doc 12/13/2013
Figure 1 Regional Map 8.5 x 11
Rugged Solar LLC Project GHG Analysis Page 5 11280175 Rugged GHG Tech Study - 2-8-12.doc 12/13/2013
Figure 2 Vicinity Map 8.5 x 11

Page 6 Rugged Solar LLC Project GHG Analysis 11280175 Rugged GHG Tech Study - 2-8-12.doc 12/13/2013
• A 3-mile overhead generator transmission line (gen-tie) connecting the on-site substation to SDG&E’s proposed new Boulevard Substation.
• 20.5 miles of newly constructed load-bearing on-site access roads.
• 46.5 miles of graded, non-load-bearing dirt service roads.
• Temporary concrete batch plant and rock crushing facility.
• Three permanent on-site water wells for project construction, the O&M building and to facilitate washing of the CPV trackers.
• Two 20,000 gallon water storage tanks to be located at the O&M building and to be dedicated exclusively for fire suppression.
• Three additional on-site 20,000 gallon water storage tanks to support tracker washing. Each of these three 20,000 gallon water storage tanks would include 10,000 gallons of water dedicated solely for fire suppression. The outlet on the tank for tracker washing and any other non-fire uses would be located at the midpoint on the tank making it impossible to draw the water level down below 10,000 gallons in each tank for non-fire suppression use.
• A septic tank system and leach field for the O&M building.
• 6-foot perimeter fencing topped with an additional 1 foot of security barbed wire
ENVIRONMENTAL SETTING Climate is the accumulation of daily and seasonal weather events over a long period of time, whereas weather is defined as the condition of the atmosphere at any particular time and place (Ahrens 2003). The Project is located in a climatic zone characterized as dry-summer subtropical or Mediterranean. Scientific Basis of Climate Change Certain gases in Earth’s atmosphere, classified as GHGs, play a critical role in determining Earth’s surface temperature. As solar radiation enters Earth’s atmosphere from space, a portion of the radiation is absorbed by the Earth’s surface and a smaller portion of this radiation is reflected back toward space. The absorbed radiation is emitted from Earth as low-frequency infrared radiation; however, the infrared radiation is absorbed by GHGs in the atmosphere. As a result, the radiation that otherwise would have escaped back into space is instead “trapped” in the atmosphere, resulting in a

Rugged Solar LLC Project GHG Analysis Page 7 11280175 Rugged GHG Tech Study - 2-8-12.doc 12/13/2013
warming of the atmosphere. This phenomenon, known as the greenhouse effect, is responsible for maintaining a habitable climate on Earth. Without the greenhouse effect, Earth would not be able to support life as we know it. Key GHGs contributing to the greenhouse effect are carbon dioxide (CO2), methane (CH4), nitrous oxide (N2O), hydrofluorocarbons (HFCs), perfluorocarbons (PFCs), and sulfur hexafluoride (SF6). Human-generated emissions of these GHGs in excess of natural ambient concentrations are responsible for intensifying the greenhouse effect and have led to a trend of unnatural warming of Earth’s climate, known as global climate change or global warming. It is unlikely that global climate change of the past 50 years can be explained without acknowledging the contribution from human activities (IPCC 2007). Climate change is a global problem. GHGs are global pollutants, unlike criteria air pollutants and toxic air contaminants (TAC), which are pollutants of regional and local concern. Whereas pollutants with localized air quality effects have relatively short atmospheric lifetimes (approximately 1 day), GHGs have much longer atmospheric lifetimes of 1 year to several thousand years, which allow GHGs to be dispersed around Earth. Although the exact lifetime of any particular GHG molecule is dependent on multiple variables and cannot be pinpointed, it is understood by scientists who study atmospheric chemistry that more CO2 is emitted into the atmosphere than is sequestered by ocean uptake, vegetation, and other forms of sequestration. Of the total annual human-caused CO2 emissions, approximately 54% is sequestered within 1 year through ocean uptake, northern hemisphere forest regrowth, and other terrestrial sinks. The remaining 46% of human-caused CO2 emissions remains stored in the atmosphere (Seinfeld and Pandis 1998). Similarly, impacts of GHGs are borne globally, as opposed to localized air quality effects of criteria air pollutants and TACs. The quantity of GHGs that it takes to ultimately result in climate change is not precisely known; suffice it to say, the quantity is enormous, and no single project alone would measurably contribute to a noticeable incremental change in the global average temperature, or to a global, local, or micro climate. From the standpoint of CEQA, GHG impacts to global climate change are inherently cumulative.

Page 8 Rugged Solar LLC Project GHG Analysis 11280175 Rugged GHG Tech Study - 2-8-12.doc 12/13/2013
Global Climate Trends and Associated Impacts Trends of Climate Change Warming of the climate system is now considered to be unequivocal (IPCC 2007), with global surface temperature increasing approximately 1.33 degrees Fahrenheit (°F) over the last 100 years. The rate of increase in global average surface temperature over the last 100 years has not been consistent; the last three decades have warmed at a much faster rate—on average, 0.32°F per decade. Nine of the 10 warmest years in the instrumental record of global average surface temperature have occurred since 2000 (NOAA 2011). Continued warming is projected to increase the global average temperature by 2°F to 11°F over the next 100 years. The causes of this warming have been identified as both natural processes and as the result of human actions. The Intergovernmental Panel on Climate Change (IPCC) concluded that variations in natural phenomena, such as solar radiation and volcanoes, produced most of the warming from pre-industrial times to 1950, and had a small cooling effect afterward. However, after 1950, increasing GHG concentrations resulting from human activity, such as fossil fuel burning and deforestation, have been responsible for most of the observed temperature increase. Impacts of Climate Change Over the same period that increased global warming has occurred, many other changes have occurred or are predicted to occur in other natural systems. Sea levels have risen; precipitation patterns throughout the world have shifted, with some areas becoming wetter and others drier; wildfires are predicted to increase in number and intensity; extreme weather events such as heat waves have increased; and numerous other conditions have been observed. Although it is difficult to prove a definitive cause-and-effect relationship between global warming and other observed changes to natural systems, there is a high level of confidence within the scientific community that these changes are a direct result of increased global temperatures caused by increased presence of GHGs in the atmosphere (IPCC 2007). Historical trends and predictions of future climate change effects in the above topic areas are discussed below.
Rugged Solar LLC Project GHG Analysis Page 9 11280175 Rugged GHG Tech Study - 2-8-12.doc 12/13/2013
Precipitation and Snowpack An analysis of trends in total annual precipitation in the western United States by the National Weather Service’s Climate Prediction Center provides evidence that annual precipitation has increased in much of California, the Colorado River Basin, and elsewhere in the west since the mid-1960s (DWR 2006). When these same precipitation data are sorted into three regions—northern, central, and southern California—trends show that precipitation in the northern portion of the state appears to have increased slightly from 1890 to 2002, and precipitation in the central and southern portions of the state show slightly decreasing trends. Although existing data indicate some level of change in precipitation trends in California, more analysis is needed to determine whether changes in California’s regional annual precipitation totals have occurred as the result of climate change or other factors (DWR 2006). As a result of climate change, global average precipitation is expected to increase during the 21st century. While precipitation is generally expected to increase on a global scale, significant regional variations in precipitation trends can be expected. Specifically in California, precipitation is projected to increase in the northern region during the winter months. Various California climate models provide mixed results regarding forecasted changes in total annual precipitation in the state through the end of this century. Therefore, no conclusion on an increase or decrease can be provided (IPCC 2007). Although global climate change models generally predict an increase in overall precipitation on a worldwide scale, there is no such consistency among the results of regional models applied to California. An increase in the global average temperature is expected to result in a decreased volume of precipitation falling as snow in California and an overall reduction in snowpack in the Sierra Nevada Mountains. Snowpack in the Sierra Nevada provides both water supply (runoff) and storage (within the snowpack before melting), and is a major water source for the state. According to the California Energy Commission (CEC) (2006a), the snowpack portion of the water supply could potentially decline from 30% to 90% by the end of the 21st century. California’s annual snowpack, on average, has the greatest accumulations from November through the end of March. The snowpack typically melts from April through

Page 10 Rugged Solar LLC Project GHG Analysis 11280175 Rugged GHG Tech Study - 2-8-12.doc 12/13/2013
July. As temperatures rise, a declining proportion of total precipitation falls as snow, more winter runoff occurs, and remaining snow melts sooner and faster in spring. In some basins, spring peak runoff may increase; in others, runoff volumes may shift to earlier in the spring and winter months (DWR 2006). In some instances, runoff peak levels may increase and occur earlier. California’s reservoir managers use snowmelt to help fill reservoirs once the threat of large winter and early spring storms and related flooding risks have passed. An analysis conducted by the California Department of Water Resources (DWR) (2006) on the effect of rising temperatures on snowpack shows that a 5.4°F rise in average annual temperature would likely cause snowlines to rise approximately 1,500 feet. This would result in an annual loss of approximately 5 million acre-feet of water storage in the snowpack. This would represent a loss of approximately 23% of the total storage capacity of all key reservoirs in California (DWR 2012). Sea Level Rise Another major area of concern related to global climate change is sea level rise. Worldwide average sea level appears to have risen approximately 0.4 to 0.7 feet over the past century based on data collected from tide gauges around the globe, coupled with satellite measurements taken over approximately the last 15 years (IPCC 2007). Various gauge stations along the California coast show an increase similar to the global trends. Rising average sea level over the past century has been attributed primarily to warming of the world’s oceans, the related thermal expansion of ocean waters, and the addition of water to the world’s oceans from the melting of land-based polar ice (IPCC 2007). Melting sea-based polar ice will have a much smaller impact on sea level rise, and is not currently modeled in sea level rise estimates (Shepherd et al. 2010). A consistent rise in sea level has been recorded worldwide over the last 100 years. According to IPCC, sea level rise is expected to continue, and increase by up to 23 inches by the year 2099 (IPCC 2007). Other climate models estimate an even greater increase in sea level rise of 55 inches by the year 2100 (DWR 2008). Although these projections are on a global scale, the rate of relative sea level rise experienced at many locations along California’s coast correlates well with the worldwide average rate of rise observed over the past century. Therefore, it is reasonable to expect that changes in worldwide average sea level will also be experienced along California’s coast through

Rugged Solar LLC Project GHG Analysis Page 11 11280175 Rugged GHG Tech Study - 2-8-12.doc 12/13/2013
this century (DWR 2006); however, the amount and timing of the expected sea level rise that will be experienced along California’s coast is uncertain. Heat Waves Historically, extreme warm temperatures in the San Diego region have mostly occurred in July and August, but as climate warming continues, the occurrences of these events will likely begin in June and could continue to take place into September. All simulations indicate that hot daytime and nighttime temperatures (heat waves) will increase in frequency, magnitude, and duration (San Diego Foundation 2008). Wildfires Different climate change models yield somewhat different predictions about the frequency, timing, and severity of future Santa Ana wind conditions (which are a major driver of large wildfires in San Diego County), leading to uncertainty about how fire regimes may change in the future. Analyses by the California Climate Change Center (CCCC) show that significant increases in large wildfire occurrences and burned areas are likely to occur by mid-century, with very large increases by 2085. The latter is mainly due to the effects of projected temperature increases on evapotranspiration, compounded by reduced precipitation (CCCC 2009). Greenhouse Gas Emission Sources Emissions of GHGs contributing to global climate change are attributable in large part to human activities associated with the transportation, industrial/manufacturing, electric utility, residential, commercial, and agricultural sectors. Emissions of CO2 are byproducts of fossil fuel combustion, and CH4, a highly potent GHG, is the primary component in natural gas and is associated with agricultural practices and landfills. N2O is also largely attributable to agricultural practices and soil management. For purposes of accounting for and regulating GHG emissions, sources of GHG emissions are grouped into emissions sectors. The California Air Resources Board (ARB) identifies the following main GHG emissions sectors that account for most anthropogenic GHG emissions generated within California:
• Transportation: On-road motor vehicles, recreational vehicles, aviation, ships, and rail
Page 12 Rugged Solar LLC Project GHG Analysis 11280175 Rugged GHG Tech Study - 2-8-12.doc 12/13/2013
• Electricity: Use and production of electrical energy
• Industry: Mainly stationary sources (e.g., boilers and engines) associated with process emissions
• Commercial and Residential: Area sources, such as landscape maintenance equipment, fireplaces, and consumption of natural gas for space and water heating
• Agriculture: Agricultural sources that include off-road farm equipment; irrigation pumps; crop residue burning (CO2); and emissions from flooded soils, livestock waste, crop residue decomposition, and fertilizer volatilization (CH4 and N2O)
• High Global Warming Potential (GWP) Gases: Refrigerants and electrical insulation (e.g., SF6), among other sources
• Recycling and Waste: Waste management facilities and landfills; primary emissions are CO2 from combustion and CH4 from landfills and wastewater treatment
State Greenhouse Gas Emissions Inventory ARB performs an annual GHG inventory for emissions and sinks of the six major GHGs (CO2, CH4, N2O, hydrofluorocarbons, chlorofluorocarbons, and SF6). As shown in Figure 3, California produced 477.7 million gross metric tons (MT) of CO2 equivalent (CO2e) in 2008 (ARB 2010a). CO2e is a measurement used to account for the fact that different GHGs have different potential to retain infrared radiation in the atmosphere and contribute to the greenhouse effect. This potential, known as the global warming potential (GWP) of a GHG, is dependent on the lifetime, or persistence, of the gas molecule in the atmosphere. Expressing emissions in CO2e takes the contributions of all GHG emissions to the greenhouse effect and converts them to a single unit equivalent to the effect that would occur if only CO2 were being emitted. The inventory is divided into the ARB-created categories or sectors of emissions: transportation, electricity generation, industrial, commercial, residential, agriculture and forestry, and not specified (i.e., recycling and waste, and high GWP gases). Combustion of fossil fuel in the transportation sector was the single largest source of California’s

Rugged Solar LLC Project GHG Analysis Page 13 11280175 Rugged GHG Tech Study - 2-8-12.doc 12/13/2013
Figure 3 2008 California GHG Emissions by Sector (2000–2008 Emission Inventory)
MMT=million metric tons
GHG emissions in 2008, accounting for 36% of total GHG emissions in the state. The transportation sector was followed by the electric power sector, which accounts for 24% of total GHG emissions in the state (including in- and out-of-state sources), and the industrial sector, which accounts for 21% of total GHG emissions in the state (ARB 2010a). Regional Greenhouse Gas Emission Inventory The University of San Diego School of Law, Energy Policy Initiative Center prepared a GHG inventory for San Diego County (Anders et al. 2008). The inventory included estimates of GHG emissions for 1990, 2006, and 2020. Based on the existing inventory and the projections for the region, the University of San Diego found that emissions of GHGs must be reduced to 33% below “business-as-usual” conditions to achieve 1990 emission levels by the year 2020. As shown in Figure 4, total GHG emissions in San Diego County in 2006 were estimated to be 34 million metric tons (MMT) of CO2e. Transportation is the largest emissions sector, accounting for 16 MMT of CO2e, or 46% of total emissions. Energy consumption, including electricity and natural gas use, is the next largest source of emissions, at 34% of the total.
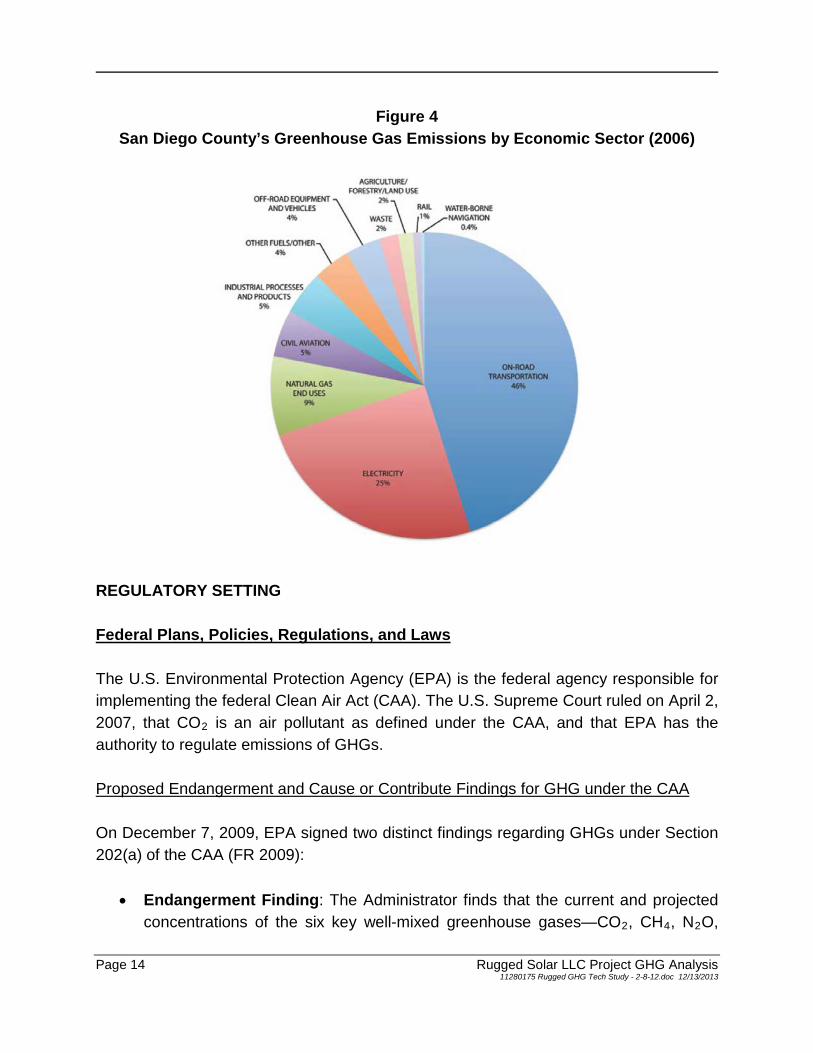
Page 14 Rugged Solar LLC Project GHG Analysis 11280175 Rugged GHG Tech Study - 2-8-12.doc 12/13/2013
Figure 4 San Diego County’s Greenhouse Gas Emissions by Economic Sector (2006)
REGULATORY SETTING Federal Plans, Policies, Regulations, and Laws The U.S. Environmental Protection Agency (EPA) is the federal agency responsible for implementing the federal Clean Air Act (CAA). The U.S. Supreme Court ruled on April 2, 2007, that CO2 is an air pollutant as defined under the CAA, and that EPA has the authority to regulate emissions of GHGs. Proposed Endangerment and Cause or Contribute Findings for GHG under the CAA On December 7, 2009, EPA signed two distinct findings regarding GHGs under Section 202(a) of the CAA (FR 2009):
• Endangerment Finding: The Administrator finds that the current and projected concentrations of the six key well-mixed greenhouse gases—CO2, CH4, N2O,

Rugged Solar LLC Project GHG Analysis Page 15 11280175 Rugged GHG Tech Study - 2-8-12.doc 12/13/2013
HFCs, PFCs, and SF6—in the atmosphere threaten the public health and welfare of current and future generations.
• Cause or Contribute Finding: The Administrator finds that the combined emissions of these well-mixed greenhouse gases from new motor vehicles and new motor vehicle engines contribute to the greenhouse gas pollution, which threatens public health and welfare.
These findings do not themselves impose any requirements on industry or other entities. However, this action was a prerequisite to finalizing EPA’s proposed GHG emissions standards for light-duty vehicles. On November 16, 2011, the Department of Transportation’s (DOT) and EPA proposed stringent federal GHG and fuel economy standards for model years 2017 to 2025 passenger cars and light-duty trucks. In addition to the standards for light-duty vehicles, DOT and EPA announced standards on August 9, 2011, to reduce GHG emissions and improve the fuel efficiency of heavy-duty trucks and buses. Mandatory Greenhouse Gas Reporting Rule On September 22, 2009, EPA published the Final Mandatory Greenhouse Gas Reporting Rule (Reporting Rule) in the Federal Register (FR 2010b). The Reporting Rule requires reporting of GHG data and other relevant information from fossil fuel and industrial GHG suppliers, vehicle and engine manufacturers, and all facilities that would emit 25,000 MT or more of CO2e per year. Facility owners are required to submit an annual report with detailed calculations of facility GHG emissions due on March 31 for emissions in the previous calendar year. The Reporting Rule also mandates recordkeeping and administrative requirements to enable EPA to verify the annual GHG emissions reports. Owners of existing facilities that commenced operation prior to January 1, 2011, are required to submit an annual report for calendar year 2011. State Plans, Policies, Regulations, and Laws ARB is the agency responsible for coordination and oversight of state and local air pollution control programs in California and for implementing the California Clean Air Act (CCAA).

Page 16 Rugged Solar LLC Project GHG Analysis 11280175 Rugged GHG Tech Study - 2-8-12.doc 12/13/2013
Assembly Bill 1493 Assembly Bill (AB) 1493 (ARB 2002), signed in 2002, required that ARB develop and adopt, by January 1, 2005, regulations that achieve “the maximum feasible reduction of greenhouse gases emitted by passenger vehicles and light-duty trucks and other vehicles determined by ARB to be vehicles whose primary use is noncommercial personal transportation in the state.” In 2004, ARB adopted standards requiring automobile manufacturers to meet fleet-average GHG emissions limits for all passenger cars, light-duty trucks within various weight criteria, and medium-duty passenger vehicle weight classes (i.e., any medium-duty vehicle with a gross vehicle weight rating less than 10,000 pounds that is designed primarily for the transportation of persons) beginning with the 2009 model year. For passenger cars and light-duty trucks, the GHG emissions limits for the 2016 model year are approximately 37% lower than the limits for the first year of the regulations, the 2009 model year. Before the regulations could go into effect, EPA had to grant California a waiver under the CAA, allowing California to regulate GHG emissions from motor vehicles within the state. EPA granted the waiver in 2009. In April 2010, DOT and EPA established GHG gas emissions and fuel economy standards for model years 2012–2016 light-duty cars and trucks. In the fall of 2010, California accepted compliance with these federal GHG standards as meeting similar state standards as adopted in 2004, resulting in the first coordinated national program. Executive Order S-3-05 Executive Order S-3-05 (Caltrans 2005), signed in June 2005, proclaimed that the State of California is vulnerable to the impacts of climate change. Executive Order S-3-05 declared that increased temperatures could reduce the Sierra Nevada’s snowpack, further exacerbate California’s air quality problems, and potentially cause a rise in sea levels. To combat those concerns, the Executive Order established total GHG emissions targets. Specifically, emissions are to be reduced to the 2000 level by 2010, the 1990 level by 2020, and to 80% below the 1990 level by 2050. Executive Order S-3-05 directed the Secretary of the California Environmental Protection Agency (CAL/EPA) to (1) coordinate a multi-agency effort to reduce GHG emissions to the target levels and (2) submit biannual reports to the governor and the

Rugged Solar LLC Project GHG Analysis Page 17 11280175 Rugged GHG Tech Study - 2-8-12.doc 12/13/2013
State Legislature describing progress made toward reaching the emission targets, impacts of global warming on California’s resources, and mitigation and adaptation plans to combat these impacts. The Secretary of the CAL/EPA created the California Climate Action Team, made up of members from various state agencies and commissions, which is responsible for implementing global warming emissions-reduction programs. The California Climate Action Team is also responsible for reporting on the progress made toward meeting the statewide GHG targets. Assembly Bill 32 Climate Change Proposed Scoping Plan In December 2008, ARB adopted its Climate Change Scoping Plan (Scoping Plan), which was revised in 2011 to account for new economic activity levels. The Scoping Plan contains the main strategies California will implement to achieve reduction of approximately 80 MMT of CO2e, or 16% from California’s projected 2020 emissions level of 507 MMT of CO2e under a “business-as-usual” scenario. The Scoping Plan also includes ARB-recommended GHG reductions for each emissions sector of California’s GHG inventory. The Scoping Plan calls for the largest reductions in GHG emissions to be achieved by implementing the following measures and standards:
• Improved emissions standards for light-duty vehicles (26.1 MMT CO2e)
• The Low-Carbon Fuel Standard (15.0 MMT CO2e)
• Energy efficiency measures in buildings and appliances, and the widespread development of combined heat and power systems (16.7 MMT CO2e)
• A renewable portfolio standard for electricity production (12 MMT CO2e) The Scoping Plan does state that land use planning and urban growth decisions will play an important role in the state’s GHG reductions, since local governments have primary authority to plan, zone, approve, and permit land development to accommodate population growth and the changing needs of their jurisdictions. The Scoping Plan expects a reduction of approximately 5.0 MMT CO2e per year from local land use changes associated with implementation of Senate Bill (SB) 375, discussed below. The Scoping Plan does not include any direct discussion about GHG emissions generated by construction activity.
Page 18 Rugged Solar LLC Project GHG Analysis 11280175 Rugged GHG Tech Study - 2-8-12.doc 12/13/2013
Cap and Trade As a key part of the ARB Scoping Plan, the final adoption of regulations for the Cap and Trade program (ARB 2011) by the ARB board is an important step to the state meeting its GHG reduction goals. This program will first set an aggressive cap, or maximum limit, on emissions; sources covered by the program then receive authorizations to emit in the form of emissions allowances, with the total amount of allowance limited by the cap. Each source can design its own compliance strategy to meet the overall reduction requirement, including sale or purchase of allowances, installation of pollution controls, and implementation of efficiency measures. Individual control requirements are not specified under a cap and trade program, but each emissions source must surrender allowances equal to its actual emissions to comply. Sources must also completely and accurately measure and report all emissions in a timely manner to guarantee that the overall cap is achieved. In the first compliance period, which will be in place from 2013 through 2014, the regulations will impose allowance obligations on the electricity distribution entities in California (both for in-state generation and out-of-state generation imported into the state) and certain large industrial facilities in specified industries whose GHG emissions exceed 25,000 MT CO2e. In the second compliance period, starting January 1, 2015, producers and importers of natural gas and other fossil fuels will become subject to the regulations. Executive Order S-1-07 Executive Order S-1-07 (ARB 2007), signed in 2007, establishes a goal that the carbon intensity of transportation fuels sold in California should be reduced by a minimum of 10% by 2020. ARB identified this Low Carbon Fuel Standard as a discrete early action item under AB 32. The final ARB resolution (No. 09-31) was issued on April 23, 2009. Senate Bill 1078, Senate Bill 107, and Senate Bill X1-2 SB 1078 (CEC 2002) requires retail sellers of electricity, including investor-owned utilities and community choice aggregators, to provide at least 20% of their supply from renewable sources by 2017. SB 107 changed the target date to 2010. Executive Order S-14-08 expands the state’s Renewable Energy Standard to 33% renewable power by 2020. This new goal was codified in 2011 with the passage of SB X1-2. In 2009, San
Rugged Solar LLC Project GHG Analysis Page 19 11280175 Rugged GHG Tech Study - 2-8-12.doc 12/13/2013
Diego Gas & Electric (SDG&E), which provides electricity and natural gas to the Project site, used 10% renewable energy to provide electricity to customers (SDG&E 2009). To meet the goals set out in SB X1-2, a significant effort will be needed to reduce overall energy used in the state through energy efficiency efforts and a large effort to increase the amount of renewable energy generated and purchased by SDG&E. Senate Bill 97 Signed in August 2007, SB 97 (OPR 2007) acknowledges that climate change is a prominent environmental issue that requires analysis under CEQA. This bill directed the California Office of Planning and Research to prepare, develop, and transmit to the California Natural Resources Agency guidelines for the feasible mitigation of GHG emissions or the effects of GHG emissions under CEQA (CNRA 2009). On February 16, 2010, the Office of Administrative Law approved the CEQA amendments and filed them with the Secretary of State for inclusion in the California Code of Regulations. The CEQA amendments became effective on March 18, 2010. The amended guidelines establish two new guidance questions in the Environmental Checklist of CEQA Guidelines Appendix G. The amendments do not establish a GHG emissions threshold, but allow a lead agency to develop, adopt, and apply its own threshold of significance or use those developed by other agencies or experts. Senate Bill 375 Signed in September 2008, SB 375 (LC 2008) aligns regional transportation planning efforts, regional GHG-reduction targets, and land use and housing allocations. It requires Metropolitan Planning Organizations (MPOs), such as the San Diego Association of Governments (SANDAG), to adopt a Sustainable Communities Strategy (SCS) or Alternative Planning Strategy (APS), which would prescribe land use allocations in that MPO’s Regional Transportation Plan (RTP). ARB has established reduction targets for GHGs emitted by passenger cars and light trucks in the region for the years 2020 and 2035. These reduction targets are to be updated every 8 years, but can be updated every 4 years if advancements in emissions technologies affect the reduction strategies to achieve the targets. ARB is also charged with reviewing each MPO’s SCS or APS for consistency with its assigned targets.
SANDAG became the first MPO in the state to adopt an SCS when it adopted the 2050 RTP in October 2011. This regional planning document included an SCS that will

Page 20 Rugged Solar LLC Project GHG Analysis 11280175 Rugged GHG Tech Study - 2-8-12.doc 12/13/2013
achieve the GHG emissions reduction goals set by ARB of 7% per capita GHG reductions from passenger vehicles by 2020 and 13% by 2035. SB 375 also extends the minimum period for the Regional Housing Needs Allocation cycle from 5 years to 8 years for local governments located within an MPO that meets certain requirements. City or county land use policies (including general plans) are not required to be consistent with the RTP (and associated SCS or APS). However, new provisions of CEQA would incentivize qualified projects that are consistent with an approved SCS or APS, which would be categorized as “transit priority projects.” ARB adopted regional targets on September 23, 2010 (ARB 2010b). Regional and Local Plans, Policies, Regulations, and Ordinances ARB’s Scoping Plan (ARB 2008) states that local governments are “essential partners” in the effort to reduce GHG emissions. The Scoping Plan also acknowledges that local governments have “broad influence and, in some cases, exclusive jurisdiction” over activities that contribute to significant direct and indirect GHG emissions through their planning and permitting processes, local ordinances, outreach and education efforts, and municipal operations. Many of the proposed measures to reduce GHG emissions rely on local government actions. The Scoping Plan encourages local governments to reduce GHG emissions by approximately 15% from current levels, which were 469 MMT CO2e at the time the Scoping Plan was created and are expected to rise to 507 MMT CO2e by 2020 under a “business-as-usual” scenario (ARB 2008). San Diego Air Pollution Control District The San Diego Air Pollution Control District has no regulations relative to GHG emissions. San Diego County San Diego County has no regulations relative to GHG emissions, but it does have a Green Building Incentive Program that is a voluntary program to promote energy- and resource-efficient building design. Incentives, in the form of fast-track plan checking and fee reductions, are offered to developers who use recycled materials in construction, install irrigation systems that use greywater, build projects that exceed California’s Title 24 guidelines (i.e., the energy efficiency standards), or install photovoltaic electricity

Rugged Solar LLC Project GHG Analysis Page 21 11280175 Rugged GHG Tech Study - 2-8-12.doc 12/13/2013
generation systems (solar power). The San Diego County General Plan Update was adopted by the County of San Diego Board of Supervisors in August 2011. The General Plan contains numerous policies in the Land Use, Mobility, Conservation and Open Space, and Housing Elements to address climate change. Adopted policies in the General Plan Update address the following major strategies:
• Reduce vehicle trips generated, gasoline/energy consumption, and GHGs.
• Reduce non-renewable electrical and natural gas energy consumption and generation (energy efficiency).
• Increase generation and use of renewable energy sources.
• Reduce water consumption.
• Reduce and maximize reuse of solid wastes.
• Promote CO2-consuming landscapes.
• Maximize preservation of open spaces, natural areas, and agricultural lands.
• Reduce risk from wildfire, flooding, and other hazards resulting from climate change.
• Conserve and improve water supply due to shortage from climate change.
• Promote agricultural lands for local food production.
• Provide education and leadership.

Page 22 Rugged Solar LLC Project GHG Analysis 11280175 Rugged GHG Tech Study - 2-8-12.doc 12/13/2013
This page intentionally left blank.
Rugged Solar LLC Project GHG Analysis Page 23 11280175 Rugged GHG Tech Study - 2-8-12.doc 12/13/2013
CHAPTER 3.0 – ENVIRONMENTAL CONSEQUENCES AND
MITIGATION MEASURES ANALYSIS METHODOLOGY A single project is unlikely to have a significant impact on the environment related to climate change. However, the cumulative effect of various human activities involving emissions of GHGs has been clearly linked to quantifiable changes in the composition of the atmosphere, which in turn have been shown to be the main cause of global climate change (IPCC 2007). Although it is extremely unlikely that a single project would contribute significantly to climate change, the analysis of the environmental effects of GHG emissions from the Project is addressed as a cumulative impact analysis because cumulative emissions from many projects would affect global GHG concentrations and the climate system. Pursuant to full disclosure and according to CEQA Guidelines that state, “A lead agency should make a good-faith effort, based to the extent possible on scientific and factual data, to describe, calculate, or estimate the amount of greenhouse gas emissions resulting from a project,” both the total GHG emissions associated with the Project and the net change in GHG emissions from existing conditions are quantified. These are used as criteria to determine whether the associated emissions would substantially help or hinder the state’s ability to attain the goals identified in AB 32 (i.e., reduction of statewide GHG emissions to 1990 levels by 2020). The analysis of GHG emissions in this report recognizes that the impact that GHG emissions have on global climate change does not depend on whether the emissions are generated by stationary, mobile, or area sources, or whether they are generated in one region or another. Land uses need to be “GHG efficient” to attain AB 32 goals. Projects that meet specified minimum performance standards, such as those described in an existing plan or mitigation program for the reduction of emissions or specific measures adopted as part of a general plan, long-range development plan, or GHG emissions-reduction plan—can be identified as projects that are consistent with or surpass the goals of AB 32.

Page 24 Rugged Solar LLC Project GHG Analysis 11280175 Rugged GHG Tech Study - 2-8-12.doc 12/13/2013
Construction Emissions Construction-related GHG emissions would be associated with typical construction activities, such as site grading, CPV unit installation, embedded emissions in the water that will be used during construction, and vehicle engine exhaust from construction equipment, vendor trips, and construction employee commute trips. Generation of cConstruction-related emissions would be temporary and would subside after completion of the Project. Construction at the project site would require up to about 128 months and is anticipated to begin in April 2014. Construction of the gen-tie line would take an additional 2 to 3 months, and would occur in 2015 after completion of the on-site construction activities. Construction activities would generally occur for 8 hours per day and 6 days per week. In order to provide construction materials for the proposed solar facilities, a temporary batch plant and rock crushing facility will be constructed onsite. The temporary facility will be used for preparing and mixing the concrete used for the foundations for the solar trackers, the transformers at the substation, the O&M building, and other project facilities. Source materials (e.g., sand) for the concrete batch plant would be purchased from a commercial source approximately 55 miles from the project site. Water would be provided by on-site wells, and aggregate materials would be obtained from within the development footprint. Emissions from construction equipment and construction vehicles related to hauling materials and workers to and within the site were estimated using URBEMIS 2007 Version 9.2.4 (URBEMIS), Road Construction Emissions Model, Version 7.1.6.3.2, OFFROAD 2007 (OFFROAD), and EMFAC 2011 (EMFAC). URBEMIS is designed to estimate construction and operational emissions from land use development projects. The Road Construction Emissions Model was developed to estimate the emissions from linear projects, such as bridges, roads, or pipelines. OFFROAD and EMFAC wereas developed by ARB for the purposes of estimating CO2 emissions from off-road equipment and on-road vehicle activity. Additionally, emission factors used from EMFAC account for statewide GHG reduction programs for the transportation sector such as the Low Carbon Fuel Standard and Pavely fuel efficiency regulations. URBEMIS was used to estimate off-road construction equipment and fugitive dust emissions associated with (1) site clearing and grading, (2) trenching and construction of electrical transmission facilities, (3) solar CPV assembly and installation, and (4)

Rugged Solar LLC Project GHG Analysis Page 25 11280175 Rugged GHG Tech Study - 2-8-12.doc 12/13/2013
construction of the substation and O&M building. The Road Construction Emissions Model was used to estimate off-road construction equipment emissions associated with construction of 20.5 miles of access roads and 46.5 miles of service roads. The Road Construction Emissions Model was also used to estimate emissions associated with construction of the gen-tie line. Haul trips associated with delivery of materials to the project site and construction worker commutes were estimated using emission factors from EMFAC. Materials were assumed to be transported from the Rancho Bernardo area of San Diego, which is the likely location for production of the solar modules. Worker commutes were conservatively estimated at 35 miles (one way) based on the travel distance from Alpine, Detailed modeling outputs and assumptions are available in Appendix A. Operational Emissions After construction, day-to-day activities associated with operation of the Project would generate minimal GHG emissions from a limited number of sources. GHG emissions were estimated using Project-based activity data, provided by the applicant, and the most recent and relevant emissions factors. Emissions estimates for employee vehicle trips to and from the facility were made using OFFROAD 2007 and EMFAC emission factors. EMFAC emission factors account for statewide GHG reduction programs such as the Low-Carbon Fuel Standard and Pavley fuel efficiency regulations. For emissions resulting from energy used at the facility, an emission factor was calculated that forecasts the SDG&E emission factor in 2020, provided it meets the Renewable Portfolio Standard (RPS) and provides 33% of electricity from renewable sources. A forecasted emissions factor was created for 2020 as that is the year established by AB 32 as a target for achieving reduced statewide GHG emissions (ARB 2008). This forecasted emissions factor was based on the utility-specific emissions factor for SDG&E from 2009, attained from the Power Generation/Electric Utility Reporting Protocol report submitted to the California Climate Action Registry by SDG&E (CCAR 2009) and the 2009 annual Power Content Label (SDG&E 2009) reported to CEC. There is no stationary use of any other fuels. On-site operations activity would include in-place panel washing not more frequently than every 6 to 8 weeks by mobile crews who would also be available for dispatch whenever on-site repairs or other maintenance are required (approximately 9 washes per year). A tanker truck and smaller “satellite” panel washing trucks would be used for

Page 26 Rugged Solar LLC Project GHG Analysis 11280175 Rugged GHG Tech Study - 2-8-12.doc 12/13/2013
panel washing. On-site water storage tanks, installed to provide water for fire protection will include additional capacity available for panel washing. Operational activities associated with maintenance of the gen-tie line would include light- and heavy-duty vehicles for pole structure brushing, herbicide application, and equipment repair. Electric transmission lines may be inspected several times a year via helicopter. Helicopter emissions were estimated using emission factors from the California Climate Action Registry. Operational emissions would also result from intermittent use of two diesel-powered emergency generators for maintenance and testing purposes. Each generator would be run for testing and maintenance approximately one hour each week for a total of 50 hours per year. While the water used for this project will come from local wells, at this time there is no information about the depth of the wells. This would be required to determine the energy required to pump water to the surface and the associated GHG emissions. Because of this limitation, a more conservative estimate of GHG emissions associated with the water used for the project was used that estimates emissions for the transportation, conveyance, and treatment of water that would be used on-site. To estimate these emissions, emission factors from the CEC’s 2006 report, Refining Estimates of Water-Related Energy Use in California (CEC 2006b), were used. A limited amount of wastewater would be conveyed to a water reclamation facility. To be conservative, the IPCC method for estimating emissions from wastewater facilities, as found in the Wastewater Treatment and Discharge chapter of the IPCC Guidelines for National Greenhouse Gas Inventories (IPCC 2006), was used to estimate emissions from the treatment of wastewater generated at the facility. This likely overestimates wastewater emissions because, unlike municipal wastewater, no organic material, which drives GHG emissions in wastewater treatment, would be added to the wastewater coming from the Project. CRITERIA FOR DETERMINING SIGNIFICANCE OF EFFECTS There are no quantitative federal or state significance criteria for global climate change impacts or GHG emissions that pertain to this Project. At the state level, climate change must be addressed in CEQA documents according to Appendix G of the CEQA
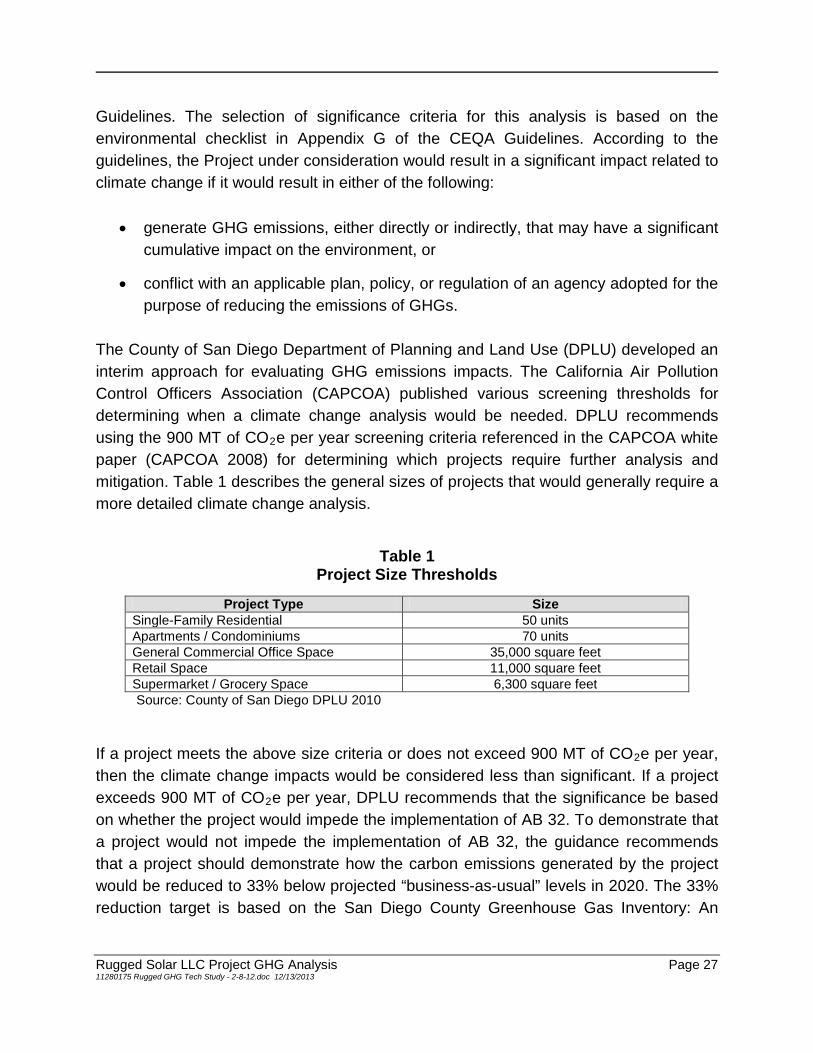
Rugged Solar LLC Project GHG Analysis Page 27 11280175 Rugged GHG Tech Study - 2-8-12.doc 12/13/2013
Guidelines. The selection of significance criteria for this analysis is based on the environmental checklist in Appendix G of the CEQA Guidelines. According to the guidelines, the Project under consideration would result in a significant impact related to climate change if it would result in either of the following:
• generate GHG emissions, either directly or indirectly, that may have a significant cumulative impact on the environment, or
• conflict with an applicable plan, policy, or regulation of an agency adopted for the purpose of reducing the emissions of GHGs.
The County of San Diego Department of Planning and Land Use (DPLU) developed an interim approach for evaluating GHG emissions impacts. The California Air Pollution Control Officers Association (CAPCOA) published various screening thresholds for determining when a climate change analysis would be needed. DPLU recommends using the 900 MT of CO2e per year screening criteria referenced in the CAPCOA white paper (CAPCOA 2008) for determining which projects require further analysis and mitigation. Table 1 describes the general sizes of projects that would generally require a more detailed climate change analysis.
Table 1 Project Size Thresholds
Project Type Size
Single-Family Residential 50 units Apartments / Condominiums 70 units General Commercial Office Space 35,000 square feet Retail Space 11,000 square feet Supermarket / Grocery Space 6,300 square feet
Source: County of San Diego DPLU 2010 If a project meets the above size criteria or does not exceed 900 MT of CO2e per year, then the climate change impacts would be considered less than significant. If a project exceeds 900 MT of CO2e per year, DPLU recommends that the significance be based on whether the project would impede the implementation of AB 32. To demonstrate that a project would not impede the implementation of AB 32, the guidance recommends that a project should demonstrate how the carbon emissions generated by the project would be reduced to 33% below projected “business-as-usual” levels in 2020. The 33% reduction target is based on the San Diego County Greenhouse Gas Inventory: An

Page 28 Rugged Solar LLC Project GHG Analysis 11280175 Rugged GHG Tech Study - 2-8-12.doc 12/13/2013
Analysis of Regional Emissions and Strategies to Achieve AB 32 Targets (Anders et al. 2008). At the time of this writing, no federal, state, regional, or local air quality regulatory agency has adopted a quantitative threshold of significance for construction-related GHG emissions. Many California air districts recommend that construction emissions associated with a project be amortized over the life of the project (typically 30 years) and added to the operational emissions. Therefore, modeled construction-related GHG emissions associated with the Project are discussed first, then operational GHG emissions are totaled and the amortized construction emissions are added to the operational emissions. IMPACT ANALYSIS Impact 1: Generation of Construction-Related and Operational Greenhouse Gas Emissions That Have a Cumulative Effect on the Environment GHG emissions generated by construction of the Project would be primarily in the form of CO2. Although emissions of other GHGs, such as CH4 and N2O, are important with respect to global climate change, the emissions levels of these other GHGs from on- and off-road vehicles used during construction are relatively small compared to the level of CO2 emissions, even when factoring in the relatively larger GWP of CH4 and N2O. Construction-related GHG emissions would be generated by sources such as heavy-duty off-road equipment, trucks hauling materials to the site, and worker commutes during construction of the Project. Construction of the Project would involve localized clearing and grading, construction of primary and secondary access roads, installation of CPV foundations, trenching within each building block for the collection system and communications system, installation of small concrete footing at each pair of inverters and attendant transformer, and installation of a secondary 34.5 kV collection system, including a wood pole mounted 34.5 kV “trunk line,” leading to the 34.5/69 kV project step-up substation and an on-site operations and maintenance facility. While GHG emissions persist in the atmosphere for extended periods of time, construction-related emissions would only be generated during the construction period,

Rugged Solar LLC Project GHG Analysis Page 29 11280175 Rugged GHG Tech Study - 2-8-12.doc 12/13/2013
which is expected to be up to about 18 months. The maximum construction emissions over the construction period for the Project would be approximately 4,4765,678 MT CO2e. When this total is amortized over the 30-year life of the project, the annual construction emissions would be approximately 14989 MT CO2e per year. Operational emissions would come from direct and indirect emissions sources generated by mobile sources, embedded in electricity and water uses, and emissions that are emitted during the treatment of wastewater generated at the Project site. Mobile source emissions would be associated with activities such as vehicle travel required for maintenance of the CPV units and the surrounding site. On-site operational activity would include in-place panel washing as often as approximately every 6 to 8 weeks, but expected to be required about four times per year. Panel washing is expected to require 6.5 gallons per tracker, but no more than 24 gallons of water would be required to wash each tracker. Each washing event would be completed by two washing trucks deployed across the site. There would also be some usage of grid-provided electricity to power the CPV trackers and communication/monitoring system on-site. Consumption of water may result in indirect GHG emissions from electricity used to power any off-site conveyance, distribution, and treatment of water and associated wastewater. Table 2 shows the summary of operational GHG emissions estimated for the Project. The annual operational emissions levels were estimated using the best available methodologies and emission factors available at the time of writing this technical report. Additional details are available in Appendix A.
Table 2 Project GHG Emissions
Emissions Source Unmitigated Project Emissions of
CO2e per Year Off-Road Equipment/On-Road Vehicles 165148 Energy 346 Water 7 Wastewater <1 Total (Operational) 50118 Total Amortized Construction 14989 Total (Operational + Amortized Construction) 650707
Note: Totals may not add correctly due to rounding.

Page 30 Rugged Solar LLC Project GHG Analysis 11280175 Rugged GHG Tech Study - 2-8-12.doc 12/13/2013
As shown in Table 2, the Project would result in approximately 650707 MT CO2e per year. This is an increase of 650707 MT CO2e per year from existing emissions levels, because the existing site is currently used for grazing with minimal GHG emissions resulting from this activity. As shown in Table 2, the total construction-related and operational CO2e emissions associated with the Project would be less than the screening criteria of 900 MT CO2e recommended by DPLU. Therefore, the Project would not require further quantification and would not be anticipated to impede the implementation of AB 32. The Project would not generate GHG emissions, either directly or indirectly, that would have a significant impact on the environment. The impact would be less than significant. Mitigation Measure: No mitigation is required. Impact 2: Conflict with an Applicable Plan, Policy, or Regulation Adopted to Reduce Greenhouse Gas Emissions ARB’s Scoping Plan is the most applicable state plan to evaluate the Project’s actions because it provides the outline for actions to reduce California’s GHG emissions and meet the goals set in AB 32. For more information regarding the Scoping Plan see “Assembly Bill 32 Climate Change Proposed Scoping Plan” on page 20. The Scoping Plan includes measures that would indirectly address GHG emissions levels associated with construction activity, including the phasing in of cleaner technology for diesel engine fleets (including construction equipment) and the development of a Low Carbon Fuel Standard. Policies formulated under the mandate of AB 32, either directly or indirectly applicable to construction-related activities, are assumed to be implemented during construction of the Project if those policies and laws are developed before construction begins. Therefore the Project construction would not conflict with the Scoping Plan. Although construction and operation of the Project would result in an increase of GHG emissions, it is aligned with the goals of AB 32. The Project would provide non-fossil-fuel-based electricity and would support the state’s goal to obtain 33% of all electricity from renewable sources and, therefore, help to achieve 1990 statewide emissions levels by 2020.
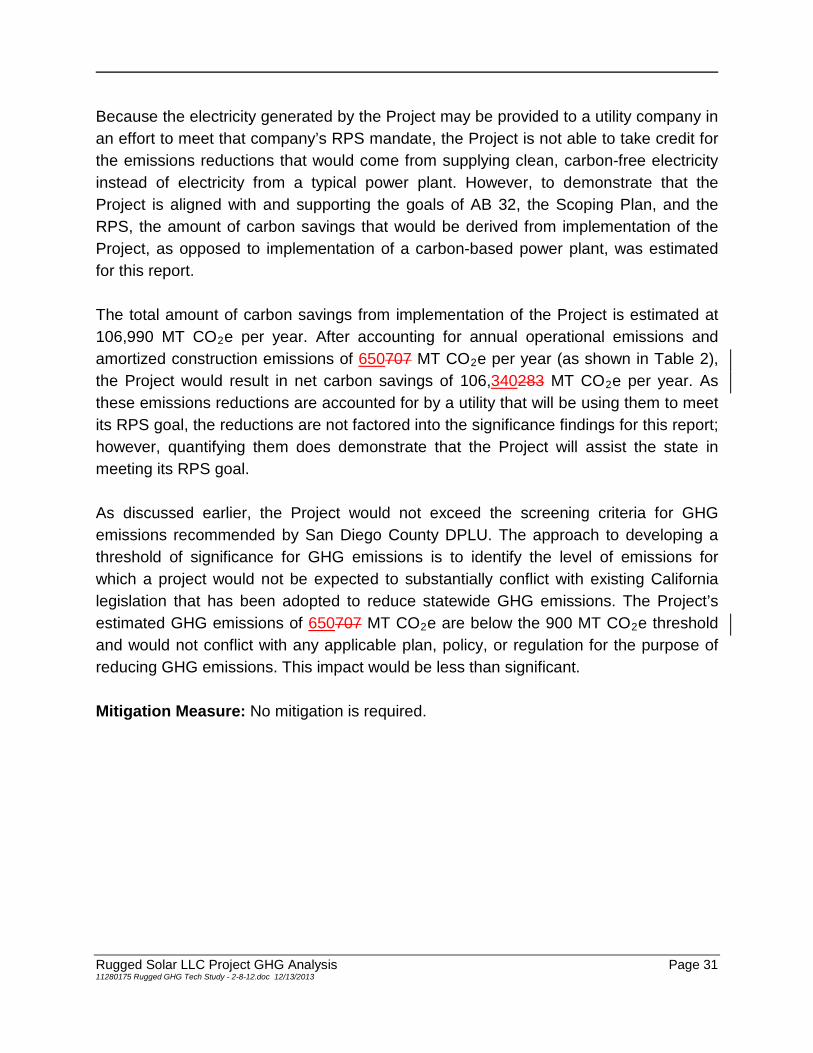
Rugged Solar LLC Project GHG Analysis Page 31 11280175 Rugged GHG Tech Study - 2-8-12.doc 12/13/2013
Because the electricity generated by the Project may be provided to a utility company in an effort to meet that company’s RPS mandate, the Project is not able to take credit for the emissions reductions that would come from supplying clean, carbon-free electricity instead of electricity from a typical power plant. However, to demonstrate that the Project is aligned with and supporting the goals of AB 32, the Scoping Plan, and the RPS, the amount of carbon savings that would be derived from implementation of the Project, as opposed to implementation of a carbon-based power plant, was estimated for this report. The total amount of carbon savings from implementation of the Project is estimated at 106,990 MT CO2e per year. After accounting for annual operational emissions and amortized construction emissions of 650707 MT CO2e per year (as shown in Table 2), the Project would result in net carbon savings of 106,340283 MT CO2e per year. As these emissions reductions are accounted for by a utility that will be using them to meet its RPS goal, the reductions are not factored into the significance findings for this report; however, quantifying them does demonstrate that the Project will assist the state in meeting its RPS goal. As discussed earlier, the Project would not exceed the screening criteria for GHG emissions recommended by San Diego County DPLU. The approach to developing a threshold of significance for GHG emissions is to identify the level of emissions for which a project would not be expected to substantially conflict with existing California legislation that has been adopted to reduce statewide GHG emissions. The Project’s estimated GHG emissions of 650707 MT CO2e are below the 900 MT CO2e threshold and would not conflict with any applicable plan, policy, or regulation for the purpose of reducing GHG emissions. This impact would be less than significant. Mitigation Measure: No mitigation is required.

Page 32 Rugged Solar LLC Project GHG Analysis 11280175 Rugged GHG Tech Study - 2-8-12.doc 12/13/2013
CHAPTER 4.0 – EFFECTS OF GLOBAL CLIMATE CHANGE
ON THE PROJECT The level of significance of the impact of global climate change on the Project cannot be determined with certainty because of the variability in climate change models. However, an expected increase in the annual average temperature attributable to global climate change is projected to result in numerous effects in California, such as changes in precipitation patterns, snowpack, runoff, sea level rise, and water quality. Effects on precipitation and snowpack would affect runoff and surface water, but would not affect the physical conditions of the Project site. The Project is located at an elevation that would not be at or affected by a rising sea level, and increased cloud cover is not likely to cause a significant effect on operations. The Project would achieve consistency with state plans and goals, and enhance achievement of the objectives to protect California’s natural resources against the detrimental effects of climate change by generating 80 MW of renewable energy. This would help the state reach its goal, as described in SB X1-2, to obtain 33% of all electricity from renewable sources.

Rugged Solar LLC Project GHG Analysis Page 33 11280175 Rugged GHG Tech Study - 2-8-12.doc 12/13/2013
This page intentionally left blank.
Page 34 Rugged Solar LLC Project GHG Analysis 11280175 Rugged GHG Tech Study - 2-8-12.doc 12/13/2013
CHAPTER 5.0 – BIBLIOGRAPHY
Ahrens, D. C. 2003. Meteorology Today: An Introduction to Weather, Climate, and the
Environment. Brooks Cole, Inc.: Pacific Grove, California. Anders, S. J., D. O. De Haan, N. Silva-Send, S. T. Tanaka, and L. Tyner. 2008. San
Diego County Greenhouse Gas Inventory: An Analysis of Regional Emissions and Strategies to Achieve AB 32 Targets. San Diego, California. University of San Diego.
ARB. See California Air Resources Board. California Air Pollution Control Officers Association (CAPCOA). 2008. CEQA & Climate
Change. Sacramento, California. Available at http://www.climatechange.ca.gov/ publications/others/CAPCOA-1000-2008-010.pdf. Accessed February 2011.
California Air Resources Board (ARB). 2002. Climate Assembly Bill No. 1493.
Sacramento, California. Available at http://www.arb.ca.gov/cc/ccms/documents/ ab1493.pdf. Accessed December 2011.
______. 2007. Executive Order S-01-07. Sacramento, California. January. Available at
http://www.arb.ca.gov/fuels/lcfs/eos0107.pdf. ______. 2008. Climate Change Proposed Scoping Plan. Sacramento, California.
December. Available at www.arb.ca.gov/cc/scopingplan/document/scopingplan document.htm. Accessed December 2011.
______. 2010a. Greenhouse Gas Inventory Data – Graphs. Available at
http://www.arb.ca.gov/cc/inventory/data/graph/graph.htm. Accessed November 2011.
______. 2010b. Heavy-Duty Vehicle Greenhouse Gas Measure. Sacramento,
California. Available at http://www.arb.ca.gov/cc/hdghg/hdghg.htm. Accessed September 12, 2009.

Rugged Solar LLC Project GHG Analysis Page 35 11280175 Rugged GHG Tech Study - 2-8-12.doc 12/13/2013
______. 2011. California Cap on Greenhouse Gas Emissions and Market-Based Compliance Mechanisms. Available at http://www.arb.ca.gov/regact/2010/ capandtrade10/finalfro.pdf.
California Climate Action Registry (CCAR). 2009. 2009 San Diego Gas and Electric
Annual Emission Report. Available at http://www.climateregistry.org/carrot/ Reports/ CREntityEmissionReport.aspx.
California Climate Change Center (CCCC). 2009. Climate Change, Growth, and
California Wildfire. August. Available at http://www.energy.ca.gov/2009 publications/CEC-500-2009-046/CEC-500-2009-046-F.pdf. Accessed November 2011.
California Department of Transportation (Caltrans). 2005. Executive Order S-3-05.
Available at http://www.dot.ca.gov/hq/energy/ExecOrderS-3-05.htm. California Department of Water Resources (DWR). 2006. Progress on Incorporating
Climate Change into Planning and Management of California’s Water Resources, Technical Memorandum Report. Sacramento, California.
______. 2008. Managing an Uncertain Future: Climate Change Adaptation Strategies
for California’s Water. Available at http://www.water.ca.gov/climatechange/ docs/Climate ChangeWhitePaper.pdf. Accessed December 2010.
______. 2012. Executive Update Hydrologic Conditions in California (12/01/2011).
Available at http://cdec.water.ca.gov/cgi-progs/reports/EXECSUM. Accessed January 2012.
California Energy Commission (CEC). 2002. Senate Bill No. 1078. Available at
http://www.energy.ca.gov/portfolio/documents/documents/SB1078.pdf. Accessed December 2011.
______. 2006a. Our Changing Climate: Assessing the Risks to California. Publication
CEC-500-2006-077. July. Available at http://www.energy.ca.gov/2006publicat ions/CEC-500-2006-077/CEC-500-2006-077.pdf. Accessed May 2010.

Page 36 Rugged Solar LLC Project GHG Analysis 11280175 Rugged GHG Tech Study - 2-8-12.doc 12/13/2013
______. 2006b. Refining Estimates of Water-Related Energy Use in California. Publication CEC-500-2006-118. Available at http://www.energy.ca.gov/ 2006publications/CEC-500-2006-118/CEC-500-2006-118.pdf.
California Legislative Counsel (LC). 2008. Senate Bill No. 375. Available at
http://www.leginfo.ca.gov/pub/07-08/bill/sen/sb_0351-0400/sb_375_bill_2008093 0_chaptered.pdf.
California Natural Resources Agency (CNRA). 2009. CEQA Guidelines: 2009 SB 97
Rulemaking. Sacramento, California. Available at http://ceres.ca.gov/ceqa/ guidelines/. Accessed January 4, 2010.
California Office of Planning and Research (OPR). 2007. Senate Bill No. 97.
Sacramento, California. Available at http://opr.ca.gov/docs/SB_97_bill_2007 0824_chaptered.pdf.
CAPCOA. See California Air Pollution Control Officers Association. CEC. See California Energy Commission. County of San Diego Department of Planning and Land Use (DPLU). 2010. Interim
Approach to Addressing Climate Change in CEQA Documents. May. DWR. See California Department of Water Resources. Federal Register (FR). 2009. Vol. 74 No. 239. Endangerment and Cause or Contribute
Findings for Greenhouse Gases Under Section 202(a) of the Clean Air Act; Final Rule. December. Available at http://edocket.access.gpo.gov/2009/pdf/E9-29537.pdf.
______. 2010a. Vol. 75 No. 88. Light-Duty Vehicle Greenhouse Gas Emission
Standards and Corporate Average Fuel Economy Standards; Final Rule. May. Available at http://www.nhtsa.gov/staticfiles/rulemaking/pdf/cafe/CAFE-GHG_ MY_2012-2016_Final_Rule_FR.pdf. Accessed December 2011.

Rugged Solar LLC Project GHG Analysis Page 37 11280175 Rugged GHG Tech Study - 2-8-12.doc 12/13/2013
______. 2010b. Vol. 75 No.208. Mandatory Reporting of Greenhouse Gases. October. Available at http://www.gpo.gov/fdsys/pkg/FR-2010-10-28/pdf/2010-26506.pdf. Accessed December 2011.
Intergovernmental Panel on Climate Change (IPCC). 2006. Guidelines for National Greenhouse Gas Inventories, Volume 5 Waste. Available at http://www.ipcc-nggip.iges.or.jp/public/2006gl/pdf/5_Volume5/V5_6_Ch6_Wastewater.pdf.
______. 2007. Climate Change 2007: The Physical Science Basis. Contribution of
Working Group I to the Fourth Assessment Report of the IPCC. Geneva, Switzerland. February.
LC. See California Legislative Counsel. National Oceanic and Atmospheric Administration (NOAA). 2011. December. Available
at ftp://ftp.ncdc.noaa.gov/pub/data/anomalies/annual.land.90S.90N.df_1901-200 0mean.dat.
OPR. See California Office of Planning and Research. San Diego Foundation. 2008. The San Diego Foundation Regional Focus 2050 Study:
Climate Change Related Impacts in the San Diego Region by 2050. Available at http://sandiegohealth.org/sdfoundation/focus2050/Focus2050_whitepaper_final.pdf. Accessed November 2011.
San Diego Gas and Electric (SDG&E). 2009. Power Content Label. Available at
http://sdge.com/sites/default/files/FINAL092610_PowerLabel.pdf.
Seinfeld, J. H., and S. N. Pandis. 1998. Atmospheric Chemistry and Physics. John Wiley & Sons, Inc. New York, New York.
Shepherd, A., D. Wingham, D. Wallis, K. Giles, S. Laxon, and A. V. Sundal. 2010.
Recent Loss of Floating Ice and the Consequent Sea Level Contribution. Geophysical Research Letters 37. DOI10.1029/2010GL042496.
APPENDIX A
Model Assumptions and Outputs


