CDP CDP 2014 Investor CDP 2014 Information Request
Mondelez International Inc
Module: Introduction
Page: Introduction
CC0.1
Introduction
Please give a general description and introduction to your organization. Mondelēz International, Inc. (NASDAQ: MDLZ) is a global snacking powerhouse, with 2013 revenue of $35.3 billion. Creating del icious moments of joy in 165 countries, Mondelēz International is a world leader in chocolate, biscuits, gum, candy, coffee and powdered beverages, with billion-dollar brands such as Cadbury, Cadbury Dairy Milk and Milka chocolate, Jacobs coffee, LU, Nabisco and Oreo biscuits, Tang powdered beverages and Trident gum. Mondelēz International is a proud member of the Standard and Poor’s 500, NASDAQ 100 and Dow Jones Sustainability Index. Visit www.mondelezinternational.com and www.facebook.com/mondelezinternational. At Mondelēz International, we know that the sustainable growth of our business is inextricably linked to the well-being of the people who make and enjoy our products, and the communities that we serve. That is why we launched our Call for Well-Being – a call to action for ourselves, our suppliers and our partners to work together to have a positive impact on the well-being of the world. As explained in our annual report, the Call For Well-Being supports one of our five global growth strategies: “Protect the Well-being of Our Planet.” It is focused on four areas that are critical to the well-being of the world and where we can make the greatest impact: mindful snacking, sustainability, community and safety. Our collective efforts in these areas are designed to enable our business to grow, operate more efficiently and ensure create a sustainable future for our farmers and consumers. Sustainability is about preserving our world and its people. We all depend on just one planet. So all of us need to work together and find ways to use less energy, water and other resources, as well as reduce the waste we generate. For many years, we’ve listened to and worked with smallholder farmers to promote sustainable supply chains. With our partners we help increase the farmers’ output, improve their livelihoods, build thriving communities and protect the environment. We’re using our resources to amplify this ongoing conversation. Our sustainability journey has put us on a path that is making a real difference. But we know we can’t do everything. So our focus is in those areas where we can have the greatest impact: sustainable agriculture and reducing the environmental footprint of our own operations. To reduce our environmental footprint by 2015, we set the following goals:
• Cut our energy and water use in manufacturing by 15% per tonne of production • Reduce our greenhouse gas emissions and waste from manufacturing by 15% per tonne of production • Make 60% of our production in Zero Waste to Landfill sites • Eliminate 50 million pounds (22,500 tons) of packaging material We set goals to help transform and secure our agricultural supply • All cocoa will ultimately be sustainably-sourced • 70% of global coffee will be sustainably-sourced by 2015 • 75% of Western European biscuits volume made with Harmony wheat by 2015 • Palm oil: 100% RSPO by 2015 Beyond this, as the foundation for all our work in sustainable agriculture, we’re embedding sustainability into our sourcing practices across our commodities. For a number of years now, sustainability has been a strategic business priority for Mondelēz International, having first set aggressive five-year goals to reduce energy, carbon dioxide emissions, water, waste and packaging in 2006, under our former name, Kraft Foods Inc. Our focus on climate change is also consistent with our environmental policy, which states: “Mondelēz International is committed to reducing the environmental impact of our activities, preventing pollution and promoting the sustainability of the natural resources upon which we depend, while providing quality products that meet the needs of our consumers. We also are committed to the continuous improvement of our environmental performance and to meeting or exceeding the requirements of all applicable environmental laws and regulations. We expect all Mondelēz International employees to carry out their job responsibilities in accordance with this policy and to report any environmental concerns they have to management." Success requires vision and determination, great partners and seizing opportunities—from farm to fork. It’s a journey. It’ll take years. But we’re in business for the long-term, which means we benefit from our investment in this area. And done right, we know building sustainability into our business is good for the planet, people and, ultimately, our profits.
CC0.2
Reporting Year
Please state the start and end date of the year for which you are reporting data. The current reporting year is the latest/most recent 12-month period for which data is reported. Enter the dates of this year first. We request data for more than one reporting period for some emission accounting questions. Please provide data for the three years prior to the current reporting year if you have not provided this information before, or if this is the first time you have answered a CDP information request. (This does not apply if you have been offered and selected the option of answering the shorter questionnaire). If you are going to provide additional years of data, please give the dates of those reporting periods here. Work backwards from the most recent reporting year. Please enter dates in following format: day(DD)/month(MM)/year(YYYY) (i.e. 31/01/2001).
Enter Periods that will be disclosed
Tue 01 Jan 2013 - Tue 31 Dec 2013
CC0.3
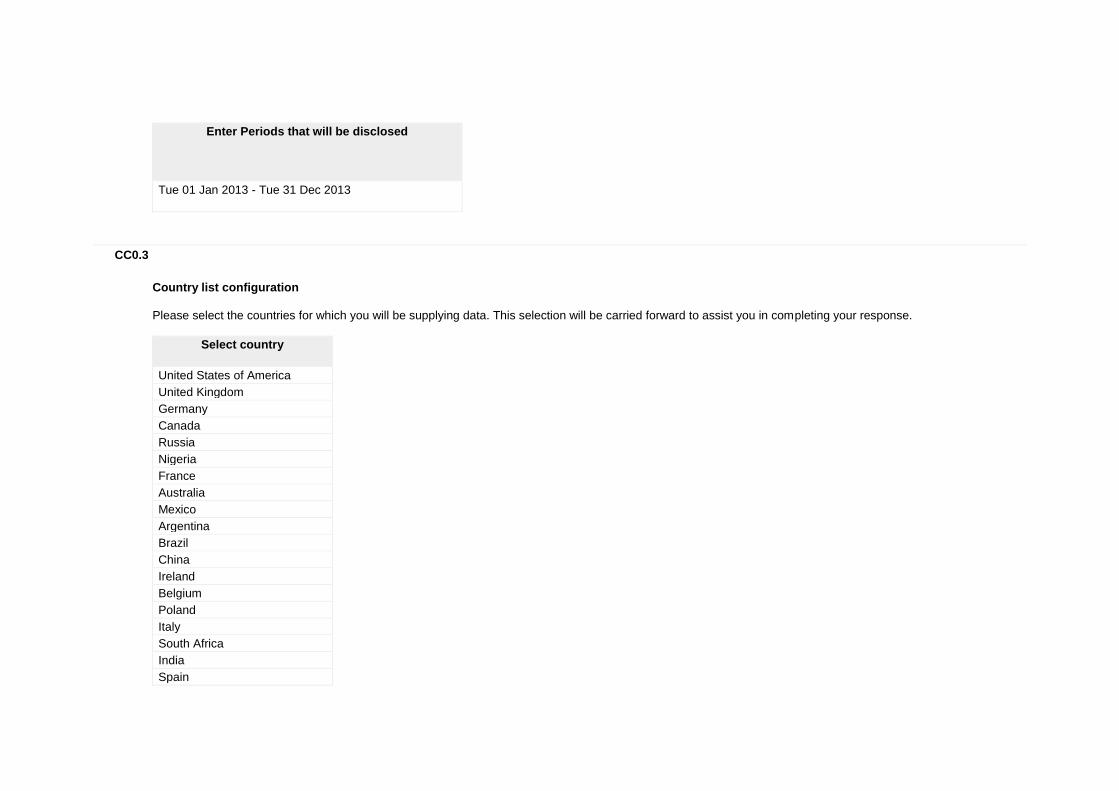
Country list configuration
Please select the countries for which you will be supplying data. This selection will be carried forward to assist you in completing your response.
Select country
United States of America
United Kingdom
Germany
Canada
Russia
Nigeria
France
Australia
Mexico
Argentina
Brazil
China
Ireland
Belgium
Poland
Italy
South Africa
India
Spain
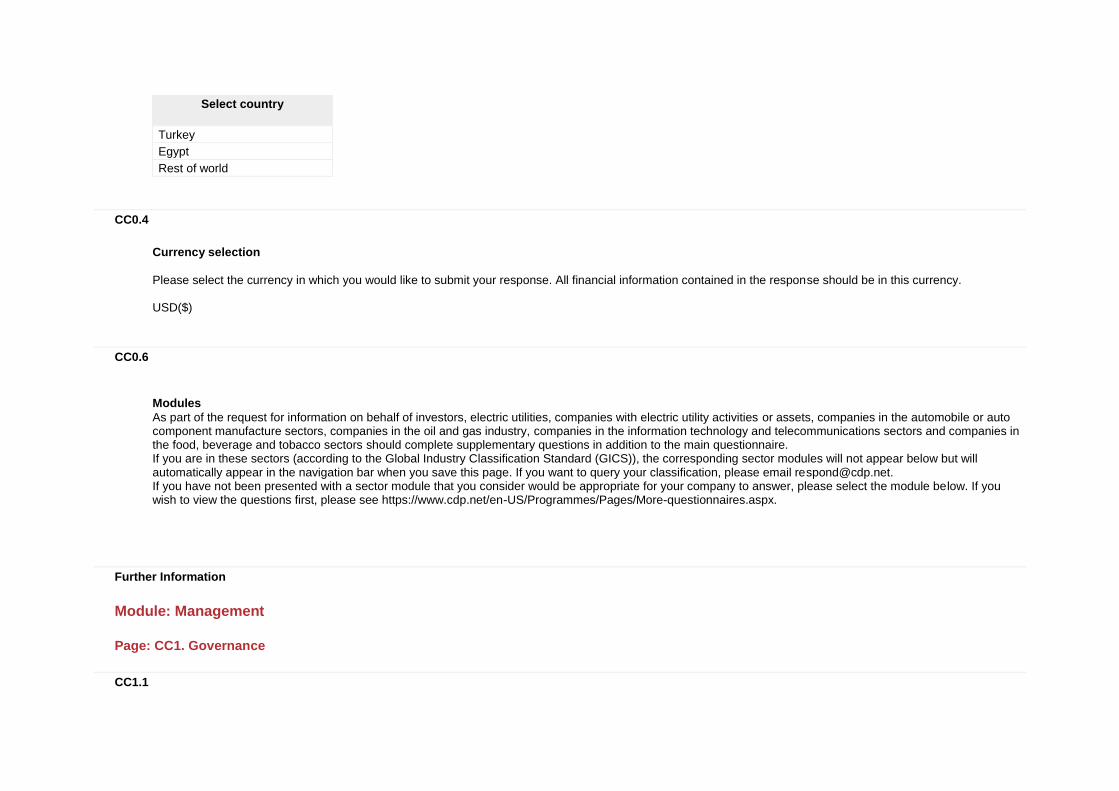
Select country
Turkey
Egypt
Rest of world
CC0.4
Currency selection
Please select the currency in which you would like to submit your response. All financial information contained in the response should be in this currency. USD($)
CC0.6
Modules
As part of the request for information on behalf of investors, electric utilities, companies with electric utility activities or assets, companies in the automobile or auto component manufacture sectors, companies in the oil and gas industry, companies in the information technology and telecommunications sectors and companies in the food, beverage and tobacco sectors should complete supplementary questions in addition to the main questionnaire. If you are in these sectors (according to the Global Industry Classification Standard (GICS)), the corresponding sector modules will not appear below but will automatically appear in the navigation bar when you save this page. If you want to query your classification, please email [email protected]. If you have not been presented with a sector module that you consider would be appropriate for your company to answer, please select the module below. If you wish to view the questions first, please see https://www.cdp.net/en-US/Programmes/Pages/More-questionnaires.aspx.
Further Information
Module: Management
Page: CC1. Governance
CC1.1

Where is the highest level of direct responsibility for climate change within your organization?
Individual/Sub-set of the Board or other committee appointed by the Board
CC1.1a
Please identify the position of the individual or name of the committee with this responsibility
For Mondelēz International, sustainability is one part of our Call For Well-being, a set of coordinated actions that supports one of our five global strategies: “Protect the Well-being of Our Planet and Its People.” Our collective efforts will enable our business to grow, operate more efficiently and ensure a sustainable future for our suppliers, farmers and consumers. We take a comprehensive approach to well-being, integrating it throughout our business processes. Our CEO is engaged in the review and progress of our Well-being strategy in conjunction with our Board of Directors Committee responsible for overseeing public affairs, the Governance, Membership and Public Affairs Committee. To guide our strategy, we established a Well-being Leadership Team that is managed by our Vice President of External Affairs with oversight from our Chief Marketing Officer, our Chief R&D & Nutrition Officer, and our EVP/AP-EEMEA Region President of the company. The team makes recommendations to the business and sets the global direction on sustainable agriculture and resources, health & wellness and safety. The team includes senior representatives from R&D and nutrition, marketing, global categories, procurement, government and corporate affairs, integrated supply chain, and scientific & regulatory affairs. Our sustainability goals are part of the strategic planning process at Mondelēz International, and therefore, progress and key activities are regularly reported to the Board and the business unit leadership teams. Energy and CO2 are key focus areas in our sustainability strategy. Clear business goals have been set as part of the sustainability strategy led by the Vice President, External Affairs. In addition, each business unit is responsible for integrating sustainability into their strategic plans. They are responsible for developing a plan that will enable them to deliver sustainability performance that will contribute to the overall corporate sustainability goals.
CC1.2
Do you provide incentives for the management of climate change issues, including the attainment of targets?
Yes
CC1.2a
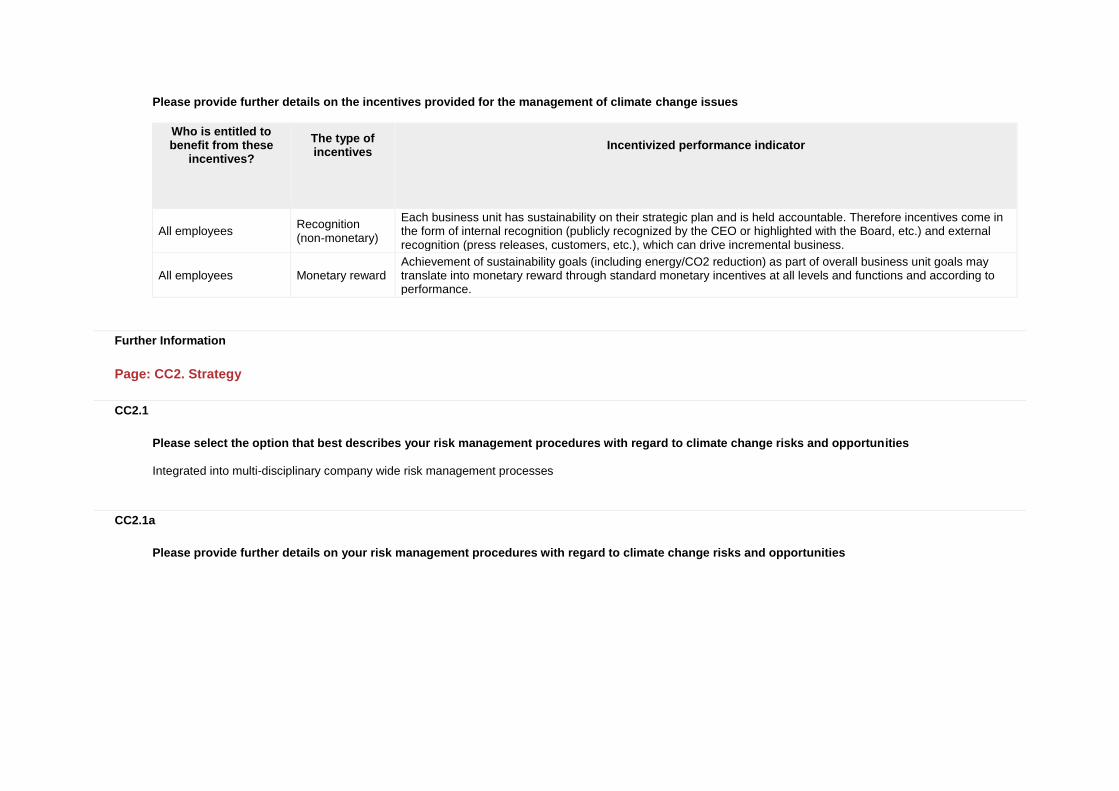
Please provide further details on the incentives provided for the management of climate change issues
Who is entitled to benefit from these
incentives?
The type of incentives
Incentivized performance indicator
All employees Recognition (non-monetary)
Each business unit has sustainability on their strategic plan and is held accountable. Therefore incentives come in the form of internal recognition (publicly recognized by the CEO or highlighted with the Board, etc.) and external recognition (press releases, customers, etc.), which can drive incremental business.
All employees Monetary reward Achievement of sustainability goals (including energy/CO2 reduction) as part of overall business unit goals may translate into monetary reward through standard monetary incentives at all levels and functions and according to performance.
Further Information
Page: CC2. Strategy
CC2.1
Please select the option that best describes your risk management procedures with regard to climate change risks and opportunities
Integrated into multi-disciplinary company wide risk management processes
CC2.1a
Please provide further details on your risk management procedures with regard to climate change risks and opportunities
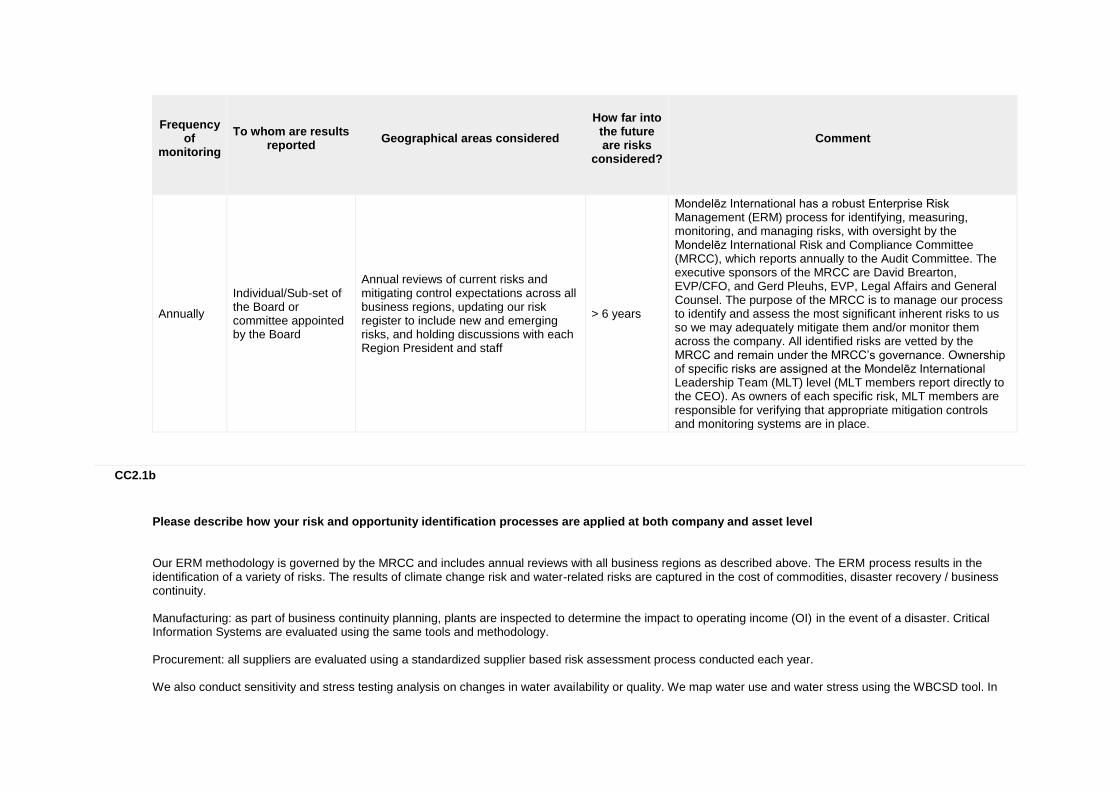
Frequency
of monitoring
To whom are results
reported
Geographical areas considered
How far into
the future are risks
considered?
Comment
Annually
Individual/Sub-set of the Board or committee appointed by the Board
Annual reviews of current risks and mitigating control expectations across all business regions, updating our risk register to include new and emerging risks, and holding discussions with each Region President and staff
> 6 years
Mondelēz International has a robust Enterprise Risk Management (ERM) process for identifying, measuring, monitoring, and managing risks, with oversight by the Mondelēz International Risk and Compliance Committee (MRCC), which reports annually to the Audit Committee. The executive sponsors of the MRCC are David Brearton, EVP/CFO, and Gerd Pleuhs, EVP, Legal Affairs and General Counsel. The purpose of the MRCC is to manage our process to identify and assess the most significant inherent risks to us so we may adequately mitigate them and/or monitor them across the company. All identified risks are vetted by the MRCC and remain under the MRCC’s governance. Ownership of specific risks are assigned at the Mondelēz International Leadership Team (MLT) level (MLT members report directly to the CEO). As owners of each specific risk, MLT members are responsible for verifying that appropriate mitigation controls and monitoring systems are in place.
CC2.1b
Please describe how your risk and opportunity identification processes are applied at both company and asset level
Our ERM methodology is governed by the MRCC and includes annual reviews with all business regions as described above. The ERM process results in the identification of a variety of risks. The results of climate change risk and water-related risks are captured in the cost of commodities, disaster recovery / business continuity. Manufacturing: as part of business continuity planning, plants are inspected to determine the impact to operating income (OI) in the event of a disaster. Critical Information Systems are evaluated using the same tools and methodology. Procurement: all suppliers are evaluated using a standardized supplier based risk assessment process conducted each year. We also conduct sensitivity and stress testing analysis on changes in water availability or quality. We map water use and water stress using the WBCSD tool. In

2013 we started to use the new WRI Aqueduct Water Risk Mapping tool, a complimentary tool to WBSCD, to map our sites in terms of overall water risk, water quality and legislative/media risk. Commodities: given the nature of challenges linked to sourcing agricultural commodities, we have developed specific ways of looking at longer-term challenges and risks. Notably, we have assessed with the World Wildlife Fund the long-term sustainability risks for many of our main commodities, including cocoa, coffee, palm oil and sugar. Also, we mapped our company’s total environmental footprint: carbon (air), land and water. This work has provided us with a better understanding of the impacts across our supply chain and will enable us to focus activities.
CC2.1c
How do you prioritize the risks and opportunities identified?
We use various multi-dimensional tools and models throughout the company to support the identification of corporate risks, to facilitate timely and effective risk response, and to have an adequate level of controls and safeguards, including SWOT analysis (Strength/Weakness/Opportunity/Threat), risk maps and third-party sources. For the corporation to assess the most important risks at a senior management level, we use a risk mapping process to help identify the impact and likelihood of the risk, based upon a uniform framework. The mapping process also includes an assessment of the controls in place to mitigate the risk. This allows senior management to rank financial, operational, compliance and strategic risks to verify the proper resources (including people, capital, time, and oversight) are in place. The MRCC is responsible for driving the risk culture through standard measurement and language for risk exposure. The Region Presidents and their staff are responsible for integrating the culture and measurement into existing business practices. To verify this process is being adhered to, the Internal Audit department verifies the control expectations set up by the MRCC through the course of the audits performed during the year and Region Internal Audit leads also participate as members of Region Risk and Compliance Committees. Manufacturing: plants with the highest OI impact must improve their property protection (against fire, flood, wind and earthquake losses to their property) to protect the company from loss. This focuses the capital dollars on the plants with the highest impact. Procurement: critical single and sole source suppliers are prioritized for risk mitigation through contractual agreements, business continuity planning or qualification of secondary suppliers. Specific focus is given suppliers supporting strategic product categories.
CC2.1d
Please explain why you do not have a process in place for assessing and managing risks and opportunities from climate change, and whether you plan to introduce such a process in future

Main reason for not having a process
Do you plan to introduce a process?
Comment
CC2.2
Is climate change integrated into your business strategy?
Yes
CC2.2a
Please describe the process of how climate change is integrated into your business strategy and any outcomes of this process
At Mondelēz International, we know that the sustainable growth of our business is inextricably linked to the well-being of the people who make and enjoy our products, and the communities that we serve. That is why we launched our Call for Well-Being – a call to action for ourselves, our suppliers and our partners to work together to have a positive impact on the well-being of the world. As explained in our annual report, the Call For Well-Being supports one of our five global growth strategies: “Protect the Well-being of Our Planet.” It is focused on four areas that are critical to the well-being of the world and where we can make the greatest impact: mindful snacking, sustainability, community and safety. Our collective efforts in these areas are designed to enable our business to grow, operate more efficiently and ensure create a sustainable future for our farmers and consumers. Sustainability is about preserving our world and its people. We all depend on just one planet. So all of us need to work together and find ways to use less energy, water and other resources, as well as reduce the waste we generate. For many years, we’ve listened to and worked with smallho lder farmers to promote sustainable supply chains. With our partners we help increase the farmers’ output, improve their livelihoods, build thriving communities and protect the environment. We’re using our resources to amplify this ongoing conversation. Our sustainability journey has put us on a path that is making a real difference. But we know we can’t do everything. So our focus is in those areas where we can have the greatest impact: sustainable agriculture and reducing the environmental footprint of our own operations. To reduce our environmental footprint by 2015, we set the following goals: • Cut our energy and water use in manufacturing by 15% per tonne of production

• Reduce our greenhouse gas emissions and waste from manufacturing by 15% per tonne of production • Make 60% of our production in Zero Waste to Landfill sites • Eliminate 50 million pounds (22,500 tons) of packaging material We set goals to help transform and secure our agricultural supply • All cocoa will ultimately be sustainably-sourced • 70% of global coffee will be sustainably-sourced by 2015 • 75% of Western European biscuits volume made with Harmony wheat by 2015 • Palm oil: 100% RSPO by 2015 Our sustainability goals are applied across our business units and are included in their strategic plans. We look at two key impact areas to reduce GHG emissions: direct and indirect control. Matters within our direct control are a relatively minor portion of our total footprint, but we have direct influence. We have ambitious manufacturing goals (above) to reduce manufacturing energy use and CO2 emissions related to energy use: From 2005-2010, we reduced energy use by 16% normalized to production. From 2010-2013 we reduced energy use an additional 6% when normalized to production. From 2005-2010 we reduced energy-related emissions by 18% when normalized to production. From 2010-2013 we reduced energy-related emissions an additional 9% when normalized to production. For indirect control, we are referring to areas beyond direct control, notably agriculture, which accounts for the largest share of our CO2e footprint. For this, we have a longer-term strategy and consider both the impact of climate change on our ability to secure the agricultural commodities we need to make our products and on the impact that those agricultural commodities have on global warming. We have focused where we may have better influence and opportunity to drive change. In late 2012, through our Cocoa Life and Coffee Made Happy initiatives, we have committed $600 million over the next 10 years to our largest and most comprehensive programs to date to support sustainable production and improve the livelihoods of millions of people in cocoa and coffee farming communities. We are tackling other commodities, such as sugar, palm oil, wheat and dairy. We performed a comprehensive and groundbreaking analysis of our environmental footprint, which includes carbon (air), water and land impacts across our whole lifecycle. This work has provided us with a better understanding of the impacts across our supply chain and will enable us to focus activities where it matters: CO2, water and land use. This review was initially conducted for Kraft Foods Global, Inc. in 2011. We update this analysis annually to help further refine our strategy. For more info, see: http://ir.mondelezinternational.com/releasedetail.cfm?ReleaseID=847172 We're leveraging our consumers and partners where we can and we have several success stories: Our Kenco coffee is a good example of sustainability influencing positive business results. Since we started using 100 percent Rainforest Alliance Certified coffee beans, consumers have responded, and the brand initially experienced sustained double-digit growth. Organic revenue growth was in the mid- to high-single digits in 2012. We also have greatly reduced our packaging and have lowered our energy use and waste output in our Kenco manufacturing plants. In Brazil, the Tang powdered beverage team has been working for several years to build sustainability into its business. They inspired more than 320,000 kids to join the brand’s “Green Squad” to learn more about sustainability. And they’ve also partnered with TerraCycle to “upcycle” more than one million drink pouches into new consumer goods, such as pencil cases and even composite lumber for building, which life-cycle assessments (LCAs) done in 2010 show have less impact compared to similar goods made with non-upcycled material.
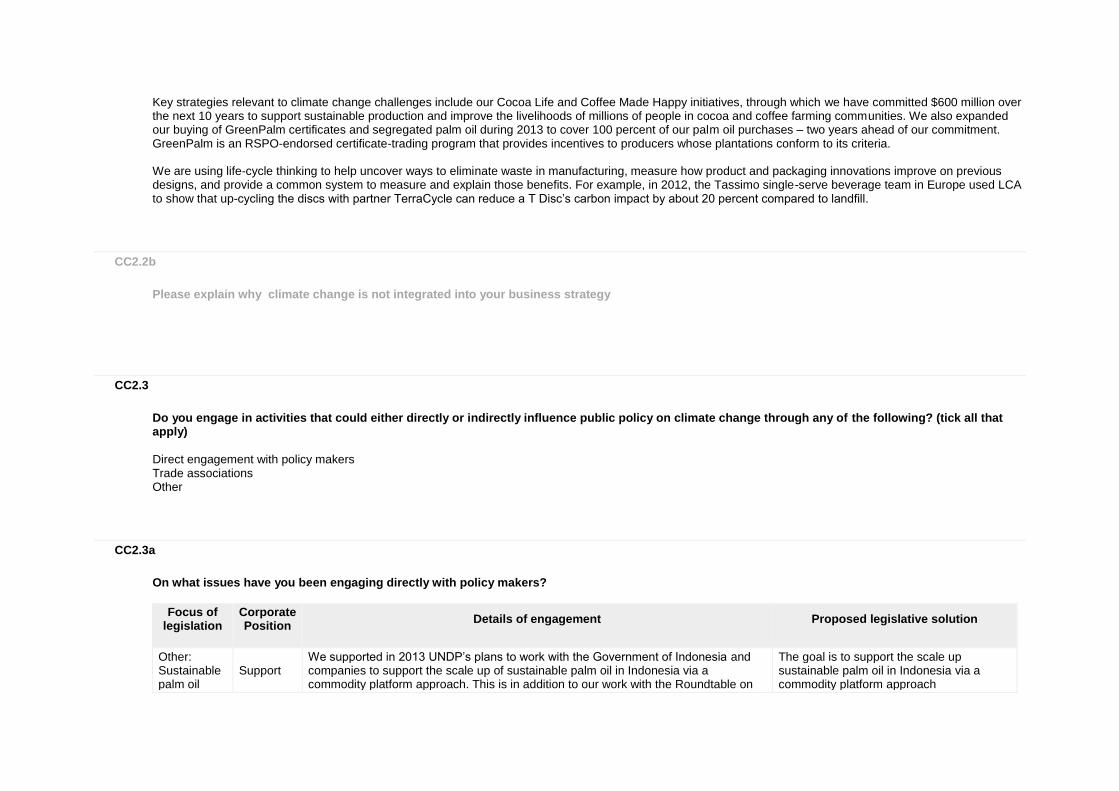
Key strategies relevant to climate change challenges include our Cocoa Life and Coffee Made Happy initiatives, through which we have committed $600 million over the next 10 years to support sustainable production and improve the livelihoods of millions of people in cocoa and coffee farming communities. We also expanded our buying of GreenPalm certificates and segregated palm oil during 2013 to cover 100 percent of our palm oil purchases – two years ahead of our commitment. GreenPalm is an RSPO-endorsed certificate-trading program that provides incentives to producers whose plantations conform to its criteria. We are using life-cycle thinking to help uncover ways to eliminate waste in manufacturing, measure how product and packaging innovations improve on previous designs, and provide a common system to measure and explain those benefits. For example, in 2012, the Tassimo single-serve beverage team in Europe used LCA to show that up-cycling the discs with partner TerraCycle can reduce a T Disc’s carbon impact by about 20 percent compared to landfill.
CC2.2b
Please explain why climate change is not integrated into your business strategy
CC2.3
Do you engage in activities that could either directly or indirectly influence public policy on climate change through any of the following? (tick all that apply)
Direct engagement with policy makers Trade associations Other
CC2.3a
On what issues have you been engaging directly with policy makers?
Focus of legislation
Corporate Position
Details of engagement
Proposed legislative solution
Other: Sustainable palm oil
Support We supported in 2013 UNDP’s plans to work with the Government of Indonesia and companies to support the scale up of sustainable palm oil in Indonesia via a commodity platform approach. This is in addition to our work with the Roundtable on
The goal is to support the scale up sustainable palm oil in Indonesia via a commodity platform approach
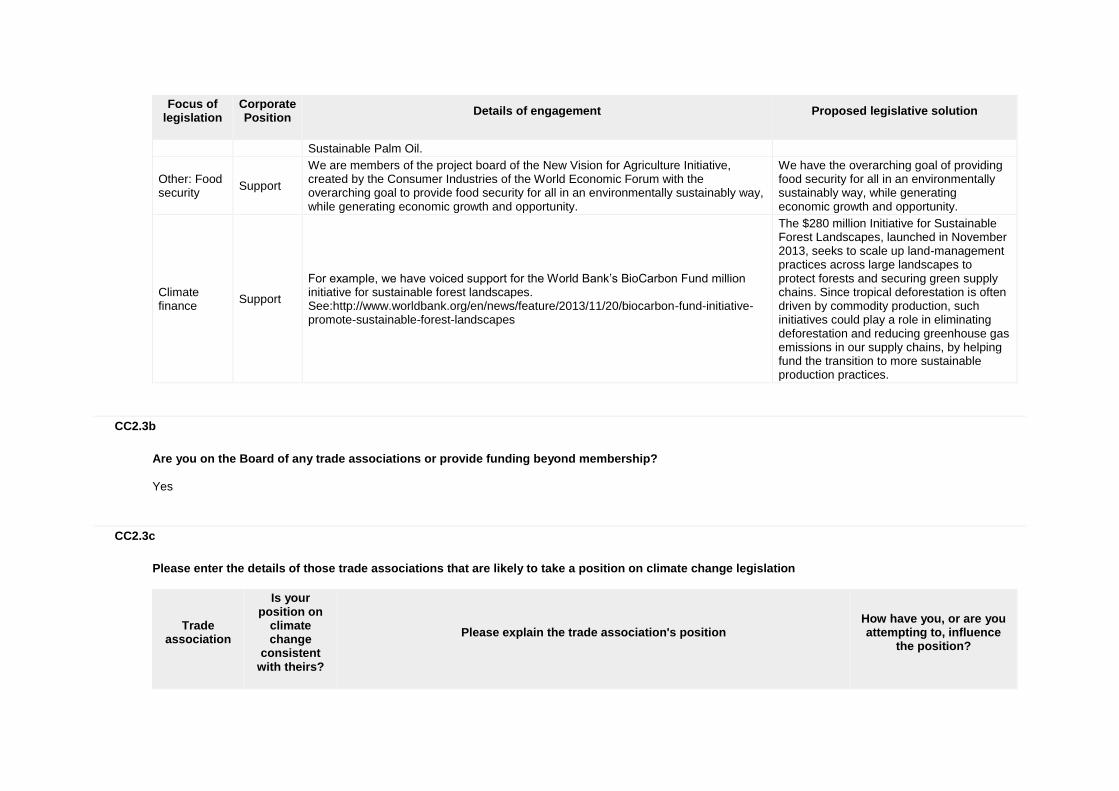
Focus of legislation
Corporate Position
Details of engagement
Proposed legislative solution
Sustainable Palm Oil.
Other: Food security
Support
We are members of the project board of the New Vision for Agriculture Initiative, created by the Consumer Industries of the World Economic Forum with the overarching goal to provide food security for all in an environmentally sustainably way, while generating economic growth and opportunity.
We have the overarching goal of providing food security for all in an environmentally sustainably way, while generating economic growth and opportunity.
Climate finance
Support
For example, we have voiced support for the World Bank’s BioCarbon Fund million initiative for sustainable forest landscapes. See:http://www.worldbank.org/en/news/feature/2013/11/20/biocarbon-fund-initiative-promote-sustainable-forest-landscapes
The $280 million Initiative for Sustainable Forest Landscapes, launched in November 2013, seeks to scale up land-management practices across large landscapes to protect forests and securing green supply chains. Since tropical deforestation is often driven by commodity production, such initiatives could play a role in eliminating deforestation and reducing greenhouse gas emissions in our supply chains, by helping fund the transition to more sustainable production practices.
CC2.3b
Are you on the Board of any trade associations or provide funding beyond membership?
Yes
CC2.3c
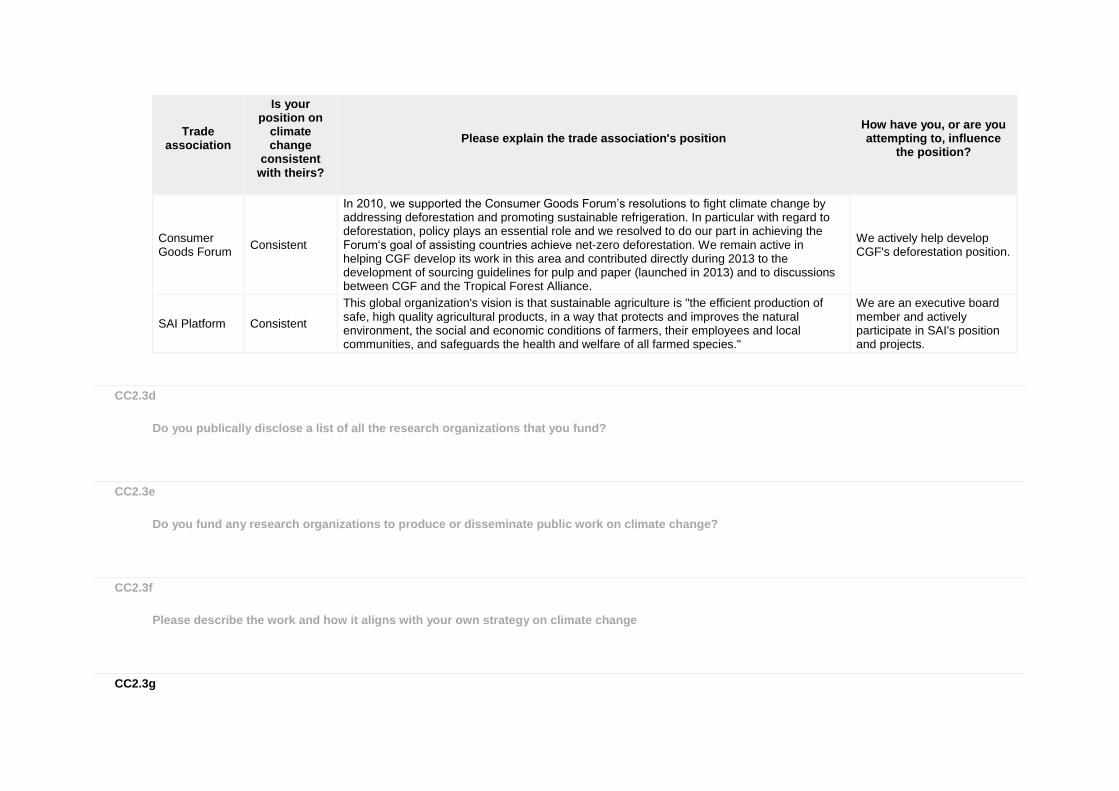
Please enter the details of those trade associations that are likely to take a position on climate change legislation
Trade association
Is your position on
climate change
consistent with theirs?
Please explain the trade association's position
How have you, or are you attempting to, influence
the position?
Trade association
Is your position on
climate change
consistent with theirs?
Please explain the trade association's position
How have you, or are you attempting to, influence
the position?
Consumer Goods Forum
Consistent
In 2010, we supported the Consumer Goods Forum’s resolutions to fight climate change by addressing deforestation and promoting sustainable refrigeration. In particular with regard to deforestation, policy plays an essential role and we resolved to do our part in achieving the Forum‘s goal of assisting countries achieve net-zero deforestation. We remain active in helping CGF develop its work in this area and contributed directly during 2013 to the development of sourcing guidelines for pulp and paper (launched in 2013) and to discussions between CGF and the Tropical Forest Alliance.
We actively help develop CGF's deforestation position.
SAI Platform Consistent
This global organization's vision is that sustainable agriculture is "the efficient production of safe, high quality agricultural products, in a way that protects and improves the natural environment, the social and economic conditions of farmers, their employees and local communities, and safeguards the health and welfare of all farmed species."
We are an executive board member and actively participate in SAI's position and projects.
CC2.3d
Do you publically disclose a list of all the research organizations that you fund?
CC2.3e
Do you fund any research organizations to produce or disseminate public work on climate change?
CC2.3f
Please describe the work and how it aligns with your own strategy on climate change
CC2.3g
Please provide details of the other engagement activities that you undertake
CC2.3h
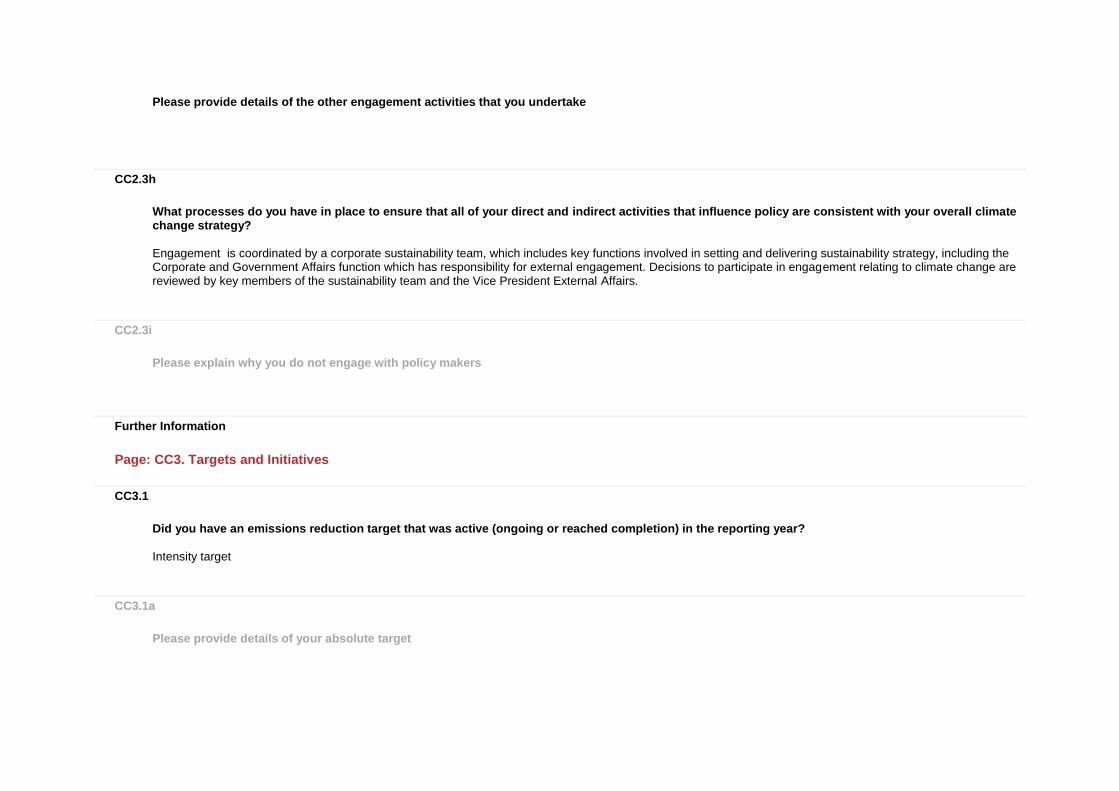
What processes do you have in place to ensure that all of your direct and indirect activities that influence policy are consistent with your overall climate change strategy?
Engagement is coordinated by a corporate sustainability team, which includes key functions involved in setting and delivering sustainability strategy, including the Corporate and Government Affairs function which has responsibility for external engagement. Decisions to participate in engagement relating to climate change are reviewed by key members of the sustainability team and the Vice President External Affairs.
CC2.3i
Please explain why you do not engage with policy makers
Further Information
Page: CC3. Targets and Initiatives
CC3.1
Did you have an emissions reduction target that was active (ongoing or reached completion) in the reporting year?
Intensity target
CC3.1a
Please provide details of your absolute target
ID
Scope
% of emissions in
scope
% reduction from base year
Base year
Base year emissions
(metric tonnes CO2e)
Target year
Comment
CC3.1b
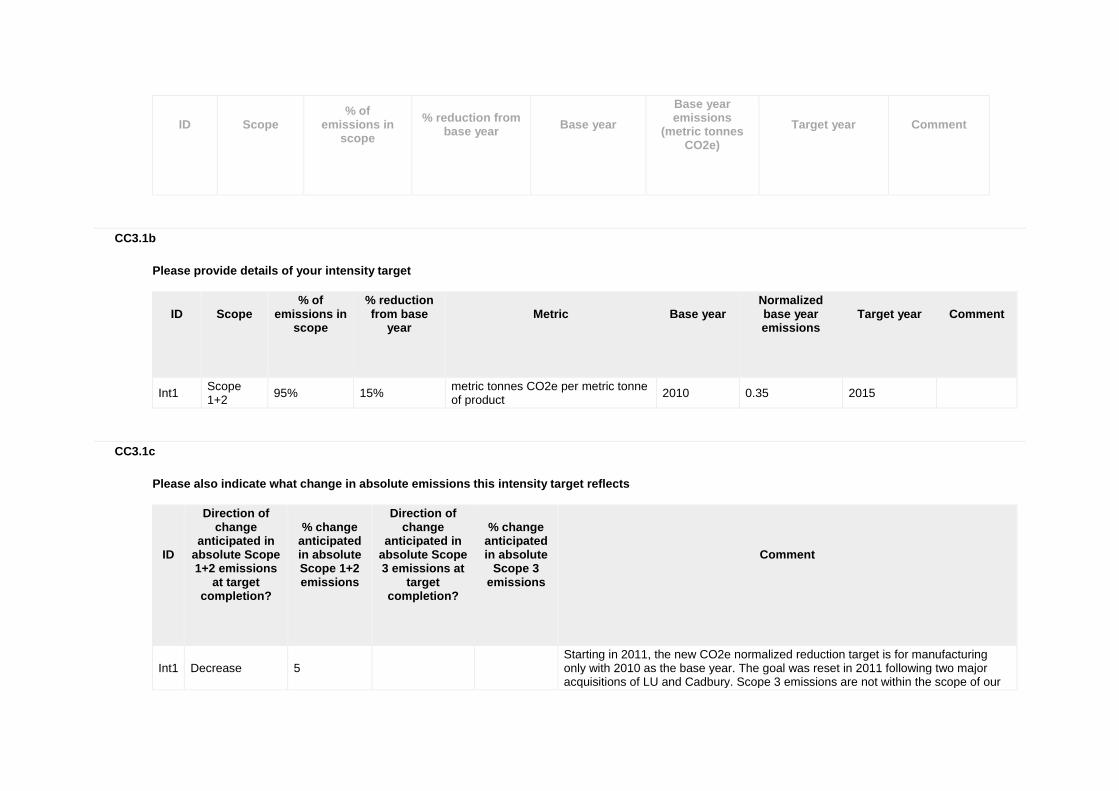
Please provide details of your intensity target
ID
Scope
% of emissions in
scope
% reduction from base
year
Metric
Base year
Normalized base year emissions
Target year
Comment
Int1 Scope 1+2
95% 15% metric tonnes CO2e per metric tonne of product
2010 0.35 2015
CC3.1c
Please also indicate what change in absolute emissions this intensity target reflects
ID
Direction of change
anticipated in absolute Scope 1+2 emissions
at target completion?
% change anticipated in absolute Scope 1+2 emissions
Direction of change
anticipated in absolute Scope 3 emissions at
target completion?
% change anticipated in absolute
Scope 3 emissions
Comment
Int1 Decrease 5
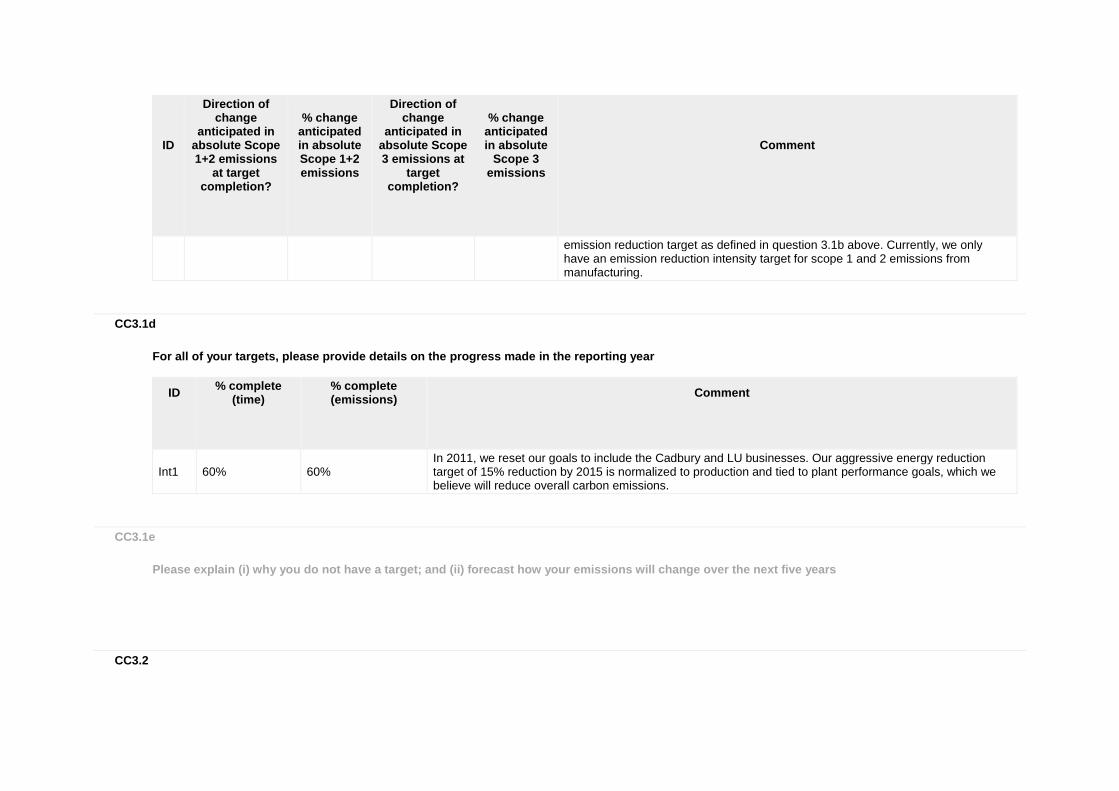
Starting in 2011, the new CO2e normalized reduction target is for manufacturing only with 2010 as the base year. The goal was reset in 2011 following two major acquisitions of LU and Cadbury. Scope 3 emissions are not within the scope of our
ID
Direction of change
anticipated in absolute Scope 1+2 emissions
at target completion?
% change anticipated in absolute Scope 1+2 emissions
Direction of change
anticipated in absolute Scope 3 emissions at
target completion?
% change anticipated in absolute
Scope 3 emissions
Comment
emission reduction target as defined in question 3.1b above. Currently, we only have an emission reduction intensity target for scope 1 and 2 emissions from manufacturing.
CC3.1d
For all of your targets, please provide details on the progress made in the reporting year
ID
% complete (time)
% complete (emissions)
Comment
Int1 60% 60% In 2011, we reset our goals to include the Cadbury and LU businesses. Our aggressive energy reduction target of 15% reduction by 2015 is normalized to production and tied to plant performance goals, which we believe will reduce overall carbon emissions.
CC3.1e
Please explain (i) why you do not have a target; and (ii) forecast how your emissions will change over the next five years
CC3.2
Does the use of your goods and/or services directly enable GHG emissions to be avoided by a third party?
Yes
CC3.2a
Please provide details of how the use of your goods and/or services directly enable GHG emissions to be avoided by a third party
As part of our strategy to protect the well-being of our planet, we work to eliminate packaging material from our products. Our in-house packaging R&D teams evaluate new packaging formats using our proprietary Eco-Calculator tool to help eliminate packaging weight from new designs. We then have suppliers make the packaging materials by using our designs. We use those packaging materials in our facilities while making our products. Consumers, therefore, benefit from buying products with reduced packaging materials. More information on our packaging elimination efforts is included in section 2.6 – packaging of our this year's DJSI reporting. We are making very good progress towards our goal to eliminate 50 million pounds of packaging material between 2010 and 2015, having eliminated 48 million pounds by the end of 2013. We estimate this benefits products accounting for 5% of our revenue.
CC3.3
Did you have emissions reduction initiatives that were active within the reporting year (this can include those in the planning and implementation phases)
Yes
CC3.3a
Please identify the total number of projects at each stage of development, and for those in the implementation stages, the estimated CO2e savings
Stage of development
Number of projects
Total estimated annual CO2e savings in metric tonnes CO2e (only for rows marked *)

Stage of development
Number of projects
Total estimated annual CO2e savings in metric tonnes CO2e (only for rows marked *)
Under investigation 0 0
To be implemented* 0 0
Implementation commenced* 3 1115
Implemented* 34 82146
Not to be implemented 0 0
CC3.3b
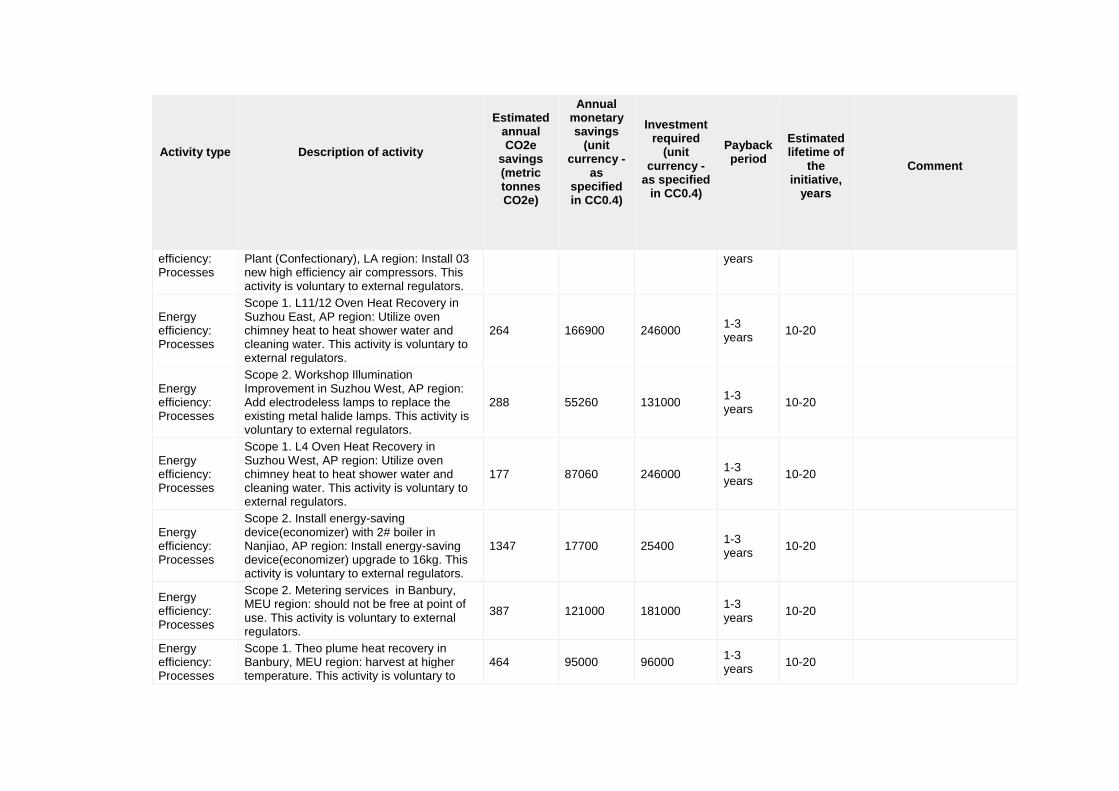
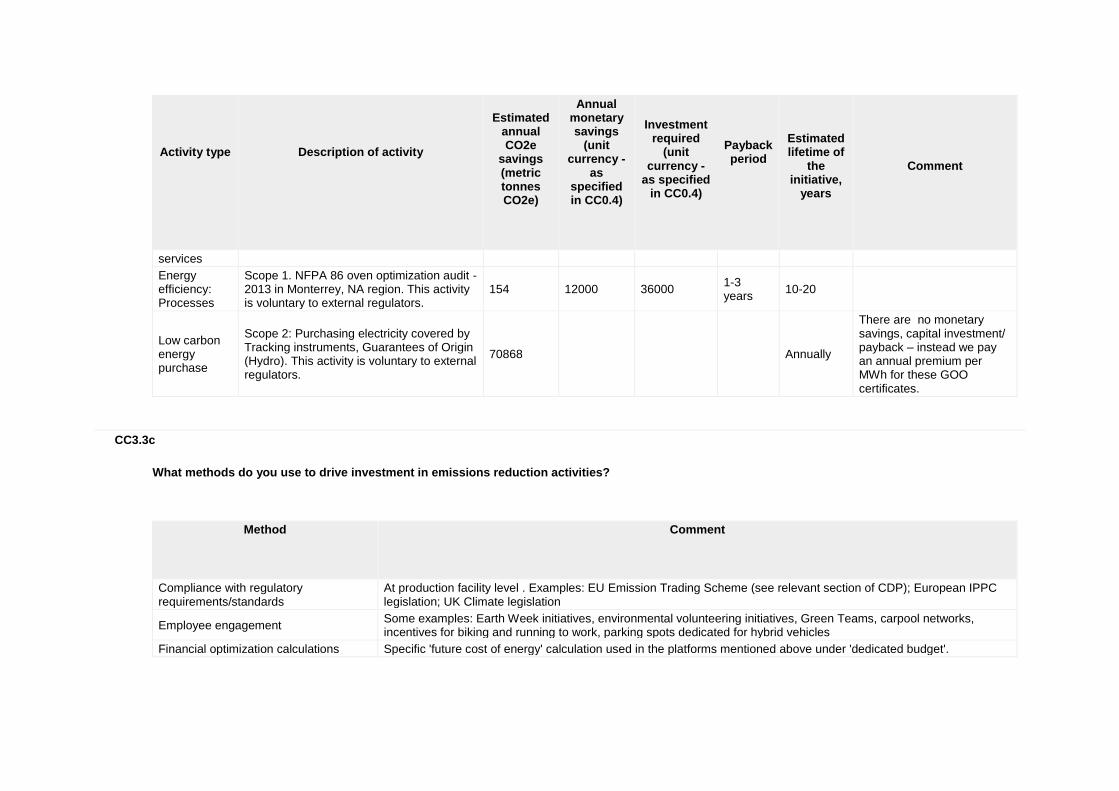
For those initiatives implemented in the reporting year, please provide details in the table below
Activity type
Description of activity
Estimated annual CO2e
savings (metric tonnes CO2e)
Annual monetary savings
(unit currency -
as specified in CC0.4)
Investment required
(unit currency -
as specified in CC0.4)
Payback period
Estimated lifetime of
the initiative,
years
Comment
Energy efficiency: Processes
Scope 1. Fuel Improvement Program in Ondo, EEMA region: Reduce cost on energy production and carbon emissions to environment. This activity is voluntary to external regulators.
24 210000 241000 1-3 years
10-20
Energy efficiency: Processes
Scope 2. Electroflow I in Cali Plant (Confectionary), LA region: Minimize electrical consumption peaks. This activity is voluntary to external regulators.
111 80000 225000 1-3 years
10-20
Energy Scope 2. Air Compressors Upgrade in Cali 175 126000 590000 4-10 10-20
Activity type
Description of activity
Estimated annual CO2e
savings (metric tonnes CO2e)
Annual monetary savings
(unit currency -
as specified in CC0.4)
Investment required
(unit currency -
as specified in CC0.4)
Payback period
Estimated lifetime of
the initiative,
years
Comment
efficiency: Processes
Plant (Confectionary), LA region: Install 03 new high efficiency air compressors. This activity is voluntary to external regulators.
years
Energy efficiency: Processes
Scope 1. L11/12 Oven Heat Recovery in Suzhou East, AP region: Utilize oven chimney heat to heat shower water and cleaning water. This activity is voluntary to external regulators.
264 166900 246000 1-3 years
10-20
Energy efficiency: Processes
Scope 2. Workshop Illumination Improvement in Suzhou West, AP region: Add electrodeless lamps to replace the existing metal halide lamps. This activity is voluntary to external regulators.
288 55260 131000 1-3 years
10-20
Energy efficiency: Processes
Scope 1. L4 Oven Heat Recovery in Suzhou West, AP region: Utilize oven chimney heat to heat shower water and cleaning water. This activity is voluntary to external regulators.
177 87060 246000 1-3 years
10-20
Energy efficiency: Processes
Scope 2. Install energy-saving device(economizer) with 2# boiler in Nanjiao, AP region: Install energy-saving device(economizer) upgrade to 16kg. This activity is voluntary to external regulators.
1347 17700 25400 1-3 years
10-20
Energy efficiency: Processes
Scope 2. Metering services in Banbury, MEU region: should not be free at point of use. This activity is voluntary to external regulators.
387 121000 181000 1-3 years
10-20
Energy efficiency: Processes
Scope 1. Theo plume heat recovery in Banbury, MEU region: harvest at higher temperature. This activity is voluntary to
464 95000 96000 1-3 years
10-20
Activity type
Description of activity
Estimated annual CO2e
savings (metric tonnes CO2e)
Annual monetary savings
(unit currency -
as specified in CC0.4)
Investment required
(unit currency -
as specified in CC0.4)
Payback period
Estimated lifetime of
the initiative,
years
Comment
external regulators.
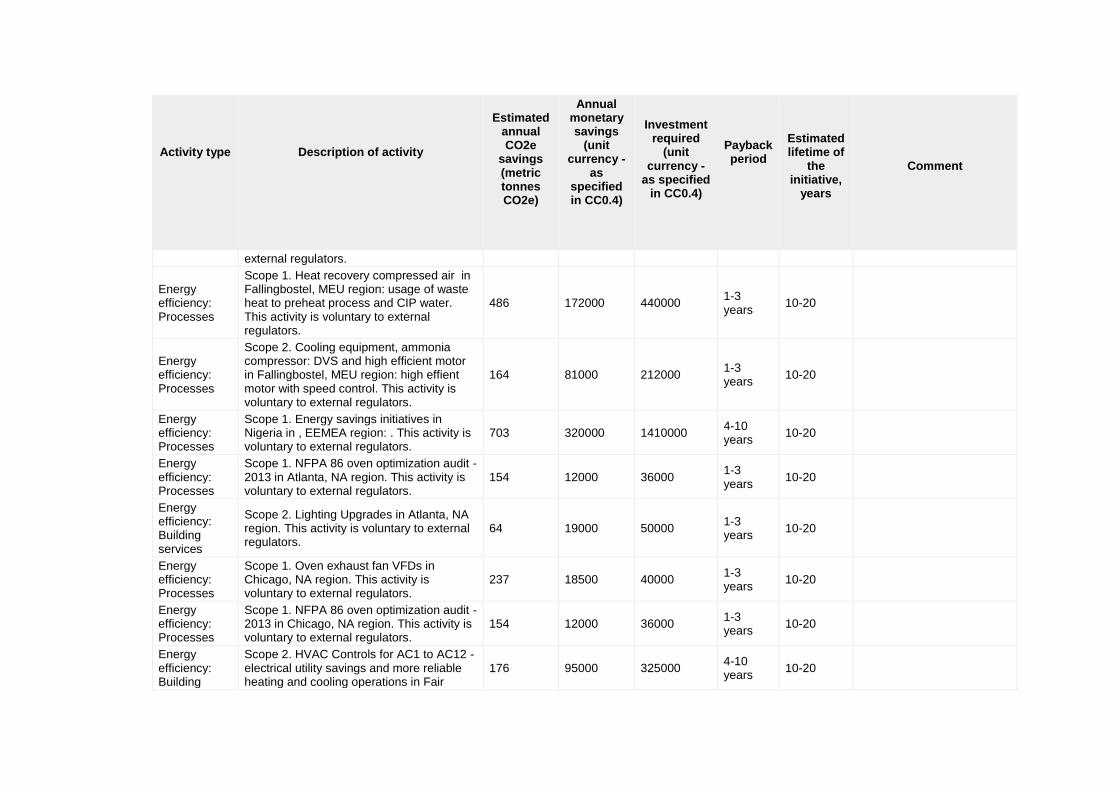
Energy efficiency: Processes
Scope 1. Heat recovery compressed air in Fallingbostel, MEU region: usage of waste heat to preheat process and CIP water. This activity is voluntary to external regulators.
486 172000 440000 1-3 years
10-20
Energy efficiency: Processes
Scope 2. Cooling equipment, ammonia compressor: DVS and high efficient motor in Fallingbostel, MEU region: high effient motor with speed control. This activity is voluntary to external regulators.
164 81000 212000 1-3 years
10-20
Energy efficiency: Processes
Scope 1. Energy savings initiatives in Nigeria in , EEMEA region: . This activity is voluntary to external regulators.
703 320000 1410000 4-10 years
10-20
Energy efficiency: Processes
Scope 1. NFPA 86 oven optimization audit - 2013 in Atlanta, NA region. This activity is voluntary to external regulators.
154 12000 36000 1-3 years
10-20
Energy efficiency: Building services
Scope 2. Lighting Upgrades in Atlanta, NA region. This activity is voluntary to external regulators.
64 19000 50000 1-3 years
10-20
Energy efficiency: Processes
Scope 1. Oven exhaust fan VFDs in Chicago, NA region. This activity is voluntary to external regulators.
237 18500 40000 1-3 years
10-20
Energy efficiency: Processes
Scope 1. NFPA 86 oven optimization audit - 2013 in Chicago, NA region. This activity is voluntary to external regulators.
154 12000 36000 1-3 years
10-20
Energy efficiency: Building
Scope 2. HVAC Controls for AC1 to AC12 - electrical utility savings and more reliable heating and cooling operations in Fair
176 95000 325000 4-10 years
10-20
Activity type
Description of activity
Estimated annual CO2e
savings (metric tonnes CO2e)
Annual monetary savings
(unit currency -
as specified in CC0.4)
Investment required
(unit currency -
as specified in CC0.4)
Payback period
Estimated lifetime of
the initiative,
years
Comment
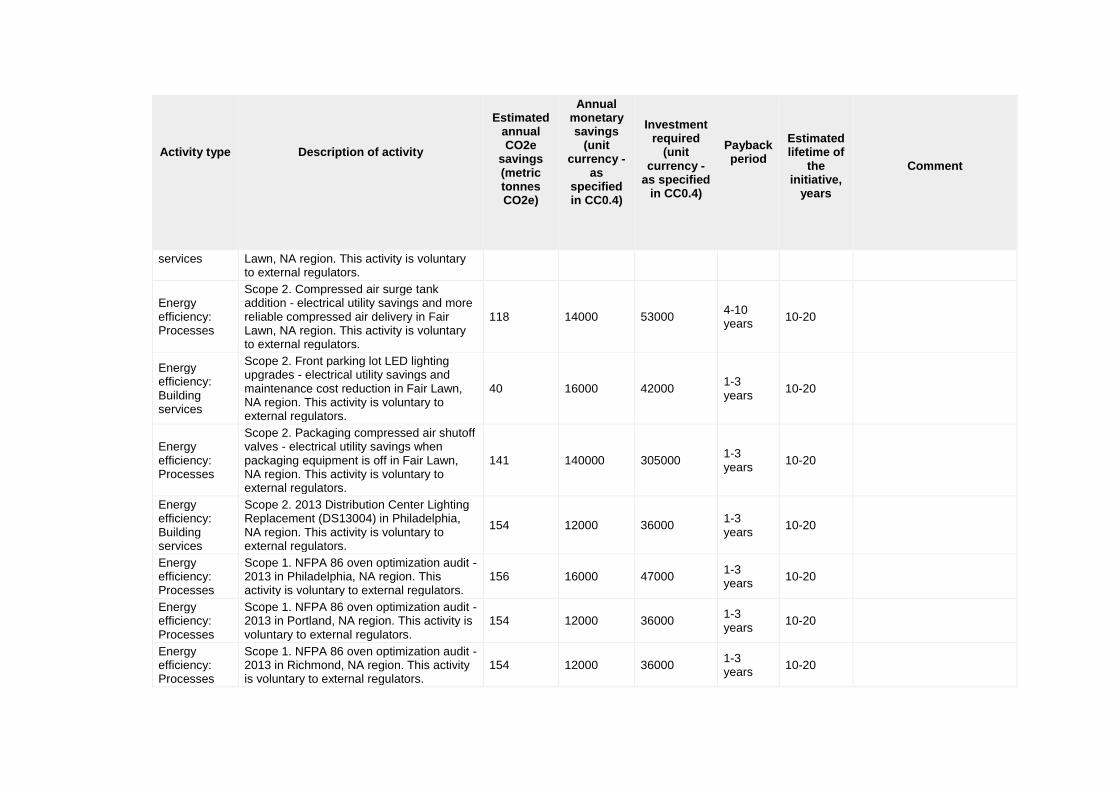
services Lawn, NA region. This activity is voluntary to external regulators.
Energy efficiency: Processes
Scope 2. Compressed air surge tank addition - electrical utility savings and more reliable compressed air delivery in Fair Lawn, NA region. This activity is voluntary to external regulators.
118 14000 53000 4-10 years
10-20
Energy efficiency: Building services
Scope 2. Front parking lot LED lighting upgrades - electrical utility savings and maintenance cost reduction in Fair Lawn, NA region. This activity is voluntary to external regulators.
40 16000 42000 1-3 years
10-20
Energy efficiency: Processes
Scope 2. Packaging compressed air shutoff valves - electrical utility savings when packaging equipment is off in Fair Lawn, NA region. This activity is voluntary to external regulators.
141 140000 305000 1-3 years
10-20
Energy efficiency: Building services
Scope 2. 2013 Distribution Center Lighting Replacement (DS13004) in Philadelphia, NA region. This activity is voluntary to external regulators.
154 12000 36000 1-3 years
10-20
Energy efficiency: Processes
Scope 1. NFPA 86 oven optimization audit - 2013 in Philadelphia, NA region. This activity is voluntary to external regulators.
156 16000 47000 1-3 years
10-20
Energy efficiency: Processes
Scope 1. NFPA 86 oven optimization audit - 2013 in Portland, NA region. This activity is voluntary to external regulators.
154 12000 36000 1-3 years
10-20
Energy efficiency: Processes
Scope 1. NFPA 86 oven optimization audit - 2013 in Richmond, NA region. This activity is voluntary to external regulators.
154 12000 36000 1-3 years
10-20

Activity type
Description of activity
Estimated annual CO2e
savings (metric tonnes CO2e)
Annual monetary savings
(unit currency -
as specified in CC0.4)
Investment required
(unit currency -
as specified in CC0.4)
Payback period
Estimated lifetime of
the initiative,
years
Comment
Energy efficiency: Building services
Scope 2. Lighting (Wesco) in Richmond, NA region. This activity is voluntary to external regulators.
1263 129000 309000 4-10 years
10-20
Energy efficiency: Building services
Scope 2. LED Lighting in Gum Base Sweetener in Rockford, NA region. This activity is voluntary to external regulators.
196 20000 82000 1-3 years
10-20
Energy efficiency: Processes
Scope 2. Air leak repair program (UE audit 2012) in Rockford, NA region. This activity is voluntary to external regulators.
579 50000 0 1-3 years
10-20
Energy efficiency: Processes
Scope 2. Compressed Air Technologies (26.5% IRR) in Rockford, NA region. This activity is voluntary to external regulators.
1794 150000 550000 1-3 years
10-20
Energy efficiency: Building services
Scope 2. Upgraded lighting mercury vapor to LED - Rail Shed in Toledo, NA region. This activity is voluntary to external regulators.
64 19000 50000 1-3 years
10-20
Energy efficiency: Processes
Scope 2. Compressed Air Technologies Assessment, storage tank & controller, replaced polyflow tubing, leak tag program in Toledo, NA region. This activity is voluntary to external regulators.
137 14000 37000 1-3 years
10-20
Energy efficiency: Building fabric
Scope 1. Steam Jacket Insulation in Toledo, NA region. This activity is voluntary to external regulators.
103 8000 19500 1-3 years
10-20
Energy efficiency: Building
Scope 2. Plant lighting and ecological redesign in Monterrey, NA region. This activity is voluntary to external regulators.
1655 400 450 1-3 years
10-20
Activity type
Description of activity
Estimated annual CO2e
savings (metric tonnes CO2e)
Annual monetary savings
(unit currency -
as specified in CC0.4)
Investment required
(unit currency -
as specified in CC0.4)
Payback period
Estimated lifetime of
the initiative,
years
Comment
services
Energy efficiency: Processes
Scope 1. NFPA 86 oven optimization audit - 2013 in Monterrey, NA region. This activity is voluntary to external regulators.
154 12000 36000 1-3 years
10-20
Low carbon energy purchase
Scope 2: Purchasing electricity covered by Tracking instruments, Guarantees of Origin (Hydro). This activity is voluntary to external regulators.
70868
Annually
There are no monetary savings, capital investment/ payback – instead we pay an annual premium per MWh for these GOO certificates.
CC3.3c
What methods do you use to drive investment in emissions reduction activities?
Method
Comment
Compliance with regulatory requirements/standards
At production facility level . Examples: EU Emission Trading Scheme (see relevant section of CDP); European IPPC legislation; UK Climate legislation
Employee engagement Some examples: Earth Week initiatives, environmental volunteering initiatives, Green Teams, carpool networks, incentives for biking and running to work, parking spots dedicated for hybrid vehicles
Financial optimization calculations Specific 'future cost of energy' calculation used in the platforms mentioned above under 'dedicated budget'.
CC3.3d
If you do not have any emissions reduction initiatives, please explain why not
Further Information
Page: CC4. Communication
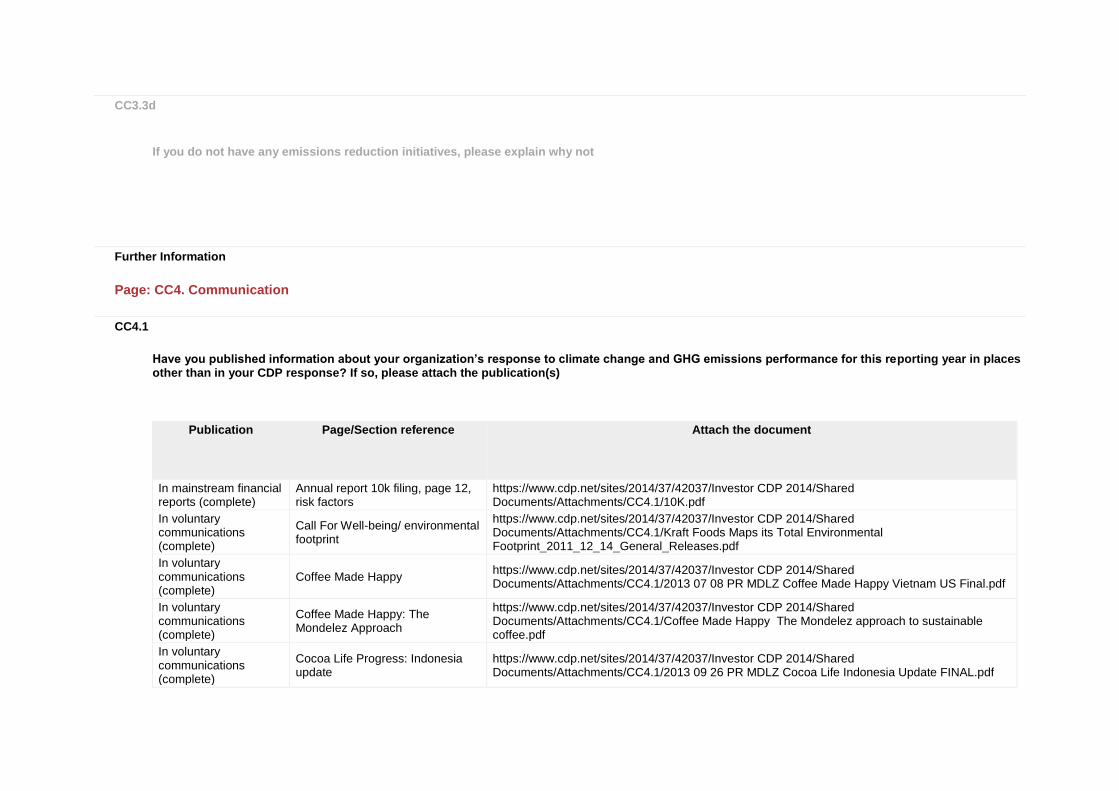
CC4.1
Have you published information about your organization’s response to climate change and GHG emissions performance for this reporting year in places other than in your CDP response? If so, please attach the publication(s)
Publication
Page/Section reference
Attach the document
In mainstream financial reports (complete)
Annual report 10k filing, page 12, risk factors
https://www.cdp.net/sites/2014/37/42037/Investor CDP 2014/Shared Documents/Attachments/CC4.1/10K.pdf
In voluntary communications (complete)
Call For Well-being/ environmental footprint
https://www.cdp.net/sites/2014/37/42037/Investor CDP 2014/Shared Documents/Attachments/CC4.1/Kraft Foods Maps its Total Environmental Footprint_2011_12_14_General_Releases.pdf
In voluntary communications (complete)
Coffee Made Happy https://www.cdp.net/sites/2014/37/42037/Investor CDP 2014/Shared Documents/Attachments/CC4.1/2013 07 08 PR MDLZ Coffee Made Happy Vietnam US Final.pdf
In voluntary communications (complete)
Coffee Made Happy: The Mondelez Approach
https://www.cdp.net/sites/2014/37/42037/Investor CDP 2014/Shared Documents/Attachments/CC4.1/Coffee Made Happy The Mondelez approach to sustainable coffee.pdf
In voluntary communications (complete)
Cocoa Life Progress: Indonesia update
https://www.cdp.net/sites/2014/37/42037/Investor CDP 2014/Shared Documents/Attachments/CC4.1/2013 09 26 PR MDLZ Cocoa Life Indonesia Update FINAL.pdf
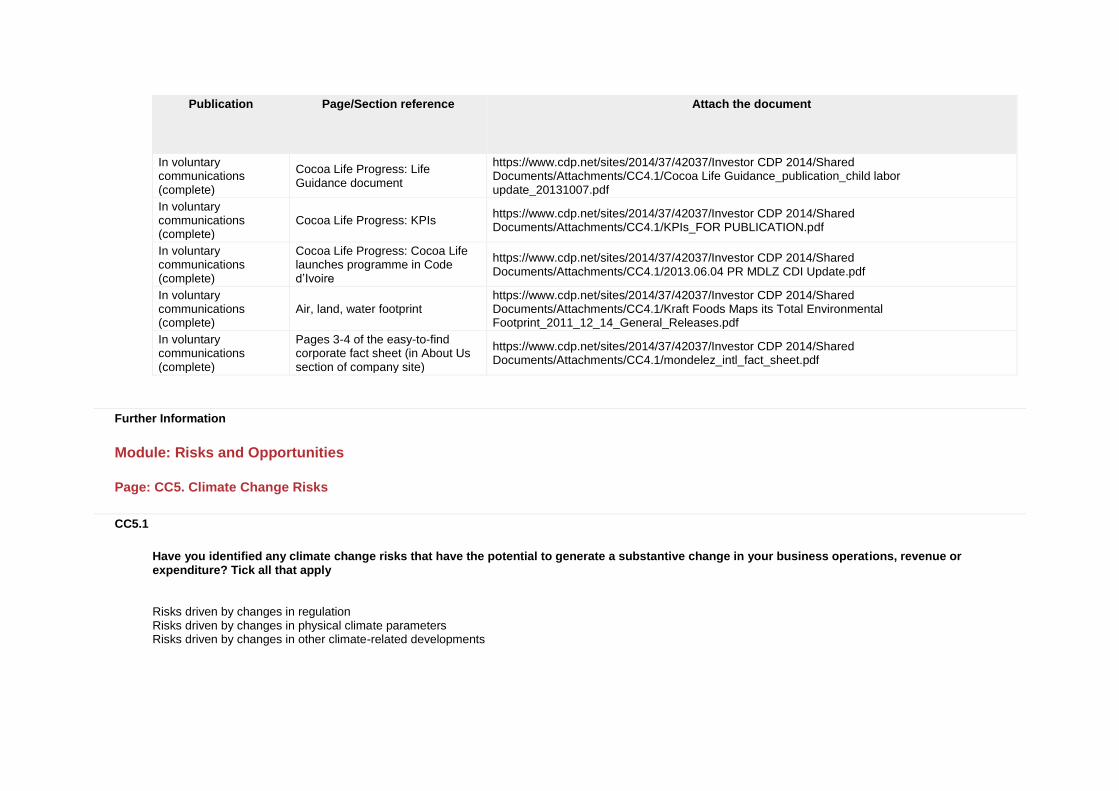
Publication
Page/Section reference
Attach the document
In voluntary communications (complete)
Cocoa Life Progress: Life Guidance document
https://www.cdp.net/sites/2014/37/42037/Investor CDP 2014/Shared Documents/Attachments/CC4.1/Cocoa Life Guidance_publication_child labor update_20131007.pdf
In voluntary communications (complete)
Cocoa Life Progress: KPIs https://www.cdp.net/sites/2014/37/42037/Investor CDP 2014/Shared Documents/Attachments/CC4.1/KPIs_FOR PUBLICATION.pdf
In voluntary communications (complete)
Cocoa Life Progress: Cocoa Life launches programme in Code d’Ivoire
https://www.cdp.net/sites/2014/37/42037/Investor CDP 2014/Shared Documents/Attachments/CC4.1/2013.06.04 PR MDLZ CDI Update.pdf
In voluntary communications (complete)
Air, land, water footprint https://www.cdp.net/sites/2014/37/42037/Investor CDP 2014/Shared Documents/Attachments/CC4.1/Kraft Foods Maps its Total Environmental Footprint_2011_12_14_General_Releases.pdf
In voluntary communications (complete)
Pages 3-4 of the easy-to-find corporate fact sheet (in About Us section of company site)
https://www.cdp.net/sites/2014/37/42037/Investor CDP 2014/Shared Documents/Attachments/CC4.1/mondelez_intl_fact_sheet.pdf
Further Information
Module: Risks and Opportunities
Page: CC5. Climate Change Risks
CC5.1
Have you identified any climate change risks that have the potential to generate a substantive change in your business operations, revenue or expenditure? Tick all that apply
Risks driven by changes in regulation Risks driven by changes in physical climate parameters Risks driven by changes in other climate-related developments

CC5.1a
Please describe your risks driven by changes in regulation
Risk driver
Description
Potential impact
Timeframe
Direct/ Indirect
Likelihood
Magnitude of impact
Estimated financial
implications
Management method
Cost of
management
Other regulatory drivers
The main risks for Mondelēz International and other food companies are the following: cost of complying with regulatory targets.
Increased operational cost
Unknown Direct Unknown Unknown
Mondelēz International’s sustainability strategy and our targets to reduce energy consumption and CO2 emission in our operations constitute a concrete approach to mitigating these risks by anticipating regulatory requirements
Fuel/energy taxes and regulations
Increased cost to generate and purchase energy.
Increased operational cost
Unknown Direct Unknown Unknown
Mondelēz International’s sustainability strategy and our targets to reduce energy consumption and CO2 emission in our operations constitute a concrete approach to mitigating these risks by anticipating regulatory requirements
Renewable energy regulation
Increased raw material cost due, among others, to the distortive effects of biofuel incentives.
Increased operational cost
Unknown Indirect (Client)
Unknown Unknown
Mondelēz International’s sustainability strategy and our targets to reduce energy consumption and CO2 emission in our operations constitute a concrete approach to mitigating these risks by anticipating regulatory requirements
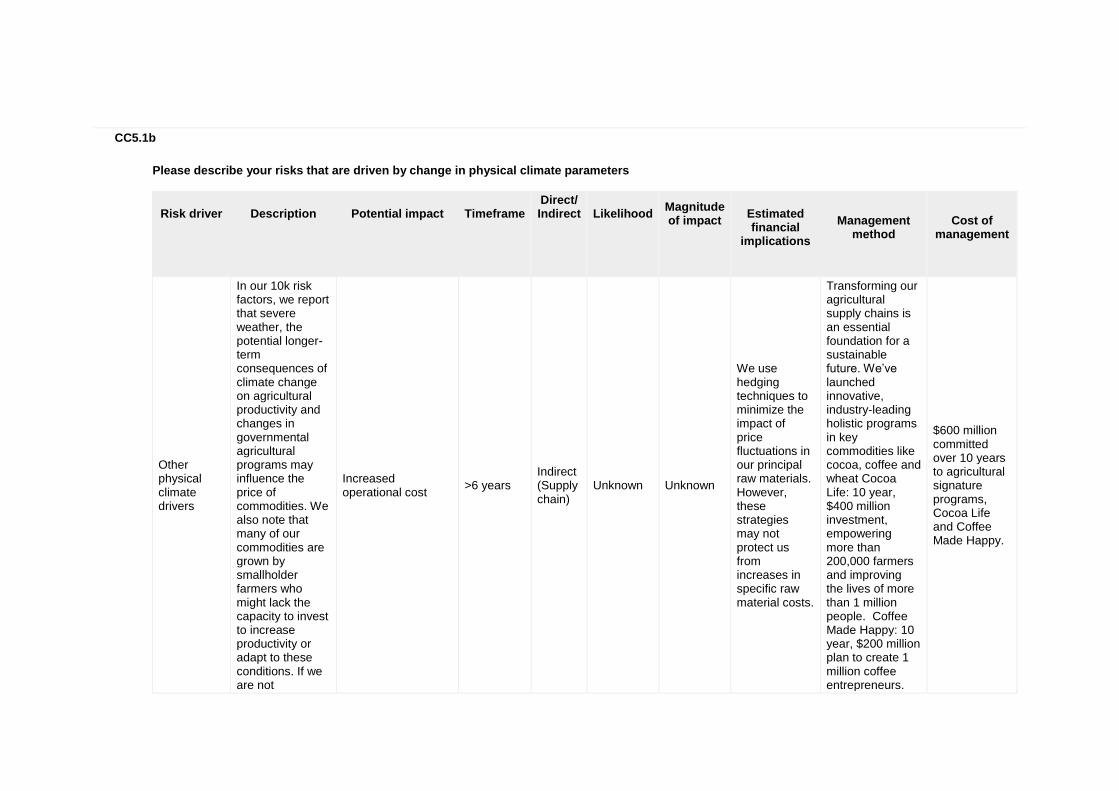
CC5.1b
Please describe your risks that are driven by change in physical climate parameters
Risk driver
Description
Potential impact
Timeframe
Direct/ Indirect
Likelihood
Magnitude of impact
Estimated financial
implications
Management
method
Cost of
management
Other physical climate drivers
In our 10k risk factors, we report that severe weather, the potential longer-term consequences of climate change on agricultural productivity and changes in governmental agricultural programs may influence the price of commodities. We also note that many of our commodities are grown by smallholder farmers who might lack the capacity to invest to increase productivity or adapt to these conditions. If we are not
Increased operational cost
>6 years Indirect (Supply chain)
Unknown Unknown
We use hedging techniques to minimize the impact of price fluctuations in our principal raw materials. However, these strategies may not protect us from increases in specific raw material costs.
Transforming our agricultural supply chains is an essential foundation for a sustainable future. We’ve launched innovative, industry-leading holistic programs in key commodities like cocoa, coffee and wheat Cocoa Life: 10 year, $400 million investment, empowering more than 200,000 farmers and improving the lives of more than 1 million people. Coffee Made Happy: 10 year, $200 million plan to create 1 million coffee entrepreneurs.
$600 million committed over 10 years to agricultural signature programs, Cocoa Life and Coffee Made Happy.

Risk driver
Description
Potential impact
Timeframe
Direct/ Indirect
Likelihood
Magnitude of impact
Estimated financial
implications
Management
method
Cost of
management
successful in our mitigation activities, if we are unable to price to cover increased costs or must reduce our prices, or if we are limited by supply constraints, our financial condition and results of operations could be materially adversely affected.
Harmony: our European wheat program, Harmony, promotes biodiversity and good environmental practices in wheat production. Beyond this, as the foundation for all our work in sustainable agriculture, we’re embedding sustainability into our sourcing practices across our commodities.
Change in precipitation extremes and droughts
In addition, localized episodic extreme weather events such as floods and severe storms have the potential to temporarily disrupt Mondelēz International’s business operations (including raw material sourcing,
Reduction/disruption in production capacity
Unknown
Unknown Unknown
Mondelēz International has in place several protocols, including special situations management and emergency preparedness and response procedures. These allow us to address and help mitigate adverse effects.
Risk driver
Description
Potential impact
Timeframe
Direct/ Indirect
Likelihood
Magnitude of impact
Estimated financial
implications
Management
method
Cost of
management
manufacturing and product distribution) in affected areas.
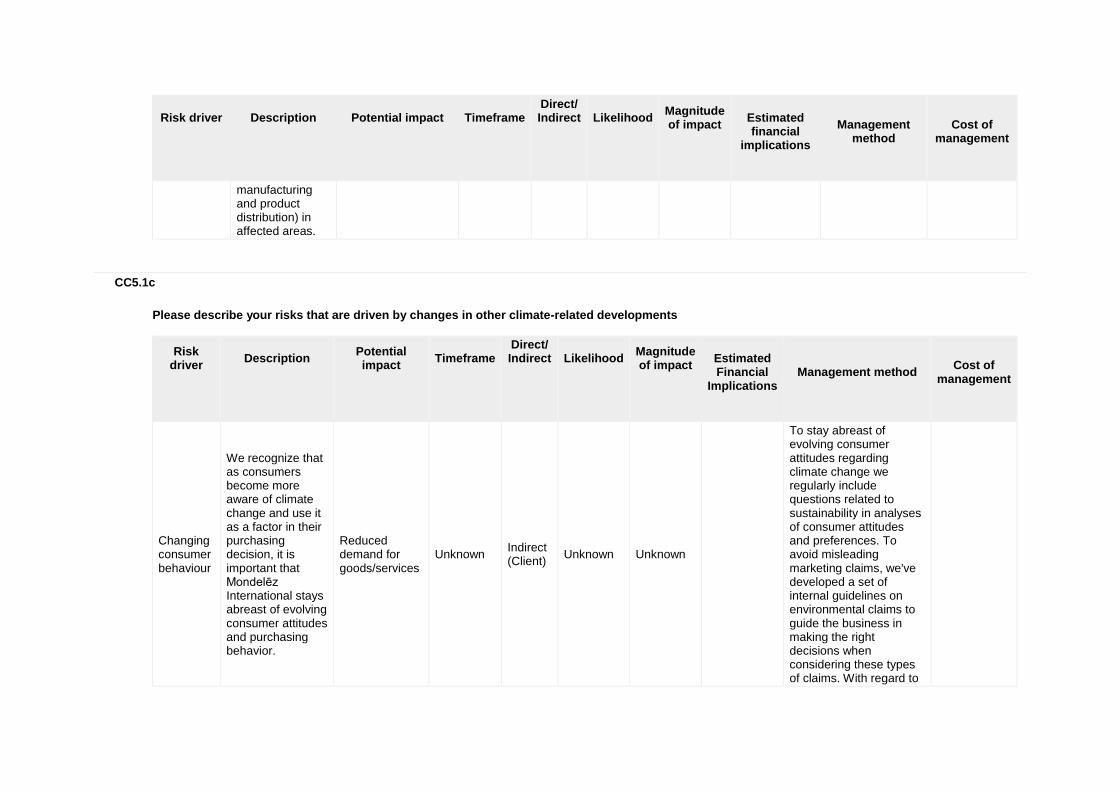
CC5.1c
Please describe your risks that are driven by changes in other climate-related developments
Risk driver
Description
Potential impact
Timeframe
Direct/ Indirect
Likelihood
Magnitude of impact
Estimated Financial
Implications
Management method
Cost of
management
Changing consumer behaviour
We recognize that as consumers become more aware of climate change and use it as a factor in their purchasing decision, it is important that Mondelēz International stays abreast of evolving consumer attitudes and purchasing behavior.
Reduced demand for goods/services
Unknown Indirect (Client)
Unknown Unknown
To stay abreast of evolving consumer attitudes regarding climate change we regularly include questions related to sustainability in analyses of consumer attitudes and preferences. To avoid misleading marketing claims, we've developed a set of internal guidelines on environmental claims to guide the business in making the right decisions when considering these types of claims. With regard to

Risk driver
Description
Potential impact
Timeframe
Direct/ Indirect
Likelihood
Magnitude of impact
Estimated Financial
Implications
Management method
Cost of
management
land use/ deforestation, Mondelēz International has engaged with suppliers and NGOs and the Consumer Goods Forum and, in specific cases, supported certain sustainability standards for commodities.
CC5.1d
Please explain why you do not consider your company to be exposed to risks driven by changes in regulation that have the potential to generate a substantive change in your business operations, revenue or expenditure
CC5.1e
Please explain why you do not consider your company to be exposed to risks driven by physical climate parameters that have the potential to generate a substantive change in your business operations, revenue or expenditure
CC5.1f
Please explain why you do not consider your company to be exposed to risks driven by changes in other climate-related developments that have the potential to generate a substantive change in your business operations, revenue or expenditure
Further Information
Page: CC6. Climate Change Opportunities
CC6.1
Have you identified any climate change opportunities that have the potential to generate a substantive change in your business operations, revenue or expenditure? Tick all that apply
CC6.1a
Please describe your opportunities that are driven by changes in regulation
Opportunity driver
Description
Potential impact
Timeframe
Direct/Indirect
Likelihood
Magnitude of impact
Estimated financial
implications
Management
method
Cost of
management
CC6.1b
Please describe the opportunities that are driven by changes in physical climate parameters
Opportunity driver
Description
Potential impact
Timeframe
Direct/ Indirect
Likelihood
Magnitude of impact
Estimated financial
implications
Management
method
Cost of
management
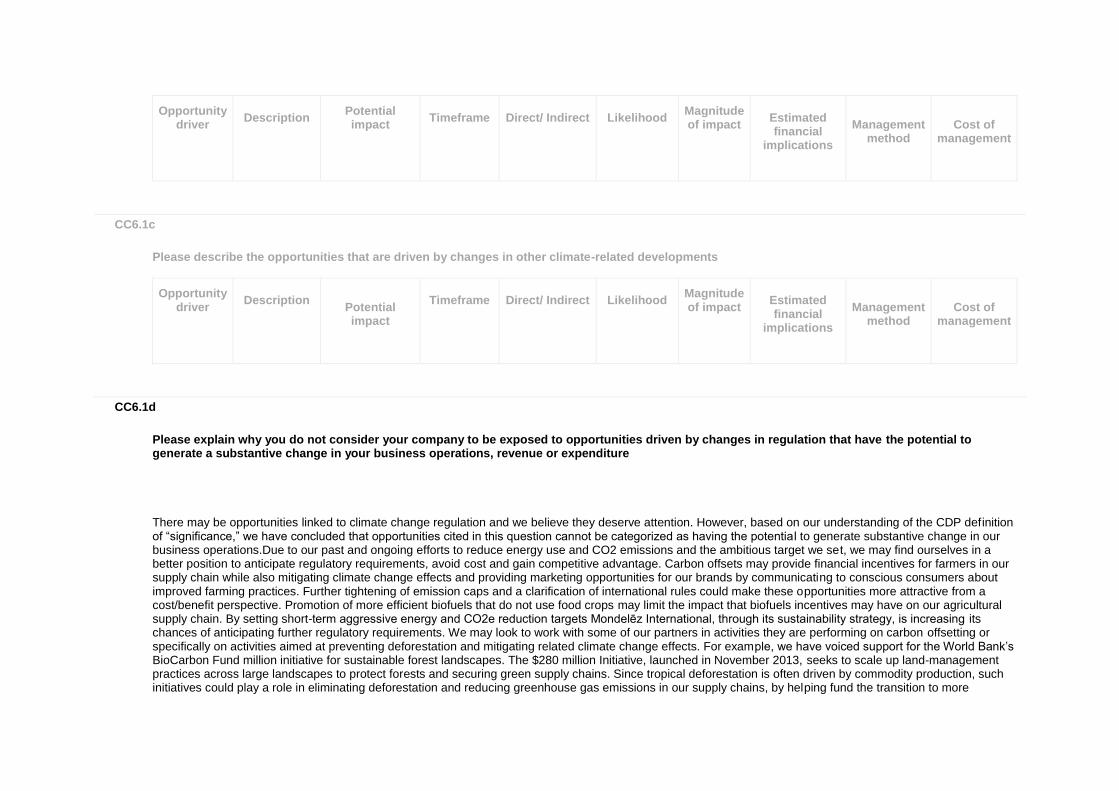
CC6.1c
Please describe the opportunities that are driven by changes in other climate-related developments
Opportunity driver
Description
Potential impact
Timeframe
Direct/ Indirect
Likelihood
Magnitude of impact
Estimated financial
implications
Management
method
Cost of
management
CC6.1d
Please explain why you do not consider your company to be exposed to opportunities driven by changes in regulation that have the potential to generate a substantive change in your business operations, revenue or expenditure
There may be opportunities linked to climate change regulation and we believe they deserve attention. However, based on our understanding of the CDP definition of “significance,” we have concluded that opportunities cited in this question cannot be categorized as having the potential to generate substantive change in our business operations.Due to our past and ongoing efforts to reduce energy use and CO2 emissions and the ambitious target we set, we may find ourselves in a better position to anticipate regulatory requirements, avoid cost and gain competitive advantage. Carbon offsets may provide financial incentives for farmers in our supply chain while also mitigating climate change effects and providing marketing opportunities for our brands by communicating to conscious consumers about improved farming practices. Further tightening of emission caps and a clarification of international rules could make these opportunities more attractive from a cost/benefit perspective. Promotion of more efficient biofuels that do not use food crops may limit the impact that biofuels incentives may have on our agricultural supply chain. By setting short-term aggressive energy and CO2e reduction targets Mondelēz International, through its sustainability strategy, is increasing its chances of anticipating further regulatory requirements. We may look to work with some of our partners in activities they are performing on carbon offsetting or specifically on activities aimed at preventing deforestation and mitigating related climate change effects. For example, we have voiced support for the World Bank’s BioCarbon Fund million initiative for sustainable forest landscapes. The $280 million Initiative, launched in November 2013, seeks to scale up land-management practices across large landscapes to protect forests and securing green supply chains. Since tropical deforestation is often driven by commodity production, such initiatives could play a role in eliminating deforestation and reducing greenhouse gas emissions in our supply chains, by helping fund the transition to more

sustainable production practices. As a member of the Consumer Goods Forum, we have recently supported a call for governments across the world to secure a binding global climate deal and to implement the UN REDD+ framework to use intergovernmental climate funding to fund avoided deforestation.
CC6.1e
Please explain why you do not consider your company to be exposed to opportunities driven by physical climate parameters that have the potential to generate a substantive change in your business operations, revenue or expenditure
We have opportunities to strengthen supplier relationships to seek common, non-competitive, solutions to face potential climate change challenges like weather, water and crop-specific uncertainties in yields and production locations.
CC6.1f
Please explain why you do not consider your company to be exposed to opportunities driven by changes in other climate-related developments that have the potential to generate a substantive change in your business operations, revenue or expenditure
Climate change presents opportunities in the way we develop and market our products, especially in the EU and US. For example: • We're working to bring more products to market that have sustainably grown ingredients. • We have already seen how focusing on sustainability can drive growth in our coffee business in Europe (see Kenco example at question 2.2a)
Further Information
Module: GHG Emissions Accounting, Energy and Fuel Use, and Trading
Page: CC7. Emissions Methodology
CC7.1

Please provide your base year and base year emissions (Scopes 1 and 2)
Base year
Scope 1 Base year emissions (metric tonnes
CO2e)
Scope 2 Base year emissions (metric
tonnes CO2e)
Fri 01 Jan 2010 - Fri 31 Dec 2010
1034029 1079340
CC7.2
Please give the name of the standard, protocol or methodology you have used to collect activity data and calculate Scope 1 and Scope 2 emissions
Please select the published methodologies that you use
The Greenhouse Gas Protocol: A Corporate Accounting and Reporting Standard (Revised Edition)
US EPA Climate Leaders: Direct Emissions from Stationary Combustion
US EPA Climate Leaders: Indirect Emissions from Purchases/Sales of Electricity and Steam
US EPA Climate Leaders: Direct HFC and PFC Emissions from Use of Refrigeration and Air Conditioning Equipment
Other
CC7.2a
If you have selected "Other" in CC7.2 please provide details of the standard, protocol or methodology you have used to collect activity data and calculate Scope 1 and Scope 2 emissions

US EPA Climate Leaders: Direct Emissions from Mobile Combustion Sources US EPA Climate Leaders: Design Principles US EPA GHG Reporting Regulations: 40 CFR 98
CC7.3
Please give the source for the global warming potentials you have used
Gas
Reference
CO2 IPCC Second Assessment Report (SAR - 100 year)
CH4 IPCC Second Assessment Report (SAR - 100 year)
N2O IPCC Second Assessment Report (SAR - 100 year)
HFCs IPCC Second Assessment Report (SAR - 100 year)
CC7.4
Please give the emissions factors you have applied and their origin; alternatively, please attach an Excel spreadsheet with this data at the bottom of this page
Fuel/Material/Energy
Emission Factor
Unit
Reference
Further Information
Emission factors are obtained from recognized sources, i.e. International Energy Agency, US EPA, Ecoinvent database, Economic Input-Output Life Cycle Assessment (EIO-LCA) model and Intergovernmental Panel on Climate Change. For electricity, country-specific CO2 emission factors are used.
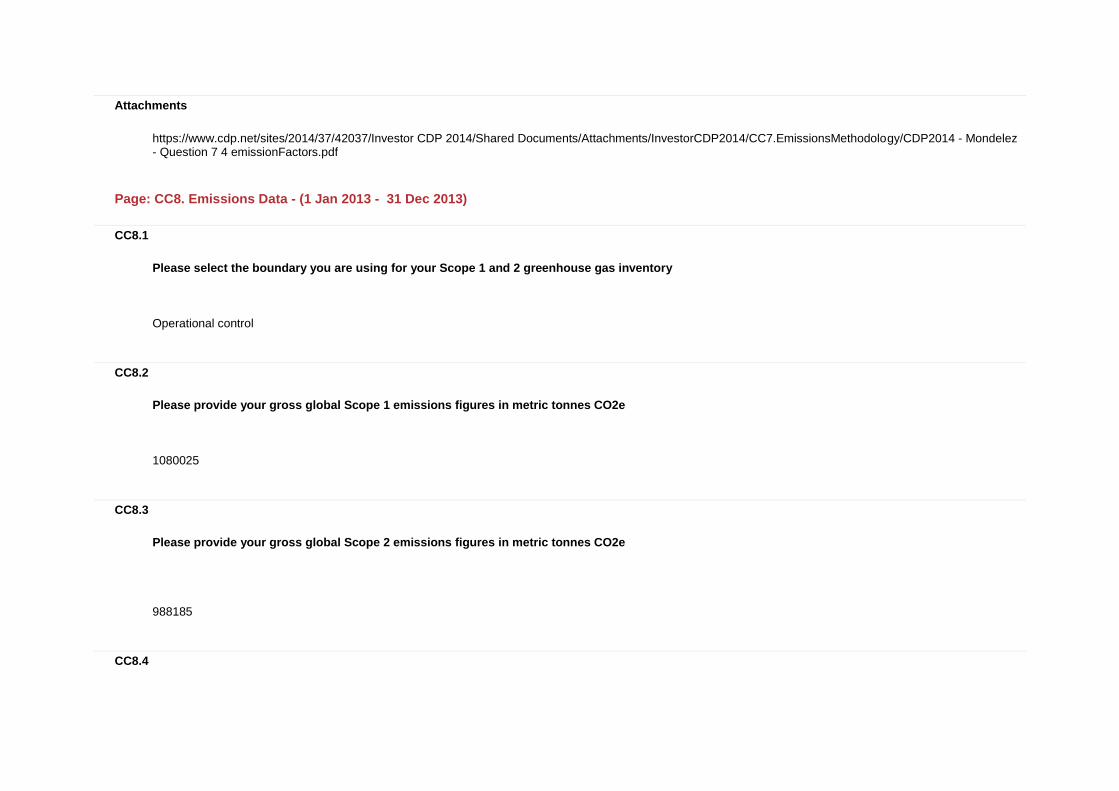
Attachments
https://www.cdp.net/sites/2014/37/42037/Investor CDP 2014/Shared Documents/Attachments/InvestorCDP2014/CC7.EmissionsMethodology/CDP2014 - Mondelez - Question 7 4 emissionFactors.pdf
Page: CC8. Emissions Data - (1 Jan 2013 - 31 Dec 2013)
CC8.1
Please select the boundary you are using for your Scope 1 and 2 greenhouse gas inventory
Operational control
CC8.2
Please provide your gross global Scope 1 emissions figures in metric tonnes CO2e
1080025
CC8.3
Please provide your gross global Scope 2 emissions figures in metric tonnes CO2e
988185
CC8.4

Are there are any sources (e.g. facilities, specific GHGs, activities, geographies, etc.) of Scope 1 and Scope 2 emissions that are within your selected reporting boundary which are not included in your disclosure?
Yes
CC8.4a
Please provide details of the sources of Scope 1 and Scope 2 emissions that are within your selected reporting boundary which are not included in your disclosure
Source
Relevance of
Scope 1 emissions from
this source
Relevance of
Scope 2 emissions
excluded from this source
Explain why the source is excluded
Non-manufacturing buildings (e.g., offices)
Emissions are relevant but not yet calculated
Emissions are relevant but not yet calculated
A small number of non-manufacturing buildings in Mondelēz International Latin America (LA) and Asia Pacific (AP) regions are operationally controlled but not included in this questionnaire. GHG emissions are insignificant compared to product warehouses in North America (NA), European Union (EU) and Central and Eastern Europe, Middle East & Africa (CEEMA) regions.
Leased product warehouses in LA and AP
Emissions are relevant but not yet calculated
Emissions are relevant but not yet calculated
A small number of leased product warehouses in Mondelēz International LA and AP regions are operationally controlled but not included in this questionnaire. GHG emissions are insignificant, compared to product warehouses in NA, EU and CEEMA regions.
Leased sales Emissions are relevant but not yet calculated
Emissions are not relevant
A small number of sales cars in Mondelēz International LA and Asia Pacific (AP) regions are operationally controlled but not included in this questionnaire. GHG emissions are insignificant, compared to product warehouses in NA, EU and CEEMA regions.
CC8.5
Please estimate the level of uncertainty of the total gross global Scope 1 and 2 emissions figures that you have supplied and specify the sources of uncertainty in your data gathering, handling and calculations

Scope 1
emissions: Uncertainty
range
Scope 1
emissions: Main
sources of uncertainty
Scope 1 emissions: Please expand on
the uncertainty in your data
Scope 2
emissions: Uncertainty
range
Scope 2
emissions: Main
sources of uncertainty
Scope 2 emissions: Please expand on
the uncertainty in your data
More than 5% but less than or equal to 10%
Data Gaps Assumptions
1) Data variability associated with reported manufacturing data from those plants which have not yet fully implemented direct metering or sub-metering; (2) Few data gaps in warehouse energy data and sales vehicles operating in AP and LA regions.
More than 5% but less than or equal to 10%
Data Gaps Assumptions
(1) Data variability associated with reported manufacturing data from those plants which have not yet fully implemented direct metering or sub-metering; (2) Few data gaps in warehouse energy data and sales vehicles operating in AP and LA regions.
CC8.6
Please indicate the verification/assurance status that applies to your reported Scope 1 emissions
Third party verification or assurance complete
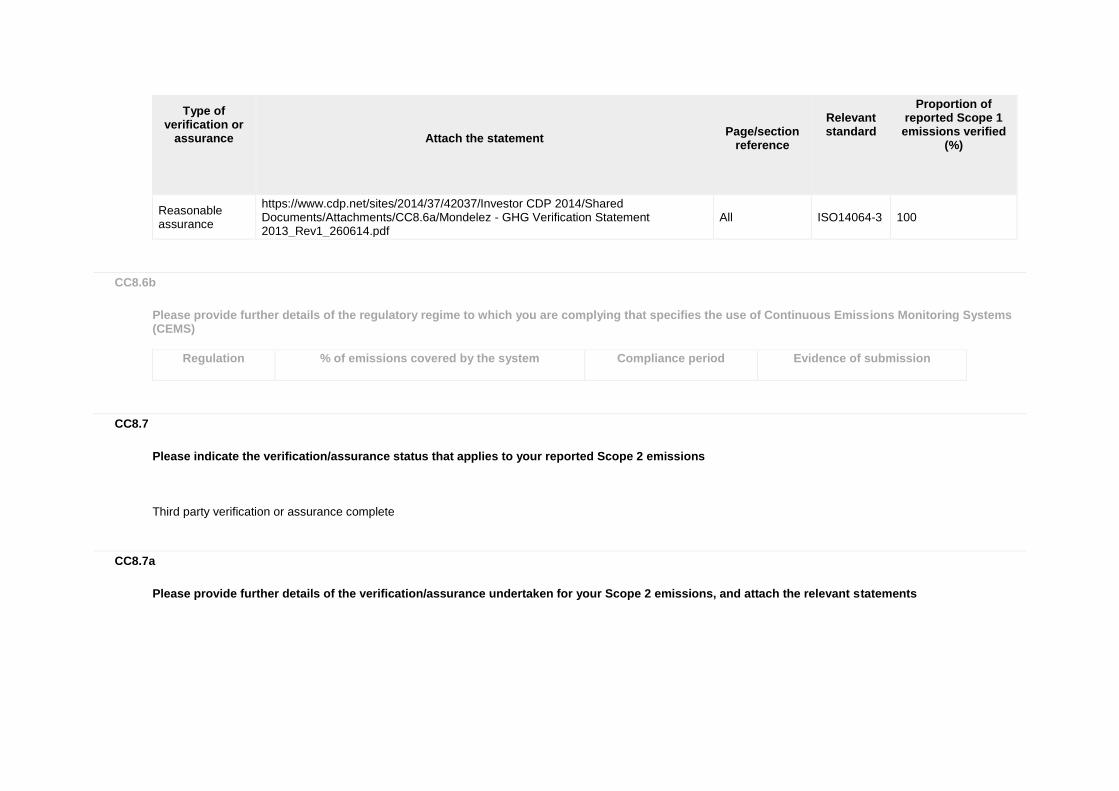
CC8.6a
Please provide further details of the verification/assurance undertaken for your Scope 1 emissions, and attach the relevant statements
Type of verification or
assurance
Attach the statement
Page/section
reference
Relevant standard
Proportion of reported Scope 1 emissions verified
(%)
Type of verification or
assurance
Attach the statement
Page/section
reference
Relevant standard
Proportion of reported Scope 1 emissions verified
(%)
Reasonable assurance
https://www.cdp.net/sites/2014/37/42037/Investor CDP 2014/Shared Documents/Attachments/CC8.6a/Mondelez - GHG Verification Statement 2013_Rev1_260614.pdf
All ISO14064-3 100
CC8.6b
Please provide further details of the regulatory regime to which you are complying that specifies the use of Continuous Emissions Monitoring Systems (CEMS)
Regulation
% of emissions covered by the system
Compliance period
Evidence of submission
CC8.7
Please indicate the verification/assurance status that applies to your reported Scope 2 emissions
Third party verification or assurance complete
CC8.7a
Please provide further details of the verification/assurance undertaken for your Scope 2 emissions, and attach the relevant statements

Type of verification or
assurance
Attach the statement
Page/Section reference
Relevant standard
Proportion of
Scope 2 emissions verified
(%)
Reasonable assurance
https://www.cdp.net/sites/2014/37/42037/Investor CDP 2014/Shared Documents/Attachments/CC8.7a/Mondelez - GHG Verification Statement 2013_Rev1_260614.pdf
All ISO14064-3 100
CC8.8
Please identify if any data points other than emissions figures have been verified as part of the third party verification work undertaken
Additional data points verified
Comment
Year on year change in emissions (Scope 1)
Year on year change in emissions (Scope 2)
Year on year change in emissions (Scope 1 and 2)
Year on year change in emissions (Scope 3)
Year on year emissions intensity figure
CC8.9
Are carbon dioxide emissions from biologically sequestered carbon relevant to your organization?
Yes
CC8.9a
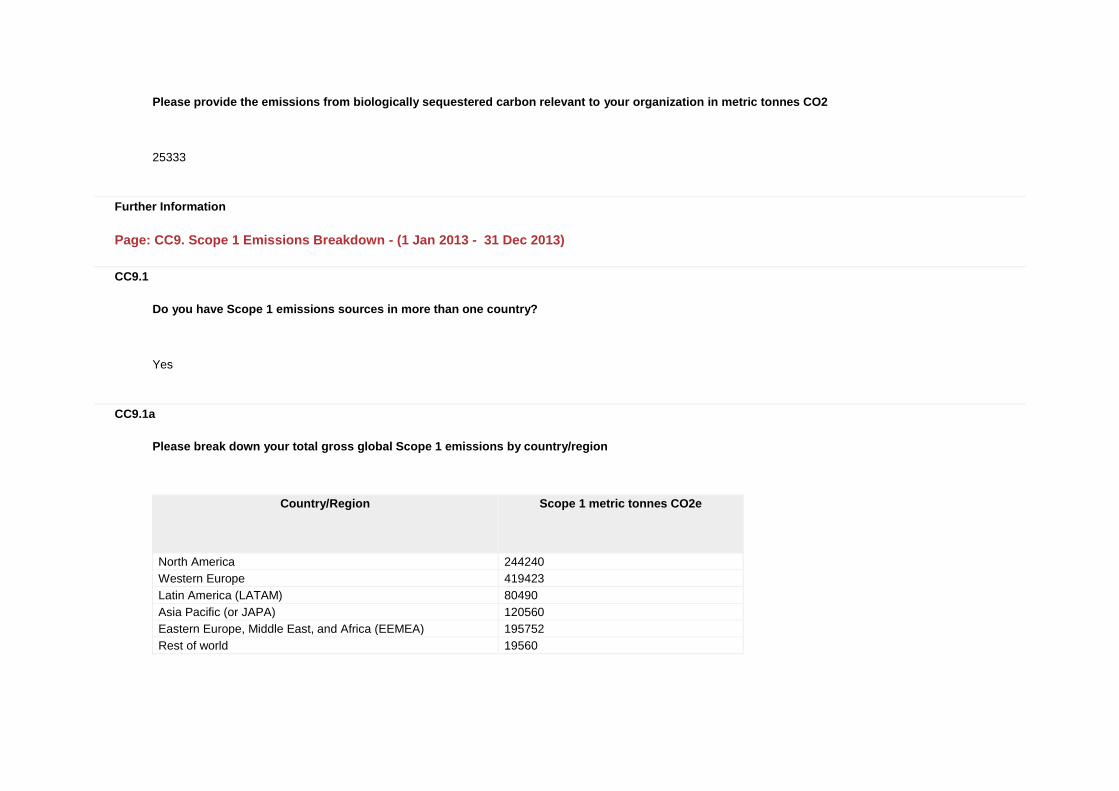
Please provide the emissions from biologically sequestered carbon relevant to your organization in metric tonnes CO2
25333
Further Information
Page: CC9. Scope 1 Emissions Breakdown - (1 Jan 2013 - 31 Dec 2013)
CC9.1
Do you have Scope 1 emissions sources in more than one country?
Yes
CC9.1a
Please break down your total gross global Scope 1 emissions by country/region
Country/Region
Scope 1 metric tonnes CO2e
North America 244240
Western Europe 419423
Latin America (LATAM) 80490
Asia Pacific (or JAPA) 120560
Eastern Europe, Middle East, and Africa (EEMEA) 195752
Rest of world 19560

CC9.2
Please indicate which other Scope 1 emissions breakdowns you are able to provide (tick all that apply)
By activity
CC9.2a
Please break down your total gross global Scope 1 emissions by business division
Business division
Scope 1 emissions (metric tonnes CO2e)
CC9.2b
Please break down your total gross global Scope 1 emissions by facility
Facility
Scope 1 emissions (metric tonnes CO2e)
Latitude
Longitude
CC9.2c
Please break down your total gross global Scope 1 emissions by GHG type

GHG type
Scope 1 emissions (metric tonnes CO2e)
CC9.2d
Please break down your total gross global Scope 1 emissions by activity
Activity
Scope 1 emissions (metric tonnes CO2e)
Manufacturing 1017479
Private Fleet 19560
DC - Mixing Centers 3049
DSD/Branch/Warehouses 970
HQ/Technology-R&D Centers 3490
Executive Transportation 5009
Sales Fleet 30468
CC9.2e
Please break down your total gross global Scope 1 emissions by legal structure
Legal structure
Scope 1 emissions (metric tonnes CO2e)
Further Information
Page: CC10. Scope 2 Emissions Breakdown - (1 Jan 2013 - 31 Dec 2013)
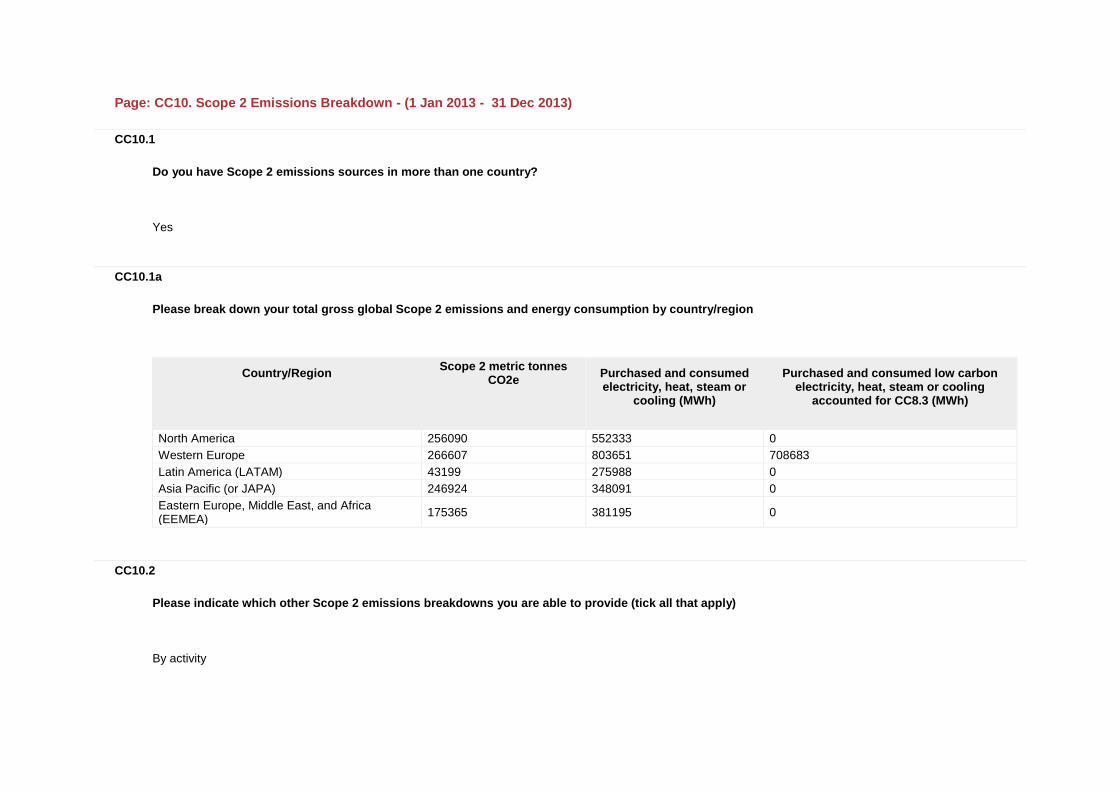
CC10.1
Do you have Scope 2 emissions sources in more than one country?
Yes
CC10.1a
Please break down your total gross global Scope 2 emissions and energy consumption by country/region
Country/Region
Scope 2 metric tonnes CO2e
Purchased and consumed electricity, heat, steam or
cooling (MWh)
Purchased and consumed low carbon electricity, heat, steam or cooling
accounted for CC8.3 (MWh)
North America 256090 552333 0
Western Europe 266607 803651 708683
Latin America (LATAM) 43199 275988 0
Asia Pacific (or JAPA) 246924 348091 0
Eastern Europe, Middle East, and Africa (EEMEA)
175365 381195 0
CC10.2
Please indicate which other Scope 2 emissions breakdowns you are able to provide (tick all that apply)
By activity
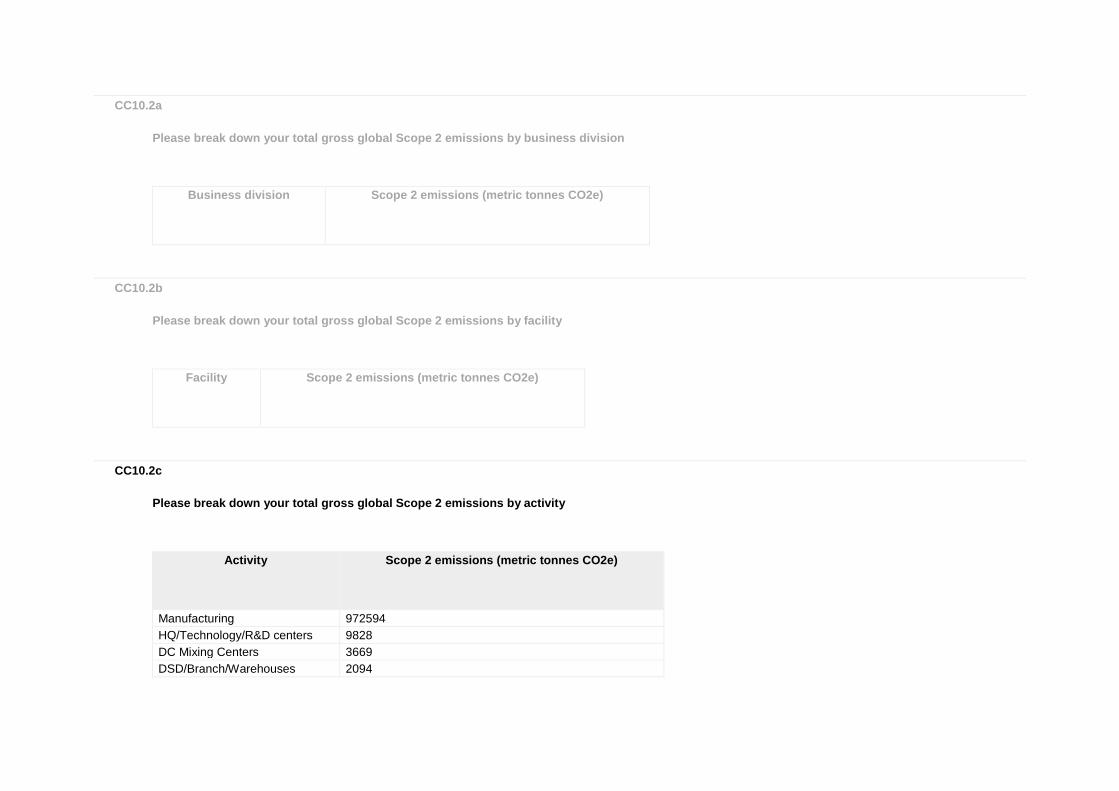
CC10.2a
Please break down your total gross global Scope 2 emissions by business division
Business division
Scope 2 emissions (metric tonnes CO2e)
CC10.2b
Please break down your total gross global Scope 2 emissions by facility
Facility
Scope 2 emissions (metric tonnes CO2e)
CC10.2c
Please break down your total gross global Scope 2 emissions by activity
Activity
Scope 2 emissions (metric tonnes CO2e)
Manufacturing 972594
HQ/Technology/R&D centers 9828
DC Mixing Centers 3669
DSD/Branch/Warehouses 2094
CC10.2d
Please break down your total gross global Scope 2 emissions by legal structure
Legal structure
Scope 2 emissions (metric tonnes CO2e)
Further Information
Page: CC11. Energy
CC11.1
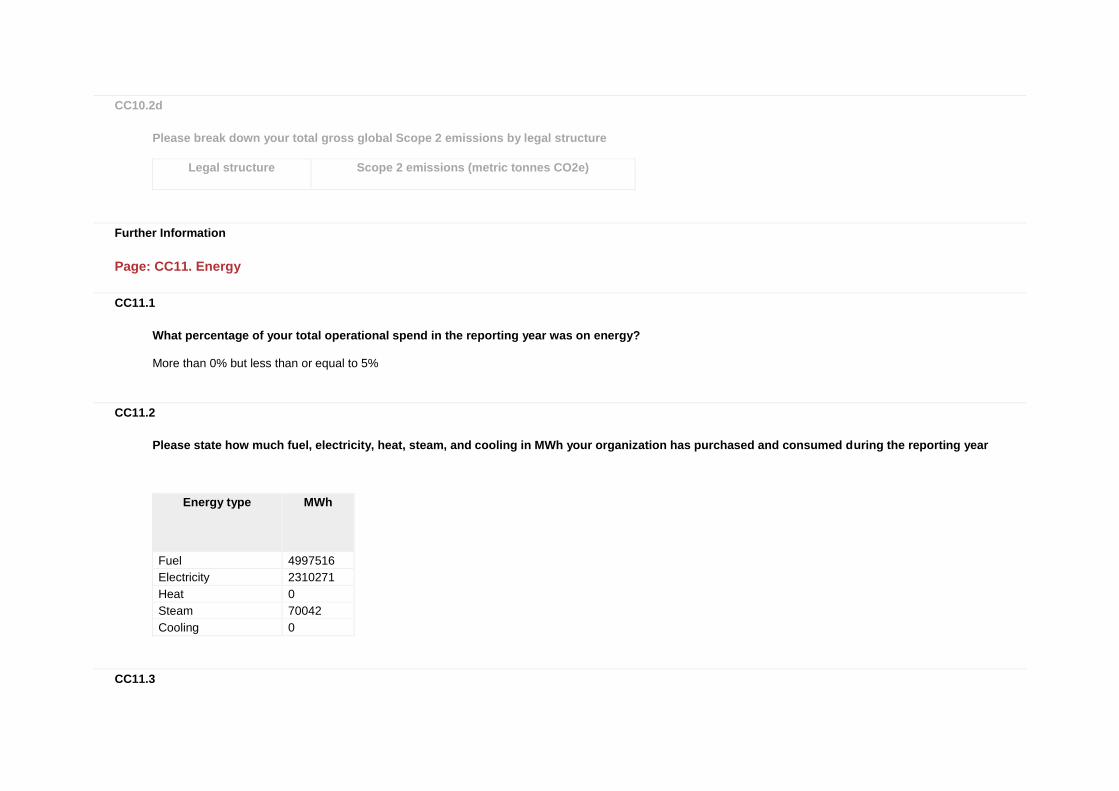
What percentage of your total operational spend in the reporting year was on energy?
More than 0% but less than or equal to 5%
CC11.2
Please state how much fuel, electricity, heat, steam, and cooling in MWh your organization has purchased and consumed during the reporting year
Energy type
MWh
Fuel 4997516
Electricity 2310271
Heat 0
Steam 70042
Cooling 0
CC11.3

Please complete the table by breaking down the total "Fuel" figure entered above by fuel type
Fuels
MWh
Jet gasoline 7197
Natural gas 4442593
Distillate fuel oil No 5 135416
Distillate fuel oil No 2 108286
Propane 77808
Bituminous coal 36653
Motor gasoline 127700
Wood or wood waste 32004
Other: On-site digester Methane Gas 1320
Other: coffee/cocoa/others residues 3842
Other: bagasse 24697
CC11.4
Please provide details of the electricity, heat, steam or cooling amounts that were accounted at a low carbon emission factor in the Scope 2 figure reported in CC8.3
Basis for applying a low carbon emission factor
MWh associated with low carbon electricity, heat,
steam or cooling
Comment
Tracking instruments, Guarantees of Origin
469471 Estimated number of certificates equal to annual power consumption for the production of one European Chocolate brand.469471 MWh covered by Tracking instruments, Guarantees of Origin
Tracking instruments, Guarantees of Origin
106913 Estimated number of certificates equal to annual power consumption for the production of one European Coffee brand. 106913 MWh covered by Tracking instruments, Guarantees of Origin
Tracking instruments, Guarantees of Origin
49873 Estimated number of certificates equal to annual power consumption for the production of one European Cheese & Grocery brand. 49873 MWh covered by Tracking instruments, Guarantees of Origin
Tracking instruments, 82426 Estimated number of certificates equal to annual power consumption for the production of one
Basis for applying a low carbon emission factor
MWh associated with low carbon electricity, heat,
steam or cooling
Comment
Guarantees of Origin European Gum & Candy brand. 82426 MWh covered by Tracking instruments, Guarantees of Origin
Further Information
Page: CC12. Emissions Performance
CC12.1
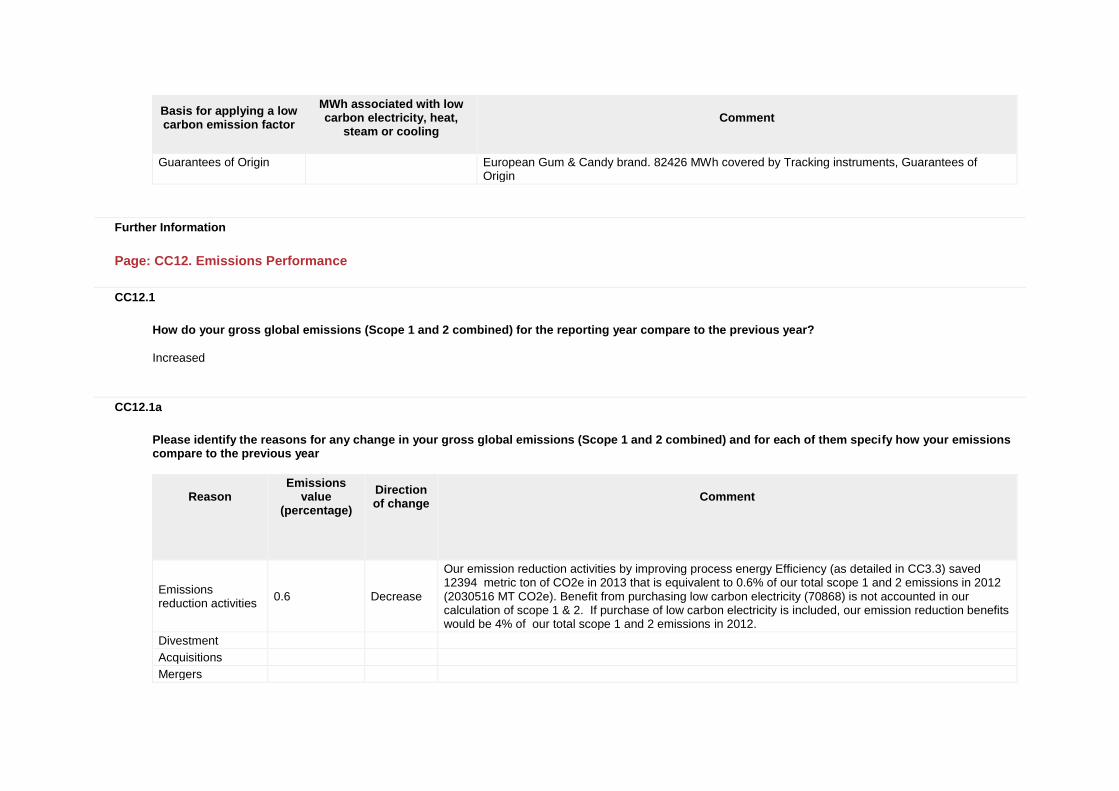
How do your gross global emissions (Scope 1 and 2 combined) for the reporting year compare to the previous year?
Increased
CC12.1a
Please identify the reasons for any change in your gross global emissions (Scope 1 and 2 combined) and for each of them specify how your emissions compare to the previous year
Reason
Emissions value
(percentage)
Direction of change
Comment
Emissions reduction activities
0.6 Decrease
Our emission reduction activities by improving process energy Efficiency (as detailed in CC3.3) saved 12394 metric ton of CO2e in 2013 that is equivalent to 0.6% of our total scope 1 and 2 emissions in 2012 (2030516 MT CO2e). Benefit from purchasing low carbon electricity (70868) is not accounted in our calculation of scope 1 & 2. If purchase of low carbon electricity is included, our emission reduction benefits would be 4% of our total scope 1 and 2 emissions in 2012.
Divestment
Acquisitions
Mergers

Reason
Emissions value
(percentage)
Direction of change
Comment
Change in output 1.6 Increase
Our production volume went up 3.9% from 5865739 MT in 2012 to 6094720 MT in 2013 as the result of organic growth, while we reduced our manufacture emission intensity by 2.3% from 326 kgCO2e/MT of output to 319 kg CO2e/MT of output. Overall, Our net manufacturing energy-related scope 1&2 emission increased 1.6% from 1911903 MT of CO2e in 2012 to1941713 MT of CO2e in 2013.
Change in methodology
Change in boundary
Change in physical operating conditions
Unidentified
Other
CC12.2
Please describe your gross global combined Scope 1 and 2 emissions for the reporting year in metric tonnes CO2e per unit currency total revenue
Intensity figure
Metric numerator
Metric denominator
% change from
previous year
Direction of change from previous year
Reason for change
0.0000586 metric tonnes CO2e
unit total revenue
1.0 Increase
Mondelez generated 35299 Million USD net revenue with 2068210 MT CO2e emissions in 2013 and 35015 Million USD net revenue with 2030516 MT CO2e emissions in 2012. Our intensity figure increased by 1.0% from 0.0000580 MT CO2e/ USD in 2012 to 0.0000586 MT CO2e/ USD in 2013.

CC12.3
Please describe your gross global combined Scope 1 and 2 emissions for the reporting year in metric tonnes CO2e per full time equivalent (FTE) employee
Intensity figure
Metric numerator
Metric denominator
% change from
previous year
Direction of change from
previous year
Reason for change
19.33 metric tonnes CO2e
FTE employee
4.7 Increase
Mondelēz International10-K,. Report attached: "We employed approximately 107,000 people worldwide at December 31, 2013 and approximately 110,000 as of December 31, 2012." Our employee headcount decreased 3%, but our production volume went up 4%; as a result of that, our intensity figure increased 4.7% from 18.46 in 2012 to 19.33 in 2013.
CC12.4
Please provide an additional intensity (normalized) metric that is appropriate to your business operations
Intensity figure
Metric numerator
Metric denominator
% change from
previous year
Direction of change from
previous year
Reason for change
0.339 metric tonnes CO2e
metric tonne of product
2.0 Decrease
Mondelez generated 6094720 MT of products with 2068210 MT CO2e emissions in 2013 and 5865872 MT of products with 2030516 MT CO2e emissions in 2012, which is equivalent to 0.339 MT CO2e/ MT of products in 2013 and 0.346 MT CO2e/ MT of products in 2012. The scope 1&2 emission intensity decreased 2% is due to improved fuel use efficiency as well as emission reduction activities.
Further Information
Page: CC13. Emissions Trading
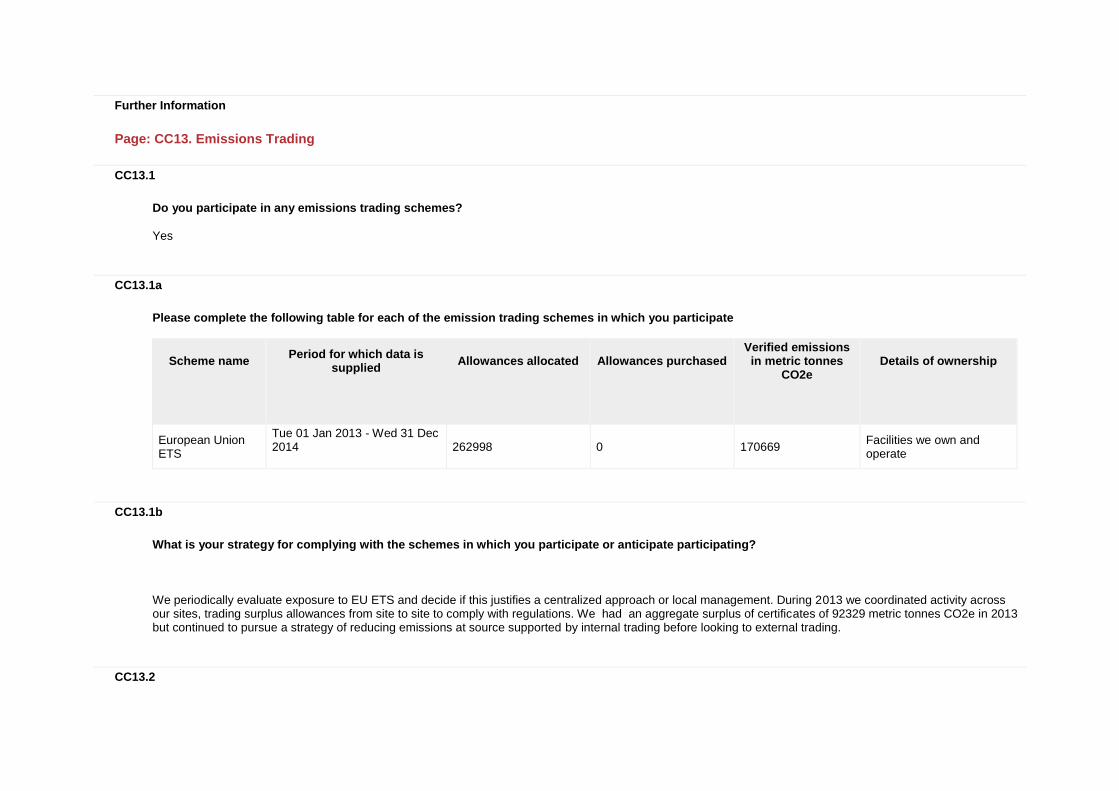
CC13.1
Do you participate in any emissions trading schemes?
Yes
CC13.1a
Please complete the following table for each of the emission trading schemes in which you participate
Scheme name
Period for which data is supplied
Allowances allocated
Allowances purchased
Verified emissions in metric tonnes
CO2e
Details of ownership
European Union ETS
Tue 01 Jan 2013 - Wed 31 Dec 2014
262998 0 170669 Facilities we own and operate
CC13.1b
What is your strategy for complying with the schemes in which you participate or anticipate participating?
We periodically evaluate exposure to EU ETS and decide if this justifies a centralized approach or local management. During 2013 we coordinated activity across our sites, trading surplus allowances from site to site to comply with regulations. We had an aggregate surplus of certificates of 92329 metric tonnes CO2e in 2013 but continued to pursue a strategy of reducing emissions at source supported by internal trading before looking to external trading.
CC13.2
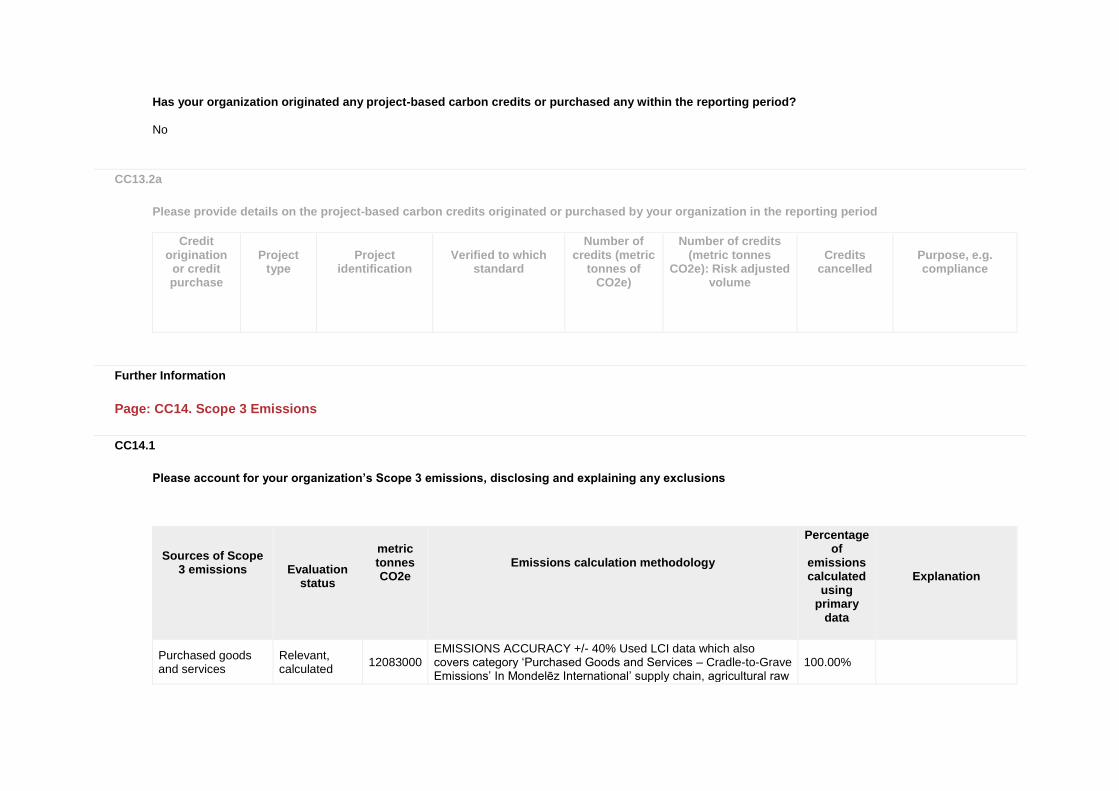
Has your organization originated any project-based carbon credits or purchased any within the reporting period?
No
CC13.2a
Please provide details on the project-based carbon credits originated or purchased by your organization in the reporting period
Credit origination
or credit purchase
Project type
Project identification
Verified to which standard
Number of credits (metric
tonnes of CO2e)
Number of credits (metric tonnes
CO2e): Risk adjusted volume
Credits cancelled
Purpose, e.g. compliance
Further Information
Page: CC14. Scope 3 Emissions
CC14.1
Please account for your organization’s Scope 3 emissions, disclosing and explaining any exclusions
Sources of Scope 3 emissions
Evaluation status
metric tonnes CO2e
Emissions calculation methodology
Percentage of
emissions calculated
using primary
data
Explanation
Purchased goods and services
Relevant, calculated
12083000 EMISSIONS ACCURACY +/- 40% Used LCI data which also covers category ‘Purchased Goods and Services – Cradle-to-Grave Emissions’ In Mondelēz International’ supply chain, agricultural raw
100.00%

Sources of Scope 3 emissions
Evaluation status
metric tonnes CO2e
Emissions calculation methodology
Percentage of
emissions calculated
using primary
data
Explanation
materials are the main source of CO2 scope 3 emissions, with packaging production contributing an important, but clearly secondary, source of emissions. The most prominent commodities for Mondelēz International are: Dairy, Sugar, Grains, Vegetable Oils, Nuts, Cocoa and Coffee. Since 2011 we have been improving the accuracy of our Scope 3 emissions for many key commodities by regionalizing emission factors and gathering more precise geo-sourcing data to improve the fit for LCI datasets. The supply chain was characterized based on the total mass of purchases of nearly 100 food input material categories and 5 packaging material categories. For each of these material categories, information on the life cycle GHG emissions was taken from a variety of sources, including the most prominent EcoInvent database, scientific literature and other available data. In cases where data for the exact commodity or category could not be found, the most suitable proxy available was selected to avoid large gaps. Emissions are determined as the mass purchased multiplied by these factors of GHG emissions per weight. For packaging materials, processing to produce a finished package has been assumed based on emissions information from the Ecoinvent database. In the case of agricultural commodities that require additional processing beyond the level of their representation in the database, insufficient information is available to represent such processes, except in the case that it takes place in a Mondelēz International facility. We engaged third-party experts in 2011 to review and help improve our methodology and quality of data. Emissions for co-manufacturers have been assumed proportional to those of Mondelēz International own operations on a basis of weight of product produced.
Capital goods Not relevant, explanation provided
0
Capital Goods is so far not associated with Mondelēz International’s business.
Fuel-and-energy-related activities
Relevant, calculated
714000 EMISSIONS ACCURACY +/- 30% Emissions from all direct uses of energy have been calculated based on amounts of electricity and
100.00%
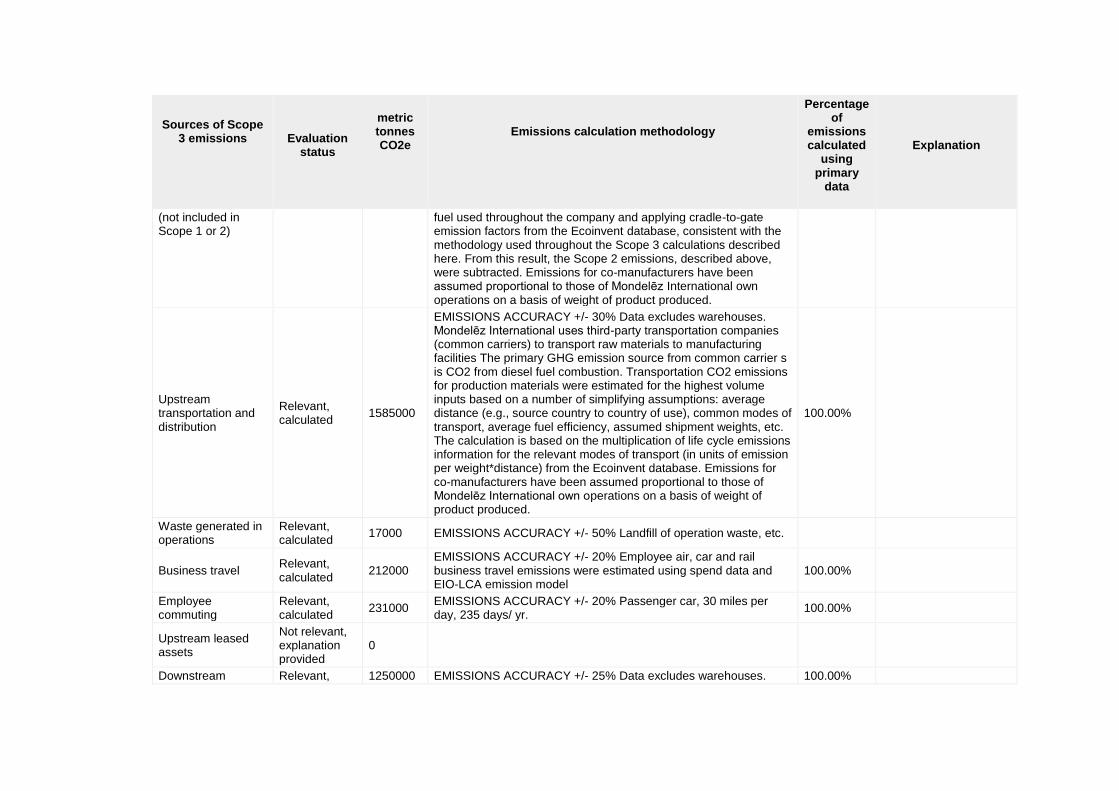
Sources of Scope 3 emissions
Evaluation status
metric tonnes CO2e
Emissions calculation methodology
Percentage of
emissions calculated
using primary
data
Explanation
(not included in Scope 1 or 2)
fuel used throughout the company and applying cradle-to-gate emission factors from the Ecoinvent database, consistent with the methodology used throughout the Scope 3 calculations described here. From this result, the Scope 2 emissions, described above, were subtracted. Emissions for co-manufacturers have been assumed proportional to those of Mondelēz International own operations on a basis of weight of product produced.
Upstream transportation and distribution
Relevant, calculated
1585000
EMISSIONS ACCURACY +/- 30% Data excludes warehouses. Mondelēz International uses third-party transportation companies (common carriers) to transport raw materials to manufacturing facilities The primary GHG emission source from common carrier s is CO2 from diesel fuel combustion. Transportation CO2 emissions for production materials were estimated for the highest volume inputs based on a number of simplifying assumptions: average distance (e.g., source country to country of use), common modes of transport, average fuel efficiency, assumed shipment weights, etc. The calculation is based on the multiplication of life cycle emissions information for the relevant modes of transport (in units of emission per weight*distance) from the Ecoinvent database. Emissions for co-manufacturers have been assumed proportional to those of Mondelēz International own operations on a basis of weight of product produced.
100.00%
Waste generated in operations
Relevant, calculated
17000 EMISSIONS ACCURACY +/- 50% Landfill of operation waste, etc.
Business travel Relevant, calculated
212000 EMISSIONS ACCURACY +/- 20% Employee air, car and rail business travel emissions were estimated using spend data and EIO-LCA emission model
100.00%
Employee commuting
Relevant, calculated
231000 EMISSIONS ACCURACY +/- 20% Passenger car, 30 miles per day, 235 days/ yr.
100.00%
Upstream leased assets
Not relevant, explanation provided
0
Downstream Relevant, 1250000 EMISSIONS ACCURACY +/- 25% Data excludes warehouses. 100.00%

Sources of Scope 3 emissions
Evaluation status
metric tonnes CO2e
Emissions calculation methodology
Percentage of
emissions calculated
using primary
data
Explanation
transportation and distribution
calculated Mondelēz International uses third-party transportation companies (common carriers) to supplement its need to transport finished product from manufacturing facilities to distribution centers, warehouses and customers. The primary GHG emission source from common carrier s is CO2 from diesel fuel combustion. To calculate Scope 3 emissions for transport, multiply life cycle emission factors (kg CO2/ tonne-kilometer) by total tonne-kilometers. The latter is determined by multiplying product weight times distance traveled for each product. Scope 3 emissions for co-manufacturing are assumed proportional to those entities under Mondelēz International operational control and are based on the weight of product produced.
Processing of sold products
Not relevant, explanation provided
0
Use of sold products
Relevant, calculated
780000
EMISSIONS ACCURACY +/- 40% The emissions reported here reflect a rough prediction of the emissions from the use of products. The end-of-life of the food products themselves is not included. The emissions during the use of products include aspects of refrigeration, freezing, baking, boiling, toasting, microwaving, and stovetop preparation. For each of these categories, assumptions have been made of the proportion of total Mondelēz International products sold that are likely to undergo each use. For simplicity, it has currently been assumed that all use activities are fueled by electricity. Approximations are then made of the amount of electricity use required per kilogram of product. These approximations are made based on preliminary estimates of typical consumer behaviors and are generic among product categories. The total amount of electricity use is then estimated based on emissions factors taken from the Ecoinvent database for several countries or an adapted dataset from IEA electricity statistics.
100.00%
End of life treatment of sold products
Relevant, calculated
650000 EMISSIONS ACCURACY +/- 40% The end-of-life of packaging is determined based on the amount of various categories of packaging material that have been purchased in the relevant time

Sources of Scope 3 emissions
Evaluation status
metric tonnes CO2e
Emissions calculation methodology
Percentage of
emissions calculated
using primary
data
Explanation
period (with the assumption that this is also representative of the amount of packaging disposed in the same period). The proportions of various fates (landfilling, recycling and incineration) of each material have been determined by information available for several countries, which has then been applied as an approximation of disposal routes within each of the five global sales regions. Emissions information is taken from the Ecoinvent database to determine the amount of GHG emissions occurring during the landfilling, recycling and incineration of any given material. Generally, an “avoided burden” approach is taken at the end-of-life routes that result in a beneficial co-product of disposal. For example, in the case of recycling a plastic, it is assumed that the production of virgin plastic is avoided and for the combustion of a plastic, it is assumed that a given amount of heat and/or electricity has been recovered and therefore prevented the production of electricity or heat by other means.
Downstream leased assets
Not relevant, explanation provided
0
Downstream leased assets is so far not associated with Mondelēz International’s business.
Franchises Not relevant, explanation provided
0
Franchises is so far not associated with Mondelez International’s business.
Investments Not relevant, explanation provided
0
Investment is so far not associated with Mondelez International’s business.
Other (upstream) Relevant, calculated
4500 EMISSIONS ACCURACY +/- 20% The impact of producing HFCs are estimated based on the Ecoinvent database.
Other (downstream) Not relevant, explanation provided
0
Not relevant.
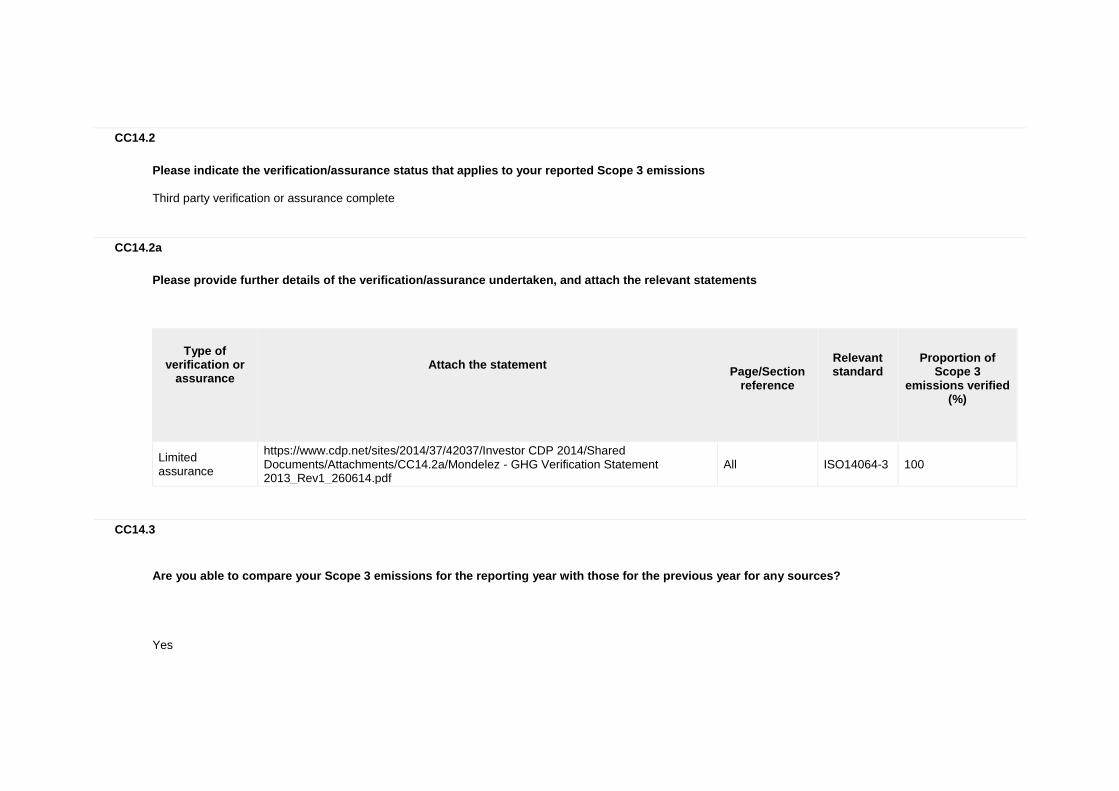
CC14.2
Please indicate the verification/assurance status that applies to your reported Scope 3 emissions
Third party verification or assurance complete
CC14.2a
Please provide further details of the verification/assurance undertaken, and attach the relevant statements
Type of
verification or assurance
Attach the statement
Page/Section
reference
Relevant standard
Proportion of
Scope 3 emissions verified
(%)
Limited assurance
https://www.cdp.net/sites/2014/37/42037/Investor CDP 2014/Shared Documents/Attachments/CC14.2a/Mondelez - GHG Verification Statement 2013_Rev1_260614.pdf
All ISO14064-3 100
CC14.3
Are you able to compare your Scope 3 emissions for the reporting year with those for the previous year for any sources?
Yes
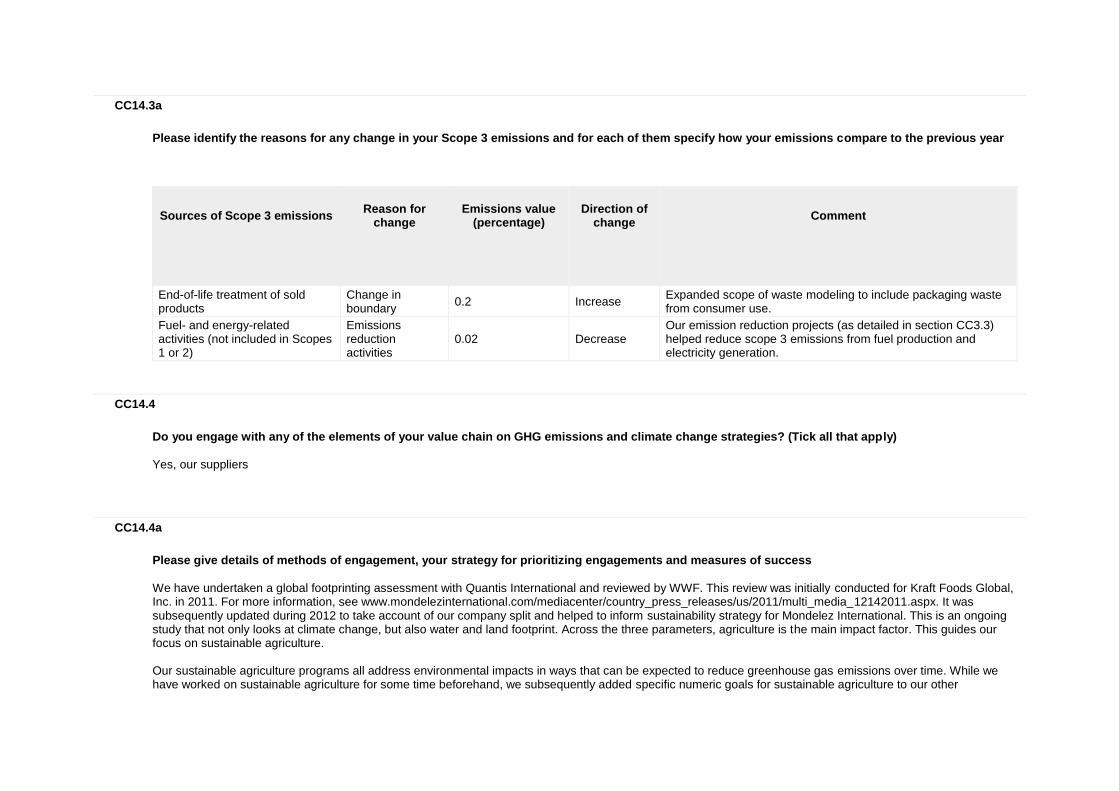
CC14.3a
Please identify the reasons for any change in your Scope 3 emissions and for each of them specify how your emissions compare to the previous year
Sources of Scope 3 emissions
Reason for
change
Emissions value
(percentage)
Direction of
change
Comment
End-of-life treatment of sold products
Change in boundary
0.2 Increase Expanded scope of waste modeling to include packaging waste from consumer use.
Fuel- and energy-related activities (not included in Scopes 1 or 2)
Emissions reduction activities
0.02 Decrease Our emission reduction projects (as detailed in section CC3.3) helped reduce scope 3 emissions from fuel production and electricity generation.
CC14.4
Do you engage with any of the elements of your value chain on GHG emissions and climate change strategies? (Tick all that apply)
Yes, our suppliers
CC14.4a
Please give details of methods of engagement, your strategy for prioritizing engagements and measures of success
We have undertaken a global footprinting assessment with Quantis International and reviewed by WWF. This review was initially conducted for Kraft Foods Global, Inc. in 2011. For more information, see www.mondelezinternational.com/mediacenter/country_press_releases/us/2011/multi_media_12142011.aspx. It was subsequently updated during 2012 to take account of our company split and helped to inform sustainability strategy for Mondelez International. This is an ongoing study that not only looks at climate change, but also water and land footprint. Across the three parameters, agriculture is the main impact factor. This guides our focus on sustainable agriculture. Our sustainable agriculture programs all address environmental impacts in ways that can be expected to reduce greenhouse gas emissions over time. While we have worked on sustainable agriculture for some time beforehand, we subsequently added specific numeric goals for sustainable agriculture to our other

sustainability goals. As part of the new 2015 goals: All cocoa will ultimately be sustainably-sourced 70% of global coffee will be sustainably-sourced by 2015 75% of Western European biscuits volume made with Harmony wheat by 2015 Palm oil: 100% RSPO by 2015. In 2013, we were the world’s largest buyer of coffee from Rainforest Alliance Certified™ farms, the largest buyer for Fairtrade cocoa and one of the biggest buyers of cocoa from Rainforest Alliance Certified farms. In November 2012, we announced a commitment to invest $400 million over 10 years to boost livelihoods and living conditions of more than 200,000 farmers and over 1 million people in cocoa farming communities. Key focus areas are farming, community, livelihoods, youth and the environment. Our $200 million Coffee Made Happy program, announced in October 2012, aims to create more than 1 million coffee farming entrepreneurs by 2020 and builds on our existing goal to sustainably source 100 percent of our European coffee by 2015. Key pillars of the program are skills, society and environmental stewardship.
CC14.4b
To give a sense of scale of this engagement, please give the number of suppliers with whom you are engaging and the proportion of your total spend that they represent
Number of suppliers
% of total
spend
Comment
1200000 80%
Cocoa Life’s long-term goal is to source all cocoa sustainably, mainly via Cocoa Life, which has a goal to reach over 200,000 cocoa farmers within the cocoa supply chain (not 200,000 direct suppliers). See 14.4a above for more information. Coffee Made Happy builds on our existing commitment to sustainably source 100% of coffee for our European coffee business. The goal is to reach over 1 million coffee farmers within the coffee supply chain (not 1 million direct suppliers), to cover most of our coffee. See 14.4a above for more information.
CC14.4c
If you have data on your suppliers’ GHG emissions and climate change strategies, please explain how you make use of that data
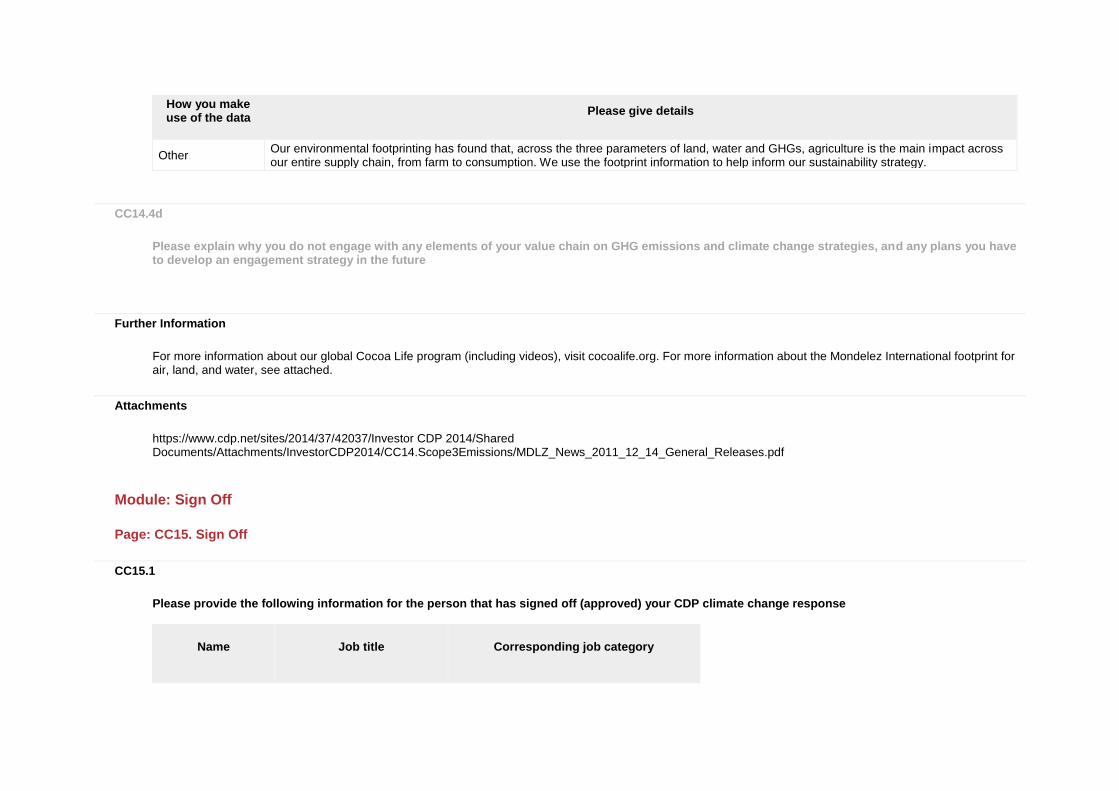
How you make use of the data
Please give details
Other Our environmental footprinting has found that, across the three parameters of land, water and GHGs, agriculture is the main impact across our entire supply chain, from farm to consumption. We use the footprint information to help inform our sustainability strategy.
CC14.4d
Please explain why you do not engage with any elements of your value chain on GHG emissions and climate change strategies, and any plans you have to develop an engagement strategy in the future
Further Information
For more information about our global Cocoa Life program (including videos), visit cocoalife.org. For more information about the Mondelez International footprint for air, land, and water, see attached.
Attachments
https://www.cdp.net/sites/2014/37/42037/Investor CDP 2014/Shared Documents/Attachments/InvestorCDP2014/CC14.Scope3Emissions/MDLZ_News_2011_12_14_General_Releases.pdf
Module: Sign Off
Page: CC15. Sign Off
CC15.1
Please provide the following information for the person that has signed off (approved) your CDP climate change response
Name
Job title
Corresponding job category
Name
Job title
Corresponding job category
Jonathan Horrell Director Sustainability Environment/Sustainability manager
Further Information
Module: FBT
Page: FBT1. Agriculture
FBT1.1
Are agricultural activities, whether in your direct operations or elsewhere in your value chain, relevant to your climate change disclosure?
FBT1.1a
Please explain why agricultural activities are not relevant to your climate change disclosure
FBT1.2
Are agricultural emissions that you have identified as relevant produced on your own farm(s), elsewhere in your value chain, or both?
FBT1.2a
Please explain why agricultural emissions from your own farms are not relevant

FBT1.3
Do you account for agricultural emissions produced on your own farm(s) as part of the global gross Scope 1 emissions figure reported in CC8.2 and/or the Scope 2 figure reported in CC8.3 of the core climate change questionnaire?
FBT1.3a
Please report these agricultural emissions produced on your own farm(s) and identify any exclusions in the table below
Scope
Emissions from agricultural activities (metric tonnes CO2e)
Exclusions
Explanation
Comment
FBT1.3b
Please explain why you do not account for agricultural emissions produced on your own farm(s), and describe any plans for the collection of this data in the future
FBT1.4
Do you implement agricultural management practices on your own farm(s) with a climate change mitigation and/or adaptation benefit?
FBT1.4a
Please identify agricultural management practices undertaken on your own farm(s) with a climate change mitigation and/or adaptation benefit. Complete the table
Activity ID
Description of activity
Driver
Comment
FBT1.4b
Does your implementation of these agricultural management practices have secondary impacts? Complete the table
Activity ID
Impact on yield
Impact on cost
Impact on soil quality
Impact on biodiversity
Impact on water
Other impact
Description of impacts
Management of impacts
FBT1.4c
Do you have any plans to implement agricultural management practices in the future?
FBT1.4d
Please detail your plans to implement agricultural management practices in the future
FBT1.5
Do you account for emissions from agricultural activities in your value chain as part of the Scope 3 category "Purchased goods and services" reported in CC14.1 of the core climate change questionnaire?
FBT1.6
Do you encourage your agricultural suppliers to undertake any agricultural management practices with a climate change mitigation and/or adaptation benefit?
FBT1.6a
Please identify agricultural management practices with a climate change mitigation and/or adaptation benefit that you encourage your suppliers to implement. Complete the table
Activity ID
Description of activity
Your role
Description of role
Driver
Comment
FBT1.6b
Does the implementation of these agricultural management practices in your value chain have secondary impacts? Complete the table
Activity ID
Impact on yield
Impact on cost
Impact on soil quality
Impact on biodiversity
Impact on water
Other impact
Description of impacts
Management of impacts
FBT1.6c
Do you have any plans to engage with your suppliers on their implementation of agricultural management practices?
FBT1.6d
Please detail these plans to engage with your suppliers on their implementation of agricultural management practices
Further Information
Page: FBT2. Processing
FBT2.1
Are processing activities, whether in your direct operations or elsewhere in your value chain, relevant to your climate change disclosure?
FBT2.1a
Please explain why processing activities are not relevant to your climate change disclosure
FBT2.2
Are emissions from processing activities that you have identified as relevant produced in your direct operations, elsewhere in your value chain, or both?
FBT2.2a
Please explain why emissions from processing activities in your direct operations are not relevant
FBT2.3
Do you account for emissions from processing activities in your direct operations as part of the global gross Scope 1 emissions figure reported in CC8.2 and/or the Scope 2 figure reported in CC8.3 of the core climate change questionnaire?
FBT2.3a
Please report these emissions from processing activities in your direct operations and identify any exclusions in the table below
Scope
Emissions from processing activities (metric tonnes CO2e)
Exclusions
Explanation
Comment
FBT2.3b
Please explain why you do not account for emissions from processing activities in your direct operations, and describe any plans for the collection of this data in the future
FBT2.4
Do you account for emissions from processing activities in your value chain as part of the Scope 3 category "Purchased goods and services" and/or "Processing of sold products" reported in CC14.1 of the core climate change questionnaire?
Further Information
Page: FBT3. Distribution
FBT3.1
Are distribution activities, whether in your direct operations or elsewhere in your value chain, relevant to your climate change disclosure?
FBT3.1a
Please explain why distribution activities are not relevant to your climate change disclosure
FBT3.2
Are emissions from distribution activities that you have identified as relevant produced in your direct operations, elsewhere in your value chain, or both?
FBT3.2a
Please explain why emissions from distribution activities in your direct operations are not relevant
FBT3.3
Do you account for emissions from distribution activities in your direct operations as part of the global gross Scope 1 emissions figure reported in CC8.2 and/or the Scope 2 figure reported in CC8.3 of the core climate change questionnaire?
FBT3.3a
Please report these emissions from distribution activities in your direct operations and identify any exclusions in the table below
Scope
Emissions from distribution activities (metric tonnes CO2e)
Exclusions
Explanation
Comment
FBT3.3b
Please explain why you do not account for emissions from distribution activities in your direct operations, and describe any plans for the collection of this data in the future
FBT3.4
Do you account for emissions from distribution activities in your value chain as part of the Scope 3 category "Upstream transportation and distribution" and/or "Downstream transportation and distribution" in CC14.1 of the core climate change questionnaire?
Further Information
Page: FBT4. Consumption
FBT4.1
Are consumption activities relevant to your climate change disclosure?
FBT4.1b
Please explain why consumption activities are not relevant to your climate change disclosure
FBT4.1a
Do you account for emissions from the consumption of your products as part of the Scope 3 category "Use of sold products" and/or "End of life treatment of sold products" in CC14.1 of the core climate change questionnaire?
Further Information
CDP 2014 Investor CDP 2014 Information Request


