
CDS ProjectZS Customer Modelling Challenge 2015
Group# 07
Ankit Katiyar (05)
Avinash Kumar (08)
Mohammed Tariq (22)
Mukul Kumar (26)
PGDBA - ISI Kolkata

Why this ?
In an environment where the only constant is
innovation, the telecommunication sector is
rapidly increasing its growth by understanding
the customer behaviour and pattern.
As we are in an era where data leverage is a
key feature to make smart business decisions,
the telecommunication sector is rethinking all
aspects to gain competitive advantage.
PGDBA - ISI Kolkata

The problem
Company
ZS Associates Inc is a
global leader in sales and
marketing consulting,
outsourcing, technology
and software.
Context
Predictive Modeling:
To predict the customer
behaviour as to whether
the add-ons are preferred
or not
Problem statement
The challenge is to
model customers of an
telecom company and
predict the propensity of
them buying add-ons.
PGDBA - ISI Kolkata

Problem Solving Approach
PGDBA - ISI Kolkata

Preliminary Analysis
Summary of the data
Cleaning
Removing NA values
and performing multiple
Imputation
Modeling
Build a predictive
model using random
Forest
Testing
Evaluate performance
of the model using
test data sets
Evaluation
Validating the data to
to ascertain model
can predict future
outcomes
PGDBA - ISI Kolkata

Preliminary Analysis
PGDBA - ISI Kolkata

Histogram for NA values The data has been split into:
50% - Training 20% - Validation 30% - Testing
The data contains 190explanatory variables out ofwhich 38 has 10 percent NAvalues while the rest have 90percent or more.
PGDBA - ISI Kolkata

Data Cleaning
PGDBA - ISI Kolkata

DIMENSION REDUCTION
(EXPLANATORY VARIABLES)
Remove the variables having NA
values more than 90 percent and
missing completely at random
(MCAR).
MULTIPLE IMPUTATION
After selecting the explanatory
variables ,we performed predictive
mean matching with the help of
MICE package.
PGDBA - ISI Kolkata

Modeling
PGDBA - ISI Kolkata

Selection of features
Correlation matrix
It gave the correlation betweendifferent explanatory variable tosee the independent features
PGDBA - ISI Kolkata

PCA
It gave the Majorfeatures which cover themaximum variances ofthe explanatory variable
PGDBA - ISI Kolkata
Scree Plot

It provides the graphicalrepresentation of thecorrelation matrix.
PGDBA - ISI Kolkata
Heat Map

Data modeling for Random forest
We modeled our data for
the prediction using
random forest model. The
features chosen were
features making principal
components and other
independent feature.
PGDBA - ISI Kolkata

Testing and evaluation
PGDBA - ISI Kolkata

The Evaluation was based on Mean F1 Score
Precision P is the ratio of true positives (TP)
to all predicted positives (TP + FP)
R is Recall or Sensitivity which is equal to
the ratio of true positives (TP) to all actual
positives (TP + FN)
Contingency Table after testing
PGDBA - ISI Kolkata

Improvements
● Further tuning was done in Random Forest for better results.
○ increasing the number of variables to be used for making the tree
○ Limiting the maximum number of nodes at the bottom level
○ changing the weightage of 1’s and 0’s to control the precision (
because the proportion of 1 is very low approx 7 %)
The F1 Score = 0.23178
PGDBA - ISI Kolkata
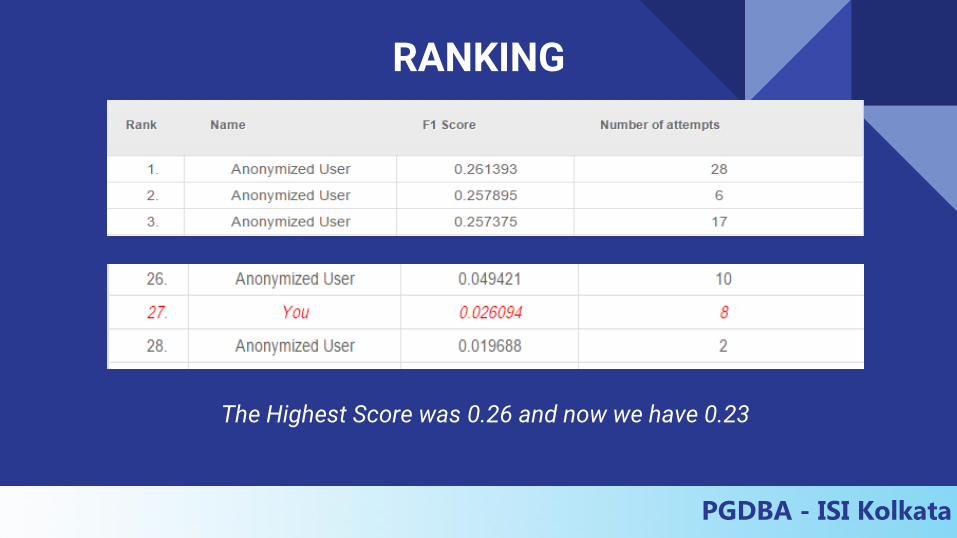
RANKING
The Highest Score was 0.26 and now we have 0.23
PGDBA - ISI Kolkata

• Excel
• R (Mice, Random Forest,
Miss Forest)
Software and
Packages UsedSpecial Thanks
• Robin Singh
• Manaswi
PGDBA - ISI Kolkata

Thank You!
PGDBA - ISI Kolkata
ত োমোকে ধন্যবোদ


