
CENTURIA METROPOLITAN REIT I 1H18 INTERIM RESULTS I ASX:CMA I 8 FEBRUARY 2018
Centuria Metropolitan REIT1H18 Interim Results
201 & 203 PACIFIC HIGHWAY, ST LEONARDS, NSW
PAGE 2
CENTURIA METROPOLITAN REIT I 1H18 INTERIM RESULTS I ASX:CMA I 8 FEBRUARY 2018
1Introduction
2Results Overview
3Portfolio Overview
4Guidance & Strategy
5Appendices
77 MARKET ST, WOLLONGONG, NSW

CENTURIA METROPOLITAN REIT I 1H18 INTERIM RESULTS I ASX:CMA I 8 FEBRUARY 2018
Section 1
Introduction

PAGE 4
CENTURIA METROPOLITAN REIT I 1H18 INTERIM RESULTS I ASX:CMA I 8 FEBRUARY 2018
Centuria Capital
Property fund management
Funds Management
Listed Property $2.0b Unlisted Property $1.7b
Investment Bonds
$0.9b
Centuria Life
$360m
Guardian Friendly Society
$493m
Funds Under Management
17 fixed term funds
$3.7bFunds Under Management
Funds Under Management
Industrial REIT (CIP)
$1.1bFunds Under Management
Office REIT (CMA)
$0.9bCenturia Diversified
Property Funds
$4.6bFunds Under Management
ASX listed specialist investment managerCenturia Capital Group

PAGE 5
CENTURIA METROPOLITAN REIT I 1H18 INTERIM RESULTS I ASX:CMA I 8 FEBRUARY 2018
1) Based on CMA closing price of $2.39 on 31 December 20172) Source: Moelis & Company 3) Gearing is defined as total borrowings less cash divided by total assets less cash and goodwill4) By gross income5) By area
19
4.3yrs 18.1cps 7.6%
$900m $579m 29.6% 97.8%
CMA, Australia’s largest ASX listed metropolitan office REIT
Key Metrics
High quality assets
Portfolio WALE 4
Portfolio value
FY18 distribution guidance
Market capitalisation 1
FY18 forecast distribution yield 1
Gearing 3 Portfolio occupancy 5
12 month total return at 31 December 2017
outperforming the S&P/ASX300 A-REIT Index at 6.4% 1,2
20.9%
1,2

CENTURIA METROPOLITAN REIT I 1H18 INTERIM RESULTS I ASX:CMA I 8 FEBRUARY 2018
Section 2
Results Overview

PAGE 7
CENTURIA METROPOLITAN REIT I 1H18 INTERIM RESULTS I ASX:CMA I 8 FEBRUARY 2018
Highlights
Continuing to deliver on strategy
Delivering stable earningsActive management driving portfolio performanceReaffirm FY18 distributable earnings guidance of 18.6 cps 1
Positive track record of delivering on earnings and distribution forecasts
Improved scale and relevanceAustralia’s largest and leading ASX listed metropolitan office REITEnhanced scale and liquidity, and included in the S&P/ASX 300 A-REIT Index
Institutional grade property portfolioSuccessfully completed the acquisition of four additional assets in the direct marketHigh quality, well diversified portfolio delivering stable and predictable rental incomeDriving investor returns through rental growth and opportunities for capital growth Continued repositioning of the portfolio through strategic transactions
Disciplined capital managementConservative gearing of 29.6% 2 within target range of 25-35%Staggered maturity profile with significant covenant headroomWell supported by both investors and lenders raising $150 million of equity and $60 million of debt over the period
1) Distributable earnings is a financial measure which is not prescribed by Australian Accounting Standard (AAS) and represents the profit under AAS adjusted for specific non-cash and significant items. The Directors consider that distributable earnings reflect core earnings of CMA
2) Gearing is defined as total borrowings less cash divided by total assets less cash and goodwill

PAGE 8
CENTURIA METROPOLITAN REIT I 1H18 INTERIM RESULTS I ASX:CMA I 8 FEBRUARY 2018
1) Distributable earnings is a financial measure which is not prescribed by Australian Accounting Standard (AAS) and represents the profit under AAS adjusted for specific non-cash and significant items. The Directors consider that distributable earnings reflect the core earnings of CMA
2) Based on CMA closing price of $2.39 per security as at 31 Dec 2017 and $2.25 per security as at 6 February 20173) Gearing is defined as total borrowings less cash divided by total assets less cash and goodwill
Financial overview
Financial snapshot 1H18 1H17
Statutory profit/(loss) $m 39.2 27.1
Distributable earnings 1 $m 19.9 10.9
Distributable earnings per security cps 9.4 9.2
Distribution $m 20.9 10.4
Distribution per security cps 9.05 8.75
Distribution earnings per yield2 % 7.6 7.8
Weighted average securities on issue m 212.8 119.4
Balance sheet metrics 1H18 1H17
Total assets $m 902.5 440.6
NTA per stapled security $ 2.39 2.32
Gearing 3 % 29.6 33.8
9.4 cps 1H18 distributable earnings
9.05 cps1H18 distributions paid
$2.39 cps Net tangible assets
29.6%Gearing 3
12 month total return at 31 December 2017
outperforming the S&P/ASX300 A-REIT Index at 6.4% 1,2
20.9%
1,2

PAGE 9
CENTURIA METROPOLITAN REIT I 1H18 INTERIM RESULTS I ASX:CMA I 8 FEBRUARY 2018
Maintained a disciplined balance sheetCapital management
Key debt metrics 1H18
Facility limit ($m) 320.0
Drawn amount ($m) 297.6
Undrawn capacity ($m) 22.4
Weighted average debt expiry (years) 3.0
Proportion hedged (%) 54.0
Weighted average hedge maturity (years) 2.6
Cost of debt2 (%) 3.7
Gearing 4 (%) 29.6
Interest cover ratio (times) 6.1
LVR % 35.3
29.6 %Gearing1
3.7 %All in cost of debt2
1) Gearing is defined as total borrowings less cash divided by total assets less cash and goodwill2) Including weighted average swap rate, facility establishment fees and all-in margins (base and line fees)3) Comprises $40 million in May 2020 and $50 million in June 20204) 31 December 2017 proforma gearing of 33.9% adjusted for Williams Landing
− Multi-bank debt facilities provides diversity of funding sources and enhanced balance sheet capacity
− Staggered debt tranches with no single maturity exceeding 25% of total facilities
– First maturity in December 2019
− Undertook $150 million of equity raisings over the half
– Adequate gearing capacity to fund settlement of 2 Kendall Street, Williams Landing, VIC on completion 4
− Significant covenant headroom, interest cover ratio covenant of 2.0x and LVR covenant of 50.0%
1H19 2H19 1H20 2H20 3 1H21 2H21 1H22 2H22
$55
$90
$40
$65
$40$30
Debt Maturity Profile
0
25
50
75
$100
$40
$50

PAGE 10
CENTURIA METROPOLITAN REIT I 1H18 INTERIM RESULTS I ASX:CMA I 8 FEBRUARY 2018
Summary of acquisitions StateIndependent
Valuation ($m)1 Initial yield1 Cap rate NLA (sqm) WALE (years) 2 Occupancy 4
201 Pacific Highway, St Leonards (50%) NSW 85.8 6.6% 6.5% 16,488 3.5 100%
77 Market Street, Wollongong3 NSW 33.3 7.5% 7.3% 6,755 4.3 100%
144 Stirling Street, Perth WA 58.2 9.2% 7.5% 11,042 3.9 100%
42-46 Colin Street, West Perth WA 33.6 8.7% 7.5% 8,439 4.5 100%
Total 210.9 7.8% 7.1% 42,724 3.9 100%
Summary of disposals StateSale Price
($m)Premium
to 1H18 BV
44 Hampden Road, Artarmon NSW 10.3 14.4%
Total 10.3 —
1) Before transaction costs. Acquisition price for 144 Stirling Street, Perth and 201 Pacific Highway, St Leonards are gross price before adjustment for existing outstanding incentives2) By income. WALE at acquisition date3) 77 Market Street, Wollongong includes lease transactions agreed post 30 June 20174) By area
Acquired quality income generating metropolitan office assetsCapital transactions – acquisitions and disposals
– Acquisition of four metropolitan office assets, totalling $210.9 million; assets are highly complimentary to existing portfolio
– Acquisitions are fully occupied with attractive income profiles
− Disposal of 44 Hampden Road, Artarmon reflecting a 14.4% premium to book value and an 18.4% annual IRR over CMA’s ownership period

CENTURIA METROPOLITAN REIT I 1H18 INTERIM RESULTS I ASX:CMA I 8 FEBRUARY 2018
Portfolio Overview
Section 3

PAGE 12
CENTURIA METROPOLITAN REIT I 1H18 INTERIM RESULTS I ASX:CMA I 8 FEBRUARY 2018
1) Includes Williams Landing, VIC, as if complete
Geographically diversified portfolio weighted to eastern seaboard markets
Portfolio composition
Portfolio Snapshot 1H18 1 1H17
Number of assets # 19 13
Book value $m 899.7 417.5
WACR % 6.87 7.52
1H NOI $m 26.3 15.2
NLA sqm 184,360 112,664
30%QLD
WA
NT
NSW
ACT
32%
9%
10%6%
SA
TAS
VIC
13%
NSW
9 Help Street, Chatswood201 Pacific Highway, St Leonards203 Pacific Highway, St Leonards3 Carlingford Road, Epping77 Market Street, Wollongong13 Ferndell Street, Granville
QLD
35 Robina Town Centre Drive, Robina555 Coronation Drive, Brisbane438-517 Kingsford Smith Drive, Hamilton154 Melbourne Street, South Brisbane149 Kerry Road, Archerfield
ACT
54 Marcus Clarke Street, Canberra60 Marcus Clarke Street, Canberra
VIC
576 Swan Street, Richmond2 Kendall St, Williams Landing
WA
144 Stirling St, Perth42-46 Colin Street, West Perth
SA
1 Richmond Road, Keswick131-139 Grenfell Street, Adelaide

PAGE 13
CENTURIA METROPOLITAN REIT I 1H18 INTERIM RESULTS I ASX:CMA I 8 FEBRUARY 2018
Key lease transactions No. of transactions sqm
203 Pacific Highway, St Leonards, NSW 1 3,503
54 & 60 Marcus Clarke Street, ACT 8 2,513
9 Help Street, Chatswood, NSW 4 1,887
42-46 Colins Street, West Perth, WA 1 492
Submarket Occupancy 2,3 WALE 2
NSW 100.0% 3.7
VIC 100.0% 7.1
QLD 94.2% 4.6
SA 94.8% 3.1
ACT 97.4% 3.2
WA 100.0% 4.0
Total Portfolio 97.8% 4.3
5.0%Portfolio NLA leased in 1H18
9,324 sqmPortfolio NLA leased in 1H18
4,674 sqmFY18 expiries and vacancy leased
1.2%FY18 expiries 1,2
– Secured 20 lease transactions in 1H18 across 9,234sqm– 12 new leases across 3,913sqm– 8 renewals across 5,321sqm– 16 lease transactions less than 500sqm highlights the benefits of Centuria’s
integrated property management platform
– Solid earnings visibility for remainder of FY18 with low expiry of 1.2%1,2
Leasing overview
Focus on leasing to maximise occupancy and income
1) Weighted by gross income2) Includes Williams Landing, VIC, as if complete3) By area

PAGE 14
CENTURIA METROPOLITAN REIT I 1H18 INTERIM RESULTS I ASX:CMA I 8 FEBRUARY 2018
– Well diversified rent roll with 42.8% of gross rental income derived from top ten institutional and government tenants
− Earnings growth supported by 96% of rental income subject to fixed annual reviews averaging 3.6% p.a.
− Active management platform drives leasing performance from multi-tenant assets with <500sqm users
– Immaterial arrears across the portfolio
Earnings growth underpinned by high quality tenants and contractual rental growth
Tenancy profile
7.0%
5.7%
5.4%
4.5%
3.7%
3.7%
3.4%
3.2%
3.1%
3.1%
Insurance Australia Limited
Target Australia
Austar Entertainment Pty Limited
Bluescope Steel Limited
Minister for Works (WA Police)
Hatch
GE Capital Finance Australasia
Domino’s Pizza Ltd
Minister for Infrastructure
Cisco Systems Australia
Tenant diversification (top 10 tenants by gross income) 1
70%
8%
10%
12%
Tenancy profile by size cohort (by no.tenant) 1
500 to 1,000sqm1,000 to 2,000sqm
>2,000sqm
<500sqm
182tenants
96%
4%
Rental reviews 1
CPIFixed
Fixedannualreviews
averaging3.6%
1) Includes Williams Landing, VIC, as if complete

PAGE 15
CENTURIA METROPOLITAN REIT I 1H18 INTERIM RESULTS I ASX:CMA I 8 FEBRUARY 2018
Portfolio Snapshot 1 1H18 1H17
Occupancy 2 % 97.8 98.9
FY18 expiries 3 % 1.2 6.2
WALE 3 yrs 4.3 3.8
1) Includes Williams Landing, VIC, as if complete2) By area3) Weighted by gross income
Portfolio positioned to drive ongoing performancePortfolio metrics
Vacant FY18 FY19 FY20
1H17
FY21 FY22+0
20
10
60%
40
50
1.2%2.5%
13.3% 16.0% 14.0%
53.0%
Weighted Average Lease Expiry 1,3
1.3%
1H18
6.2%
30
− Low forward lease expiry profile ensures visibility of future earnings
− Minimal expiries of 1.2% 1,2 remaining in FY18
− Increased WALE to 4.3 years 3, 0.5 years over 1H17
− Known expiry of SMEC at 154 Melbourne Street, South Brisbane, QLD, increased vacancy slightly
– Refurbishment completed, actively pursuing expressions of interest
– Department of Housing and Public Works 1,624sqm lease renewal post 1H18, five year term, reduces FY19 lease expiry
− Average NABERS energy rating of 3.8

PAGE 16
CENTURIA METROPOLITAN REIT I 1H18 INTERIM RESULTS I ASX:CMA I 8 FEBRUARY 2018
Robust market fundamentals and active management driving valuation growth
Portfolio valuations
Book value Capitalisation rate
1H18 1H17 Increase % 1H18 1H17 Change (bps)
Like for like portfolio1 ex. acquisitions $634.7m $593.1m $41.6m 7.0 6.84% 7.31% (47 bps)
Acquisitions $265.0m — $265.0m — 6.93% — —
Total $899.7m $593.1m $306.6m 51.7 6.87% 7.31% (44 bps)
1) Like for like valuation increase from 1H17 excluding 44 Hampden Road, Artarmon, NSW and 14 Mars Road, Lane Cove, NSW
60 MARCUS CLARKE STREET, CANBERRA, ACT
− 100% of portfolio externally valued at 30 November 2017
– Book value adjusted for December capital expenditure spend
− Like for like portfolio valuations increased year on year by 7.0% 1 to $634.7 million− Total portfolio value increased 51.7% to $899.7 million
− Like for like portfolio WACR firmed year on year by 47 basis points to 6.84% 1
− Total portfolio WACR firmed year on year by 44 basis points to 6.87%

CENTURIA METROPOLITAN REIT I 1H18 INTERIM RESULTS I ASX:CMA I 8 FEBRUARY 2018
Section 4
Guidance & Strategy
PAGE 18
CENTURIA METROPOLITAN REIT I 1H18 INTERIM RESULTS I ASX:CMA I 8 FEBRUARY 2018
1) Based on the CMA closing price of $2.39 per security on 31 December 2017
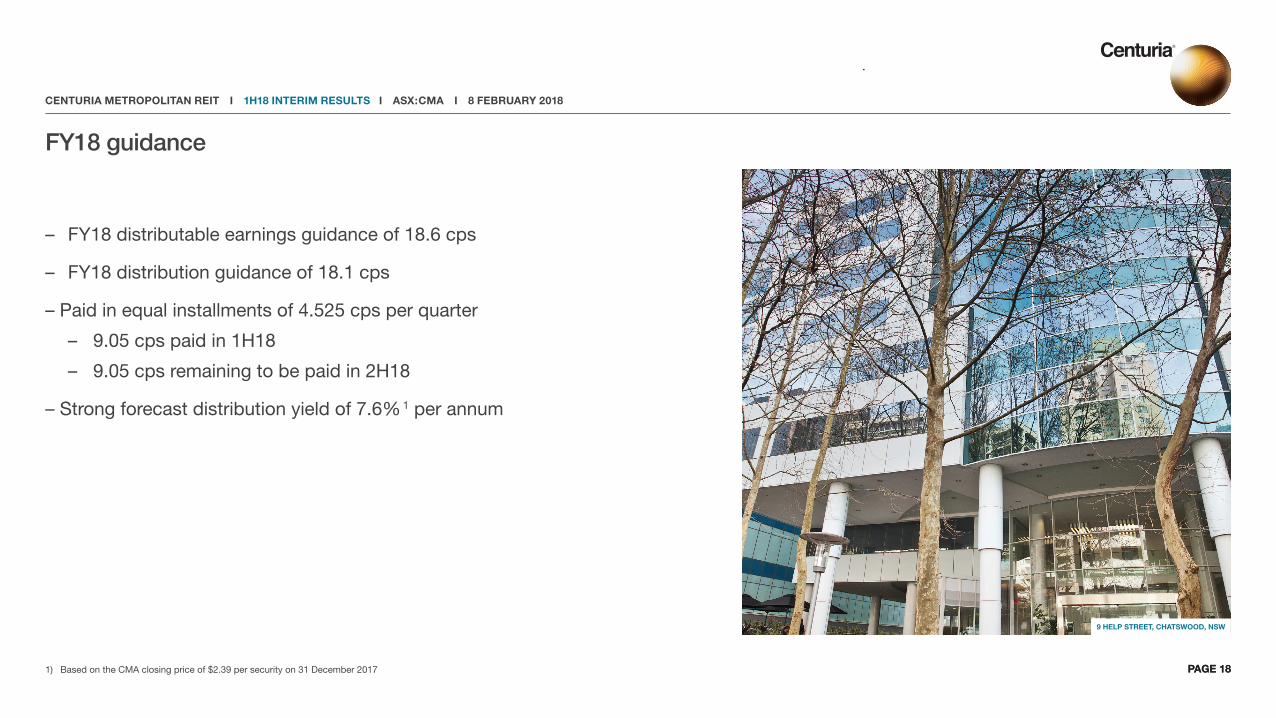
FY18 guidance
– FY18 distributable earnings guidance of 18.6 cps
– FY18 distribution guidance of 18.1 cps
– Paid in equal installments of 4.525 cps per quarter
– 9.05 cps paid in 1H18
– 9.05 cps remaining to be paid in 2H18
– Strong forecast distribution yield of 7.6% 1 per annum
9 HELP STREET, CHATSWOOD, NSW
PAGE 18

PAGE 19
CENTURIA METROPOLITAN REIT I 1H18 INTERIM RESULTS I ASX:CMA I 8 FEBRUARY 2018
CMA’s strategy and focus remains unchangedStrategy
Fund strategy
– Acquire quality ‘fit for purpose’ metropolitan real estate assets delivering stable and secure income streams
− Maintain a disciplined capital structure with gearing below 35%
− Acquisition decisions driven by bottom up market research
Portfolio strategy
– Focus on portfolio leasing to ensure occupancy, WALE and income continue to be maximised
− Execute initiatives to generate income and value uplift through active asset management, risk mitigation and repositioning strategies
− Divest assets and recycle capital where appropriate
In Australia’s metropolitan office markets, superior assets selection, active asset management and close relationships with tenants are the cornerstone of success.
CMA represents an opportunity to gain exposure to an investment grade portfolio managed by hands on professional managers specialising in generating value throughout the property cycle

CENTURIA METROPOLITAN REIT I 1H18 INTERIM RESULTS I ASX:CMA I 8 FEBRUARY 2018
Section 5
AppendicesAppendix A – History of Centuria Metropolitan REIT
Appendix B – Market Outlook
Appendix C – Income Statement
Appendix D – Distribution Statement
Appendix E – Balance Sheet
Appendix F – NTA Movement
Appendix G – FFO Reconciliation
Appendix H – Investment Portfolio

PAGE 21
CENTURIA METROPOLITAN REIT I 1H18 INTERIM RESULTS I ASX:CMA I 8 FEBRUARY 2018
Appendix A – History of Centuria Metropolitan REIT
1) Based on restated guidance in the CMA acquisition and entitlement offer presentation – 29 April 2015Source: Company filings, IRESS, Factset as at 31 December 2017
$1.80
$2.00
$2.20
$2.40
$2.60
$2.80
Dec14 Jun 15 Dec 15 Jun 16 Dec 16 Dec 17 Jun 17
EPS guidance (cps) 10.5 1 17.3 1 18.7-19.0 FY18: 18.6
1H18: 9.4EPS actual (cps) 10.5 18.4 19.0
CMA successfully lists on the ASX at $2.00 per security
$100 million entitlement offer to partially fund the acquisition of 4 metropolitan office assets valued at $129 million
Acquisition of a 50% interest in 203 Pacific Highway for $43 million (in partnership with another Centuria unlisted fund)
CMA and CNI accept the Growthpoint Offer for GMF
and sell their 16.1% interest for a $2.1m profit
CMA and Centuria Capital Limited (CNI) acquire a 16.1% interest in
GPT Metro Office Fund and announce a proposal to acquire all
outstanding units
Announces intention to acquire a 8.76% interest in 360 Capital Office Fund (now CUA) in conjunction with CNI's acquisition of the 360 Capital real estate management platform
CUA unitholders approve merger. Implementation on
29 June 2017
Announces proposal to merge with Centuria Urban REIT (CUA)
Sale of Mars Road, Lane CoveNSW for $26 million (representinga 20.9% premium to book valueand a 23.8% IRR since IPO)
$90 million placement andentitlement offer to partiallyfund the acquisition of 3metropolitan office assetsvalued at $150 million
$60 million placementto partially fund the
acquisition of 2 metropolitanoffice assets valued
at $119 million
CMA is added to theS&P/ASX 300A-REIT Index
Sale of 44 Hampden Road, Artarmon NSW for $10.3
million (representing a 14.4%premium to book value
and an annual 18.4% IRR)
Total return since CMA IPO (as at 31 December 2017)– CMA: +47.3%– ASX300 A-REIT Index: +41.4%

PAGE 22
CENTURIA METROPOLITAN REIT I 1H18 INTERIM RESULTS I ASX:CMA I 8 FEBRUARY 2018
Robust supply and demand fundamentals in metropolitan office marketsAppendix B – Market outlook
– Non-CBD market supply is generally trending below historic averages
– Majority of supply surrounds Sydney and Melbourne where vacancies are constrained
– Australian metro market total vacancy (9.1%) is lower than total CBD vacancy (9.8%). Metro vacancy has predominantly been impacted by demand, CBDs by withdrawal
– Seven out of ten lowest vacancy markets are metro markets
– Large infrastructure market development and project delivery is supporting tenant and employment bases across various national markets
– Strong effective CBD rent growth, particularly in Sydney and Melbourne is impacting metro markets
– Incentives continue to decline
– Metro recorded highest positive absorption since December 2012, influenced by tenants seeking relocation
– Continuing strong activity for sub 1,000sqm occupiers, supporting CMA’s tenant composition across 80% of the portfolio
– Increased interest in metro assets from both domestic and international investors seeking transaction opportunities due to competitive, tightly held CBD markets
– Yield spread has tightened between metro and CBD, likely to underpin further capital growth within certain metro markets
0
20
25%
10
5
15
Australian office vacancy rates
East M
elbou
rne
Parram
atta
Melbou
rne CBD
Sydne
y CBD
Southb
ank
Macqu
arie P
ark
Chatsw
ood
St Kilda
Road
North S
ydne
y
Hobart
CBD
Newca
stle
Wollong
ong
Gold Coa
st
Crows N
est/S
t Leo
nards
Adelaid
e Frin
ge
Canbe
rra
Brisba
ne Fr
inge
Sunsh
ine Coa
st
Adelaid
e CBD
Brisba
ne CBD
West P
erth
Perth C
BD
Darwin
CBD
4.6% 4.6%
Australian office vacancy8.1%
13.1%
19.8%21.6%
Source: PCA/OMR
Metropolitan CBD
0
10%
5
0
1.40%
0.80
0.40
0.60
1.00
1.20
0.20
Yield spread – A-grade metro vs CBD A-grade
Yield spread (RHS)
Source: ColliersEdge
Mar 04
Sep 04
Mar 05
Sep 05
Mar 06
Sep 06
Mar 07
Sep 07
Mar 08
Sep 08
Mar 09
Sep 09
Mar 10
Sep 10
Mar 11
Sep 11
Mar 12
Sep 12
Mar 13
Sep 13
Mar 14
Sep 14
Mar 15
Sep 15
Mar 16
Sep 16
Mar 17
Sep 17
Metro A-Grade yield CBD A-Grade yield

PAGE 23
CENTURIA METROPOLITAN REIT I 1H18 INTERIM RESULTS I ASX:CMA I 8 FEBRUARY 2018
Appendix C – Income Statement$’000 31 December 2017
Revenue
Gross property income 33,503
Interest income 96
Total revenue 33,599
Expenses
Direct property expenses (7,243)
Responsible entity fees (1,959)
Finance costs (3,764)
Management and other administrative expenses (723)
Total expenses (13,689)
Sub-total 19,910
Straight lining of rental income 2,659
Amortisation of leasing fees and tenant incentives (889)
Gain / (loss) on fair value of investment properties 18,600
Gain / (loss) on fair value of derivatives financial instrument (653)
Amortisation of borrowing costs (255)
Business combination transaction costs (198)
Statutory net profit 39,174
PAGE 24
CENTURIA METROPOLITAN REIT I 1H18 INTERIM RESULTS I ASX:CMA I 8 FEBRUARY 2018
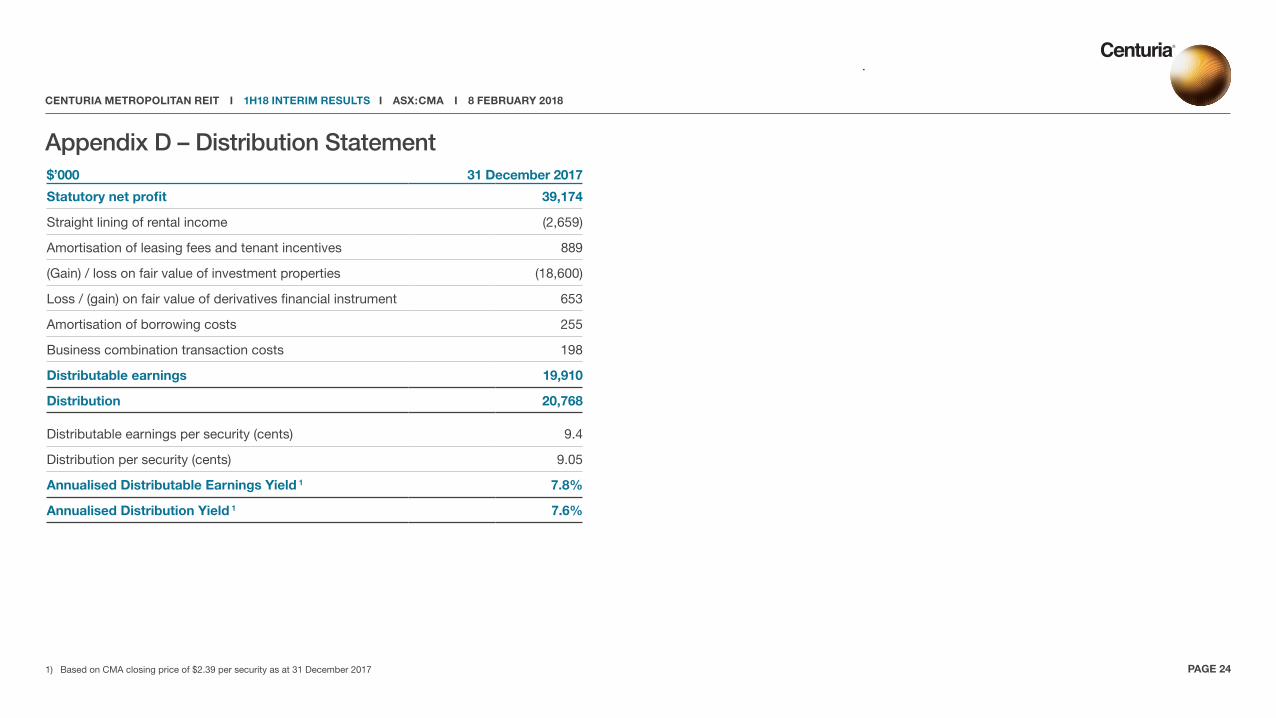
Appendix D – Distribution Statement
1) Based on CMA closing price of $2.39 per security as at 31 December 2017
$’000 31 December 2017
Statutory net profit 39,174
Straight lining of rental income (2,659)
Amortisation of leasing fees and tenant incentives 889
(Gain) / loss on fair value of investment properties (18,600)
Loss / (gain) on fair value of derivatives financial instrument 653
Amortisation of borrowing costs 255
Business combination transaction costs 198
Distributable earnings 19,910
Distribution 20,768
Distributable earnings per security (cents) 9.4
Distribution per security (cents) 9.05
Annualised Distributable Earnings Yield 1 7.8%
Annualised Distribution Yield 1 7.6%

PAGE 25
CENTURIA METROPOLITAN REIT I 1H18 INTERIM RESULTS I ASX:CMA I 8 FEBRUARY 2018
1) Drawn debt net of borrowing costs2) Includes $11.0m distributions payable3) Gearing is defined as interest bearing liabilities less cash divided by total assets less cash and goodwill
Appendix E – Balance Sheet
$’000 31 December 2017
Cash 46,273
Investment properties 841,441
Goodwill 6,356
Trade and other receivables 5,535
Other assets 2,912
Total assets 902,517
Interest bearing liabilities 1 295,793
Trade and other receivables 2 20,887
Derivative financial instruments 434
Total liabilities 317,714
Net assets 585,403
Securities on issue (thousands) 242,237

PAGE 26
CENTURIA METROPOLITAN REIT I 1H18 INTERIM RESULTS I ASX:CMA I 8 FEBRUARY 2018
1) Other includes movement in cash, payables, receivables and DRP impact
Strong NTA growthAppendix F – NTA movement
30 Jun 17 Swaps Reset& MTM
(0.00) (0.03) (0.03)
0.14 (0.01)
31 Dec 17Revaluation OthersAssetDisposal
DecAcquisitions &Equity Raise
JulAcquisitions &Equity Raise
$1.80
$2.00
$1.90
$2.20
$2.30
$2.10
$2.50
$2.40
(0.00)
$2.32
$2.39

CENTURIA METROPOLITAN REIT I 1H18 INTERIM RESULTS I ASX:CMA I 8 FEBRUARY 2018
Appendix G – FFO Reconciliation
Property
CMA Distributable
Earnings ($’000)PCA FFO
($’000)Difference
($’000)
Statutory net profit 39,174 39,174 0
Straight lining of rental income 1 (2,659) (2,659) 0
Amortisation of leasing fees 889 889 0
Gain / (loss) on fair value of investment properties (18,600) (18,600) 0
Loss / (gain) on fair value of derivatives financial instrument 653 653 0
Amortisation of borrowing costs 255 255 0
Business combination transaction costs 198 198 0
Funds from operations 19,910 19,910 0
FFO per share 9.4 9.4 0.0
Distribution per share 9.05 9.05 0.0
Weighted average number of securities (’000) 212,823 212,823
PAGE 271) Net of amortisation of tenant incentives.

PAGE 28
CENTURIA METROPOLITAN REIT I 1H18 INTERIM RESULTS I ASX:CMA I 8 FEBRUARY 2018
Appendix F – Investment Portfolio
1) 144 Stirling Street, Perth valuation includes outstanding existing incentives2) By income3) By area
31 Dec 17 NLA WALE 2 Property State Ownership Book value Cap rate (sqm) (years) Occupancy 3
Office9 Help Street, Chatswood NSW 100% 68.5 6.50% 9,394 3.0 100.0%
203 Pacific Highway, St Leonards NSW 50% 53.8 6.75% 11,734 5.9 100.0%
3 Carlingford Road, Epping NSW 100% 28.3 6.25% 4,702 2.2 100.0%
54 Marcus Clarke, Canberra ACT 100% 20.0 8.00% 5,169 4.0 95.3%
60 Marcus Clarke, Canberra ACT 100% 62.5 7.25% 12,132 2.9 98.2%
35 Robina Town Centre Drive, Robina QLD 100% 55.0 7.13% 9,814 5.8 100.0%
555 Coronation Drive, Brisbane QLD 100% 33.7 7.75% 5,591 2.8 87.1%
483 Kingsford Smith Drive, Hamilton QLD 100% 77.0 6.38% 9,322 7.0 100.0%
154 Melbourne Street, South Brisbane QLD 100% 76.2 6.75% 11,300 2.2 80.7%
576 Swan Street, Richmond VIC 100% 62.0 5.88% 8,331 4.2 100.0%
1 Richmond Road, Keswick SA 100% 31.4 8.00% 8,100 4.0 92.1%
131-139 Grenfell Street, Adelaide SA 100% 19.3 8.00% 4,052 1.9 100.0%
Industrial 13 Ferndell Street, Granville NSW 100% 19.9 7.00% 15,302 2.3 100.0%
149 Kerry Road, Archerfield QLD 100% 27.3 6.50% 13,774 7.0 100.0%
Total / weighted average (excl. acquisitions) 634.7 6.84% 128,717 4.0 96.9%
201 Pacific Highway, St Leonards NSW 50% 84.6 6.50% 16,488 3.4 100.0%
77 Market St, Wollongong NSW 100% 33.3 7.25% 6,755 4.2 100.0%
144 Stirling Street, Perth1 WA 100% 55.3 7.50% 11,042 3.4 100.0%
42-46 Colin Street, West Perth WA 100% 33.6 7.50% 8,439 4.6 100.0%
Total incl. Acquisitions (excl. Williams Landing) 841.4 6.89% 171,441 3.9 97.7%
Investment Properties Under Constructions 2 Kendall Street, Williams Landing, VIC VIC 100% 58.2 6.50% 12,919 10.0 100.0%
Total Portfolio / weighted average 899.7 6.87% 184,360 4.3 97.8%
PAGE 29
CENTURIA METROPOLITAN REIT I 1H18 INTERIM RESULTS I ASX:CMA I 8 FEBRUARY 2018
DisclaimerThis presentation has been prepared by Centuria Property Funds Limited (ABN 11 086 553 639, AFSL 231 149) (‘CPFL’) as responsible entity of Centuria Metropolitan REIT (‘CMA’ or the ‘Trust’).
All information and statistics in this presentation are current as at 31 December 2017 unless otherwise specified. It contains selected summary information and does not purport to be all-inclusive or to contain all of the information that may be relevant, or which a prospective investor may require in evaluations for a possible investment in CMA. It should be read in conjunction with CMA’s periodic and continuous disclosure announcements which are available at www.centuria.com.au. The recipient acknowledges that circumstances may change and that this presentation may become outdated as a result. This presentation and the information in it are subject to change without notice and CPFL is not obliged to update this presentation.
This presentation is provided for general information purposes only. It is not a product disclosure statement, pathfinder document or any other disclosure document for the purposes of the Corporations Act and has not been, and is not required to be, lodged with the Australian Securities & Investments Commission. It should not be relied upon by the recipient in considering the merits of CMA or the acquisition of securities in CMA. Nothing in this presentation constitutes investment, legal, tax, accounting or other advice and it is not to be relied upon in substitution for the recipient’s own exercise of independent judgment with regard to the operations, financial condition and prospects of CMA.
The information contained in this presentation does not constitute financial product advice. Before making an investment decision, the recipient should consider its own financial situation, objectives and needs, and conduct its own independent investigation and assessment of the contents of this presentation, including obtaining investment, legal, tax, accounting and such other advice as it considers necessary or appropriate. This presentation has been prepared without taking account of any person’s individual investment objectives, financial situation or particular needs. It is not an invitation or offer to buy or sell, or a solicitation to invest in or refrain from investing in, securities in CMA or any other investment product.
The information in this presentation has been obtained from and based on sources believed by CPFL to be reliable.
To the maximum extent permitted by law, CPFL and its related bodies corporate make no representation or warranty, express or implied, as to the accuracy, completeness, timeliness or reliability of the contents of this presentation. To the maximum extent permitted by law, CPFL does not accept any liability (including, without limitation, any liability arising from fault or negligence) for any loss whatsoever arising from the use of this presentation or its contents or otherwise arising in connection with it.
This presentation contains information as to the past performance of CMA. Such information is given for illustrative purposes only, and is not – and should not be relied upon – as an indication of the future performance of CMA.
This presentation may contain forward-looking statements, guidance, forecasts, estimates , prospects, projections or statements in relation to future matters (‘Forward Statements’). Forward Statements can generally be identified by the use of forward looking words such as “anticipate”, “estimates”, “will”, “should”, “could”, “may”, “expects”, “plans”, “forecast”, “target” or similar expressions. Forward Statements including indications, guidance or outlook on future revenues, distributions or financial position and performance or return or growth in underlying investments are provided as a general guide only and should not be relied upon as an indication or guarantee of future performance. No independent third party has reviewed the reasonableness of any such statements or assumptions. No member of CPFL represents or warrants that such Forward Statements will be achieved or will prove to be correct or gives any warranty, express or implied, as to the accuracy, completeness, likelihood of achievement or reasonableness of any Forward Statement contained in this presentation. Except as required by law or regulation, CPFL assumes no obligation to release updates or revisions to Forward Statements to reflect any changes. The reader should note that this presentation may also contain pro forma financial information.
Distributable earnings is a financial measure which is not prescribed by Australian Accounting Standards (‘AAS’) and represents the profit under AAS adjusted for specific non-cash and significant items. The Directors consider that distributable earnings reflect the core earnings of the Trust.
All dollar values are in Australian dollars ($ or A$) unless stated otherwise.CA-CMA–06/02/18–00726
CENTURIA METROPOLITAN REIT I 1H18 INTERIM RESULTS I ASX:CMA I 8 FEBRUARY 2018
Thank youFurther Information:
Nicholas Blake Trust Manager – CMA +61 2 8923 8923
Hengky Widjaja Senior Analyst, Listed Property +61 2 8923 8923


