CFA-DFW/CFA HOUSTON Student Research This report is published for educational purposes only
by students competing in the
Investment Research ChallengeTM
– Texas.
Investment Research Challenge-Texas
CFA-DFW/CFA Houston Important disclosures appear at the back of this report
Ticker: RCII (NASDAQ) Recommendation: BUY
Price: $21.88 Price Target: $26.17
Earnings/Share
Mar. Jun. Sept. Dec. Year P/E Ratio
2006 $0.57 $0.56 $0.36 -$0.03 $1.46 15.0x
2007 0.21 0.58 0.37 -0.08 1.08 13.9x
2008 0.54 0.56 0.44 0.54 2.08 11.0x
2009 0.68 0.63 0.55 0.68 2.54 9.2x
2010E 0.67E 0.64E 0.57E 0.65E 2.53E 10.7x
Highlights
Target price premium. Discounted free cash flow analysis results in a target price premium of
19.6% over the current market price. The valuation was supported by a comparables analyses.
Strong financial position with consistent positive free cash flows and a deleveraged balance
sheet. Strong free cash flows since 2004 (in years without a major acquisition), averaging over
$130 million per year. Recently paid down over $548 million in long term debt, reducing risk and
interest costs.
Risk of missed opportunities due to the lack of a clearly defined long term growth strategy.
Opportunities for substantial growth limited by current focus on financial services operations, a
segment projected to remain less than 3% of overall revenues.
13
14
15
16
17
18
19
20
21
22
23
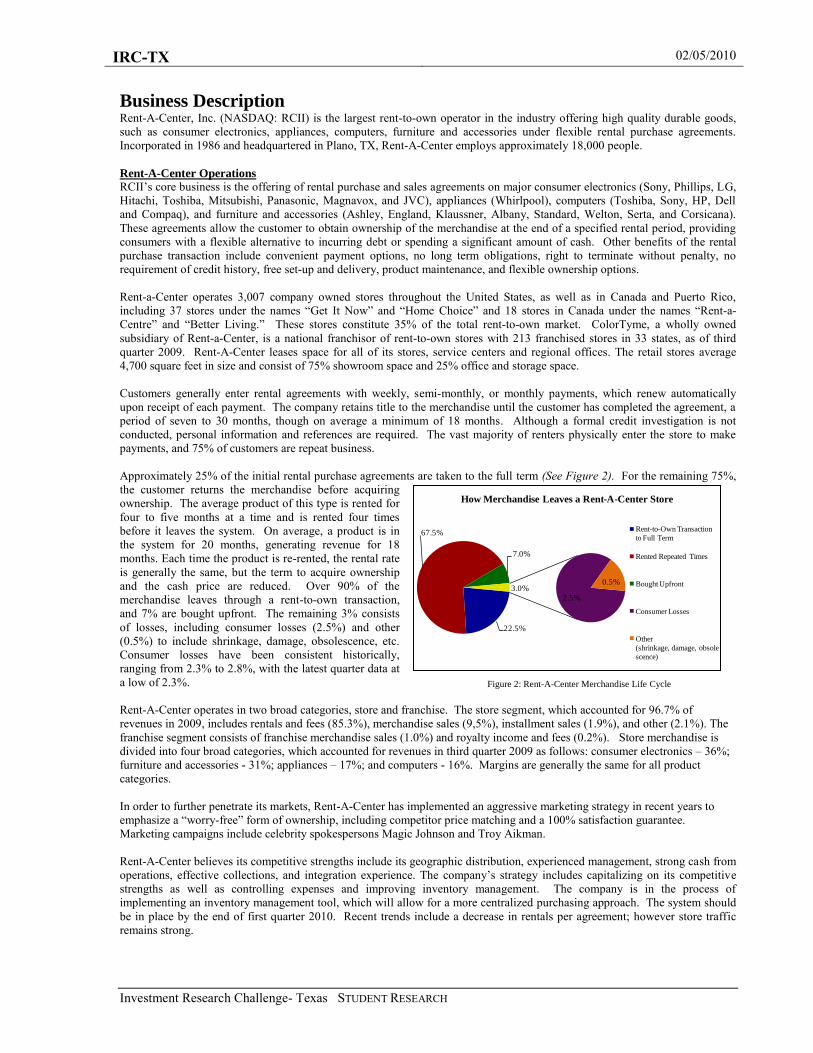
Dec-08 Feb-09 Mar-09 May-09 Jul-09 Aug-09 Oct-09 Dec-09 Jan-10 Mar-10
RCII Daily Stock Price
52 Week Price Range $16.25 - $23.14
Average Daily Volume 890,000 shares
Beta 1.22
Dividend Yield (Estimated) N/A
Shares Outstanding 66.0
Market Capitalization $1,444M
Institutional Holdings 97%
Insider Holdings 1.85%
Book Value per Share (2/3/10) $18.91
Debt to Total Capital 35%
Return on Equity 14%
Market Profile
Rent-A-Center, Inc.
February 5, 2010
Industry:
Specialty Retail

IRC-TX 02/05/2010
Investment Research Challenge- Texas STUDENT RESEARCH 2
Investment Summary Rent-A-Center merits a “BUY” recommendation based on its projected free cash flows and potential for breakout revenue
growth. Our target price of $26.17 represents a premium of 19.6% over the firm’s current market value. The firm is relatively
undervalued as compared to its peers.
Rent-A-Center is expected to generate strong free cash flows into the foreseeable future despite an anticipated decline in long
term growth. The firm will achieve moderate revenue growth in the short to mid-term through the addition of approximately
315 stores, buyouts of about 300 competitor store accounts, improved sales of add-on units, and successful integration of its
financial services operations into its existing stores. However, we are less bullish beyond year five when we believe market
saturation, limited acquisition opportunities, the maturation of existing stores, and the effects of increased competition will
result in growth more in line with the economy as a whole. Even so, we believe Rent-A-Center’s large geographic footprint and
established customer base will provide a consistent, though less rapidly growing revenue source.
The firm is expected to maintain reasonable, albeit diminished, margins despite an increasingly competitive landscape. The
rapid growth of Rent-A-Center’s closest competitor should eventually create downward pricing pressure on the industry as a
whole, negatively impacting margins. Even so, the Rent-A-Center’s more efficient integration of its financial services
operations, reduced inventory costs resulting from the implementation of new inventory management tools, and reduction in
debt related expenses due to its debt reduction efforts, should allow it to maintain sufficient margins into the foreseeable future.
Our target price is based solely upon the results of transactions with Rent-A-Center’s current customer base. However, we
believe Rent-A-Center has barely scratched the surface of its potential customer pool, reaching only one out of seven
individuals that fall within its target demographic. Rent-A-Center has the potential to dramatically increase its customer base
through expansion into large scale retail establishments. The firm is currently testing a strategy whereby it furnishes a sales
force within certain large scale retail stores to provide an additional purchasing option to customers who do not qualify for retail
credit. Should this strategy prove successful, Rent-A-Center would gain access to a customer base even beyond its underserved
target group, providing the potential for both rapid and dramatic revenue growth.
Rent-A-Center’s value could be negatively impacted by the adoption of industry restrictive legislation, the firm’s failure to
integrate its financial services operations, the firm’s failure to identify new markets, continued high unemployment, declining
consumer electronics prices, or the entry of big box retailers into the rent-to-own industry.
Figure 1: Rent-A-Center, Inc. Five Year Stock and News Chart This chart is a timeline of news events with major impact to Rent-A-Center, Inc.’s market price.
Source: Thomson Reuters
0
5
10
15
20
25
30
35
Jan-05 Jul-05 Jan-06 Jul-06 Jan-07 Jul-07 Jan-08 Jul-08 Jan-09 Jul-09 Jan-10
May 25, 2005
RCII issues FY
guidance below
Analysts’ Estimates
October 24, 2005
RCII issues Q4 2005 and FY 2006
guidance above Analysts'
expectations, comments on same
store sales guidance, and
announces 3.9 million share
repurchase of common stock
July 24, 2006
RCII raises FY 2006 EPS Outlook
and issues FY 2006 revenue
outlook slightly above Analysts'
estimates and issues Q3 2006
outlook above analysts' estimates
August 8, 2006
RCII and Rent-Way, Inc. announce an
agreement to acquire Rent-Way for
$10.65 per share
July 30, 2007
RCII issues Q3 guidance
with EPS forecast below
Analysts' estimates and
lowers FY 2007 guidance
February 4, 2008
RCII issues Q1 2008
guidance and EPS is below
Analysts' estimates, also
issues FY 2008 Revenue
guidance in line with
Analysts' estimate
October 2008
Broad Market selloff
April 27, 2009
RCII lowers end of FY 2009
EPS guidance and issues Q2
2009 revenue guidance
below Analysts' estimates
December 3, 2009
RCII lowers Q4 2009 and
FY 2010 Revenue guidance
February 1, 2010
RCII announces 4Q Results,
issues Q1 2010 guidance that top Analysts’ estimates
IRC-TX 02/05/2010
Investment Research Challenge- Texas STUDENT RESEARCH 3
Business Description Rent-A-Center, Inc. (NASDAQ: RCII) is the largest rent-to-own operator in the industry offering high quality durable goods,
such as consumer electronics, appliances, computers, furniture and accessories under flexible rental purchase agreements. Incorporated in 1986 and headquartered in Plano, TX, Rent-A-Center employs approximately 18,000 people.
Rent-A-Center Operations
RCII’s core business is the offering of rental purchase and sales agreements on major consumer electronics (Sony, Phillips, LG,
Hitachi, Toshiba, Mitsubishi, Panasonic, Magnavox, and JVC), appliances (Whirlpool), computers (Toshiba, Sony, HP, Dell
and Compaq), and furniture and accessories (Ashley, England, Klaussner, Albany, Standard, Welton, Serta, and Corsicana).
These agreements allow the customer to obtain ownership of the merchandise at the end of a specified rental period, providing
consumers with a flexible alternative to incurring debt or spending a significant amount of cash. Other benefits of the rental
purchase transaction include convenient payment options, no long term obligations, right to terminate without penalty, no
requirement of credit history, free set-up and delivery, product maintenance, and flexible ownership options.
Rent-a-Center operates 3,007 company owned stores throughout the United States, as well as in Canada and Puerto Rico,
including 37 stores under the names “Get It Now” and “Home Choice” and 18 stores in Canada under the names “Rent-a-
Centre” and “Better Living.” These stores constitute 35% of the total rent-to-own market. ColorTyme, a wholly owned
subsidiary of Rent-a-Center, is a national franchisor of rent-to-own stores with 213 franchised stores in 33 states, as of third
quarter 2009. Rent-A-Center leases space for all of its stores, service centers and regional offices. The retail stores average
4,700 square feet in size and consist of 75% showroom space and 25% office and storage space.
Customers generally enter rental agreements with weekly, semi-monthly, or monthly payments, which renew automatically
upon receipt of each payment. The company retains title to the merchandise until the customer has completed the agreement, a
period of seven to 30 months, though on average a minimum of 18 months. Although a formal credit investigation is not
conducted, personal information and references are required. The vast majority of renters physically enter the store to make
payments, and 75% of customers are repeat business.
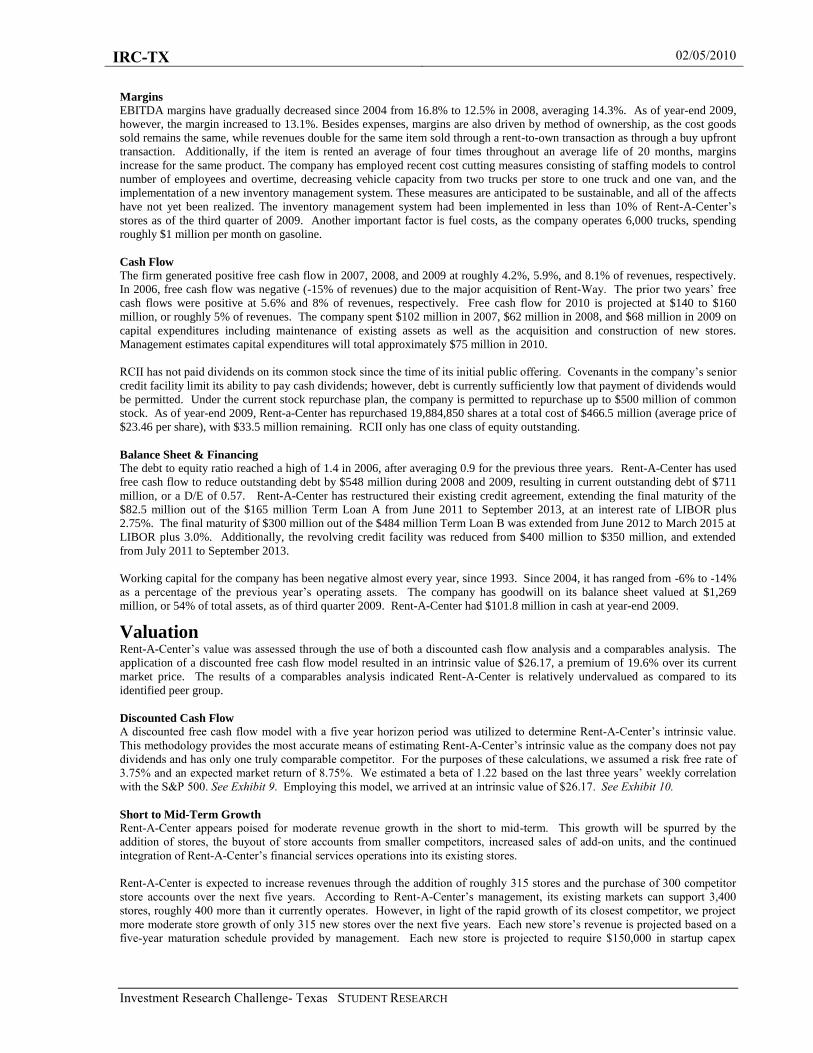
Approximately 25% of the initial rental purchase agreements are taken to the full term (See Figure 2). For the remaining 75%,
the customer returns the merchandise before acquiring
ownership. The average product of this type is rented for
four to five months at a time and is rented four times
before it leaves the system. On average, a product is in
the system for 20 months, generating revenue for 18
months. Each time the product is re-rented, the rental rate
is generally the same, but the term to acquire ownership
and the cash price are reduced. Over 90% of the
merchandise leaves through a rent-to-own transaction,
and 7% are bought upfront. The remaining 3% consists
of losses, including consumer losses (2.5%) and other
(0.5%) to include shrinkage, damage, obsolescence, etc.
Consumer losses have been consistent historically,
ranging from 2.3% to 2.8%, with the latest quarter data at
a low of 2.3%.
Rent-A-Center operates in two broad categories, store and franchise. The store segment, which accounted for 96.7% of
revenues in 2009, includes rentals and fees (85.3%), merchandise sales (9,5%), installment sales (1.9%), and other (2.1%). The
franchise segment consists of franchise merchandise sales (1.0%) and royalty income and fees (0.2%). Store merchandise is
divided into four broad categories, which accounted for revenues in third quarter 2009 as follows: consumer electronics – 36%;
furniture and accessories - 31%; appliances – 17%; and computers - 16%. Margins are generally the same for all product
categories.
In order to further penetrate its markets, Rent-A-Center has implemented an aggressive marketing strategy in recent years to
emphasize a “worry-free” form of ownership, including competitor price matching and a 100% satisfaction guarantee.
Marketing campaigns include celebrity spokespersons Magic Johnson and Troy Aikman.
Rent-A-Center believes its competitive strengths include its geographic distribution, experienced management, strong cash from
operations, effective collections, and integration experience. The company’s strategy includes capitalizing on its competitive
strengths as well as controlling expenses and improving inventory management. The company is in the process of
implementing an inventory management tool, which will allow for a more centralized purchasing approach. The system should
be in place by the end of first quarter 2010. Recent trends include a decrease in rentals per agreement; however store traffic
remains strong.
Figure 2: Rent-A-Center Merchandise Life Cycle
22.5%
67.5%
7.0%
2.5%
0.5%3.0%
How Merchandise Leaves a Rent-A-Center Store
Rent-to-Own Transaction
to Full Term
Rented Repeated Times
Bought Upfront
Consumer Losses
Other
(shrinkage, damage, obsole
scence)

IRC-TX 02/05/2010
Investment Research Challenge- Texas STUDENT RESEARCH 4
Acquisition History
Rent-A-Center has grown rapidly since inception largely from acquisitions. After incorporating in 1986, the company (under
the name Talley Leasing) purchased Vista Rent to Own, a chain of 22 stores, in 1989, then DEF, an 84-store chain, upgrading
merchandise and data systems along the way. After going public in 1995, they acquired Crow Leasing and Pro Rental,
expanding store count to 322. The following year they acquired ColorTyme, adding another 320 stores, most of which were
franchised. The company purchased Central Rents in 1998 (180 stores) and Thorn Americas (1,400 stores). In 2004 the
company acquired Rent Rite (90 stores in 11 states) and Rainbow Rentals (124 stores in 15 states). Rent-A-Center purchased
Rent-Way in 2006 for approximately $600 million (782 stores in 34 states). Overall acquisitions occurred in 240 separate
transactions, including ten transactions in excess of 50 stores. In order to enhance service levels and increase market
penetration, the company strategically opened or acquired stores in existing markets. This strategy resulted in an over
penetration in some markets; therefore, it enacted a store consolidation plan and closed or merged 282 stores in 2007-2008. At
this time, there are few remaining acquisition targets. Excluding Aaron’s, Inc., no current competitor operates more than 87
stores, a mere 1% of the rent-to-own market.
Other Sources of Revenue
In 2005, Rent-A-Center introduced financial service products under the trade names “RAC Financial Services” and “Cash
AdvantEdge” to include short term secured and unsecured loans, debit cards, check cashing, tax preparation, and money transfer
services. As of year-end 2009, the company offered financial services in 353 retail stores in 17 states. After a period of
sustained losses, the segment is projected to become profitable in 2010. The company plans to open 50 more financial services
outlets in 2010. Rent-A-Center has indicated an intent to eventually provide financial services in as many as 1,000 of its rent-
to-own stores within the next four to six years.
Purchasing and Distribution
The general product mix available to the stores is determined by the executive management team based on customer rental
patterns and new product tests. The individual store managers, however, are responsible for selecting the particular product mix
carried in their stores. They, along with the district managers, make purchase orders through an online ordering system. All
merchandise is shipped from the vendors directly to the stores, removing the need for distribution centers. This system allows
for low levels of inventory, tight control, and a low level of product obsolescence.
The largest suppliers of merchandise are Whirlpool, which accounted for 14.8% of merchandise purchased in 2008, and Ashley,
which accounted for 12.6%. No other supplier account for more than 10% of merchandise purchased in 2008, reducing
dependency on any sole supplier.
Growth Strategy
The company plans to grow its store count by an additional 25 to 35 stores in 2010. It also intends to acquire customer accounts
from smaller competitors. As the company has expressed that the existing market will become saturated at a store count of
3,400, (will have reached 90% of this as of YE 2010), additional avenues of revenue growth must be explored. As previously
mentioned, the Financial Services division represents an opportunity for growth; however, unless drastic measures are taken, it
will remain a small percentage of revenues as a whole in the near future (<3%). Other potential growth opportunities mentioned
by management come in the form additional distribution channels including agreements with other retailers, expansion of retail
installment sales, and international market expansion. The most significant of these involves the firm’s current expansion into
large scale retail establishments. Rent-A-Center is presently testing a strategy whereby it establishes a presence in certain large
scale retail stores to provide a purchasing option to customers who do not qualify for store credit. If successful, the firm could
expand rapidly through the acquisition of existing small scale providers such as Flexi Compras, a regional provider of these
services. This strategy could exponentially increase Rent-A-Center’s customer reach and alleviate some of the stigma
associated with the rent to own purchase model. However, unless these efforts are successfully implemented on a large scale,
the bulk of future growth will likely stem from the acquisition of store accounts from smaller competitors and new store
openings.
Insider and Institutional Holders
Mark Speese, the CEO and Chairman of the Board, holds 1.5% of Rent-A-Center’s outstanding shares. Top institutional holders
include Blackrock Institutional Trust Company, N,A., Hotchkis and Wiley Capital Management, L.L.C., The Vanguard Group,
Inc., State Street Global Advisors, and Robeco Investment Management, Inc., which collectively own 27% of RCII. Of Rent-
A-Center’s institutional investors, 29% are value investors, 22% are growth investors, 12% are index funds, and 4% are income
investors. The remaining 33% are a mixture of GARP investors, hedge funds, broker dealers, and specialty funds. See Exhibit
1.
Management
The executive management team has over 100 combined years with the company and extensive experience in the rent-to-own
industry. The CEO and Chairman of the Board, Mark Speese has been with the company since inception. The Executive Vice
President of Finance and CFO, Robert Davis, has been with the company since 1997. Mitchell Fadel, the current President and
COO, served these roles at ColorTyme beginning in 1992, prior to its acquisition by Rent-A-Center in 1996.

IRC-TX 02/05/2010
Investment Research Challenge- Texas STUDENT RESEARCH 5
Industry Overview and Competitive Positioning The rent-to-own concept originated in the 1960s to as a result of a growing need to obtain household products without a
significant cash outlay or the use of credit. In general, no interest is charged, no credit checks are performed, and the customers
can return the merchandise at any time without penalty. The industry consists of dealers who rent furniture, electronics, major
appliances, computers, wheels and tires, and other products with an option to buy. The rent-to-own industry in the United States
and Canada consisted of 8,600 stores as of 2009.
The rent-to-own industry’s expansion has been roughly in line with the rate of U.S. Gross Domestic Product since 1995 with the
exception of a slight contraction from 2004 to 2007. See Exhibit 2-Figure 1. This amounts to a compound annual growth rate of
1.6%. From 2008 to 2009, the rent-to-own industry grew 6.34% while GDP contracted 2.85% (inflation adjusted), the result of
a temporarily increased customer base caused by decreased credit availability. Moving forward, it is anticipated the industry’s
growth will again be in line with the economy as a whole.
Historically, the industry has served a highly specific customer. Every five years dating back to 1994, The Association of
Progressive Rental Organizations (“APRO”) published rent-to-own industry customer statistics regarding income, education,
age, residence, and ethnicity. See Exhibit 3. Based on the latest 2009 APRO data, the average rent-to-own household: has an
income of $15,000 to $49,999 (83% of customers), has a high school diploma and/or some college education (81%), contains
members between the ages of 25 and 54 (81%), owns their residence (69%), and is of Caucasian ethnicity (84%). There have
only been slight deviations from these demographic norms throughout each of the survey periods (1994, 1999, 2004, and 2009),
with the exception of household income. The industry’s average household income tends to rise when credit markets tighten
and vice versa when they relax. The number of rent-to-own customers served has fluctuated greatly since 1995, oscillating
between 2.8 and 4 million due to periodic expansion and contractions in the credit market. See Exhibit 4-Figure 1. The average
rent-to-own customer generates $1,600 in revenues per year. Revenue per customer has steadily declined since 2004. See
Exhibit 4-Figure 2.
Despite its reach, the rent-to-own industry’s four million
customers represent only a small portion of its potential
customer base. A 2009 study sponsored by the Federal
Depository Insurance Company (“FDIC”) concluded 9
million (7.7%) U.S. households are unbanked and 21
million (17.9%) are underbanked. The unbanked consumer
does not have a checking or savings account. Underbanked
consumers have a checking or savings account but rely on
alternative financial services. Alternative financial services
include non-bank check cashing, non-bank money orders,
payday lending, pawn shops, rent-to-own, and refund
anticipation loans. Refer to Figure 3 to the right. The
FDIC study determined only 11.9% of the unbanked and
13% of the underbanked households have undertaken a
rent-to-own transaction. See Exhibits 5 and 6. Therefore,
it can be inferred the rent-to-own industry serves
approximately one in seven of its potential customers. This
leaves substantial room for growth if the industry can determine an appropriate means to reach these customers.
Competitive Positioning
Rent-A-Center has only one major direct competitor, Aaron’s, Inc. (“Aaron’s”). Aaron’s is the second largest player in the rent-
to-own industry, with an approximate 18.3% market share (1,577 stores) located throughout 47 states and Canada, including
504 franchised stores. Unlike Rent-A-Center, Aaron’s has an active franchise program with approximately half of its projected
2010 store growth expected to be from franchised stores. In addition to the Sales & Lease Ownership division, Aaron’s
manufactures furniture in its MacTavish Furniture Industries segment, which it then sells in its stores. It manufactures
upholstered living room furniture, bedding including mattresses and box springs, and office furniture.
Aaron’s attempts to distinguish itself from Rent-A-Center and “traditional” rent-to-own businesses. Its sales and lease
ownership model encourages customers to obtain ownership of the merchandise. Over 45% of customers obtain ownership
versus the 25% experienced by the industry as a whole. Aaron’s also requires a minimum rental period on some products,
whereas Rent-A-Center customers can return the merchandise at any time. Additionally, the typical Aaron’s plan offers semi-
monthly or monthly payments instead of weekly payments. It also receives more payments through check, credit card, or debit
card (approximately 51% of total dollar volume). These differences are indicative of Aaron’s targeting a slightly higher income
household. The average store is also twice as large as the average Rent-A-Center store at 9,000 square feet.
At this time, Rent-A-Center retains several competitive advantages over Aaron’s, Inc. Rent-A-Center has a significantly larger
geographic footprint, a larger breadth of services, and more direct control over its stores. However, these advantages may erode
Underbanked18%
Unbanked8%
Banked, but underbanked status
unknown*4%
Banked, but not underbanked
70%
Banking Status of U.S. Households
Notes: Percentages based on 118.6 million U.S. households. Percentages do not always sum to 100 because of rounding of household weights to represent population totals.*These households are banked, but there is not enough information to determine if they are underbanked
Figure 3: Banking Status of U.S Households

IRC-TX 02/05/2010
Investment Research Challenge- Texas STUDENT RESEARCH 6
if Aaron’s continues on its current path. Aaron’s recently increased its focus on its core business by disposing of its corporate
furnishings division. Its more nimble structure will allow it to focus on markets already proven successful by Rent-A-Center
(See Exhibit 7).
Porter’s Five Forces – Rent-to-Own Industry Rent-A-Center faces relatively low supplier power, buyer power, and threat of substitutes, while the threat of new entrants is
high. Internal rivalry within the industry is considered rising. The impacts of these forces will ultimately increase pricing
pressures resulting in an industry-wide decrease in margins.
Power of Suppliers – Low Figure 4: Porters Five Forces Model There are several suppliers for electronics, appliances, and
furniture in this industry. These suppliers have little
product differentiation with relatively low margins.
Though Whirlpool and Ashley are Rent-A-Center’s largest
suppliers (14.8% and 12.6% respectively), the
configuration of Rent-A-Center’s distribution system
allows it to change suppliers without major impact to
product availability or distribution.
Threat of Substitutes - Low Consumers in this industry have other options to fund their
product purchases such as credit cards, in store credit, loans and cash. However, the threat of substitution by these products is
low due to the limited availability of these options to the underbanked consumer traditionally pursued by Rent-A-Center.
Decreased credit availability to the consumer and relatively high unemployment rates in the short to medium term make the
rent-to-own transaction an attractive option for its customers. See Exhibit 8.
Power of Buyers - Low
Customers in the rent-to-own industry are individual, decentralized consumers who are underbanked. This consumer has no
bargaining power and behaves as a price taker due to the limited financing options available to them.
Threat of New Entrants - High Industry trends over recent years show Rent-A-Center’s local, regional, and national rent-to-own store markets have been
penetrated by new and established competitors. See Exhibit 7- Figure 5. Over the years, the industry has seen cyclical periods
of store growth and then store consolidation. Current barriers to entry such as capital requirements, switching costs, demand-
side and supply-side economies of scale, distribution, and incumbency barriers are not strong as they have not proven to be
sufficient deterrents. In addition, though not highly probable, the threat of entry by a major competitor with a larger distribution
system and network of low end consumers such as Costco or Wal-Mart could become viable if the rent-to-own industry
becomes attractive enough. Best Buy has already introduced the rent-to-own purchase option on a small scale to its customers
through its relationship with Flexi Compras (currently 18 stores in Texas). Similar to the method being tested by Rent-A-
Center, a representative from the company is placed in a booth in the Best Buy store to provide an alternative method for
purchasing merchandise if the customer cannot provide payment through traditional means. It remains to be seen to whether
Best Buy, or any other big box retailer, will expand such services or begin to provide these services on their own.
Industry Rivalry - Rising Rent-A-Centers margins have decreased over time due to pricing competition from it largest competitor, Aaron’s. Rent-A-
Center’s margins decreased from 19.6% to 13.1% between 2002 and 2009 while Aaron’s increased slightly from 10.1% to
12.4% over the same period. See Exhibit 7- Figure 1. New entrants, as well as Aaron’s plan to grow store count by 8%
annually, will likely intensify internal rivalry and threaten Rent-A-Center’s top line.
Financial Analysis
Revenues
From 2004 through third quarter 2009, revenues have grown at an average rate of 3.9%. A spike in revenue growth in 2007 was
caused by the acquisition of Rent Way, which added 782 stores. Revenues subsequently decreased in 2008 as a result of the
company’s store consolidation plan, which closed 315 stores, partially offset by a 2.3% increase in same store sales. In 2004
and 2005, same store sales growth were negative 3.6% and 2.3%, respectively; however the growth rate increased each year
over the next three years, averaging 2.1%. The 2009 revenues of approximately $2,752 million represent a decline of 4.6%, and
2010 forecasts are essentially flat at 2009 levels. Typical revenue drivers include number of stores, store traffic, units per rental
agreement, as well as method of ownership (buy upfront, rent-to-own full term, or rent-to-own multiple term.)
Bargaining Power of
Suppliers
LOW
Bargaining Power of
Customers
LOW
Threat of Entrants
HIGH
Industry Rivalry
RISING
Threat of Substitutes
LOW
IRC-TX 02/05/2010
Investment Research Challenge- Texas STUDENT RESEARCH 7
Margins
EBITDA margins have gradually decreased since 2004 from 16.8% to 12.5% in 2008, averaging 14.3%. As of year-end 2009,
however, the margin increased to 13.1%. Besides expenses, margins are also driven by method of ownership, as the cost goods
sold remains the same, while revenues double for the same item sold through a rent-to-own transaction as through a buy upfront
transaction. Additionally, if the item is rented an average of four times throughout an average life of 20 months, margins
increase for the same product. The company has employed recent cost cutting measures consisting of staffing models to control
number of employees and overtime, decreasing vehicle capacity from two trucks per store to one truck and one van, and the
implementation of a new inventory management system. These measures are anticipated to be sustainable, and all of the affects
have not yet been realized. The inventory management system had been implemented in less than 10% of Rent-A-Center’s
stores as of the third quarter of 2009. Another important factor is fuel costs, as the company operates 6,000 trucks, spending
roughly $1 million per month on gasoline.
Cash Flow
The firm generated positive free cash flow in 2007, 2008, and 2009 at roughly 4.2%, 5.9%, and 8.1% of revenues, respectively.
In 2006, free cash flow was negative (-15% of revenues) due to the major acquisition of Rent-Way. The prior two years’ free
cash flows were positive at 5.6% and 8% of revenues, respectively. Free cash flow for 2010 is projected at $140 to $160
million, or roughly 5% of revenues. The company spent $102 million in 2007, $62 million in 2008, and $68 million in 2009 on
capital expenditures including maintenance of existing assets as well as the acquisition and construction of new stores.
Management estimates capital expenditures will total approximately $75 million in 2010.
RCII has not paid dividends on its common stock since the time of its initial public offering. Covenants in the company’s senior
credit facility limit its ability to pay cash dividends; however, debt is currently sufficiently low that payment of dividends would
be permitted. Under the current stock repurchase plan, the company is permitted to repurchase up to $500 million of common
stock. As of year-end 2009, Rent-a-Center has repurchased 19,884,850 shares at a total cost of $466.5 million (average price of
$23.46 per share), with $33.5 million remaining. RCII only has one class of equity outstanding.
Balance Sheet & Financing
The debt to equity ratio reached a high of 1.4 in 2006, after averaging 0.9 for the previous three years. Rent-A-Center has used
free cash flow to reduce outstanding debt by $548 million during 2008 and 2009, resulting in current outstanding debt of $711
million, or a D/E of 0.57. Rent-A-Center has restructured their existing credit agreement, extending the final maturity of the
$82.5 million out of the $165 million Term Loan A from June 2011 to September 2013, at an interest rate of LIBOR plus
2.75%. The final maturity of $300 million out of the $484 million Term Loan B was extended from June 2012 to March 2015 at
LIBOR plus 3.0%. Additionally, the revolving credit facility was reduced from $400 million to $350 million, and extended
from July 2011 to September 2013.
Working capital for the company has been negative almost every year, since 1993. Since 2004, it has ranged from -6% to -14%
as a percentage of the previous year’s operating assets. The company has goodwill on its balance sheet valued at $1,269
million, or 54% of total assets, as of third quarter 2009. Rent-A-Center had $101.8 million in cash at year-end 2009.
Valuation Rent-A-Center’s value was assessed through the use of both a discounted cash flow analysis and a comparables analysis. The
application of a discounted free cash flow model resulted in an intrinsic value of $26.17, a premium of 19.6% over its current
market price. The results of a comparables analysis indicated Rent-A-Center is relatively undervalued as compared to its
identified peer group.
Discounted Cash Flow
A discounted free cash flow model with a five year horizon period was utilized to determine Rent-A-Center’s intrinsic value.
This methodology provides the most accurate means of estimating Rent-A-Center’s intrinsic value as the company does not pay
dividends and has only one truly comparable competitor. For the purposes of these calculations, we assumed a risk free rate of
3.75% and an expected market return of 8.75%. We estimated a beta of 1.22 based on the last three years’ weekly correlation
with the S&P 500. See Exhibit 9. Employing this model, we arrived at an intrinsic value of $26.17. See Exhibit 10.
Short to Mid-Term Growth
Rent-A-Center appears poised for moderate revenue growth in the short to mid-term. This growth will be spurred by the
addition of stores, the buyout of store accounts from smaller competitors, increased sales of add-on units, and the continued
integration of Rent-A-Center’s financial services operations into its existing stores.
Rent-A-Center is expected to increase revenues through the addition of roughly 315 stores and the purchase of 300 competitor
store accounts over the next five years. According to Rent-A-Center’s management, its existing markets can support 3,400
stores, roughly 400 more than it currently operates. However, in light of the rapid growth of its closest competitor, we project
more moderate store growth of only 315 new stores over the next five years. Each new store’s revenue is projected based on a
five-year maturation schedule provided by management. Each new store is projected to require $150,000 in startup capex

IRC-TX 02/05/2010
Investment Research Challenge- Texas STUDENT RESEARCH 8
(excluding inventory investment), with an additional $25,000 per year in sustaining capex. These projections were derived from
management guidance and historical capital expenditure data. It is anticipated that Rent-A-Center will place particular emphasis
on store development beginning in 2012 as market conditions improve and credit restrictions loosen, resulting in significantly
higher capital expenditures. We also project a schedule of account buyouts over the next five years. Revenues from account
acquisitions are estimated at 50% of the average rent-to-own store revenues due to high attrition of customer accounts, as
indicated by management. See Exhibit 10. Rent-A-Center’s store growth will allow it to further take advantage of the industry’s
temporarily increased customer base caused by decreased credit availability.
Rent-A-Center is also expected to improve revenues through increased sales of add-on units. Rent-A-Center’s revenues
decreased 4.6% in 2009. This decrease is believed to be the result of a 3.5% reduction in same store sales largely attributed to a
decrease in units per rental agreement as well as a reduction in stores related to Rent-A-Center’s 2007 store restructuring. The
reduction in units per agreement is likely the result of recent negative economic conditions and the effect of these conditions on
consumer spending. Rent-A-Center’s management has indicated its intent to improve the number of units per agreement
through a heightened focus on product offerings and advertising specifically targeting the sale of add-on units. These efforts
will likely result in improved revenues in the short to mid-term as same store sales return to our projected mature growth rate of
1.5%. However, this strategy is not expected to provide a source of significant long term growth.
It is further anticipated Rent-A-Center will improve revenues through the continued addition of financial services kiosks to its
existing stores. Rent-A-Center currently operates financial services kiosks at 353 of its 3,007 stores at a start up cost of $50,000
per store and ongoing costs of $120,000 to $144,000 per store per year. Each kiosk generates revenues of approximately
$163,000 per year. Rent-A-Center plans to add 50 additional kiosks in 2010 and hopes to improve its return per kiosk to around
$240,000 per year as its operational efficiency improves. Rent-A-Center intends to continue to add kiosks at a rate of about 100
stores per year for the next four to six years, providing a moderate contribution to revenue growth. Given management’s mature
kiosk revenue estimates, it does not appear likely the firm will improve its return per kiosk beyond $220,000 per year. This
analysis assumes revenue growth for the kiosks on a five-year schedule, similar to that of the rent-to-own stores. See Exhibit 11.
There is no indication Rent-A-Center’s financial services operations will become the focal points of its stores, limiting this
segment’s potential for future growth. See Exhibits 13 and 14 for combined rent-to-own and financial segment projections and
capital expenditure calculations.
Long Term Growth
Rent-A-Center’s long term growth should be less extensive, limited by a reduction in future store growth, the maturation of its
existing stores, increased competition within the industry, and management’s lack of a clearly defined long term growth
strategy. These limitations will likely result in long term growth more in line with that of the economy as a whole.
It is not anticipated Rent-A-Center can continue its historical rate of acquisitions and/or store growth in the long term. Rent-A-
Center and its closest competitor, Aaron’s, Inc., account for almost 60% of existing rent-to-own stores. The remainder of the
market consists of small regional players and independents, leaving little potential for a major acquisition. Rent-A-Center has
indicated its intent to acquire store accounts from smaller competitors, but even this strategy will be restricted somewhat by the
limited room for expansion in Rent-A-Center’s existing markets. Barring entry into international markets, a move for which no
clear plan has yet been articulated, Rent-A-Center’s store growth will most likely be stymied within the next five to seven years.
Despite the addition of acquired accounts, it is unlikely existing stores can contribute sufficient revenues to maintain historical
growth rates. According to Rent-A-Center’s management, the profitability of its existing stores tends to grow at a slower rate
after the first five years with mature growth estimated at 1% to 3% per year. As previously indicated, the contributions of Rent-
A-Center’s financial services operations should be moderate at best. As a result, Rent-A-Center’s same store revenue growth
will likely decrease as its rate of store growth begins to decline and its existing stores mature, relegating long term growth to a
rate more in line with that of the economy as a whole.
Rent-A-Center’s long term revenue growth will be further hindered by management’s lack of any clearly defined strategy
beyond the expansion of its financial services operations. The most likely source of potential future growth would involve the
firm’s expansion into alternative distribution channels. As previously discussed, Rent-A-Center is presently testing a strategy
whereby it establishes a presence in certain large scale retail stores to provide a purchasing option to customers who do not
qualify for store credit. This strategy could exponentially increase Rent-A-Center’s customer reach and alleviate some of the
stigma associated with the rent-to-own purchase model. However, due to the limited implementation of this strategy to date,
this potential revenue source was not included in this analysis.
Margins
Over the next five years, Rent-A-Center’s overall growth will likely be curbed by its increasingly competitive environment. We
anticipate more intense rivalry within the industry as Aaron’s aggressive growth continues. Both Rent-A-Center and Aaron’s
currently provide low price guarantees. As Aaron’s store volume increases and its customer reach grows, these guarantees will
likely begin to more negatively impact Rent-A-Center’s margins. Furthermore, Aaron’s recently increased focus on its core
business model following the disposal of its corporate furnishings division should place each additional store in more direct

IRC-TX 02/05/2010
Investment Research Challenge- Texas STUDENT RESEARCH 9
competition with Rent-A-Center. The combination of Aaron’s growth and more directly targeted stores should create
downward pricing pressure, decreasing both Rent-A-Center’s margins and those of the industry as a whole.
These downward pricing pressures should be partially offset by the positive margin impact of Rent-A-Center’s increased sale of
add-ons and more efficient integration of its financial services operations, buttressed by improvements in the overall economy.
Margins should be further bolstered by cost savings related to the implementation of a new inventory management system,
expected to be in place in all Rent-A-Center stores by the end of the first quarter 2010. This system was implemented in 64% of
the stores during the fourth quarter of 2009. Ultimately, increased competition is anticipated to decrease margins to about
12.5% of revenues.
Conclusion
Despite a reduction in growth and increased competition, Rent-A-Center is expected to continue to produce strong free cash
flow. The firm’s dominant position in the industry will allow it to maintain sufficient revenues and margins to provide positive
returns to investors. Furthermore, the company’s expansion into alternative distribution channels could dramatically improve
future revenues, providing the exponential future growth management has sought from financial services segment.
Sensitivity
The discounted cash flow analysis is particularly sensitive to changes in Rent-A-Center’s beta, future revenue growth, and
EBITDA margins. See Figure 5 to the right and Exhibit 15. The beta was derived from the last three years’ weekly correlation
with the S&P 500 in order to provide a tight confidence
interval while minimizing trading bias. In light of Rent-
A-Center’s current market price, the market appears
overly pessimistic regarding revenue growth and
EBITDA margins. This is likely due to market
uncertainty regarding the economy as a whole, Rent-A-
Center’s reduced margins in recent years, and questions
regarding the firm’s ability to successfully integrate its
financial services operations. It would required a 1.5%
reduction in the revenue growth rate or a 0.8% reduction
in the EBITDA margin each year to reduce our intrinsic
value to the current market price. As Rent-A-Center's
revenues grow and its margins remain at an acceptable
level, as further detailed above, the market price should
increase towards the projected intrinsic value.
Comparables Analysis
A comparables analysis provided further support Rent-A-Center is undervalued at this time. The firm was compared to its
identified peer group index including Aaron’s, Inc., Family Dollar Stores, Inc., 99¢ Only Stores, Dollar Tree Stores, Inc., Dollar
Financial Corp., Advance America, Cash Advance Centers, Inc., EZCORP, Inc., and Cash America International, Inc. Rent-A-
Center appeared relatively undervalued compared to its peers, resulting in an estimated intrinsic value for the firm of $27.81,
27%, higher than its current market price. See Exhibit 16.
DCF Valuation with Terminal Value Multiple In addition to pure DCF and comparable valuations, a value was derived through a combination of the first five years cash flows
and a terminal value determined by a P/E multiple applied to the final 12 months’ earnings. Two multiples were utilized
including the trailing 12 month P/E for Rent-A-Center and the P/E for the company’s identified peer group. This analysis
resulted in values of $23.13 and $ 31.80, respectively; 6% and 45% above its current price. See Exhibit 17.
Investment Risks
Proposed legislation could negatively impact Rent-A-Center’s margins. On December 11, 2009, the United States House of
Representatives passed the Wall Street Reform and Consumer Protection Act of 2009 which, if enacted, would establish a new
federal agency responsible for the regulation of consumer financial products and services. In its current form, this legislation
does not appear applicable to the rent-to-own industry. However, if modified or interpreted to include this industry, the
legislation could subject the rent-to-own transaction to consumer lending restrictions. Similar restrictions are in place in three
states in which Rent-A-Center operates. In these states, Rent-A-Center offers merchandise through installment sales, rather than
through its traditional business model. Any extension of these restrictions to the remaining 47 states could limit assessable
interest rates and require similar changes to the company’s business model. Any limitation on interest rates applicable to the
rent-to-own transaction could severely impact Rent-A-Center’s margins.
Rent-A-Center’s failure to successfully integrate its financial services operations could limit its growth potential. Rent-
A-Center currently operates financial services kiosks at 353 stores at a cost of $120,000 to $144,000 per kiosk per year. Each
Figure 5: Sensitivity Analysis
$16
$20
$24
$28
$32
$36
$40
$44
Revenue
Growth
EBITDA
Margin
Tax Rate Capex Working
Capital
Debt Beta Terminal
Growth
Rate
Sensitivity Variable
IV/S
ha
re

IRC-TX 02/05/2010
Investment Research Challenge- Texas STUDENT RESEARCH 10
kiosk generates revenues of approximately $163,000 per year. Rent-A-Center plans to add 50 additional kiosks in 2010. At its
current rate of return, these additional kiosks would only generate $950,000 in additional profits. Rent-A-Center hopes to
increase its per kiosk revenues to approximately $240,000 per year, or $180,000 in gross profit, but it has yet to demonstrate its
ability to do so. Rent-A-Center must greatly improve its per kiosk return to warrant continued long term investment in this line
of business. A failure to do so would likely result in the discontinuation of Rent-A-Center’s financial services operations,
reducing the company’s overall potential for future growth.
Rent-A-Center’s failure to address market saturation could hamper future growth. Rent-A-Center’s historical growth has
been largely supported by increasing store numbers. At this time, Rent-A-Center estimates its expansion in its existing markets
will be capped at about 3,400 stores, a mere 400 more than it currently operates. This estimate may prove overly optimistic if
Rent-A-Center’s closest competitor, Aaron’s, continues its current rate of store growth, projected at 5% to 9% in 2010. To
achieve continued long term growth, Rent-A-Center must either expand its existing markets or its lines of business within those
markets. At this time, Rent-A-Center has not identified a strategy for international expansion, and has only just begun efforts in
to enter additional distribution channels. A failure to do so before existing stores mature (existing stores experience decreased
growth approximately 5 years after opening), could significantly impact long term revenues.
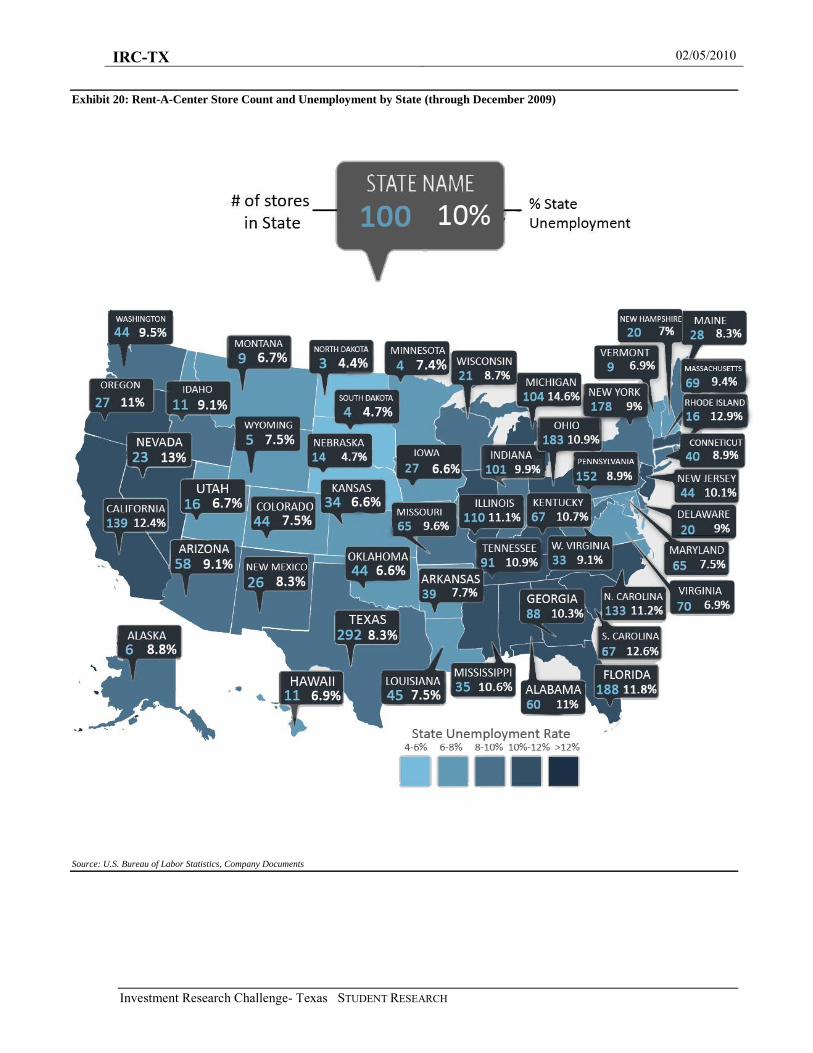
High unemployment rates could limit Rent-A-Center’s customer pool. Rent-A-Center customers must provide proof of
employment to rent or procure financial services from the company. This could prove increasingly difficult as more than 70%
of rent-to-own customers fall into a demographic group that has been disproportionately impacted by the recession. [See
customer profile]. Though it has not negatively impacted the firm to date (See Exhibit 18), continued high unemployment,
currently as high as 15% in certain demographic segments, could substantially reduce Rent-A-Center’s available customer pool.
Currently, states with greater than 9% unemployment account for approximately 56% of Rent-A-Center’s revenues. See Exhibit
20.
Declining consumer electronics prices could decrease the need for the rent-to-own business model. Consumer electronics
currently constitute 36% of Rent-A-Center’s rental revenue. In recent years, consumer electronics prices have fallen due to both
improved technologies and increased competition. In particular, the recent demise of Circuit City has encouraged efforts of
both specialty and more generalized retailers to seek a greater share of the consumer electronics market, sparking price
competition and more aggressive selling techniques. Should these trends continue, Rent-A-Center’s traditional customer base
may no longer require payment plans to obtain the electronic goods they desire.
Entry of big box retailers could substantially impact margins. The rent-to-own industry is currently dominated by two
relatively small competitors, Rent-A-Center and Aaron’s, Inc. As a result, there has been limited price competition, allowing
for higher profit margins. Entry by a substantially larger retailer with greater consistent foot traffic, significantly deeper
pockets, and stronger leverage with suppliers could ignite a protracted price war that could severely impact margins.

IRC-TX 02/05/2010
Investment Research Challenge- Texas STUDENT RESEARCH 11
Exhibit 1: Institutional and Insider Ownership Breakdown
Figure 1: The percent of institutional investors by investment style.
Source: Yahoo Finance, Rent-A-Center.com
Holder Shares % Out Reported
Barclays Global Investors UK Holdings Ltd 6,008,640 9.09 30-Sep-09
HOTCHKIS & WILEY CAPITAL MANAGEMENT, LLC 3,686,085 5.58 30-Sep-09
VANGUARD GROUP, INC. (THE) 2,987,254 4.52 30-Sep-09
STATE STREET CORPORATION 2,829,013 4.28 30-Sep-09
Robeco Investment Management, Inc. 2,633,295 3.98 30-Sep-09
Bank of New York Mellon Corporation 2,125,894 3.22 30-Sep-09
River Road Asset Management, LLC 1,993,354 3.02 31-Dec-09
Brandywine Global Investment Management, LLC 1,682,123 2.54 30-Sep-09
NORTHERN TRUST CORPORATION 1,680,998 2.54 30-Sep-09
ARTISAN PARTNERS LIMITED PARTNERSHIP 1,594,900 2.41 30-Sep-09
Holder Shares % Out Reported
FIDELITY ADVISOR SMALL CAP FUND 1,581,400 2.39 31-Aug-09
HOTCHKIS AND WILEY MID-CAP VALUE FUND 1,434,800 2.17 30-Sep-09
ARTISAN SMALL CAP VALUE FUND 955,785 1.45 30-Sep-09
American Beacon Small Cap Value Fd 926,950 1.4 30-Nov-09
ISHARES RUSSELL 2000 INDEX FD 849,905 1.29 30-Nov-09
VANGUARD SMALL-CAP INDEX FUND 805,353 1.22 30-Jun-09
JNL Variable LLC-JNL/Mellon Cap JNL 5 Fd 623,000 0.94 30-Sep-09
VANGUARD TOTAL STOCK MARKET INDEX FUND 612,075 0.93 30-Jun-09
MIDCAP SPDR TRUST SERIES I 607,072 0.92 30-Sep-09
VANGUARD SMALL CAP VALUE INDEX FUND 522,916 0.79 30-Jun-09
TOP INSTITUTIONAL HOLDERS
TOP MUTUAL FUND HOLDERS
29%
12%
33%
22%
4%
Investment Style of Institutional Holders
Value Index Other Growth Income

IRC-TX 02/05/2010
Investment Research Challenge- Texas STUDENT RESEARCH 12
Exhibit 2: Macro-Industry Analysis
Figure 1: Rent-To-Own industry growth versus US GDP since 1996. Figure 2: Rent-To-Own industry revenue growth since 1995.
Source: The Association of Progressive Rental Organizations, the United States Bureau of Economic Analysis, Student Calculations
-12%
-10%
-8%
-6%
-4%
-2%
0%
2%
4%
6%
8%
% C
han
ge
in R
even
ues
/ G
DP
RTO Industry vs. U.S. GDP
RTO Industry
U.S. GDP
0
1
2
3
4
5
6
7
8
Rev
enu
e (B
illi
on
s)
RTO Industry Revenues
Inflation Adjusted 2005
(billions) % change
Inflation Adjusted 2005
(trillions) % change
1995 $5.00 $9.09
1996 $5.10 2.00% $9.43 3.74%
1997 $5.35 4.90% $9.85 4.46%
1998 $5.63 5.23% $10.28 4.36%
1999 $5.86 4.09% $10.78 4.83%
2000 $6.01 2.56% $11.23 4.14%
2001 $6.18 2.83% $11.35 1.08%
2002 $6.51 5.34% $11.55 1.81%
2003 $6.58 1.08% $11.84 2.49%
2004 $6.82 3.65% $12.26 3.57%
2005 $6.70 -1.76% $12.64 3.05%
2006 $6.59 -1.64% $12.98 2.67%
2007 $5.93 -10.02% $13.25 2.14%
2008 $5.99 1.01% $13.31 0.44%
2009 $6.37 6.34% $12.93 -2.85%

IRC-TX 02/05/2010
Investment Research Challenge- Texas STUDENT RESEARCH 13
Exhibit 3: Rent-To-Own Industry Data
Figure 1: Rent-To-Own industry by household income. Figure 2: Rent-To-Own industry by education.
Figure 3: Rent-To-Own industry by education. Figure 4: Rent-To-Own industry by ethnicity.
Source: The Association of Progressive Rental Organizations, Student Calculations
Exhibit 4: Customer Base
Figure 1: Rent-To-Own customers served since 1995. Figure 2: Rent-To-Own industry revenue per customer since 1995.
Source: The Association of Progressive Rental Organizations, Student Calculations
0%
5%
10%
15%
20%
25%
30%
35%
40%
Under $15,000 $15 - $23,999 $24 - $35,999 $36 - $49,999 $50 - $74,999
Income
2009
2004
1999
1994
0%
10%
20%
30%
40%
50%
60%
70%
High School Graduate
Some College College Graduate
Less than High School
Graduate School
Education
2009
2004
1999
1994
0%
5%
10%
15%
20%
25%
30%
35%
40%
Under 25 25-34 35-44 45-54 55-64 65 and over
Age
2009
2004
1999
1994
0%
10%
20%
30%
40%
50%
60%
70%
80%
90%
Caucasion Black Hispanic Other
Ethnicity
2009
2004
1999
1994
0
1
1
2
2
3
3
4
4
5
Num
ber
of
Cust
om
ers
Ser
ved
(m
illions)
Customers Served
0
500
1,000
1,500
2,000
2,500
3,000
Rev
enue
per
Cust
om
er
Industry Revenue Per Customer

IRC-TX 02/05/2010
Investment Research Challenge- Texas STUDENT RESEARCH 14
Exhibit 5: Unbanked Consumer Data
Figure 1: Percent of unbanked households by income. Figure 2: Percent of unbanked households by age.
Figure 3: Percent of unbanked households by education level. Figure 4: Percent of unbanked households by homeownership status.
Figure 5: AFS products used by unbanked households.
Source: FDIC National Survey of Unbanked and Underbanked Households, Student Calculations
0%
5%
10%
15%
20%
25%
30%
No High School Degree High School Degree Some College College Degree
Perc
en
tage o
f H
ou
seh
old
s
Unbanked Households by Educational Level
0%
10%
20%
30%
40%
50%
60%
70%
80%
90%
Homeowner Non-homeowner
Perc
en
tage o
f H
ou
seh
old
s
Unbanked Households by Homeownership Status
0.0% 20.0% 40.0% 60.0% 80.0% 100.0%
Any AFS Product
Non-Bank Money Order
Non-Bank Check Cashing
Payday Lending
Pawn Shops
RALs
RTO
Used Never Used Use Unknown
Specific AFS Products Used by Unbanked Households
Note: Percentages do not always sum to 100 because of the rounding of household weights to
represent population totals
0.0%
5.0%
10.0%
15.0%
20.0%
25.0%
30.0%
< $15K $15k-$30K $30k-$50K $50k-$75K At least $75K
Unbanked Households by Income
0%
2%
4%
6%
8%
10%
12%
14%
16%
18%
Age 15-24 Age 25-34 Age 35-44 Age 45-54 Age 55-64 Age 65+
Perc
en
tage o
f H
ou
seh
old
s
Unbanked Households by Age
IRC-TX 02/05/2010
Investment Research Challenge- Texas STUDENT RESEARCH 15
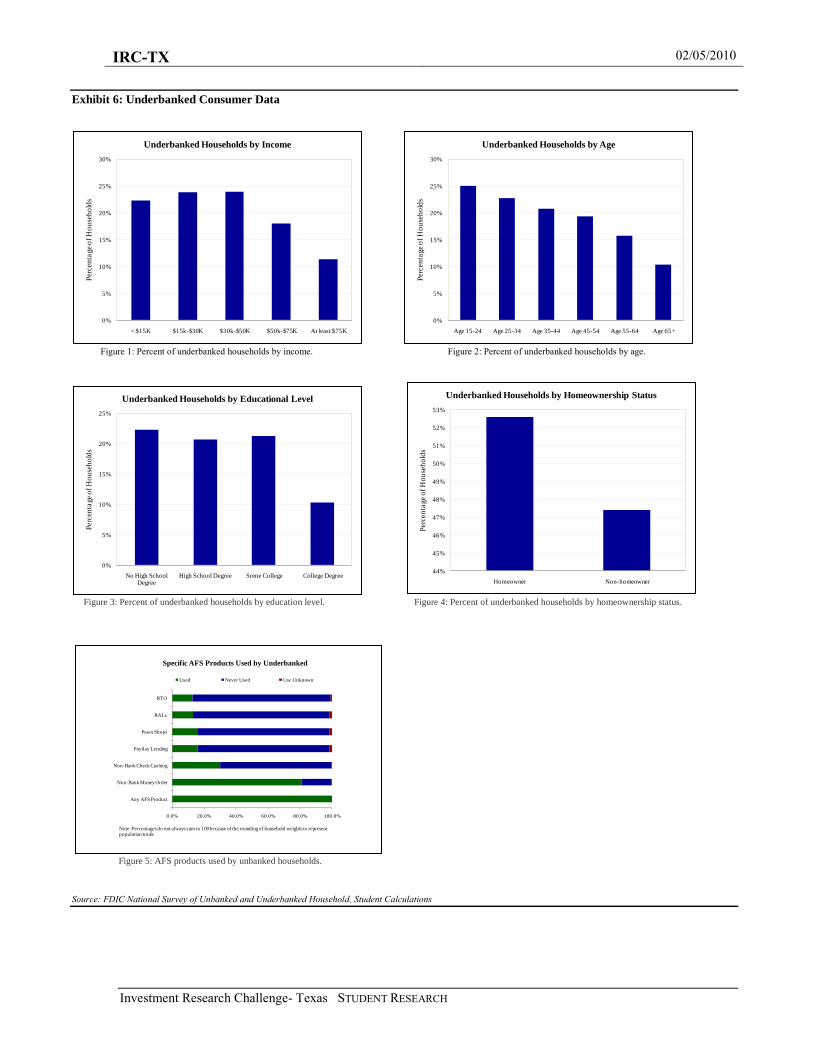
Exhibit 6: Underbanked Consumer Data
Figure 1: Percent of underbanked households by income. Figure 2: Percent of underbanked households by age.
Figure 3: Percent of underbanked households by education level. Figure 4: Percent of underbanked households by homeownership status.
Figure 5: AFS products used by unbanked households.
Source: FDIC National Survey of Unbanked and Underbanked Household, Student Calculations
0%
5%
10%
15%
20%
25%
30%
< $15K $15k-$30K $30k-$50K $50k-$75K At least $75K
Perc
en
tage o
f H
ou
seh
old
s
Underbanked Households by Income
0%
5%
10%
15%
20%
25%
30%
Age 15-24 Age 25-34 Age 35-44 Age 45-54 Age 55-64 Age 65+
Perc
en
tage o
f H
ou
seh
old
s
Underbanked Households by Age
0%
5%
10%
15%
20%
25%
No High School Degree
High School Degree Some College College Degree
Perc
en
tage o
f H
ou
seh
old
s
Underbanked Households by Educational Level
44%
45%
46%
47%
48%
49%
50%
51%
52%
53%
Homeowner Non-homeowner
Perc
en
tage o
f H
ou
seh
old
s
Underbanked Households by Homeownership Status
0.0% 20.0% 40.0% 60.0% 80.0% 100.0%
Any AFS Product
Non-Bank Money Order
Non-Bank Check Cashing
Payday Lending
Pawn Shops
RALs
RTO
Used Never Used Use Unknown
Specific AFS Products Used by Underbanked
Note: Percentages do not always sum to 100 because of the rounding of household weights to represent population totals

IRC-TX 02/05/2010
Investment Research Challenge- Texas STUDENT RESEARCH 16
Exhibit 7: Rent-A-Center vs. Aarons Comparison Analysis $ in millions
Source: CapitalIQ, Company Documents, The Association of Progressive Rental Organizations
PROFITABILITY COMPARISON - RCII vs. AAN
2009 2008 2007 2006 2005 2004 2003 2002 2001 2000 1999 1998 1997 1996
Rent-A-Center EBITDA Margin % 12.7% 12.5% 13.5% 14.6% 14.0% 16.8% 19.1% 19.6% 16.8% 19.1% 17.5% 16.7% 17.2% 16.6%
Return on Assets % 7.2% 6.7% 7.1% 7.9% 8.2% 10.9% 13.4% 13.5% 9.5% 10.3% 7.9% 7.5% 15.0% 12.1%
Return on Capital % 8.9% 8.1% 8.5% 9.7% 10.5% 13.8% 16.2% 15.9% 10.8% 11.5% 9.3% 9.1% 17.7% 13.8%
Return on Equity % 14.2% 13.8% 8.1% 11.7% 16.8% 19.6% 22.2% 22.4% 10.3% 19.3% 13.3% 8.7% 18.6% 16.2%
Aarons Inc. EBITDA Margin % 12.4% 11.4% 11.2% 11.8% 11.6% 11.5% 10.9% 10.1% 7.6% 12.3% 12.8% 12.6% 13.0% 12.7%
Return on Assets % 8.7% 7.4% 7.0% 7.7% 8.2% 8.4% 7.6% 6.9% 4.2% 8.9% 9.6% 9.5% 9.7% NA
Return on Capital % 11.7% 10.0% 9.2% 10.3% 11.2% 11.8% 10.6% 9.3% 5.3% 10.9% 11.9% 11.7% 11.9% NA
Return on Equity % 13.6% 12.0% 11.5% 13.6% 14.3% 15.1% 12.1% 11.0% 5.8% 13.9% 14.5% 15.1% 16.4% NA
0%
5%
10%
15%
20%
25%
1994 1996 1998 2000 2002 2004 2006 2008 2010
EBITDA Margin %
Rent-A-Center Aarons Inc.
0%
5%
10%
15%
20%
25%
1994 1996 1998 2000 2002 2004 2006 2008 2010
ROE%
Rent-A-Center Aarons Inc.
0%
2%
4%
6%
8%
10%
12%
14%
16%
18%
20%
1994 1996 1998 2000 2002 2004 2006 2008 2010
ROIC%
Rent-A-Center Aarons Inc. -20%
0%
20%
40%
60%
80%
100%
120%
140%
160%
Gro
wth
Ra
te
RCII & AAN Revenue Growth
RCII
AAN
0%
10%
20%
30%
40%
50%
60%
70%
80%
90%
100%
% o
f R
TO
In
du
stry
Rev
en
ue
RTO Industry Market Share
Others
AAN
RCII
Figure 1: EBITDA comparison
Figure 3: ROIC Comparison
Figure 5: Rent-To-Own Industry Participant Market Share
Figure 2: Return on Equity Comparison
Figure 4: Industry Market Share Comparison

IRC-TX 02/05/2010
Investment Research Challenge- Texas STUDENT RESEARCH 17
Exhibit 8: Available Consumer Credit in the Market
Source: Bloomberg
Exhibit 9: Beta Analysis
Time Span Beta vs S&P 500
1 Year 1.12
3 Year 1.22 Base Case
5 Year 1.19
10 Year 1.05
Source: Yahoo Finance, Student Calculations
-5%
0%
5%
10%
15%
20%
YOY % Change in Available Consumer Credit

IRC-TX 02/05/2010
Investment Research Challenge- Texas STUDENT RESEARCH 18
Exhibit 10: Discounted Cash Flow Model $ in millions
Source: Company Documents, Student Estimates
Model DriversHistoricals
2005 2006 2007 2008 2009 Hist Ave. 2010 2011 2012 2013 2014
Revenue Growth Rate 4.1% 19.4% -0.8% -4.6% 4.5% 1.9% 3.8% 4.4% 4.6% 4.3%
EBITDA Margin 14.0% 14.6% 13.5% 12.5% 13.1% 13.4% 13.0% 13.3% 13.0% 12.75% 12.5%
CAPEX Growth Rate 40.2% 20.9% -39.3% 10.0% 7.9% 25.9% 8.8% 5.8% 2.9% 3.6%
Debt_t / Operating Assets_t 37.2% 47.2% 47.9% 36.6% 29.1% 40.2% 27.5% 25.0% 25.0% 25.0% 25.0%
Working Capital Net_t / Operating Assets_t-1 -16.6% -7.9% -7.0% -9.0% -10.1% -11.5% -10.0% -9.0% -8.1% -6.9%
Tax Rate 35% 35% 37% 34% 37% 35.9% 38% 38% 38% 38% 38%
Required Return on Debt 5.6% 4.5% 7.5% 7.3% 3.6% 5.7% 3.9% 4.9% 5.9% 6.9% 7.9%
Future - Your Projections of Future Performance
Probably need to fill this column in by hand from Reuters or Bloomberg
See also Preferred Stockin cell D70 below. If that cell is empty, iInsert an estimate of market value of preferred stock.
Any historical data items in pink cells that Compustat fails to entermust be entered by hand from Reuters or Bloomberg Hardcode Imported
Data
"q" is the estimate of the portion of total acquisitions that are depreciable. See the
'depreciation' page for an explanation.
(In calculations that use "q" it is constrained to be between 0 and 1.)
Free Cash Flow Forecasts
2005 2006 2007 2008 2009 now 2010 2011 2012 2013 2014 2015
Total Assets (book value) 1,948.66 2,740.96 2,626.94 2,496.70 2,444.00 2,444.00
less: Non-Operating Cash & ST Invest 0.00 0.00 0.00 0.00 0.00 $0.00
less: Non-Cash Non-Operating Assets 0.00 0.00 0.00 0.00 0.00 0.00
Operating Assets (Book Value) 1,948.66 2,740.96 2,626.94 2,496.70 2,444.00 2444.00 2418.55 2506.38 2573.12 2642.15 2706.86
Working Capital (Book Value) -161.22 -323.63 -215.45 -184.83 -224.70 -224.70
Work Cap Net of Ex Cash & ST Invest -161.22 -323.63 -215.45 -184.83 -224.70 -224.70 -281.06 -241.85 -225.57 -208.20 -182.11
Long-Term Debt (Book Value) 724.10 1,293.30 1,259.30 912.80 711.16 711.16 665.10 626.60 643.28 660.54 676.72
Interest Expense 40.70 58.56 94.78 66.24 25.95 25.69 30.47 37.72 45.33 53.21
Depreciation Expense 69.62 55.70 71.30 85.27 68.00 68.00 84.20 87.74 89.42 92.87
Revenue from Operations 2,339.11 2,433.91 2,906.12 2,884.17 2,751.96 2804.79 2912.70 3041.39 3181.30 3317.81
less: Operating Expenses 2,082.18 2,138.67 2,585.18 2,609.80 2,460.50 2510.17 2600.77 2725.01 2859.69 2992.08
plus: Depreciation & Amort. 69.62 61.22 71.30 85.27 68.63 70.00 74.00 79.00 84.00 89.00
EBITDA 326.55 356.46 392.24 359.64 360.09 364.62 385.93 395.38 405.62 414.73
less: Taxes 73.33 61.05 40.02 81.72 102.52 170.00 118.53 120.22 122.21 123.78
less: Cap Ex. 60.20 84.40 102.00 61.90 68.09 85.71 93.21 98.58 101.46 105.08
less: Acquisitions 38.32 657.38 20.11 15.70 7.00 depreciable
non-depr. 13.21 39.62 39.62 39.62 26.41
less: Incr. in working capital -0.52 -162.41 108.18 30.62 -39.87 -56.36 39.20 16.28 17.38 26.09
Minority Interest Percentage 0.0% 0.0% 0.0% 0.0% 0.0% 0.0%
FCF from Operations (adj. for min. int.) 155.22 -283.96 121.93 169.70 222.35 152.07 95.37 120.67 124.95 133.37 137.37
PV's = 140.56 81.48 95.29 91.20 89.98
Acctg Operating Earngs (adj. for min. int.) 157.17 196.17 221.39 149.21 167.86 Hist Ave. 166.73 174.51 172.77 171.29 168.96 0.00
Operating Earnings per (current) Share 2.38 2.97 3.36 2.26 2.54 2.53 2.64 2.62 2.60 2.56 0.00
Operating Earnings Growth 24.8% 12.9% -32.6% 12.5% 4.4% -0.7% 0.1%
1-year Projected Earnings Growth 5-year
Rev / Op Assets 1.20 0.89 1.11 1.16 1.13 1.16 1.16 1.18 1.20 1.23
FCF / Op Assets 0.08 -0.10 0.05 0.07 0.09 0.06 0.04 0.05 0.05 0.05
Historicals (million $) Future (million$)

IRC-TX 02/05/2010
Investment Research Challenge- Texas STUDENT RESEARCH 19
Exhibit 11: Rent-A-Center Historical Performance Store Profile $ in millions
Source: CapitalIQ, Company Documents
Rent-A-Center’s Rent-To-Own Segment Projections $ in millions
Source: Student Estimates, Management Guidance
Exhibit 12: Rent-A-Center’s Finance Segment Projections $ in millions
Source: Student Estimates, Management Guidance
1999 2000 2001 2002 2003 2004 2005 2006 2007 2008 2009
Total Stores 2440 2522 2623 2725 2977 3188 3056 3688 3308 3259 3007
Revenue (millions) $ 1,415 $ 1,599 $ 1,805 $ 2,007 $ 2,225 $ 2,310 $ 2,331 $ 2,418 $ 2,881 $ 2,841 $ 2,694
Rev/Store (thousands) 580$ 634$ 688$ 737$ 747$ 724$ 763$ 656$ 871$ 872$ 896$
YOY Rev/Store Growth 9.30% 8.57% 7.05% 1.46% -3.07% 5.29% -14.04% 32.80% 0.12% 2.77%
5-Year Average Rev/Store (thousands) $ 811
5-Year Rev/Store CAGR 3.27%
2010 2011 2012 2013 2014
Stores at Beginning 3007 3037 3092 3167 3242
New Stores Added 30 55 75 75 80
CAPEX for New Stores 5$ 8$ 11$ 11$ 12$
Revenue from New Stores 13$ 46$ 100$ 163$ 232$
Number of Accounts Bought Out 25 75 75 75 50
Revenue from Account Buyouts 10$ 31$ 31$ 31$ 20$
Account Buyout Cost 13$ 40$ 40$ 40$ 26$
Revenue from Previously Existing Stores 2,721$ 2,772$ 2,844$ 2,918$ 2,992$
Total Revenue 2,744$ 2,849$ 2,975$ 3,111$ 3,244$
YOY RTO Segment Revenue Growth 1.9% 3.8% 4.4% 4.6% 4.3%
Projected Average Rev/Store (thousands) 904$ 921$ 939$ 960$ 977$
Projected 5-Year Rev/Store CAGR: 1.57%
Assumptions (dollar values in thousands):
1) Revenue Growth Schedule for New Stores Added Year 1 Year 2 Year 3 Year 4 Year 5
$430 $760 $860 $890 $910
2) Average CAPEX Required to Open a New Store: $150
3) Average Inventory on the Floor of a Rent-A-Center Store $150
$528
5) Average Store Revenue from Account Buyouts (based on 2009 Industry Average/Store): $814
6) Stores at the Beginning of 2010: 3,007
1.50%7) Projected YOY Growth in Rev/Store, Next 5 yrs (with the exception of 2010, growth rate is 1%):
4) Average Cost of Account Buyout (10X monthly revenue multiplier less inventory):
2010 2011 2012 2013 2014
Kiosks at Beginning 353 403 503 603 703
Kiosks Added 50 100 100 100 100
Revenue from New Kiosks 4$ 14$ 28$ 44$ 64$
CAPEX for New Kiosks 3$ 5$ 5$ 5$ 5$
Total Revenue from Kiosks 60$ 63$ 67$ 70$ 73$
YOY Kiosk Revenue Growth 4.9% 5.0% 5.0% 5.0% 5.0%
Assumptions (dollar values in thousands):
1) Revenue per Kiosk is Currently Approximately $163,000 and Assumed Growth per Existing Kiosk: 5%
2) Average CAPEX to Open a Kiosk: $50,000 163,000
3) Revenue Growth Schedule for New Kiosks: Year 1 Year 2 Year 3 Year 4 Year 5
$80,000 $120,000 $150,000 $180,000 $220,000
IRC-TX 02/05/2010
Investment Research Challenge- Texas STUDENT RESEARCH 20
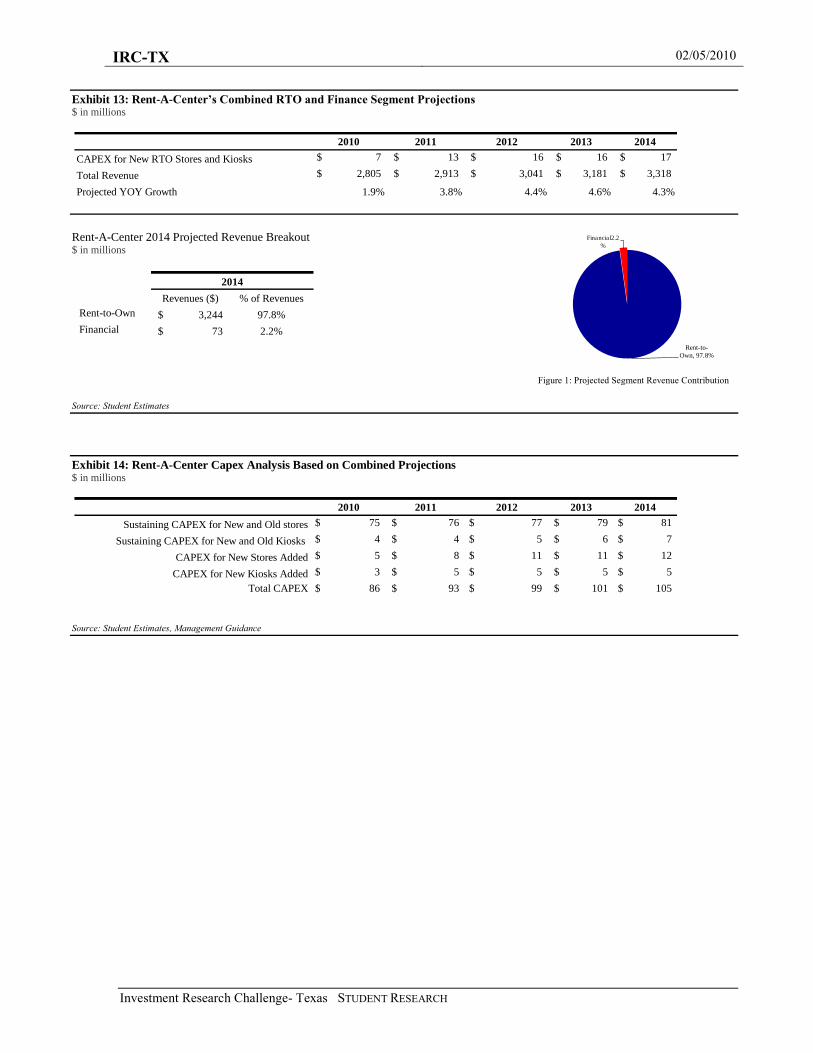
Exhibit 13: Rent-A-Center’s Combined RTO and Finance Segment Projections $ in millions
Rent-A-Center 2014 Projected Revenue Breakout $ in millions
Source: Student Estimates
Exhibit 14: Rent-A-Center Capex Analysis Based on Combined Projections $ in millions
Source: Student Estimates, Management Guidance
2010 2011 2012 2013 2014
CAPEX for New RTO Stores and Kiosks 7$ 13$ 16$ 16$ 17$
Total Revenue 2,805$ 2,913$ 3,041$ 3,181$ 3,318$
Projected YOY Growth 1.9% 3.8% 4.4% 4.6% 4.3%
Revenues ($) % of Revenues
Rent-to-Own 3,244$ 97.8%
Financial 73$ 2.2%
2014
2010 2011 2012 2013 2014
Sustaining CAPEX for New and Old stores $ 75 $ 76 $ 77 $ 79 $ 81
Sustaining CAPEX for New and Old Kiosks $ 4 $ 4 $ 5 $ 6 $ 7
CAPEX for New Stores Added $ 5 $ 8 $ 11 $ 11 $ 12
CAPEX for New Kiosks Added $ 3 $ 5 $ 5 $ 5 $ 5
Total CAPEX $ 86 $ 93 $ 99 $ 101 $ 105
Figure 1: Projected Segment Revenue Contribution
Rent-to-
Own, 97.8%
Financial2.2
%

IRC-TX 02/05/2010
Investment Research Challenge- Texas STUDENT RESEARCH 21
Exhibit 15: Discounted Cash Flow Sensitivity Analysis
Source: Student Calculations
2010 2011 2012 2013 2014
Intrinsic
Value IV/MV
0.9% 2.8% 3.4% 3.6% 3.3% 23.28$ 1.058
1.4% 3.3% 3.9% 4.1% 3.8% 24.72$ 1.123
base 1.9% 3.8% 4.4% 4.6% 4.3% 26.17$ 1.190
2.4% 4.3% 4.9% 5.1% 4.8% 27.66$ 1.257
2.9% 4.8% 5.4% 5.6% 5.3% 29.17$ 1.326
12.0% 12.3% 12.0% 11.8% 11.5% 20.72$ 0.942
12.5% 12.8% 12.5% 12.3% 12.0% 23.45$ 1.066
base 13.0% 13.3% 13.0% 12.8% 12.5% 26.17$ 1.190
13.5% 13.8% 13.5% 13.3% 13.0% 28.90$ 1.314
14.0% 14.3% 14.0% 13.8% 13.5% 31.63$ 1.438
37.0% 37.0% 37.0% 37.0% 37.0% 26.98$ 1.226
37.5% 37.5% 37.5% 37.5% 37.5% 26.58$ 1.208
base 38.0% 38.0% 38.0% 38.0% 38.0% 26.17$ 1.190
38.5% 38.5% 38.5% 38.5% 38.5% 25.77$ 1.171
39.0% 39.0% 39.0% 39.0% 39.0% 25.37$ 1.153
24.9% 7.8% 4.8% 1.9% 2.6% 26.17$ 1.190
25.4% 8.3% 5.3% 2.4% 3.1% 26.17$ 1.190
base 25.9% 8.8% 5.8% 2.9% 3.6% 26.17$ 1.190
26.4% 9.3% 6.3% 3.4% 4.1% 26.17$ 1.190
26.9% 9.8% 6.8% 3.9% 4.6% 26.17$ 1.190
-12.5% -11.0% -10.0% -9.1% -7.9% 26.69$ 1.213
-12.0% -10.5% -9.5% -8.6% -7.4% 26.44$ 1.202
base -11.5% -10.0% -9.0% -8.1% -6.9% 26.17$ 1.190
-11.0% -9.5% -8.5% -7.6% -6.4% 25.91$ 1.178
-10.5% -9.0% -8.0% -7.1% -5.9% 25.64$ 1.166
26.5% 24.0% 24.0% 24.0% 24.0% 26.17$ 1.189
27.0% 24.5% 24.5% 24.5% 24.5% 26.17$ 1.190
base 27.5% 25.0% 25.0% 25.0% 25.0% 26.17$ 1.190
28.0% 25.5% 25.5% 25.5% 25.5% 26.18$ 1.190
28.5% 26.0% 26.0% 26.0% 26.0% 26.18$ 1.190
Beta IV IV/MV
0.82 39.52$ 1.797
1.02 31.77$ 1.444
base 1.22 26.17$ 1.190
1.42 21.95$ 0.998
1.62 18.64$ 0.847
Terminal Growth Rate
2.50% 23.67$ 1.076
current 3.00% 26.17$ 1.190
3.50% 29.21$ 1.328
CAPEX
Working Capital % Revenues
Debt as % Assets
Revenue Growth
EBITDA margin
Tax Rate

IRC-TX 02/05/2010
Investment Research Challenge- Texas STUDENT RESEARCH 22
Exhibit 16: Comparables Valuation Analysis
Source: CapitalIQ, Student Calculations
Exhibit 17: Rent-A-Center Valuation with Terminal Value Calculated from P/E Multiple
Source: CapitalIQ Student Estimates
Rent-A-Center Identified Peer Group
Company Ticker Exchange Price Shares Market Cap
Trailing
P/E- basic
Trailing
P/E- diluted Forward P/E EV/EBITDA P/BV P/EPS P/Sales
Rent-A-Center RCII NASDAQ 21.88 66.00 1444.08 9.01 9.10 9.81 5.87 1.19 9.01 0.52
Aaron's, Inc. AAN NYSE 28.13 54.24 1525.77 14.02 14.06 12.51 6.91 1.77 14.02 0.89
Family Dollar Stores FDO NYSE 31.13 138.40 4308.39 14.51 14.57 13.57 6.57 2.92 14.51 0.58
99 Cents Only Stores NDN NYSE 15.27 68.90 1052.10 27.33 27.61 23.10 11.25 1.91 27.33 0.79
Dollar Tree, Inc. DLTR NASDAQ 49.09 88.30 4334.65 14.91 15.31 14.21 6.86 3.27 14.91 0.86
Dollar Financial Corp. DLLR NASDAQ 20.81 24.10 501.52 -119.41 -119.41 9.75 6.40 2.28 -119.41 0.97
Advance America, Cash Advance Centers, Inc. AEA NYSE 4.42 61.60 272.27 6.76 6.76 5.74 3.92 1.39 6.76 0.42
EZCORP, Inc. EZPW NASDAQ 17.44 48.70 849.33 12.07 12.25 10.36 7.33 2.04 12.07 1.42
Cash America International, Inc. CSH NYSE 36.74 29.30 1076.48 13.74 14.10 10.47 7.57 1.68 13.74 1.00
Mean (DLLR excluded due to negative earnings) 14.04 14.22 12.47 7.03 2.02 14.04 0.81
Intrinsic Value (Based on Forward P/E) $27.81
Discount Rate (CAPM) 8.18%
2010 2011 2012 2013 2014
FCF 152.07$ 95.37$ 120.67$ 124.95$ 133.37$
PV of FCF 140.57$ 81.49$ 95.31$ 91.22$ 90.00$
Terminal EPS $2.56
P/E for Rent-A-Center 9.0
P/E for Rent-A-Center Identified Peer Group 14.0
Rent-A-Center P/E
PV (FCF Operations 10 yrs) Per share $7.54 33%
PV P/E Multiple Terminal Value $15.58 67%
Total Value Per Share $23.13
Rent-A-Center Identified Peer Group
PV (FCF Operations 10 yrs) Per share $7.54 24%
PV P/E Multiple Terminal Value $24.26 76%
Total Value Per Share $31.80

IRC-TX 02/05/2010
Investment Research Challenge- Texas STUDENT RESEARCH 23
Exhibit 18: Personal Consumption versus Personals Savings
Source: Bloomberg, Student Calculations
-4.00%
-2.00%
0.00%
2.00%
4.00%
6.00%
8.00%
10.00%
12.00%
14.00%
16.00%
Personal Consumption Expenditure Rate % Change MOM
Personal Savings Rate % Change MOM
IRC-TX 02/05/2010
Investment Research Challenge- Texas STUDENT RESEARCH 24
Exhibit 20: Rent-A-Center Store Count and Unemployment by State (through December 2009)
Source: U.S. Bureau of Labor Statistics, Company Documents
IRC-TX 02/05/2010
Investment Research Challenge- Texas STUDENT RESEARCH 25
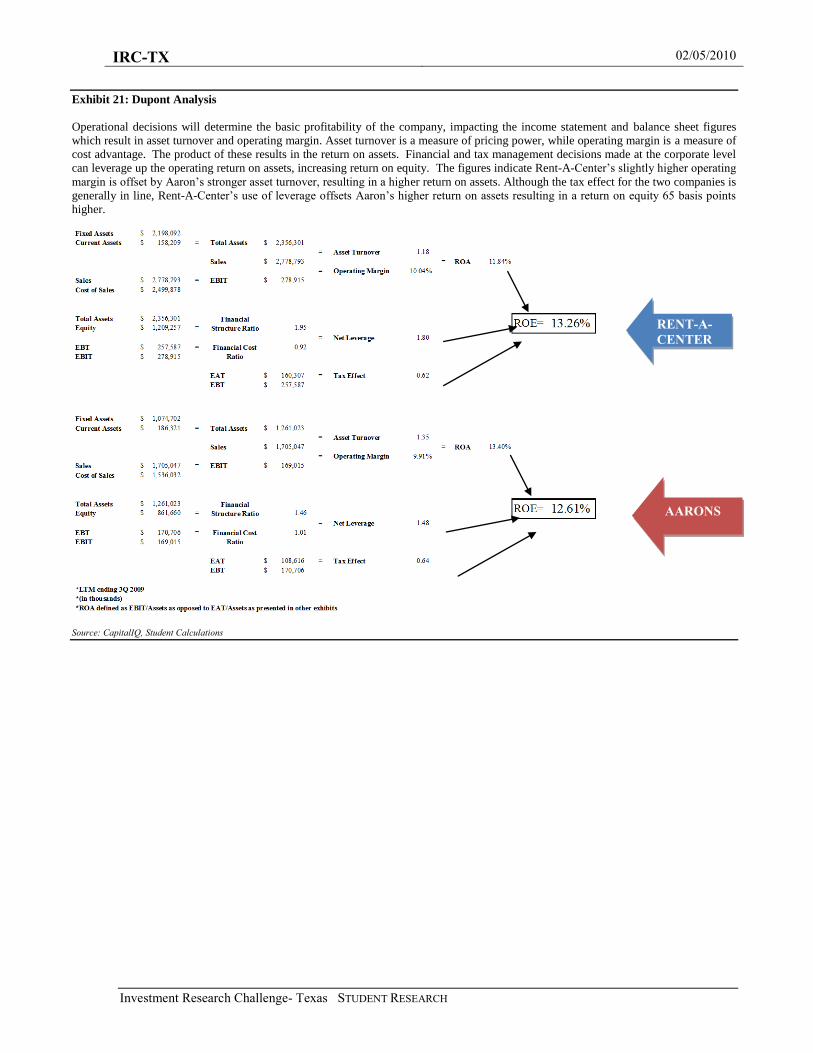
Exhibit 21: Dupont Analysis
Operational decisions will determine the basic profitability of the company, impacting the income statement and balance sheet figures
which result in asset turnover and operating margin. Asset turnover is a measure of pricing power, while operating margin is a measure of
cost advantage. The product of these results in the return on assets. Financial and tax management decisions made at the corporate level
can leverage up the operating return on assets, increasing return on equity. The figures indicate Rent-A-Center’s slightly higher operating
margin is offset by Aaron’s stronger asset turnover, resulting in a higher return on assets. Although the tax effect for the two companies is
generally in line, Rent-A-Center’s use of leverage offsets Aaron’s higher return on assets resulting in a return on equity 65 basis points
higher.
Source: CapitalIQ, Student Calculations
RENT-A-
CENTER
AARONS

IRC-TX 02/05/2010
Investment Research Challenge- Texas STUDENT RESEARCH 26
Exhibit 22: Rent-A-Center Historic Ratios
Source: CapitalIQ,
Exhibit 23: Z-Score Calculations
The Altman Z score has proven to be a reliable tool in predicting bankruptcy. Z score profiles for failing businesses often indicate a
consistent downward trend as they approach bankruptcy.
Source: www.nysscpa.org, CapitalIQ, Student Estimates
HISTORIC RISK
2005 2006 2007 2008 2009
Liquidity
Current Ratio 0.4x 0.4x 0.5x 0.5x 0.4x
Quick Ratio 0.3x 0.3x 0.4x 0.4x 0.3x
Days Inventory 0.3 NA NA NA NA
Days Payable 16.7 NA 16.2 14.4 NA
Cash Conversion Cycle (13.6) NA NA NA NA
HISTORIC PROFITABILITY ANALYSIS
2002 2003 2004 2005 2006 2007 2008 2009
Liquidity
Gross Margin % 20.8% 20.2% 18.0% 15.0% 16.2% 15.3% 14.4% 15.0%
Operating Margin 0.5x 0.8x 0.2x 0.3x 0.3x 0.4x 0.4x 0.3x
Profit Margin NA NA 0.3 0.3 NA NA NA NA
Growth - Sales 11.1% 10.9% 3.8% 1.1% 4.1% 19.4% (0.8%) (4.2%)
Growth - Operating Income 48.1% 5.6% (10.8%) (22.1%) 14.9% 3.4% (10.1%) 1.7%
Growth - Net Income 160.0% 5.4% (14.1%) (12.9%) (24.1%) (26.0%) 83.1% 14.8%
ROA 13.5% 13.4% 10.9% 8.2% 7.9% 7.1% 6.7% 7.2%
ROC 16.0% 16.2% 13.8% 10.5% 9.7% 8.5% 8.1% 8.9%
ROE 22.0% 22.2% 19.6% 16.8% 11.7% 8.1% 13.8% 14.2%
Total Asset Turnover 1.2x 1.3x 1.2x 1.2x 1.0x 1.1x 1.1x 1.1x
Fixed Asset Turnover 18.9x 19.6x 17.3x 15.9x 13.2x 13.2x 13.4x 13.4x
Accounts Receivable Turnover NM 213.5x 148.2x 127.6x 88.4x 76.2x 61.8x 52.5x
Z-score Component 2004 2005 2006 2007 2008 5-Year Average Current (LTM 3Q 2009) Aaron's Inc.
T1 = Working Capital / Total Assets -0.08 -0.08 -0.10 -0.06 -0.07 -0.08 -0.09 0.03
T2 = Retained Earnings / Total Assets 0.39 0.46 0.36 0.41 0.48 0.42 0.57 0.53
T3 = Earnings Before Interest and Taxes / Total Assets 0.17 0.13 0.11 0.12 0.11 0.13 0.12 0.13
T4 = Market Value of Equity / Total Liabilities 1.8 1.4 1.0 0.9 0.9 1.2 1.1 3.62
T5 = Sales/ Total Assets 1.18 1.20 0.89 1.11 1.16 1.11 1.18 1.35
Z Score Bankruptcy Model:
Z = (1.2T1 + 1.4T2 + 3.3T3 + 0.6T4 + 1.0T5) 3.28 3.00 2.25 2.52 2.64 2.74 2.93 4.74
Zones of Discrimination:
Z > 3.0 -Safe Zone
1.8 < Z < 2.99 - Potential Danger Zone
Z < 1.80 -Distress Zone
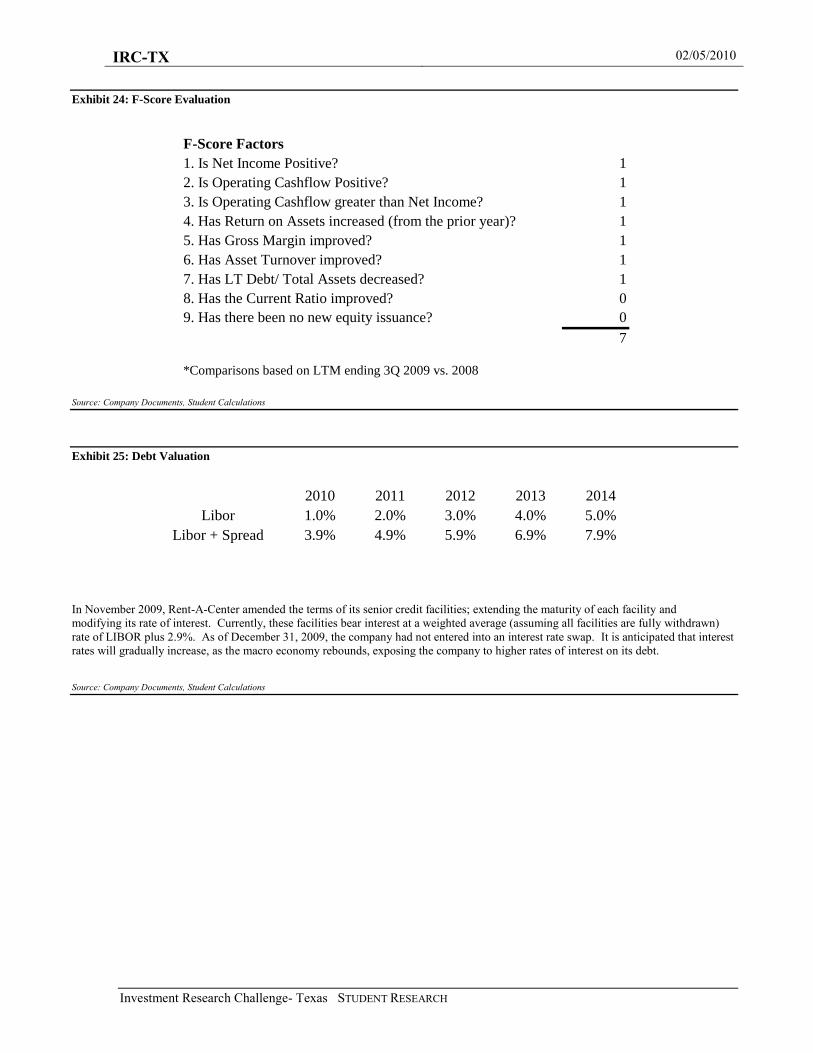
IRC-TX 02/05/2010
Investment Research Challenge- Texas STUDENT RESEARCH 27
Exhibit 24: F-Score Evaluation
Source: Company Documents, Student Calculations
Exhibit 25: Debt Valuation
In November 2009, Rent-A-Center amended the terms of its senior credit facilities; extending the maturity of each facility and
modifying its rate of interest. Currently, these facilities bear interest at a weighted average (assuming all facilities are fully withdrawn)
rate of LIBOR plus 2.9%. As of December 31, 2009, the company had not entered into an interest rate swap. It is anticipated that interest
rates will gradually increase, as the macro economy rebounds, exposing the company to higher rates of interest on its debt.
Source: Company Documents, Student Calculations
F-Score Factors
1. Is Net Income Positive? 1
2. Is Operating Cashflow Positive? 1
3. Is Operating Cashflow greater than Net Income? 1
4. Has Return on Assets increased (from the prior year)? 1
5. Has Gross Margin improved? 1
6. Has Asset Turnover improved? 1
7. Has LT Debt/ Total Assets decreased? 1
8. Has the Current Ratio improved? 0
9. Has there been no new equity issuance? 0
7
*Comparisons based on LTM ending 3Q 2009 vs. 2008
Borrowing Amount Libor Spread 2010 2011 2012 2013 2014
$165 2.75% Libor 1.0% 2.0% 3.0% 4.0% 5.0%
$484 3.00% Libor + Spread 3.9% 4.9% 5.9% 6.9% 7.9%
$420 2.75%
Weighted Average Spread 2.9%

IRC-TX 02/05/2010
Investment Research Challenge- Texas STUDENT RESEARCH 28
Exhibit 25: Income Statement $ in millions
Source: Company Documents, Student Estimates
2005 2006 2007 2008 2009 2010 2011 2012 2013 2014
Income Statement
RTO and Financial Segment Revenues 2,339.11 $2,433.9 $2,906.1 $2,884.2 $2,752.0 $2,804.8 $2,912.7 $3,041.4 $3,181.3 $3,317.8
% Growth 4.1% 19.4% -0.8% -4.6% 1.9% 3.8% 4.4% 4.6% 4.3%
Cost Of Goods Sold $1,988.2 $2,039.5 $2,461.5 $2,467.6 $2,320.0 $2,391.9 $2,475.8 $2,589.7 $2,716.8 $2,845.0
% of Total Sales 85.0% 83.8% 84.7% 85.6% 84.3% 85.3% 85.0% 85.2% 85.4% 85.8%
Gross Profit $350.9 $394.4 $444.6 $416.5 $431.9 $412.9 $436.9 $451.6 $464.5 $472.8
% of Total Sales 15.0% 16.2% 15.3% 14.4% 15.7% 14.7% 15.0% 14.9% 14.6% 14.3%
Selling General & Admin Exp. $82.3 $93.6 $123.7 $125.6 $137.6 $117.7 $126.1 $136.6 $143.0 $147.0
Amort. of Goodwill and Intangibles $11.7 $5.6 $15.7 $16.6 $2.8 $0.6 $0.1 $0.0 $0.0 $0.0
Total SG&A and Other Expenses $94.0 $99.1 $139.4 $142.3 $140.5 $118.3 $125.0 $136.6 $143.0 $147.0
% of Total Sales 4.0% 4.1% 4.8% 4.9% 5.1% 4.2% 4.3% 4.5% 4.5% 4.4%
Operating Profit $256.9 $295.2 $305.2 $274.3 $291.5 $294.6 $311.9 $315.1 $321.5 $325.8
% of Total Sales 11.0% 12.1% 10.5% 9.5% 10.6% 10.5% 10.7% 10.4% 10.1% 9.8%
Interest Expense ($46.2) ($58.6) ($94.8) ($66.2) ($26.8) ($25.7) ($30.8) ($36.4) ($44.8) ($52.5)
Interest and Invest. Income $5.5 $5.6 $6.8 $8.9 ($0.8) $0.0 $0.0 $0.0 $0.0 $0.0
Net Interest Expense ($40.7) ($53.0) ($88.0) ($57.3) ($27.6) ($25.7) ($30.8) ($36.4) ($44.8) ($52.5)
EBT Excl. Unusual Items $216.2 $242.2 $217.2 $216.9 $263.8 $268.9 $281.1 $278.7 $276.7 $273.3
Income Tax Expense $73.3 $61.0 $40.0 $81.7 $102.5 $170.0 $118.5 $120.2 $122.2 $123.8
Net Income $157.1 $200.9 $207.5 $156.2 $161.3 $166.7 $174.3 $172.3 $171.5 $169.5
Basic Earnings Per Share $2.27 $2.86 $3.11 $2.37 $2.44 $2.53 $2.64 $2.61 $2.60 $2.57
Diluted Earnings Per Share $2.22 $2.89 $3.09 $2.34 $2.42 $2.50 $2.61 $2.58 $2.57 $2.54

IRC-TX 02/05/2010
Investment Research Challenge- Texas STUDENT RESEARCH 29
Exhibit 25: Balance Sheet $ in millions
Source: Company Documents, Student Estimates
2005 2006 2007 2008 2009 2010 2011 2012 2013 2014
Balance Sheet
ASSETS
Cash And Equivalents $57.6 $92.3 $97.4 $87.4 $101.8 $95.0 $94.8 $95.3 $94.8 $96.3
Accounts Receivable, Net Allowances $20.4 $34.7 $41.6 $51.8 $63.4 $60.0 $50.3 $53.4 $55.8 $56.6
Prepaid Expenses $38.5 $54.1 $56.4 $59.2 $50.7 $51.8 $54.4 $54.5 $54.1 $53.1
Total Current Assets $116.6 $181.1 $195.4 $198.4 $215.9 $206.8 $199.5 $203.2 $204.8 $206.0
Gross Property, Plant & Equipment $324.2 $463.2 $468.1 $497.7 $500.0 $495.0 $504.9 $515.0 $525.3 $535.8
Accumulated Depreciation ($174.3) ($245.0) ($245.9) ($288.8) ($296.0) ($299.0) ($301.9) ($305.0) ($308.0) ($311.1)
Net Property, Plant & Equipment $149.9 $218.2 $222.2 $208.9 $204.0 $196.0 $203.0 $210.0 $217.3 $224.7
Merchandise On Rent and Held For Rent (or Installment Sale) $752.9 $1,058.6 $940.3 $822.5 $730.0 $720.0 $795.0 $838.0 $885.0 $928.0
Goodwill, Net $926.0 $1,253.7 $1,255.2 $1,265.2 $1,290.0 $1,295.0 $1,308.0 $1,321.0 $1,334.2 $1,347.6
Other Intangibles $3.4 $27.9 $13.9 $1.7 $3.1 $0.8 $0.0 $0.0 $0.0 $0.0
Deferred Tax Assets, LT $0.0 $1.5 $0.0 $0.0 $0.0 $0.4 $0.1 $0.1 $0.1 $0.2
TOTAL ASSETS $1,949 $2,741 $2,627 $2,497 $2,443 $2,419 $2,506 $2,572 $2,641 $2,707
LIABILITIES
Accounts Payable $88.1 $118.4 $100.4 $93.5 $117.5 $130.0 $115.0 $107.0 $108.0 $96.0
Accrued Liabilities $191.8 $386.3 $310.4 $289.7 $322.5 $358.0 $326.0 $321.3 $305.0 $293.0
Total Current Liabilities $280.0 $504.7 $410.8 $383.2 $440.0 $488.0 $441.0 $428.3 $413.0 $389.0
Long-Term Debt $724.1 $1,293.3 $1,259.3 $946.0 $711.0 $665.1 $626.6 $643.3 $660.5 $676.7
Def. Tax Liability, Non-Curr. $121.2 $0.0 $9.7 $87.2 $45.0 $35.5 $44.3 $53.0 $44.5 $44.3
TOTAL LIABILITIES $1,125 $1,798 $1,680 $1,416 $1,196 $1,189 $1,112 $1,125 $1,118 $1,110
SHAREHOLDERS EQUITY
Common Stock $1.0 $1.0 $1.0 $1.0 $1.0 $1.0 $1.0 $1.0 $1.0 $1.0
Additional Paid In Capital $630.3 $662.4 $674.0 $681.1 $662.0 $669.9 $671.7 $671.2 $668.7 $670.4
Retained Earnings $901.5 $993.6 $1,069.6 $1,208.0 $1,402.0 $1,168.3 $1,212.0 $1,247.6 $1,257.5 $1,221.3
Treasury Stock ($709.4) ($714.1) ($797.5) ($810.0) ($818.0) ($825.0) ($830.0) ($835.0) ($840.0) ($845.0)
Comprehensive Inc. and Other $0.0 $0.0 $0.0 $0.0 $0.0 $0.0 $0.0 $0.0 $0.0 $0.0
TOTAL SHAREHOLDERS EQUITY $823 $943 $947 $1,080 $1,247 $1,230 $1,394 $1,447 $1,523 $1,596
TOTAL LIABILITIES AND SHAREHOLDERS EQUITY $1,949 $2,741 $2,627 $2,497 $2,443 $2,419 $2,506 $2,572 $2,641 $2,706
IRC-TX 02/05/2010
Investment Research Challenge- Texas STUDENT RESEARCH 30
Disclosures:
Ownership and material conflicts of interest:
The author(s), or a member of their household, of this report do not hold a financial interest in the securities of this company.
The author(s), or a member of their household, of this report do not know of the existence of any conflicts of interest that might bias the content or publication of this report.
Receipt of compensation:
Compensation of the author(s) of this report is not based on investment banking revenue.
Position as a officer or director:
The author(s), or a member of their household, does not serves as an officer, director or advisory board member of the subject company.
Market making:
The author(s) does not act as a market maker in the subject company’s securities.
Ratings key:
Banks rate companies as either a BUY, HOLD or SELL. A BUY rating is given when the security is expected to deliver absolute returns of 15% or greater over the next twelve month period, and recommends that investors take a position above the security’s weight in the S&P 500, or any other relevant index.
A SELL rating is given when the security is expected to deliver negative returns over the next twelve months, while a HOLD rating implies flat returns over the next twelve months.
Disclaimer:
The information set forth herein has been obtained or derived from sources generally available to the public and believed by the author(s) to be reliable, but the author(s) does not make any representation or warranty, express or implied, as to its accuracy or completeness. The information is not intended to be
used as the basis of any investment decisions by any person or entity. This information does not constitute investment advice, nor is it an offer or a
solicitation of an offer to buy or sell any security. This report should not be considered to be a recommendation by any individual affiliated with CFA-
DFW/HSFA or the Investment Research Challenge-Texas with regard to this company’s stock.


![Philips-Magnavox Chassis TPE1.0U-LA [SM]](https://cdn.vdocuments.net/doc/165x107/55cf978a550346d0339233f3/philips-magnavox-chassis-tpe10u-la-sm.jpg)


