Download - Chapter 6 Prediction, Residuals, Influence
Chapter 6 Prediction, Residuals, Influence
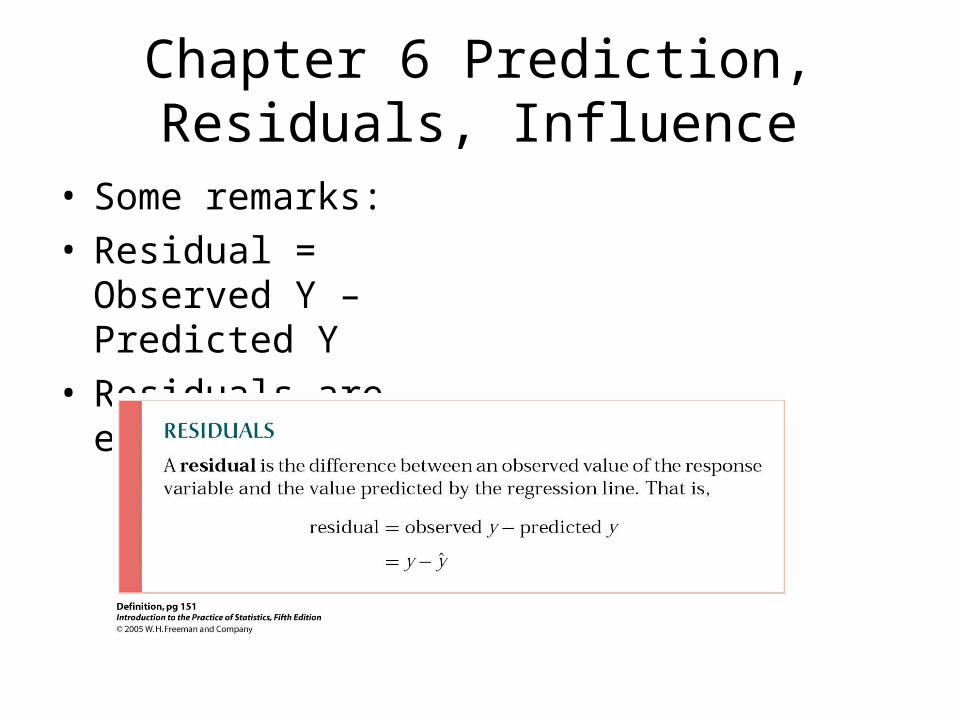
• Some remarks: • Residual = Observed
Y – Predicted Y• Residuals are errors.

Chapter 6 Prediction, Residuals, InfluenceExample:
• X: Age in months
• Y: Height in inches
• X: 18 19 20 21 22 23 24
• Y: 29.9 30.3 30.7 31 31.38 31.45 31.9
Chapter 6 Prediction, Residuals, Influence
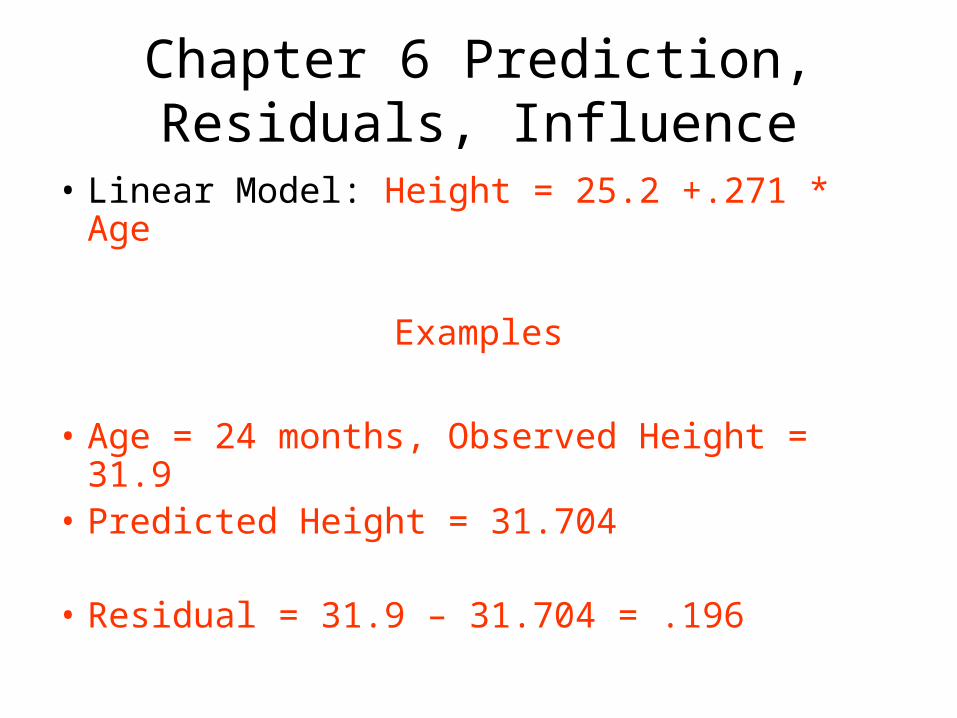
• Linear Model: Height = 25.2 +.271 * Age
Examples
• Age = 24 months, Observed Height = 31.9• Predicted Height = 31.704
• Residual = 31.9 – 31.704 = .196

Chapter 6 Prediction, Residuals, Influence
• Age = 30 years months
• Predicted Height ~ 10 ft!!
• Residual = BIG!
• Be aware of Extrapolation!

Chapter 6 Prediction, Residuals, Influence

Chapter 6 Prediction, Residuals, Influence

Chapter 6 Prediction, Residuals, Influence

Chapter 7 Correlation and Coefficient of Determination
How strong is the linear relationship between two quantitative variables X and Y?
Chapter 7 Correlation and Coefficient of Determination
• Answer:
• Use scatterplots
• Compute the correlation coefficient, r.
• Compute the coefficient of determination, r^2.

Chapter 7 Correlation and Coefficient of Determination
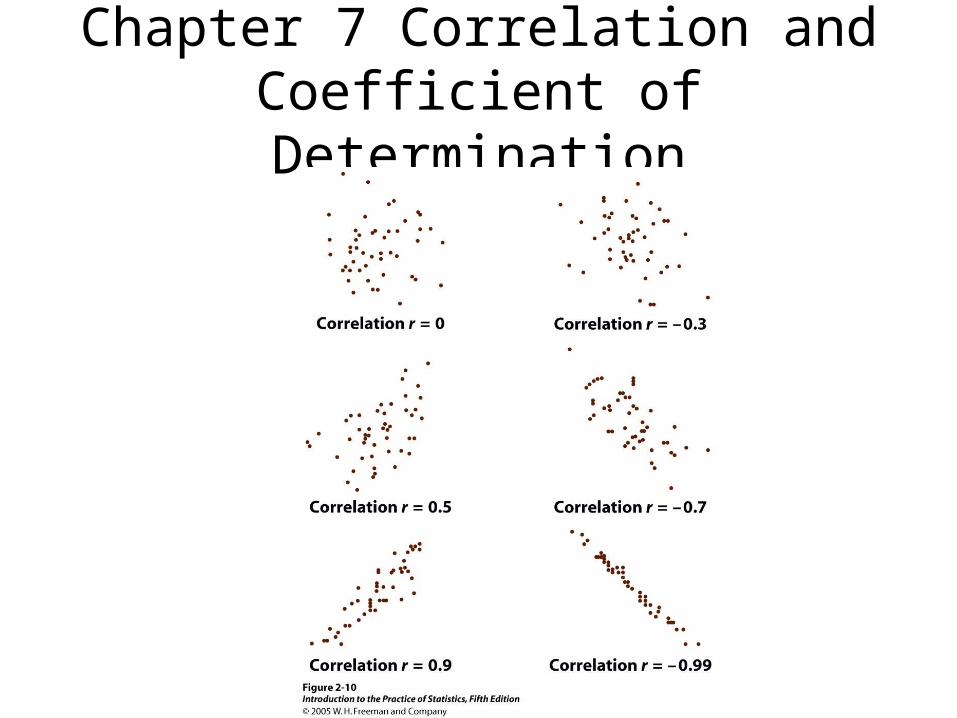
• Properties of Correlation coefficient• r is a number between -1 and 1• r = 1 or r = -1 indicates a perfect correlation case
where all data points lie on a straight line• r > 0 indicates positive association• r < 0 indicates negative association• r value does not change when units of measurement
are changed (correlation has no units!)• Correlation treats X and Y symmetrically. The
correlation of X with Y is the same as the correlation of Y with X

Chapter 7 Correlation and Coefficient of Determination
• r is an indicator of the strength of linear relationship between X and Y
• strong linear relationship for r between .8 and 1 and -.8 and -1:
• moderate linear relationship for r between .5 and .8 and -.5 and -.8:
• weak linear relationship for r between .-.5 and .5 • It is possible to have an r value close to 0 and a
strong non-linear relationship between X and Y.• r is sensitive to outliers.
Chapter 7 Correlation and Coefficient of Determination
Chapter 7 Correlation and Coefficient of Determination
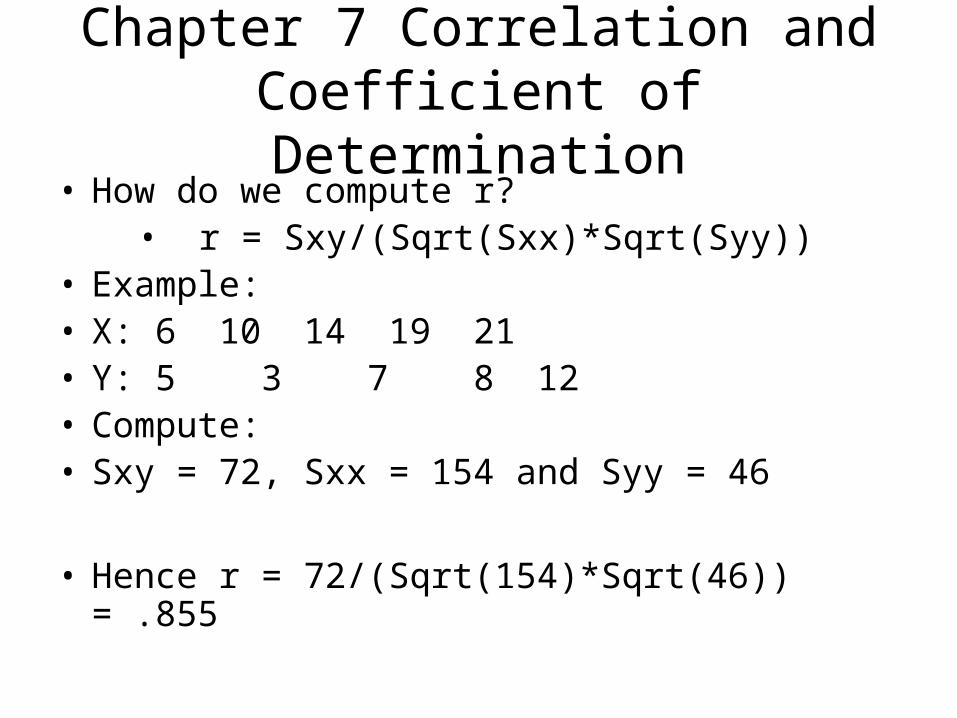
• How do we compute r? • r = Sxy/(Sqrt(Sxx)*Sqrt(Syy))
• Example: • X: 6 10 14 19 21• Y: 5 3 7 8 12• Compute: • Sxy = 72, Sxx = 154 and Syy = 46
• Hence r = 72/(Sqrt(154)*Sqrt(46)) = .855

Chapter 7 Correlation and Coefficient of Determination
• r^2: Coefficient of Determination
• r^2 is between 0 and 1. • The closer r^2 is to 1, the stronger the
linear relationship between X and Y• r^2 does not change when units of
measurement are changed• r^2 measures the strength of linear
relatioship

Chapter 7 Correlation and Coefficient of Determination
• Some Remarks• Quantitative variable condition: Do not
apply correlation to categorical variables
• Correlation can be misleading if the relationship is not linear
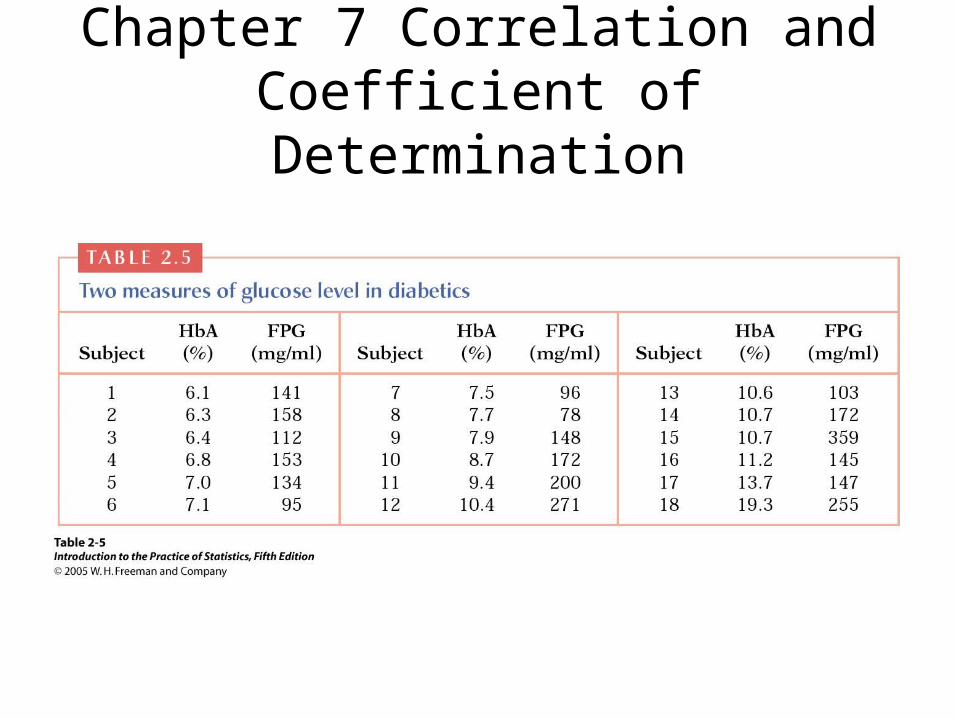
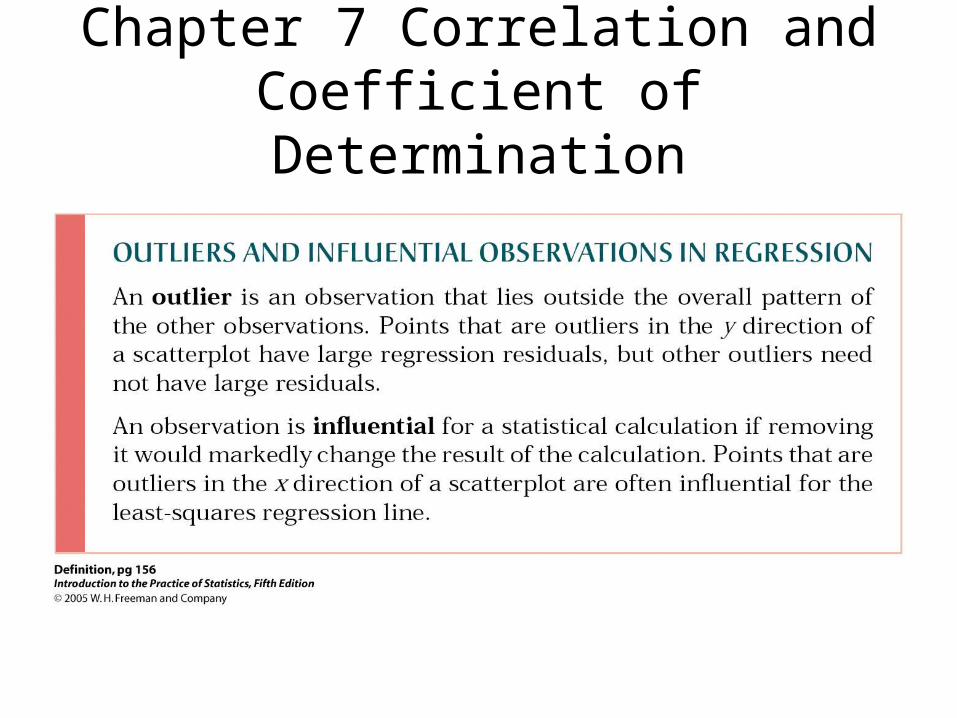
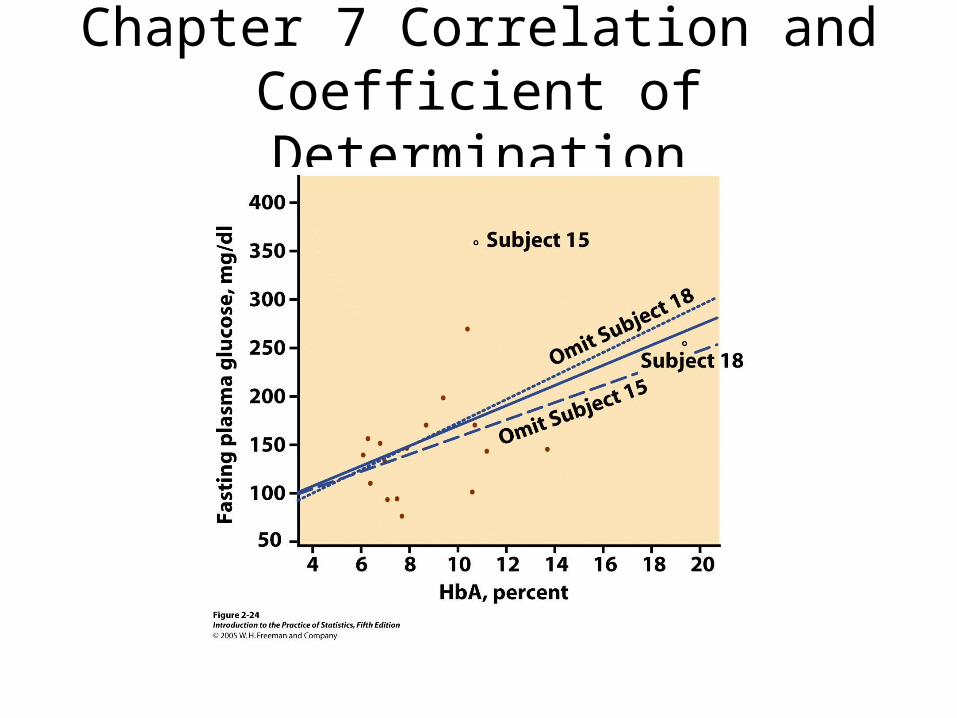
• Outliers distort correlation dramatically. Report corrlelation with/without outliers.
Chapter 7 Correlation and Coefficient of Determination

Chapter 7 Correlation and Coefficient of Determination

Chapter 7 Correlation and Coefficient of Determination
Chapter 7 Correlation and Coefficient of Determination
Chapter 7 Correlation and Coefficient of Determination

Chapter 7 Correlation and Coefficient of Determination

Chapter 7 Correlation and Coefficient of Determination


