
SummaryThis analysis assessed the levels of mean dietary intakes of fruit and veg-etables (excluding potatoes) measured in grams per day. The theoretical-minimum-risk distribution for fruit and vegetable intake was estimatedto be 600g/day in adults, 480g/day in children aged 5–14 years, and330g/day in children aged 0–4 years. It is proposed to use set intervalsof 80g/day of fruit and vegetables (equivalent to one serving) to elabo-rate the distributional transition.
The effect of fruit and vegetable consumption in preventing ischaemicheart disease (IHD), cerebrovascular disease, lung cancer, stomachcancer, colon and rectum cancers and oesophageal cancer was estimated.The choice of outcomes was guided mainly by previous reviews of theliterature (Law and Morris 1998; Ness and Powles 1997; World CancerResearch Fund and American Institute for Cancer Research 1997), whichsuggested a protective effect of fruit and vegetables for IHD, stroke andcancers of the lung and digestive tract.
Health outcomes that could be reconsidered for inclusion in the next revision of the Global Burden of Disease (GBD) study includecancers of the larynx, pancreas, bladder, ovary, endometrium, thyroidand prostate; type II diabetes; chronic obstructive pulmonary disease;and cataract.
Estimates were based primarily on representative population-basedsurveys of dietary intake identified using a comprehensive search of theliterature and contacts with experts. Data were obtained for 26 coun-tries from nine subregions1 and pooled statistically within each subre-gion. When no survey data were available in a subregion, per capita foodsupply statistics were combined with estimates of the distribution ofintakes by sex and age. Systematic extrapolations were made when theoriginal data did not meet the comparative risk assessment (CRA) cate-gories and when part of the estimates were unavailable.
Chapter 9
Low fruit and vegetableconsumption
Karen Lock, Joceline Pomerleau, Louise Causerand Martin McKee

Estimates of fruit and vegetable intake were highest in EUR-A, followed by WPR-A. The lowest intakes were found in AMR-B, EUR-C, SEAR-B, SEAR-D and AFR-E. Intakes varied by age groups, with chil-dren and the elderly generally having lower intakes than middle-agedadults.
Standard deviations varied considerably by subregion, sex and agegroup, with a median of 223g/day. Estimates tended to be, on average,lower in women than in men (but with variations by age group), andthey were generally lower in young children. In some subregions, stan-dard deviations were also slightly smaller in the elderly.
Risk factor–disease relationships for each selected outcome were esti-mated based on the results of a systematic review of the literature com-bined with meta-analysis. The relative risk estimates derived wereapplied to all age groups between the ages of 15 and 70 years. To takeaccount of age attenuation the relative risks were reduced by a quarterfor ages 70–79 years, and by half for the age group ≥80 years. For thoseaged <15 years, a relative risk of 1 was applied.
Due to the limited information available on subregional differences inrisks, constant estimates were applied to all subregions. Risks wereassessed relative to the chosen theoretical-minimum-risk distributionfruit and vegetable intake.
The protective effects of fruit and vegetables were expressed as rela-tive risk estimates associated with an 80g/day increase in fruit and veg-etable intake. The relative risk estimates were as follows: 0.90 (95% CI0.82–0.99) for IHD, 0.94 (0.89–0.99) for ischaemic stroke, 0.96(0.93–0.99) for lung cancer, 0.94 (0.86–1.03) for gastric cancer, 0.99(0.97–1.02) for colorectal cancer and 0.94 (0.88–1.01) for oesophagealcancer.
CRA found that the lack of dietary fruit and vegetables contributesan important share of the worldwide disease burden. It was estimatedthat increasing individual fruit and vegetable consumption up to the theoretical-minimum-risk distribution could reduce the worldwideburden of disease for IHD and ischaemic stroke by about 31% (30% inmen and 31% for women) and 19% (18% in men and 19% in women),respectively. For stomach and oesophageal cancer, the potential reduc-tion in disease attributable to an increase in fruit and vegetable intakewas 19% and 20%, respectively. Attributable risk fractions were lowerfor lung and colorectal cancer (12% and 2%). The total worldwide mortality attributable to inadequate fruit and vegetable consumption is estimated to be 2.726 million deaths or 26.662 million disability-adjusted life years (DALYs) per year.
Although these results need to be interpreted in the light of the limi-tations of the current methods, including the potential for residual con-founding and misclassification of exposure, they clearly highlight theimportance of increased fruit and vegetable consumption in improvingpublic health worldwide.
598 Comparative Quantification of Health Risks

1. Introduction
1.1 Definition of risk factor
In this chapter, the selected risk factor is the mean dietary intake of fruitand vegetables. Intake is treated as a continuous variable and is mea-sured in grams/person per day. The estimates provided exclude potatoesin order to be consistent with current international recommendations forthe intake of fruit and vegetables (WHO 1990).
1.2 Choice of exposure variable, reasons and implications
Accumulating epidemiological evidence has suggested that fruit and veg-etables in the diet can reduce the risk of major diseases such as cardio-vascular diseases and certain cancers, thus reducing premature deaths(Klerk et al. 1998; World Cancer Research Fund and American Institutefor Cancer Research 1997). This consistent pattern of findings has ledseveral national and international bodies to advocate an increase inintake to at least 400g/day (excluding potatoes) (WHO 1990; WorldCancer Research Fund and American Institute for Cancer Research1997).
While the first round of the GBD study did not look explicitly at theoverall impact of nutrition on the global burden of disease, an attemptwas later made in Sweden to estimate the burden of disease that couldbe attributed to different causal factors in the European Union (EU)(National Institute of Public Health 1997). It was estimated that diet-related factors directly contributed to 8.3% of the estimated number ofDALYs lost, almost half of this being attributed to low fruit and veg-etable intake (3.5% compared with 3.7% for overweight and 1.1% forhigh saturated fat intake). However, these figures do not take account of potential interactions between the different factors. In comparison,tobacco smoking accounted for 9% of the burden of disease in the EU.These findings are similar to those of recent studies from Australia andNew Zealand (Mathers et al. 1999; Tobias 2001). In these countries, itwas estimated that about 3% (2.8% in Australia and 2.4% in NewZealand) of the burden of disease could be attributed to low fruit andvegetable consumption. The Australian study also reported that approx-imately 10% of all cancers could be due to an insufficient intake of fruitand vegetables.
1.3 Choice of theoretical-minimum-risk distribution
The CRA project estimates the effects of shifting risk factor distributionstowards a counterfactual distribution, rather than the difference between“exposed” and “unexposed” groups. Fruit and vegetable consumptionis unusual in the CRA project in that there is a suggested inverse riskfactor–disease relationship (i.e. the potential protective effect of fruit andvegetables for various disease outcomes is considered). Hence, the
Karen Lock et al. 599

theoretical-minimum-risk distribution (the distribution of exposure thatwould yield the lowest population risk) involves estimating an upper con-sumption that is protective.
For this exercise, we chose limits that could be realistically attained.However, we do not know what the true upper intakes that would givethe highest level of protection would be; they could reflect levels ofintakes that are much higher than current consumption patterns. Thus,choosing a theoretical-minimum-risk distribution is currently difficult todo with certainty. Evidence has clearly shown that those in the highestcategories of fruit and vegetable consumption have lower risk comparedwith those in the lowest consumption categories. It is not yet clearwhether there is a threshold effect for fruit and vegetable consumption(although many studies have presented a linear dose–response relation-ship). Nor is it clear whether the same threshold would apply to all protective effects (e.g. there appears to be some evidence to suggest alower threshold for colorectal cancer from research in individuals withvery low intake) (Terry et al. 2001). However, due to the current uncer-tainty in this area, the same threshold was used for all selected healthoutcomes. Better information on threshold effects is a priority for futurework.
In this project, the counterfactual was chosen to be a constant levelusing a minimum risk approach based on the following information.
• Most studies showing risk differences between the highest and lowestquartiles or quintiles of intakes have been performed in westernEurope and North America. In the absence of other evidence, it wasdecided to base the counterfactual on the ranges of intakes observedin these populations.
• According to food balance sheet data, the amounts of fruit and veg-etables available for consumption by the populations of these subre-gions range from about 300 to 1200g/person per day (FAO 1998a).The highest availability is found in Greece where the quantity of fruitand vegetables available to consumers is 1100–1200g/person per day.Assuming approximately 33% waste at the household level (Joffe andRobertson 2001), the mean daily intake of fruit and vegetables couldbe estimated to be approximately 700–800g/person. However, dietarysurvey data gathered for this study showed that the mean intakes inadults of any given country rarely went above 500g/day, and neverabove 550g/day, even in countries known for their high intakes offruit and vegetables (Israel and Italy). It was thus decided to limit thetheoretical-minimum-risk distribution to 600g/day in adults.
• As described in section 2.5, it was assumed that children consume lessfruit and vegetables than adults (45% less in children aged 0–4 yearsand 20% less in children aged 5–14 years).
600 Comparative Quantification of Health Risks
• As data gathered for this project showed almost no difference in fruitand vegetable intake between men and women (see section 2.5), it wasdecided to use the same theoretical-minimum-risk distribution forboth sexes.
• In order to allow for slight population variability, it was decided toapply around the theoretical-minimum-risk distribution, a margin ofuncertainty of 50g/day.
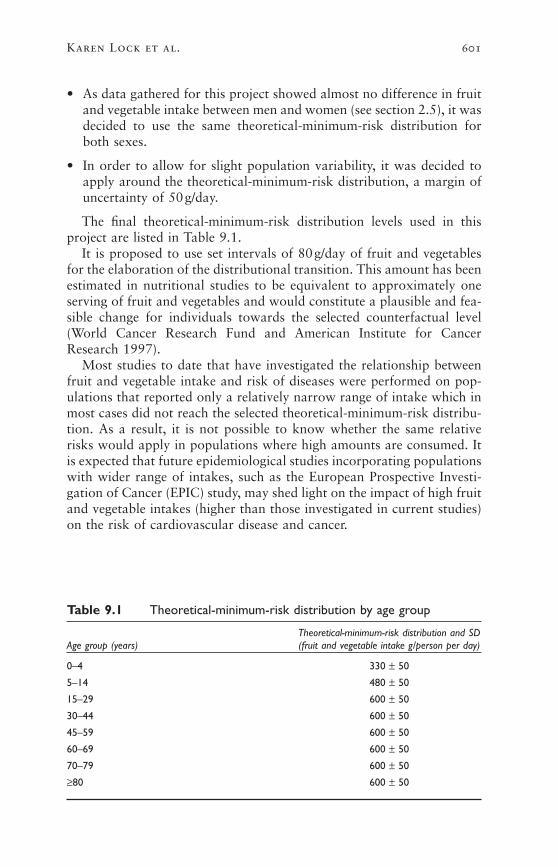
The final theoretical-minimum-risk distribution levels used in thisproject are listed in Table 9.1.
It is proposed to use set intervals of 80g/day of fruit and vegetablesfor the elaboration of the distributional transition. This amount has beenestimated in nutritional studies to be equivalent to approximately oneserving of fruit and vegetables and would constitute a plausible and fea-sible change for individuals towards the selected counterfactual level(World Cancer Research Fund and American Institute for CancerResearch 1997).
Most studies to date that have investigated the relationship betweenfruit and vegetable intake and risk of diseases were performed on pop-ulations that reported only a relatively narrow range of intake which inmost cases did not reach the selected theoretical-minimum-risk distribu-tion. As a result, it is not possible to know whether the same relativerisks would apply in populations where high amounts are consumed. Itis expected that future epidemiological studies incorporating populationswith wider range of intakes, such as the European Prospective Investi-gation of Cancer (EPIC) study, may shed light on the impact of high fruitand vegetable intakes (higher than those investigated in current studies)on the risk of cardiovascular disease and cancer.
Karen Lock et al. 601
Table 9.1 Theoretical-minimum-risk distribution by age group
Theoretical-minimum-risk distribution and SDAge group (years) (fruit and vegetable intake g/person per day)
0–4 330 ± 50
5–14 480 ± 50
15–29 600 ± 50
30–44 600 ± 50
45–59 600 ± 50
60–69 600 ± 50
70–79 600 ± 50
≥80 600 ± 50

2. Estimating risk factor levels
2.1 Methods
The methods used to obtain estimates of risk factor levels are describedin the following sections.
2.2 Criteria for considering sources and studies
POTENTIAL SOURCES OF DATA ON INTAKE AND SUPPLY
Data on dietary intake and supply of fruit and vegetables may be avail-able at the national, household and individual level. The following sub-sections briefly describe these potential sources of information andwhether they were used for the CRA project.
National level
The most commonly used source of information at the national level isfood balance sheet data published by the Food and Agriculture Organi-zation of the United Nations (FAO) for over 175 countries (1983). Foodbalance sheets provide standardized estimates of the average amount offood available per person on a daily basis. They are calculated by esti-mating the quantity of food produced in a given country added to thequantity of food imported (adjusted for changes in stocks), and sub-tracting the food exported, lost in storage, transport, and processing, fedto livestock or used for seeds and non-dietary purposes. The estimatednational food supply is then divided by population size estimates toderive per capita figures (in kg/person per year). The main limitation offood balance statistics is that they tend to reflect national food avail-ability patterns rather than actual dietary intake and are thus a reflec-tion of both intake and wastage at the retail, food service and householdlevels (Kantor et al. 1997). As a result, they cannot provide informationon the dietary intake of different population subgroups and they tend tooverestimate food consumption, particularly in developed countries.However, time trends in food availability tend to parallel those observedwith household surveys (Sekula et al. 1991), so FAO food balance sheetsconstitute a useful tool for international comparisons and time trendanalysis.
Household level
Household-based surveys, where the unit of measurement is the house-hold rather than the individual, are often performed to explore the diver-sity of food consumption patterns among communities. They can giveinformation about dietary patterns of groups, making distinctionsbetween geographical regions, income brackets and family structures.The most frequently used types of household surveys are the foodaccount method, the inventory method, the household food record
602 Comparative Quantification of Health Risks
method and the list-recall method (Nelson and Bingham 1997). House-hold surveys have several limitations: they cannot provide informationon individuals; they are subject to sampling errors; they sometimesexclude foods consumed outside the home or certain food groups (e.g.sweets, alcoholic beverages, etc.); and some methods are subject to recallbias. In addition, they are available for only a limited number of coun-tries and the diversity of the methods used make international compar-isons difficult. Due to these limitations, data from household surveyswere not used in this project.
Individual level
It is generally agreed that there is a considerable lack of internationallycomparable data at an individual level. This is partly due to the diffi-culties associated with measuring the dietary intake of individuals,including potential measurement error and bias. In spite of this, data col-lected at the individual level provide invaluable information on the meandietary intakes of population subgroups (e.g. stratified by age and sex)and variability in intakes. They are thus essential for stratified intake estimates.
Data on present or recent food consumption are collected using fourmain techniques: (i) the 24-hour recall; (ii) food records (with or withoutweighing of foods); (iii) food frequency questionnaires; and (iv) foodhistory. Details of these methods and their limitations can be found elsewhere (Nelson and Bingham 1997; Willett 1998a). The choice of amethod to collect data at the individual level will normally depend onthe objectives of the study and on the resources available. When the mainobjective is to obtain the mean consumption of a large group of indi-viduals, it is generally sufficient to use a single 24-hour recall or a one-day food record. This approach is often used in large national surveysof dietary intake as it represents a relatively small burden for the respon-dents and is associated with relatively low costs. The main caveat ofusing only one day of information is that it tends to artificially increasethe standard deviation of the estimates due to large intra-individual vari-ation in intakes (Cameron and van Staveren 1988). Thus, the observeddistribution of intakes has extreme values that are higher and lower thanany of the true long-term averages for any individual. Including severaldays of data collection for each respondent will normally dampen day-to-day variation, but it will also increase the burden on the respondentsand the costs. If the objective of the study is to assess the distribution offood consumption in a group or the position of an individual’s intakewithin the population, more complex methods such as repeated 24-hourrecalls or food records, food frequency questionnaires or dietary historyare needed. These approaches have been used mostly in cohort studiesor smaller, more focused surveys of dietary intake; they have less fre-quently been used in national surveys of dietary intake.
Karen Lock et al. 603
SOURCES OF DATA USED IN THIS PROJECT
Only dietary surveys with data collected at the individual level canprovide information on mean intakes and variability in intakes (standarddeviations) in population subgroups. Thus, we set out to identify datafrom at least one valid and representative population-based survey ofdietary intake for each of the 191 countries covered by the CRA.
However, this was not realistically possible as currently only a fewcountries (mainly economically developed) have conducted representa-tive national or regional surveys of dietary intake at the individual level,and a few others have performed surveys in selected sections of the population only. Conversely, for the majority of countries in the world,yearly estimates of available food supply exist in the form of the FAOfood balance sheets. These food balance sheets were used to complementdata collected at the individual level, when required. The methods usedand the subregions to which they were applied are described in section2.5.
CRITERIA FOR INCLUDING SOURCES OF INDIVIDUAL LEVEL DATA
The main criteria used for including sources of individual level data offruit and vegetable intake were as follows:
Time frame
• The study was relatively recent—defined as having been performedsince 1980.
Study sample
• The reference population was described.
• The sampling strategy was as close as possible to random sampling.
• The sample was representative of the reference population.
• The sample size was large (sample size calculation ideally included).
• As wide an age range as possible was included.
• The level of non-response was ideally documented.
Study design
• Only population-based cross-sectional studies, baseline assessment oflarge cohort studies (sample representative of the general population)or large interventions (sample representative of the general popula-tion) were considered for inclusion.
• Case–control studies were excluded from the selection process.
Validity of the methods
• The methods used to collect data were as free of bias as possible.
604 Comparative Quantification of Health Risks
• Data were collected at the level of the individual.
• The statistical analysis of the data was appropriate.
Type of dietary information
• Data on fruit and vegetable intake had to be available as grams perday and not as frequencies (e.g. <1 serving a day, 1–2 servings a day,every day, etc.).
2.3 Search strategy for the identification of studies
Dietary intake data were identified using a comprehensive worldwidesearch which included computerized databases of published articles,library catalogues, hand-searching of bibliographies, an Internet searchof possible sources of data, and extensive contact with experts in thefield, national governments and nongovernmental organizations.
COMPUTERIZED DATABASES AND LIBRARY SEARCH
The following computerized sources of information were included in thesearch process: Medline, CAB abstracts and Embase. MESH terms usedto search in Medline and HealthStar included “fruit”, “vegetables”,“nutrition-surveys”, “diet-surveys” and “food-habits” (each termincluded all subheadings). Similar search terms were used in the otherdatabases but adapted to the specific database search facilities. Thesearch was restricted to human studies published in all languages since1980.
Articles were rejected on initial screen if the reviewer could determinefrom the title and abstract that the article did not provide estimates offruit and vegetable intake of a population or did not report data from arepresentative population-based survey of dietary intake. When a title orabstract could not be rejected with certainty, the full text of the articlewas obtained for further evaluation. Citation lists in the articles retrievedwere reviewed. A second reviewer performed random checks.
The following catalogues were searched for other publications and conference proceedings that could provide appropriate data: the University of London; the British Library; the Resource Centre of thePublic Health Nutrition Unit at the London School of Hygiene and Trop-ical Medicine; Libraries at FAO, Rome and the Ministry of Agriculture,United Kingdom of Great Britain and Northern Ireland. Food and Fish-eries were also consulted. Citation lists in the documents retrieved werereviewed.
INTERNET SEARCHES
Internet searches (using the Google search engine—http://www.google.com) had two objectives: to locate original sources of food intakedata available on the Internet, and to identify national and internationalorganizations that could identify possible data sources including acade-
Karen Lock et al. 605
mic departments of nutrition or dietetics, food and nutrition agenciesand ministries of health.
Messages requesting help in identifying data sources were also postedto four scientific mailing lists: [email protected] (nutritional epidemiology); [email protected] (nutrition); [email protected] (public health); and [email protected](epidemiology).
CONTACTS WITH EXPERTS
Numerous direct contacts were made with nutrition officers from theWorld Health Organization (WHO) regional offices and experts for ref-erences to published or unpublished data sources or for the identifica-tion of appropriate contact persons. Experts were defined as contactauthors for large population-based studies of dietary intake, or contactpersons in governmental agencies or country-specific nutrition organiza-tions (this included existing networks from WHO and the InternationalObesity Task Force, and other international nutritional networks).
2.4 Methods for obtaining estimates of national intakewhere more than one data source exists
The following hierarchy of data quality was used to select one source of data for a given country where more than one was available:
• national survey of individual dietary intake;
• large sample survey of good quality—its quality being assessed fromhow well the survey met the list of criteria for including sources ofindividual level data (section 2.2); and
• small sample survey of good quality—its quality being assessed asabove.
2.5 Methods for obtaining estimates where no data source existed
DATA ON MEAN INTAKES NOT AVAILABLE FOR SOME AGE OR SEX GROUPS
Attempts were made to contact the original investigators to obtain databroken down by the required age categories. However, this was notalways possible and so indirect estimates were made using the followingapproaches.
DATA NOT AVAILABLE FOR CHILDREN
Few of the available dietary intake surveys had data for children aged<18 years. Extrapolations for the intakes of children were on the basisof two observations.
• Using data from the surveys collected for this project, it was estimatedthat boys and girls aged 5–14 years and those aged 0–4 years
606 Comparative Quantification of Health Risks
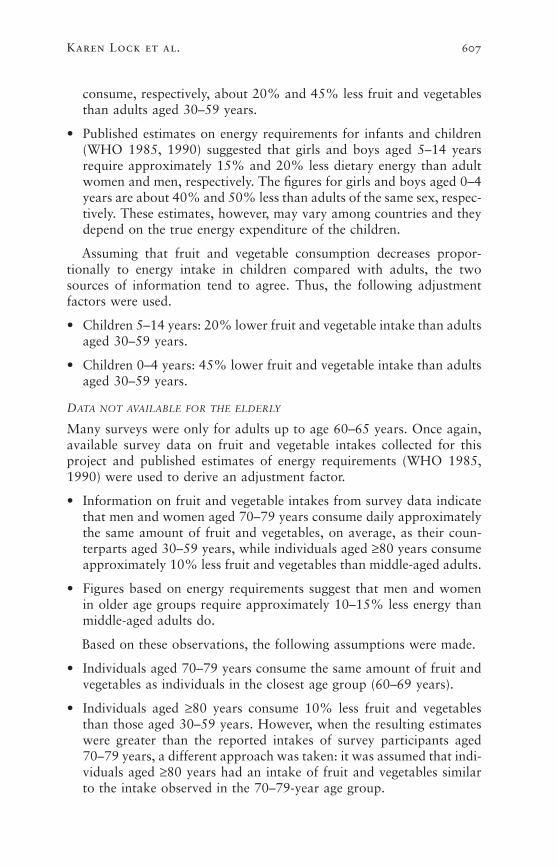
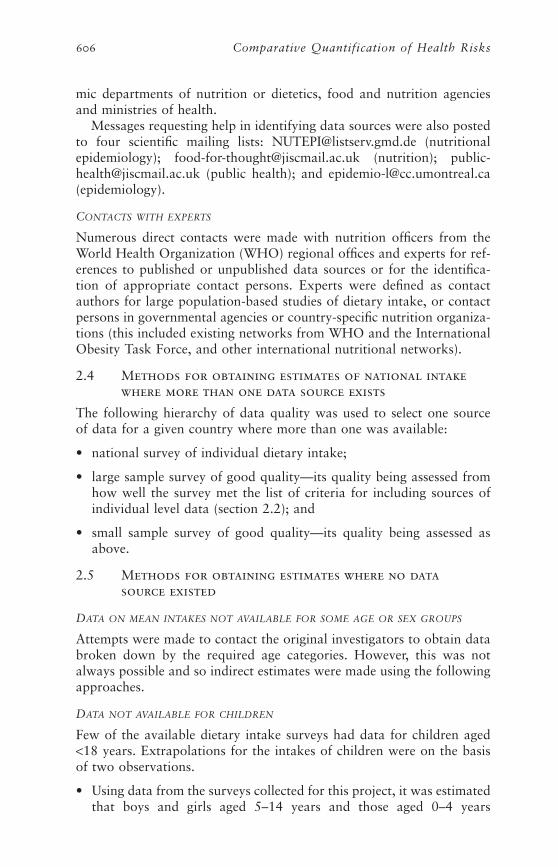
consume, respectively, about 20% and 45% less fruit and vegetablesthan adults aged 30–59 years.
• Published estimates on energy requirements for infants and children(WHO 1985, 1990) suggested that girls and boys aged 5–14 yearsrequire approximately 15% and 20% less dietary energy than adultwomen and men, respectively. The figures for girls and boys aged 0–4years are about 40% and 50% less than adults of the same sex, respec-tively. These estimates, however, may vary among countries and theydepend on the true energy expenditure of the children.
Assuming that fruit and vegetable consumption decreases propor-tionally to energy intake in children compared with adults, the twosources of information tend to agree. Thus, the following adjustmentfactors were used.
• Children 5–14 years: 20% lower fruit and vegetable intake than adultsaged 30–59 years.
• Children 0–4 years: 45% lower fruit and vegetable intake than adultsaged 30–59 years.
DATA NOT AVAILABLE FOR THE ELDERLY
Many surveys were only for adults up to age 60–65 years. Once again,available survey data on fruit and vegetable intakes collected for thisproject and published estimates of energy requirements (WHO 1985,1990) were used to derive an adjustment factor.
• Information on fruit and vegetable intakes from survey data indicatethat men and women aged 70–79 years consume daily approximatelythe same amount of fruit and vegetables, on average, as their coun-terparts aged 30–59 years, while individuals aged ≥80 years consumeapproximately 10% less fruit and vegetables than middle-aged adults.
• Figures based on energy requirements suggest that men and womenin older age groups require approximately 10–15% less energy thanmiddle-aged adults do.
Based on these observations, the following assumptions were made.
• Individuals aged 70–79 years consume the same amount of fruit andvegetables as individuals in the closest age group (60–69 years).
• Individuals aged ≥80 years consume 10% less fruit and vegetablesthan those aged 30–59 years. However, when the resulting estimateswere greater than the reported intakes of survey participants aged70–79 years, a different approach was taken: it was assumed that indi-viduals aged ≥80 years had an intake of fruit and vegetables similarto the intake observed in the 70–79-year age group.
Karen Lock et al. 607

CASES WHERE THE AGE GROUPS DID NOT CORRESPOND TO THE CRA AGE GROUPS
In these cases, the results available for the most similar age categories(greatest overlap of ages) were applied, weighing for population sizeswhen necessary.
DATA ON MEAN INTAKES AVAILABLE FOR ONLY ONE SEX OR FOR MEN AND
WOMEN TAKEN TOGETHER
In the case of Mexico, adult data were available only for women. In thecase of France, only the overall mean intakes by age group (men andwomen taken together) were accessible.
Using data available from the surveys gathered for this project, it wasestimated that, on average, men consume approximately only 1% morefruit and vegetables than women. It was thus assumed that Mexican andFrench males consume similar amounts of fruit and vegetables as do theirfemale counterparts.
DATA ON STANDARD DEVIATIONS NOT AVAILABLE
In some cases, survey information did not include standard deviationestimates. The authors of the studies were contacted and, for some coun-tries, the required estimates were provided. When this was not possible,the following assumptions were made.
• When standard deviations were missing for one or more age groupsand for one or more countries within a subregion (usually for chil-dren or the elderly), data were pooled based on the information avail-able (all countries with information for these age groups).
• When standard deviations for all age groups were missing for acountry, the standard deviations of the country—within the same sub-region—displaying the most similar mean intakes and method of datacollection were applied. For example, for the United Kingdom, thestandard deviations from Germany were used. However, since dataon sample size are required for the estimation of the pooled standarddeviation (and its confidence interval), pooled estimates were basedonly on the information available from the surveys.
DATA ON STANDARD DEVIATION AND SAMPLE SIZE NOT AVAILABLE FOR ALL
COUNTRIES IN A SUBREGION
For two subregions (SEAR-D and EMR-B), the survey data availableincluded only mean intakes. As a result, it was not possible to extrapo-late standard deviations from other countries within the same subregion.Thus, the pooled standard deviations of the subregion displaying theclosest subregional mean intakes were applied (EUR-C for SEAR-D andEUR-B for EMR-B).
Another approach for the extrapolation of missing standard devia-tions may have been to use the standard deviations of a subregion that
608 Comparative Quantification of Health Risks

is close geographically, that has similar economic characteristics, and forwhich data were available. For SEAR-D, for example, a possible choicemay have been to use the standard deviations of WPR-B. However, asthe standard deviations obtained for WPR-B are smaller than those ofEUR-C, we preferred to choose the largest standard deviations and thuskeep those obtained for EUR-C. For EMR-B, there was no obviouschoice among the subregions for which data were available and thus thestandard deviations of EUR-B were kept.
DATA ON MEAN INTAKES UNAVAILABLE FOR A SUBREGION
When survey data were unavailable for all countries within a subregion,it was originally planned to apply the results obtained for another sub-region displaying the most similar fruit and vegetable availability (fromFAO food balance sheets information) and demographic and health char-acteristics (using data from the World health report 2000 [WHO 2000],the World Bank classification of economies based on gross nationalproduct [World Bank 2000], and the CIA World Factbook [Directorateof Intelligence 2000]).
However, it became clear the dietary patterns and socioeconomic char-acteristics of the African country mortality groupings (AFR-D and AFR-E), and of the EMR-D, SEAR-B and AMR-D groupings are too differentfrom those found in the other subregions to allow for any correct extrap-olation. We have thus used FAO food balance sheet data combined withsurvey information to obtain FAO-derived proxy mean intakes by agegroup and sex for the five subregions for which no individual survey datawere identified (as described in the next section). We concluded that thisapproach was likely to provide more representative estimates of meansubregional fruit and vegetable intakes than extrapolations from othersubregions, as the basis of the calculations was information collecteddirectly from within each country within the subregion, that is, country-specific FAO food balance sheet data.
Obtaining FAO-derived proxy mean intakes
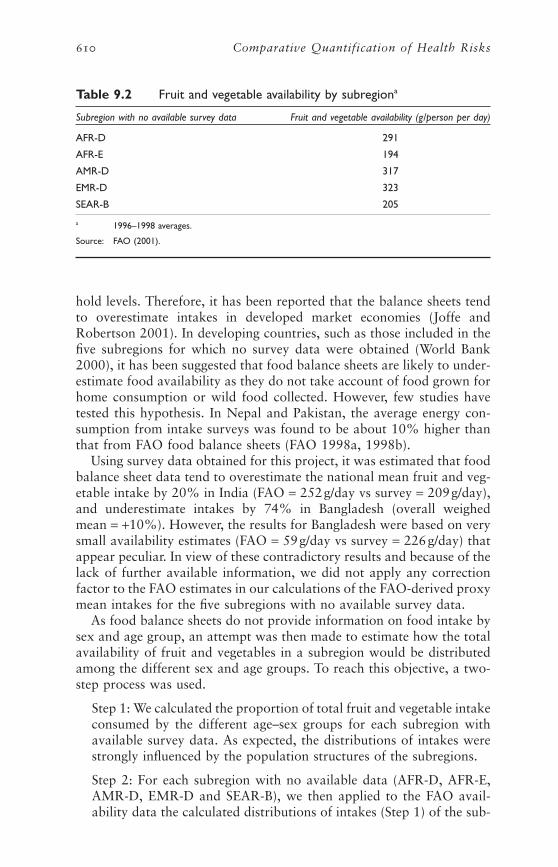
Country-specific data on availability of fruit (excluding wine—FAO code2919) and vegetables (excluding potato—FAO code 2918) and popula-tion size estimates were downloaded from the FAOstat database on theFAO web site (FAO 1998a). Three-year averages (1996–1998) were cal-culated in order to reduce the effect of yearly variations. These data werethen used to calculate subregional population-weighted average fruit andvegetable availability in grams/person per day. For seven relatively smallcountries, no estimates were available (Bahrain, Bhutan, EquatorialGuinea, Oman, Qatar, Samoa, Singapore). Estimates of calculated sub-regional food availability (1996–1998) are listed in Table 9.2.
As mentioned in section 2.2, food balance sheets provide informationon the amounts of foods available for the consumers and are thus areflection of both intake and waste at the retail, food service and house-
Karen Lock et al. 609
hold levels. Therefore, it has been reported that the balance sheets tendto overestimate intakes in developed market economies (Joffe andRobertson 2001). In developing countries, such as those included in thefive subregions for which no survey data were obtained (World Bank2000), it has been suggested that food balance sheets are likely to under-estimate food availability as they do not take account of food grown forhome consumption or wild food collected. However, few studies havetested this hypothesis. In Nepal and Pakistan, the average energy con-sumption from intake surveys was found to be about 10% higher thanthat from FAO food balance sheets (FAO 1998a, 1998b).
Using survey data obtained for this project, it was estimated that foodbalance sheet data tend to overestimate the national mean fruit and veg-etable intake by 20% in India (FAO = 252g/day vs survey = 209g/day),and underestimate intakes by 74% in Bangladesh (overall weighedmean = +10%). However, the results for Bangladesh were based on verysmall availability estimates (FAO = 59g/day vs survey = 226g/day) thatappear peculiar. In view of these contradictory results and because of thelack of further available information, we did not apply any correctionfactor to the FAO estimates in our calculations of the FAO-derived proxymean intakes for the five subregions with no available survey data.
As food balance sheets do not provide information on food intake bysex and age group, an attempt was then made to estimate how the totalavailability of fruit and vegetables in a subregion would be distributedamong the different sex and age groups. To reach this objective, a two-step process was used.
Step 1: We calculated the proportion of total fruit and vegetable intakeconsumed by the different age–sex groups for each subregion withavailable survey data. As expected, the distributions of intakes werestrongly influenced by the population structures of the subregions.
Step 2: For each subregion with no available data (AFR-D, AFR-E,AMR-D, EMR-D and SEAR-B), we then applied to the FAO avail-ability data the calculated distributions of intakes (Step 1) of the sub-
610 Comparative Quantification of Health Risks
Table 9.2 Fruit and vegetable availability by subregiona
Subregion with no available survey data Fruit and vegetable availability (g/person per day)
AFR-D 291
AFR-E 194
AMR-D 317
EMR-D 323
SEAR-B 205
a 1996–1998 averages.
Source: FAO (2001).
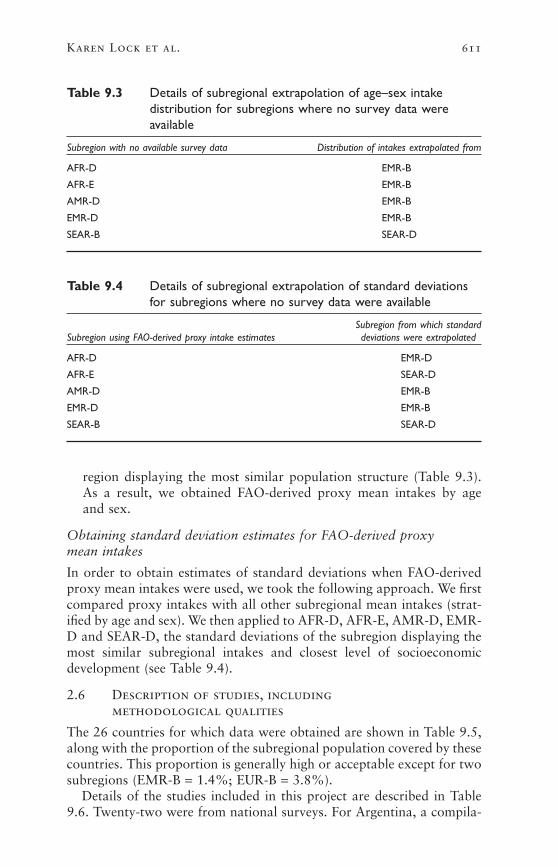
region displaying the most similar population structure (Table 9.3).As a result, we obtained FAO-derived proxy mean intakes by age and sex.
Obtaining standard deviation estimates for FAO-derived proxy mean intakes
In order to obtain estimates of standard deviations when FAO-derivedproxy mean intakes were used, we took the following approach. We firstcompared proxy intakes with all other subregional mean intakes (strat-ified by age and sex). We then applied to AFR-D, AFR-E, AMR-D, EMR-D and SEAR-D, the standard deviations of the subregion displaying themost similar subregional intakes and closest level of socioeconomicdevelopment (see Table 9.4).
2.6 Description of studies, including methodological qualities
The 26 countries for which data were obtained are shown in Table 9.5,along with the proportion of the subregional population covered by thesecountries. This proportion is generally high or acceptable except for twosubregions (EMR-B = 1.4%; EUR-B = 3.8%).
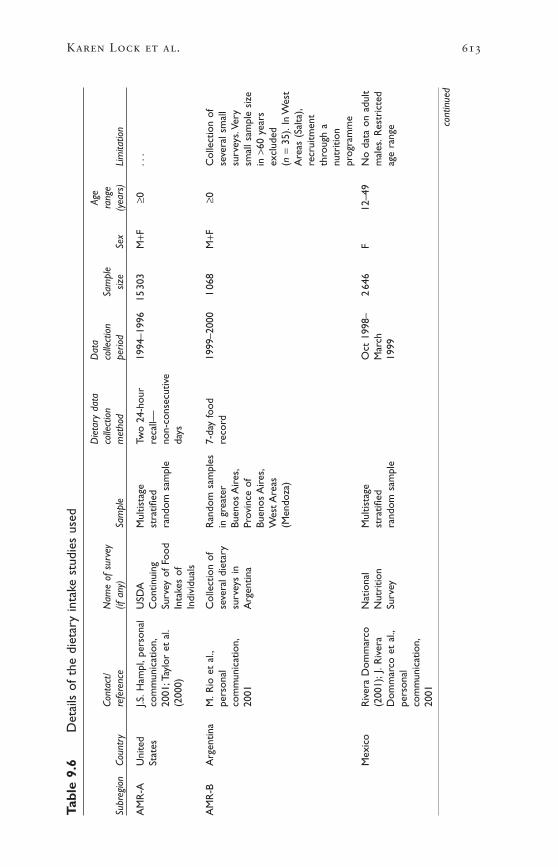
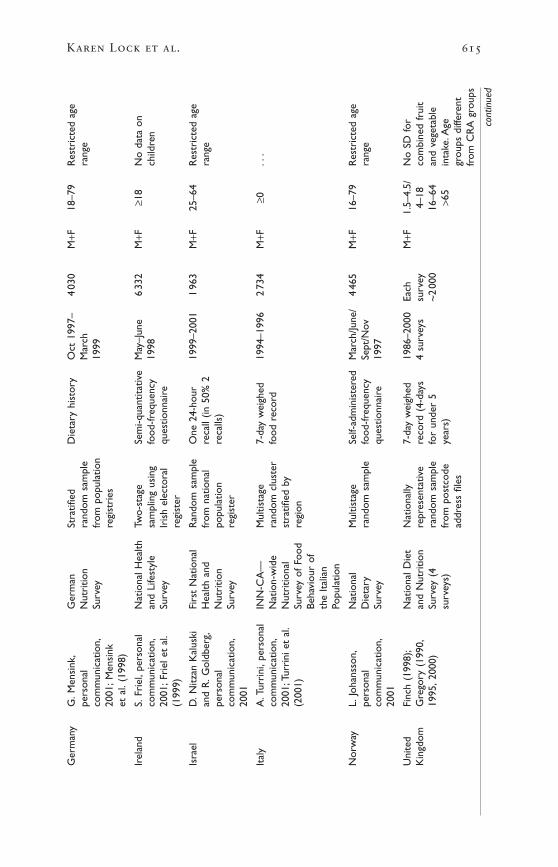
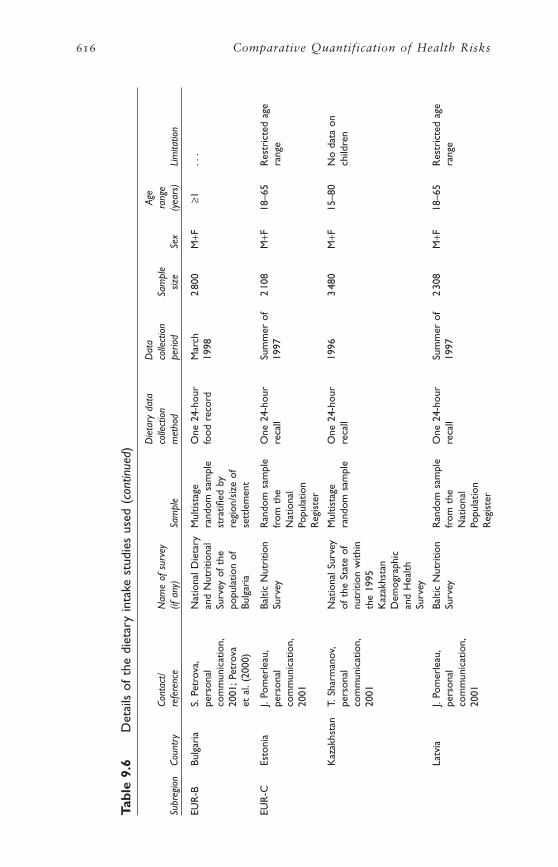
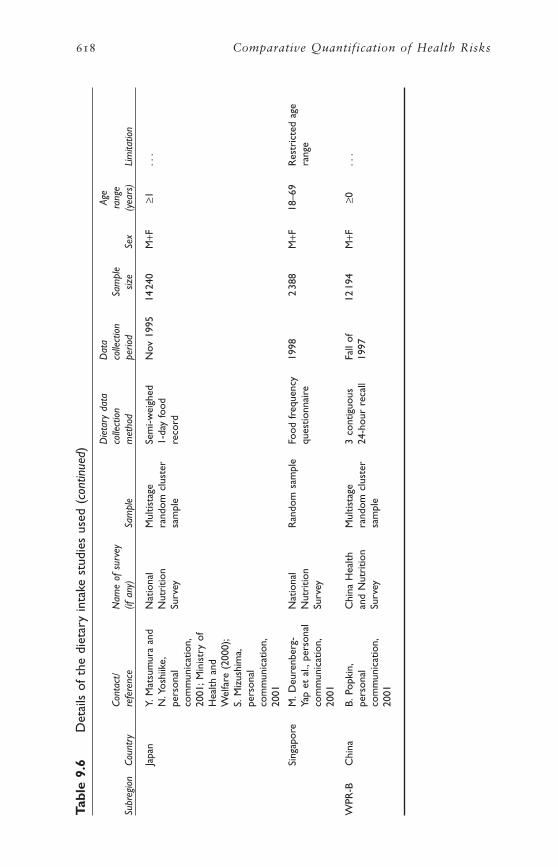
Details of the studies included in this project are described in Table9.6. Twenty-two were from national surveys. For Argentina, a compila-
Karen Lock et al. 611
Table 9.3 Details of subregional extrapolation of age–sex intakedistribution for subregions where no survey data wereavailable
Subregion with no available survey data Distribution of intakes extrapolated from
AFR-D EMR-B
AFR-E EMR-B
AMR-D EMR-B
EMR-D EMR-B
SEAR-B SEAR-D
Table 9.4 Details of subregional extrapolation of standard deviationsfor subregions where no survey data were available
Subregion from which standardSubregion using FAO-derived proxy intake estimates deviations were extrapolated
AFR-D EMR-D
AFR-E SEAR-D
AMR-D EMR-B
EMR-D EMR-B
SEAR-B SEAR-D

tion of small representative surveys was provided—these cover themajority of the country. All but two studies were from the 1990s. Moststudies used information from one 24-hour dietary recall or food diary.Other methods of data collection included multiple 24-hour recalls, 7-day weighed food records, food-frequency questionnaires and foodhistory. The majority of the surveys attempted to provide nationally rep-resentative samples; most used multistage random sampling techniques.Sample sizes ranged from about 1000 people (Argentina) to over 22 000(Belgium).
2.7 Characteristics of excluded studies
Due to the paucity of available information on fruit and vegetable intakeat the individual level, few studies were excluded. Reasons for exclusionincluded the following.
• Another source of data was used for the country (e.g. more representative sample of the population or better method of data collection).
• The amounts consumed in grams per day could not be derived fromthe survey.
612 Comparative Quantification of Health Risks
Table 9.5 Proportion of subregional population for which survey datawere obtained
Subregion Countries for which survey data were available % of subregional populationa
AFR-D — —
AFR-E — —
AMR-A United States 87.5
AMR-B Argentina, Mexico 32.0
AMR-D — —
EMR-B Kuwait 1.4
EMR-D — —
EUR-A Belgium, Denmark, Finland, France, Germany, 71.3Ireland, Israel, Italy, Norway, United Kingdom
EUR-B Bulgaria 3.8
EUR-C Estonia, Kazakhstan, Latvia, Lithuania, Russian 69.2Federation
SEAR-B — —
SEAR-D Bangladesh, India 93.7
WPR-A Australia, Japan, Singapore 97.6
WPR-B China 84.0
— No data.a Percentage of subregional population covered by countries for which survey data were obtained.
Karen Lock et al. 613
Tabl
e 9.
6D
etai
ls o
f th
e di
etar
y in
take
stu
dies
use
d
Die
tary
dat
aD
ata
Age
Cont
act/
Nam
e of
sur
vey
colle
ctio
nco
llect
ion
Sam
ple
rang
eSu
breg
ion
Coun
try
refe
renc
e(if
any
)Sa
mpl
em
etho
dpe
riod
size
Sex
(yea
rs)
Lim
itatio
n
AM
R-A
Uni
ted
J.S.H
ampl
,per
sona
lU
SDA
Mul
tista
geTw
o 24
-hou
r19
94–1
996
1530
3M
+F≥0
...
Stat
esco
mm
unic
atio
n,C
ontin
uing
stra
tified
reca
ll—20
01;T
aylo
r et
al.
Surv
ey o
f Fo
odra
ndom
sam
ple
non-
cons
ecut
ive
(200
0)In
take
s of
days
Indi
vidu
als
AM
R-B
Arg
entin
aM
.Rio
et
al.,
Col
lect
ion
ofR
ando
m s
ampl
es7-
day
food
1999
–200
01
068
M+F
≥0C
olle
ctio
n of
pers
onal
seve
ral d
ieta
ryin
gre
ater
reco
rdse
vera
l sm
all
com
mun
icat
ion,
surv
eys
inBu
enos
Air
es,
surv
eys.
Very
2001
Arg
entin
aPr
ovin
ce o
fsm
all s
ampl
e si
zeBu
enos
Air
es,
in >
60 y
ears
Wes
t Are
asex
clud
ed(M
endo
za)
(n=
35).
In W
est
Are
as (
Salta
),re
crui
tmen
tth
roug
h a
nutr
ition
prog
ram
me
Mex
ico
Riv
era
Dom
mar
coN
atio
nal
Mul
tista
geO
ct 1
998–
264
6F
12–4
9N
o da
ta o
n ad
ult
(200
1);J
.Riv
era
Nut
ritio
nst
ratifi
edM
arch
mal
es.R
estr
icte
dD
omm
arco
et
al.,
Surv
eyra
ndom
sam
ple
1999
age
rang
epe
rson
alco
mm
unic
atio
n,20
01
cont
inue
d

614 Comparative Quantification of Health Risks
Tabl
e 9.
6D
etai
ls o
f th
e di
etar
y in
take
stu
dies
use
d (c
ontin
ued)
Die
tary
dat
aD
ata
Age
Cont
act/
Nam
e of
sur
vey
colle
ctio
nco
llect
ion
Sam
ple
rang
eSu
breg
ion
Coun
try
refe
renc
e(if
any
)Sa
mpl
em
etho
dpe
riod
size
Sex
(yea
rs)
Lim
itatio
n
EMR
-BK
uwai
tSa
way
a et
al.
Kuw
ait T
otal
Mul
tista
geO
ne 2
4-ho
ur19
976
700
M+F
≥0N
o st
anda
rd(1
999)
Die
t st
udy
sam
ple
ofre
call
devi
atio
nsK
uwat
i nat
iona
ls
EUR
-ABe
lgiu
mS.
De
Hen
auw
,Be
lgia
nR
ando
m s
ampl
eO
ne 2
4-ho
ur19
80–1
984
2222
4M
+F25
–74
Res
tric
ted
pers
onal
Inte
runi
vers
ityfo
rm v
otin
g lis
tsre
call
age
rang
eco
mm
unic
atio
n,R
esea
rch
onin
42
out
of 4
320
01;D
e H
enau
wN
utri
tion
and
Belg
ian
dist
rict
san
d D
e Ba
cker
Hea
lth(1
999)
Den
mar
kA
nder
sen
et a
l.D
ieta
ry H
abits
Ran
dom
sam
ple
7-da
y fo
odFe
b/M
arch
/3
098
M+F
1–79
Res
tric
ted
age
(199
6);S
.Fag
t,in
Den
mar
kfr
om D
anis
hre
cord
Apr
il 19
95ra
nge
pers
onal
civi
l reg
istr
atio
nco
mm
unic
atio
n,sy
stem
2001
Finl
and
Find
iet
Stud
yD
ieta
ry s
urve
yA
ge-s
trat
ified
One
24-
hour
Jan–
Apr
il3
153
M+F
25–7
4R
estr
icte
d ag
eG
roup
(19
98)
of F
inni
sh a
dults
rand
om s
ampl
ere
call
1997
rang
ein
5 r
egio
ns
Fran
ceVo
latie
r (1
999)
INC
A:E
nquê
teSt
ratifi
ed7-
day
food
Aug
199
8–3
003
M+F
≥3M
eans
for
mal
esIn
divi
duel
le e
tna
tiona
lre
cord
June
199
9an
d fe
mal
esN
atio
nale
sur
mul
tista
gejo
intly
.No
les
rand
om s
ampl
est
anda
rdC
onso
mm
atio
nsde
viat
ions
Alim
enta
ires
Karen Lock et al. 615
Ger
man
yG
.Men
sink
,G
erm
anSt
ratifi
edD
ieta
ry h
isto
ryO
ct 1
997–
403
0M
+F18
–79
Res
tric
ted
age
pers
onal
Nut
ritio
nra
ndom
sam
ple
Mar
chra
nge
com
mun
icat
ion,
Surv
eyfr
om p
opul
atio
n19
9920
01;M
ensi
nkre
gist
ries
et a
l.(1
998)
Irel
and
S.Fr
iel,
pers
onal
Nat
iona
l Hea
lthTw
o-st
age
Sem
i-qua
ntita
tive
May
–Jun
e6
332
M+F
≥18
No
data
on
com
mun
icat
ion,
and
Life
styl
esa
mpl
ing
usin
gfo
od-fr
eque
ncy
1998
child
ren
2001
;Fri
el e
t al
.Su
rvey
Iris
h el
ecto
ral
ques
tionn
aire
(199
9)re
gist
er
Isra
elD
.Nitz
an K
alus
kiFi
rst
Nat
iona
lR
ando
m s
ampl
eO
ne 2
4-ho
ur19
99–2
001
196
3M
+F25
–64
Res
tric
ted
age
and
R.G
oldb
erg,
Hea
lth a
ndfr
om n
atio
nal
reca
ll (in
50%
2ra
nge
pers
onal
Nut
ritio
npo
pula
tion
reca
lls)
com
mun
icat
ion,
Surv
eyre
gist
er20
01
Ital
yA
.Tur
rini
,per
sona
lIN
N-C
A—
Mul
tista
ge7-
day
wei
ghed
1994
–199
62
734
M+F
≥0..
.co
mm
unic
atio
n,N
atio
n-w
ide
rand
om c
lust
erfo
od r
ecor
d20
01;T
urri
ni e
t al
.N
utri
tiona
lst
ratifi
ed b
y(2
001)
Surv
ey o
f Fo
odre
gion
Beha
viou
r of
the
Ital
ian
Popu
latio
n
Nor
way
L.Jo
hans
son,
Nat
iona
lM
ultis
tage
Self-
adm
inis
tere
dM
arch
/June
/4
465
M+F
16–7
9R
estr
icte
d ag
epe
rson
alD
ieta
ryra
ndom
sam
ple
food
-freq
uenc
ySe
pt/N
ovra
nge
com
mun
icat
ion,
Surv
eyqu
estio
nnai
re19
9720
01
Uni
ted
Finc
h (1
998)
;N
atio
nal D
iet
Nat
iona
lly7-
day
wei
ghed
1986
–200
0Ea
chM
+F1.
5–4.
5/N
o SD
for
Kin
gdom
Gre
gory
(19
90,
and
Nut
ritio
nre
pres
enta
tive
reco
rd (
4-da
ys4
surv
eys
surv
ey4–
18co
mbi
ned
frui
t19
95,2
000)
Surv
ey (
4ra
ndom
sam
ple
for
unde
r 5
~2
000
16–6
4an
d ve
geta
ble
surv
eys)
from
pos
tcod
eye
ars)
>65
inta
ke.A
gead
dres
s fil
esgr
oups
diff
eren
tfr
om C
RA
gro
ups
cont
inue
d
616 Comparative Quantification of Health Risks
Tabl
e 9.
6D
etai
ls o
f th
e di
etar
y in
take
stu
dies
use
d (c
ontin
ued)
Die
tary
dat
aD
ata
Age
Cont
act/
Nam
e of
sur
vey
colle
ctio
nco
llect
ion
Sam
ple
rang
eSu
breg
ion
Coun
try
refe
renc
e(if
any
)Sa
mpl
em
etho
dpe
riod
size
Sex
(yea
rs)
Lim
itatio
n
EUR
-BBu
lgar
iaS.
Petr
ova,
Nat
iona
l Die
tary
Mul
tista
geO
ne 2
4-ho
urM
arch
280
0M
+F≥1
...
pers
onal
and
Nut
ritio
nal
rand
om s
ampl
efo
od r
ecor
d19
98co
mm
unic
atio
n,Su
rvey
of
the
stra
tified
by
2001
;Pet
rova
popu
latio
n of
regi
on/s
ize
ofet
al.
(200
0)Bu
lgar
iase
ttle
men
t
EUR
-CEs
toni
aJ.
Pom
erle
au,
Balti
c N
utri
tion
Ran
dom
sam
ple
One
24-
hour
Sum
mer
of
210
8M
+F18
–65
Res
tric
ted
age
pers
onal
Surv
eyfr
om t
here
call
1997
rang
eco
mm
unic
atio
n,N
atio
nal
2001
Popu
latio
nR
egis
ter
Kaz
akhs
tan
T.Sh
arm
anov
,N
atio
nal S
urve
yM
ultis
tage
One
24-
hour
1996
348
0M
+F15
–80
No
data
on
pers
onal
of t
he S
tate
of
rand
om s
ampl
ere
call
child
ren
com
mun
icat
ion,
nutr
ition
with
in20
01th
e 19
95K
azak
hsta
nD
emog
raph
ican
d H
ealth
Surv
ey
Latv
iaJ.
Pom
erle
au,
Balti
c N
utri
tion
Ran
dom
sam
ple
One
24-
hour
Sum
mer
of
230
8M
+F18
–65
Res
tric
ted
age
pers
onal
Surv
eyfr
om t
here
call
1997
rang
eco
mm
unic
atio
n,N
atio
nal
2001
Popu
latio
nR
egis
ter

Karen Lock et al. 617
cont
inue
d
Lith
uani
aJ.
Pom
erle
au,
Balti
c N
utri
tion
Ran
dom
sam
ple
One
24-
hour
Sum
mer
of
215
3M
+F18
–65
Res
tric
ted
age
pers
onal
Surv
eyfr
om t
here
call
1997
rang
eco
mm
unic
atio
n,N
atio
nal
2001
Popu
latio
nR
egis
ter
Rus
sian
B.Po
pkin
,R
ussi
anM
ultis
tage
One
24-
hour
Oct
199
8–9
593
M+F
≥0..
.Fe
dera
tion
pers
onal
Long
itudi
nal
rand
om c
lust
erre
call
Jan
1999
com
mun
icat
ion,
Mon
itori
ngsa
mpl
e20
01Su
rvey
SEA
R-D
Bang
lade
shA
hmad
and
Nut
ritio
nM
ultis
tage
One
24-
hour
1981
–198
24
904
M+F
1–≥7
0N
o st
anda
rdH
assa
n (1
982)
Surv
ey o
f R
ural
rand
om c
lust
erw
eigh
ed r
ecor
dde
viat
ion.
Age
Bang
lade
shsa
mpl
eby
tra
ined
grou
ps d
iffer
ent
diet
ary
from
CR
A g
roup
sin
vest
igat
or
Indi
aG
over
nmen
t of
Nat
iona
lVa
ried
sur
vey
One
24-
hour
1994
–199
6C
ompi
led
M+F
≥1N
o st
anda
rdIn
dia
(199
8)N
utri
tion
desi
gns
reca
llsu
rvey
sde
viat
ion.
Age
Mon
itori
ngof
18
grou
ps d
iffer
ent
Bure
au s
urve
ysst
ates
,4fr
om C
RA
gro
ups
(199
4) a
ndre
gion
sD
istr
ict
Nut
ritio
nPr
ofile
s(1
995–
1996
)
WPR
-AA
ustr
alia
K.B
aghu
rst
and
Nat
iona
lM
ultis
tage
One
24-
hour
Feb
1995
–13
858
M+F
≥2..
.S.
Rec
ord,
Die
tary
Sur
vey
stra
tified
reca
llM
arch
pers
onal
in A
ustr
alia
rand
om s
ampl
e19
96co
mm
unic
atio
n,20
01
618 Comparative Quantification of Health Risks
Tabl
e 9.
6D
etai
ls o
f th
e di
etar
y in
take
stu
dies
use
d (c
ontin
ued)
Die
tary
dat
aD
ata
Age
Cont
act/
Nam
e of
sur
vey
colle
ctio
nco
llect
ion
Sam
ple
rang
eSu
breg
ion
Coun
try
refe
renc
e(if
any
)Sa
mpl
em
etho
dpe
riod
size
Sex
(yea
rs)
Lim
itatio
n
Japa
nY.
Mat
sum
ura
and
Nat
iona
lM
ultis
tage
Sem
i-wei
ghed
Nov
199
514
240
M+F
≥1..
.N
.Yos
hiik
e,N
utri
tion
rand
om c
lust
er1-
day
food
pers
onal
Surv
eysa
mpl
ere
cord
com
mun
icat
ion,
2001
;Min
istr
y of
Hea
lth a
ndW
elfa
re (
2000
);S.
Miz
ushi
ma,
pers
onal
com
mun
icat
ion,
2001
Sing
apor
eM
.Deu
renb
erg-
Nat
iona
lR
ando
m s
ampl
eFo
od f
requ
ency
1998
238
8M
+F18
–69
Res
tric
ted
age
Yap
et a
l.,pe
rson
alN
utri
tion
ques
tionn
aire
rang
eco
mm
unic
atio
n,Su
rvey
2001
WPR
-BC
hina
B.Po
pkin
,C
hina
Hea
lthM
ultis
tage
3 co
ntig
uous
Fall
of12
194
M+F
≥0..
.pe
rson
alan
d N
utri
tion
rand
om c
lust
er24
-hou
r re
call
1997
com
mun
icat
ion,
Surv
eysa
mpl
e20
01
Karen Lock et al. 619
• The data were not representative of the population of the country.
• Estimates included potato.
2.8 Estimates by subregion, age and sex
OBTAINING SUBREGIONAL ESTIMATES FROM DIETARY SURVEY DATA
The following approach was used to obtain subregional estimates of fruit and vegetable intake using available data from individual dietarysurveys.
Obtaining estimates for subregions where data are available for two or more countries
In order to obtain subregional means and standard deviations (andobtain 95% confidence intervals for these estimates) when data wereavailable for two or more countries within a subregion, means and stan-dard deviations were pooled. It is assumed that each subregion is a strat-ified sample with the strata being countries.2 Because of the lack ofinformation on the shape of the distributions of intakes, it was alsoassumed that intakes follow a normal distribution (this assumption isdiscussed in more detail in section 2.8).
It is important to note that if there is substantial heterogeneity amongcountries in a subregion, these methods tend to underestimate the truestandard error of the pooled mean and pooled standard deviation. Inaddition, pooling is based on only a few countries within a subregion.We have thus assumed that the pooled subregional mean intakes andstandard deviations are representative of the true estimates, and that dif-ferences between the pooled estimates and estimates for which data arenot available would tend to cancel each other out. Finally, using data foronly a few countries may underestimate the true variation of intakeswithin a subregion. However, for most subregions with available data,a large proportion of the total subregional population was covered bythe surveys (see Table 9.5).
Obtaining estimates for subregions where data are available for only one country
In four subregions (AMR-A, EMR-B, EUR-B and WPR-B), only onesource of intake data was available. For AMR-A and WPR-B, the surveyswere conducted in the United States of America and China, respectively.As these countries represent 84–88% of the total subregional population(Table 9.4), it was assumed that intake data from these countries wererepresentative of subregional intakes. For EMR-B and EUR-B, however,the surveys were conducted in countries that represented only a verysmall proportion of the total subregional population (1.4% and 3.8%respectively). For this reason, a different approach based on poolingsurvey and FAO food balance sheet data was used.

EMR-B: First, FAO-derived proxy mean intakes for the subregion werecalculated using the method described previously (when no survey datawere available for a subregion). As it has been reported that FAO foodbalance sheet data tend to overestimate intakes in developed countries,a correction factor was applied to the subregional three-year averageFAO fruit and vegetable supply. The chosen correction factor corre-sponded to the difference between FAO food balance sheet data and sub-regional intake data for AMR-A. The subregional fruit and vegetablesupply in AMR-A is the closest to that observed in EMR-B. It wasassumed that the age–sex subregional distribution of intakes was similarto that observed in Kuwait. Second, the FAO-derived proxy mean intakeswere pooled with intake data from Kuwait to obtain mean intakes forEMR-B.
EUR-B: First, FAO-derived proxy mean intakes for the subregion was calculated using the methods described previously (when no surveydata were available for a subregion). As for EMR-B, a correction factorwas applied to the subregional three-year average FAO fruit and vegetable supply. The chosen correction factor corresponded to the dif-ference between FAO food balance sheet data and pooled survey datafor the subregion EUR-C (assumed to be the most similar in terms ofintakes, demographic and health characteristics). It was assumed that thedistribution of intakes among age–sex groups was similar to thatobserved in Bulgaria. Second, the FAO-derived proxy mean intakes werepooled with intake data from Bulgaria to obtain pooled mean intakesfor EUR-B.
FINAL ESTIMATES
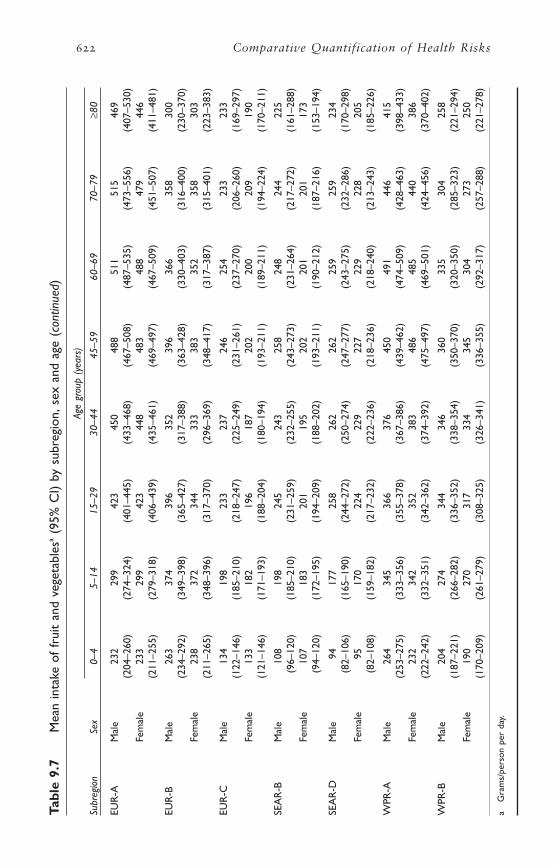
Estimates of fruit and vegetable intakes stratified by subregion, age andsex are given in Tables 9.8 to 9.11. Results are presented as means with95% CI for the mean, and as standard deviations with 95% CI for thestandard deviation.
Estimates of fruit and vegetable intakes were highest in EUR-A fol-lowed by WPR-A (Table 9.7). Surprisingly, reported intakes in AMR-A—the other highly economically developed subregion—are on averageonly 74–82% of those observed in EUR-A and WPR-A. The lowestintakes were found in AMR-B, EUR-C, SEAR-B, SEAR-D and AFR-E.As expected, intakes varied by age group, with children and the elderlygenerally having lower intakes than middle-aged adults. However, in afew subregions elderly individuals appeared to have higher intakes thanyounger adults do in our calculations. This was the case particularly forAFR-E, AFR-D and EMR-D, three groupings where FAO-derived proxymean intakes were calculated using the distribution of total intakes fromanother grouping with available data. Because the true age–sex distrib-ution of AFR-E, AFR-D and EMR-D is slightly different from that of thechosen proxy grouping, the calculation of mean intake within each
620 Comparative Quantification of Health Risks

Karen Lock et al. 621Ta
ble
9.7
Mea
n in
take
of
frui
t an
d ve
geta
bles
a(9
5% C
I) by
sub
regi
on,s
ex a
nd a
ge
Age
grou
p (y
ears
)
Subr
egio
nSe
x0–
45–
1415
–29
30–4
445
–59
60–6
970
–79
≥80
AFR
-DM
ale
144
296
288
413
419
439
446
476
(115
–173
)(2
72–3
20)
(256
–319
)(3
78–4
48)
(386
–452
)(4
03–4
76)
(404
–488
)(4
06–5
46)
Fem
ale
140
279
302
345
305
355
349
382
(113
–167
)(2
55–3
04)
(275
–328
)(3
08–3
81)
(271
–340
)(3
20–3
90)
(306
–392
)(3
02–4
62)
AFR
-EM
ale
9419
319
227
829
432
533
338
0(8
2–10
5)(1
81–2
05)
(178
–206
)(2
66–2
90)
(279
–309
)(3
09–3
41)
(306
–361
)(3
16–4
43)
Fem
ale
9118
120
123
621
425
724
424
5(7
8–10
3)(1
70–1
92)
(194
–209
)(2
29–2
43)
(205
–223
)(2
45–2
68)
(229
–259
)(2
25–2
66)
AM
R-A
Mal
e27
824
725
730
533
836
938
736
4(2
65–2
91)
(235
–259
)(2
40–2
74)
(288
–321
)(3
21–3
54)
(349
–390
)(3
61–4
13)
(323
–404
)Fe
mal
e26
223
623
426
130
733
534
634
8(2
51–2
74)
(224
–248
)(2
21–2
48)
(248
–274
)(2
92–3
21)
(318
–352
)(3
25–3
67)
(316
–380
)
AM
R-B
Mal
e72
147
148
168
208
220
230
180
(42–
103)
(104
–189
)(1
24–1
71)
(143
–194
)(1
48–2
68)
(160
–280
)(1
71–2
90)
(120
–239
)Fe
mal
e82
134
167
218
204
220
235
230
(51–
112)
(78–
191)
(153
–182
)(1
11–3
24)
(153
–255
)(1
68–2
71)
(183
–286
)(1
78–2
81)
AM
R-D
Mal
e19
335
229
940
839
238
735
330
6(1
65–2
22)
(328
–376
)(2
68–3
30)
(372
–443
)(3
60–4
25)
(351
–424
)(3
11–3
95)
(236
–377
)Fe
mal
e19
233
931
633
228
732
828
724
1(1
65–2
20)
(315
–363
)(2
89–3
42)
(295
–368
)(2
53–3
21)
(293
–363
)(2
44–3
30)
(161
–322
)
EMR
-BM
ale
218
335
296
368
374
392
350
334
(189
–247
)(3
11–3
59)
(265
–327
)(3
33–4
04)
(341
–407
)(3
55–4
28)
(308
–392
)(2
64–4
04)
Fem
ale
218
327
323
362
346
392
336
319
(190
–245
)(3
03–3
51)
(297
–350
)(3
25–3
98)
(311
–380
)(3
57–4
27)
(293
–378
)(2
38–3
99)
EMR
-DM
ale
174
342
312
388
409
446
442
420
(145
–203
)(3
18–3
67)
(281
–343
)(3
53–4
24)
(376
–442
)(4
10–4
82)
(400
–485
)(3
50–4
90)
Fem
ale
174
333
348
352
319
385
372
409
(147
–201
)(3
08–3
57)
(322
–375
)(3
16–3
89)
(284
–353
)(3
50–4
20)
(329
–415
)(3
29–4
89)
cont
inue
d
622 Comparative Quantification of Health RisksTa
ble
9.7
Mea
n in
take
of
frui
t an
d ve
geta
bles
a(9
5% C
I) by
sub
regi
on,s
ex a
nd a
ge (
cont
inue
d)
Age
grou
p (y
ears
)
Subr
egio
nSe
x0–
45–
1415
–29
30–4
445
–59
60–6
970
–79
≥80
EUR
-AM
ale
232
299
423
450
488
511
515
469
(204
–260
)(2
74–3
24)
(401
–445
)(4
33–4
68)
(467
–508
)(4
87–5
35)
(473
–556
)(4
07–5
30)
Fem
ale
233
299
423
448
483
488
479
446
(211
–255
)(2
79–3
18)
(406
–439
)(4
35–4
61)
(469
–497
)(4
67–5
09)
(451
–507
)(4
11–4
81)
EUR
-BM
ale
263
374
396
352
396
366
358
300
(234
–292
)(3
49–3
98)
(365
–427
)(3
17–3
88)
(363
–428
)(3
30–4
03)
(316
–400
)(2
30–3
70)
Fem
ale
238
372
344
333
383
352
358
303
(211
–265
)(3
48–3
96)
(317
–370
)(2
96–3
69)
(348
–417
)(3
17–3
87)
(315
–401
)(2
23–3
83)
EUR
-CM
ale
134
198
233
237
246
254
233
233
(122
–146
)(1
85–2
10)
(218
–247
)(2
25–2
49)
(231
–261
)(2
37–2
70)
(206
–260
)(1
69–2
97)
Fem
ale
133
182
196
187
202
200
209
190
(121
–146
)(1
71–1
93)
(188
–204
)(1
80–1
94)
(193
–211
)(1
89–2
11)
(194
–224
)(1
70–2
11)
SEA
R-B
Mal
e10
819
824
524
325
824
824
422
5(9
6–12
0)(1
85–2
10)
(231
–259
)(2
32–2
55)
(243
–273
)(2
31–2
64)
(217
–272
)(1
61–2
88)
Fem
ale
107
183
201
195
202
201
201
173
(94–
120)
(172
–195
)(1
94–2
09)
(188
–202
)(1
93–2
11)
(190
–212
)(1
87–2
16)
(153
–194
)
SEA
R-D
Mal
e94
177
258
262
262
259
259
234
(82–
106)
(165
–190
)(2
44–2
72)
(250
–274
)(2
47–2
77)
(243
–275
)(2
32–2
86)
(170
–298
)Fe
mal
e95
170
224
229
227
229
228
205
(82–
108)
(159
–182
)(2
17–2
32)
(222
–236
)(2
18–2
36)
(218
–240
)(2
13–2
43)
(185
–226
)
WPR
-AM
ale
264
345
366
376
450
491
446
415
(253
–275
)(3
33–3
56)
(355
–378
)(3
67–3
86)
(439
–462
)(4
74–5
09)
(428
–463
)(3
98–4
33)
Fem
ale
232
342
352
383
486
485
440
386
(222
–242
)(3
32–3
51)
(342
–362
)(3
74–3
92)
(475
–497
)(4
69–5
01)
(424
–456
)(3
70–4
02)
WPR
-BM
ale
204
274
344
346
360
335
304
258
(187
–221
)(2
66–2
82)
(336
–352
)(3
38–3
54)
(350
–370
)(3
20–3
50)
(285
–323
)(2
21–2
94)
Fem
ale
190
270
317
334
345
304
273
250
(170
–209
)(2
61–2
79)
(308
–325
)(3
26–3
41)
(336
–355
)(2
92–3
17)
(257
–288
)(2
21–2
78)
aG
ram
s/pe
rson
per
day
.
age–sex strata and the balance among strata was affected. This isobserved particularly in the smaller age strata (particularly the elderly inthese subregions). As a result, the FAO-proxy mean intakes are less reli-able in population strata with relatively smaller sample size and must beinterpreted with caution.
Pooled standard deviation estimates were available from only sevensubregions (AMR-A, AMR-B, EUR-A, EUR-B, EUR-C, WPR-A andWPR-B). For the other subregions, we applied data from the subregiondisplaying the most similar intakes by age and sex, and when appropri-ate, method of data collection. These extrapolations need to be takenwith caution, as the standard deviations of one subregion may not rep-resent well the standard deviations of another subregion despite simi-larity in overall mean intakes. The results shown in Table 9.8 indicatethat standard deviations varied considerably by subregion, sex and agegroup, with an overall median standard deviation of 223g/day. Estimatestended to be lower in women than in men on average (but with varia-tions by age group), and they were generally lower in young children. Insome subregions, standard deviations were also slightly smaller in theelderly.
It is assumed that the reported fruit and vegetable intakes were nor-mally distributed, due to the general lack of available information on theskewness of the distributions (except for the United States). However,this is unlikely to be true as dietary intakes are typically skewed towardshigher values (Willett 1998b). Assuming a normal distribution createsthe problem that some individuals will be recorded as having negativeconsumption when estimating impact fractions. As this is impossible, thenormal distribution is truncated at zero, with all those falling below thisvalue allocated a value of zero. The results of a sensitivity analysis,described below, based on data from the United States suggest that theapproach used is likely to be conservative.
Sensitivity analysis: skewed distributions and calculation of the attributable fraction
Data from the United States were used to evaluate the possible effects ofskewness in the distribution of fruit and vegetable intake on the calcu-lation of the attributable fraction for AMR-A. The data indicated a pos-itive skewness ranging from 1.5 to 3. To approximate this type of skeweddistribution, the Weibull probability distribution function (PDF) was uti-lized by varying the shape and scale parameters (decreasing the shapeparameter of a Weibull increases positive skewness away from a normaldistribution).
Figure 9.1 illustrates a normal distribution (dashed line) with a fruitand vegetable mean intake of 300g/day and standard deviation of300g/day. A significant part of the population with a normal distribu-tion is truncated at zero consumption (approximately 10% of the population in this example). The skewed distribution (solid line) is the
Karen Lock et al. 623

624 Comparative Quantification of Health Risks
Tabl
e 9.
8St
anda
rd d
evia
tions
of
frui
t an
d ve
geta
bles
a(9
5% C
I) by
sub
regi
on,s
ex a
nd a
ge
Age
grou
p (y
ears
)
Subr
egio
nSe
x0–
45–
1415
–29
30–4
445
–59
60–6
970
–79
≥80
AFR
-DM
ale
175.
024
4.8
293.
122
5.0
220.
721
3.4
235.
121
4.6
(156
.7–1
98.2
)(2
28.7
–263
.3)
(272
.6–3
16.9
)(2
02.4
–253
.3)
(199
.6–2
46.8
)(1
90.4
–242
.8)
(208
.6–2
69.3
)(1
74.1
–279
.9)
Fem
ale
163.
324
0.8
247.
622
4.5
237.
421
0.5
251.
523
9.0
(146
.0–1
85.3
)(2
24.8
–259
.3)
(230
.2–2
67.9
)(2
01.2
–253
.9)
(215
.3–2
64.6
)(1
88.4
–238
.5)
(224
.4–2
86.1
)(1
92.8
–314
.6)
AFR
-EM
ale
96.2
178.
625
4.9
220.
723
1.5
192.
617
6.3
165.
8(8
8.6–
105.
3)(1
70.3
–187
.8)
(247
.5–2
62.7
)(2
14.7
–227
.1)
(224
.3–2
39.3
)(1
83.5
–202
.6)
(159
.9–1
96.4
)(1
30.0
–228
.9)
Fem
ale
105.
515
5.9
163.
415
7.6
171.
616
8.2
153.
511
5.4
(97.
3–11
5.3)
(148
.4–1
64.2
)(2
06.3
–222
.2)
(189
.6–2
02.3
)(1
66.9
–176
.5)
(161
.2–1
75.1
)(1
44.2
–164
.1)
(102
.5–1
32.0
)
AM
R-A
Mal
e23
9.0
221.
329
7.0
299.
329
7.8
295.
829
5.8
318.
7(2
30.2
–248
.4)
(213
.0–2
30.3
)(2
85.3
–309
.8)
(288
.0–3
11.5
)(2
86.5
–310
.0)
(282
.0–3
10.9
)(2
78.5
–315
.5)
(292
.5–3
50.1
)Fe
mal
e22
2.5
209.
123
0.4
236.
326
2.4
243.
322
2.8
243.
4(2
14.4
–231
.2)
(201
.1–2
17.8
)(2
21.2
–240
.5)
(227
.3–2
46.0
)(2
52.4
–273
.2)
(231
.6–2
56.2
)(2
09.1
–238
.4)
(222
.8–2
68.1
)
AM
R-B
Mal
e15
3.3
294.
347
0.1
260.
039
0.3
390.
339
0.3
390.
3(1
34.4
–178
.4)
(229
.8–4
09.4
)(4
38.2
–507
.0)
(210
.9–3
39.2
)(3
12.9
–518
.9)
(312
.9–5
18.9
)(3
12.9
–518
.9)
(312
.9–5
18.9
)Fe
mal
e16
0.2
341.
829
3.6
718.
226
0.5
260.
526
0.5
260.
5(1
41.2
–185
.2)
(250
.2–5
39.1
)(2
72.8
–317
.9)
(515
.0–1
185.
6)(1
90.7
–410
.8)
(190
.7–4
10.8
)(1
90.7
–410
.8)
(190
.7–4
10.8
)
AM
R-D
Mal
e17
5.0
244.
829
3.1
225.
022
0.7
213.
423
5.1
214.
6(1
56.7
–198
.2)
(228
.7–2
63.3
)(2
72.6
–316
.9)
(202
.4–2
53.3
)(1
99.6
–246
.8)
(190
.4–2
42.8
)(2
08.6
–269
.3)
(174
.1–2
79.9
)Fe
mal
e16
3.3
240.
824
7.6
224.
523
7.4
210.
525
1.5
239.
0(1
46.0
–185
.3)
(224
.8–2
59.3
)(2
30.2
–267
.9)
(201
.2–2
53.9
)(2
15.3
–264
.6)
(188
.4–2
38.5
)(2
24.4
–286
.1)
(192
.8–3
14.6
)
EMR
-BM
ale
175.
024
4.8
293.
122
5.0
220.
721
3.4
235.
121
4.6
(156
.7–1
98.2
)(2
28.7
–263
.3)
(272
.6–3
16.9
)(2
02.4
–253
.3)
(199
.6–2
46.8
)(1
90.4
–242
.8)
(208
.6–2
69.3
)(1
74.1
–279
.9)
Fem
ale
163.
324
0.8
247.
622
4.5
237.
421
0.5
251.
523
9.0
(146
.0–1
85.3
)(2
24.8
–259
.3)
(230
.2–2
67.9
)(2
01.2
–253
.9)
(215
.3–2
64.6
)(1
88.4
–238
.5)
(224
.4–2
86.1
)(1
92.8
–314
.6)
EMR
-DM
ale
175.
024
4.8
293.
122
5.0
220.
721
3.4
235.
121
4.6
(156
.7–1
98.2
)(2
28.7
–263
.3)
(272
.6–3
16.9
)(2
02.4
–253
.3)
(199
.6–2
46.8
)(1
90.4
–242
.8)
(208
.6–2
69.3
)(1
74.1
–279
.9)
Fem
ale
163.
324
0.8
247.
622
4.5
237.
421
0.5
251.
523
9.0
(146
.0–1
85.3
)(2
24.8
–259
.3)
(230
.2–2
67.9
)(2
01.2
–253
.9)
(215
.3–2
64.6
)(1
88.4
–238
.5)
(224
.4–2
86.1
)(1
92.8
–314
.6)

Karen Lock et al. 625
EUR
-AM
ale
347.
928
4.7
350.
331
2.2
345.
428
3.7
344.
628
9.7
(333
.9–3
63.1
)(2
73.9
–296
.4)
(341
.5–3
59.7
)(3
06.3
–318
.3)
(338
.6–3
52.5
)(2
75.9
–292
.0)
(332
.0–3
58.2
)(2
69.1
–314
.2)
Fem
ale
280.
422
6.2
290.
225
4.2
262.
426
5.8
317.
126
6.6
(269
.2–2
92.6
)(2
17.5
–235
.8)
(283
.2–2
97.4
)(2
52.0
–258
.9)
(257
.2–2
67.7
)(2
58.3
–273
.8)
(305
.1–3
30.1
)(2
50.1
–285
.8)
EUR
-BM
ale
175.
024
4.8
293.
122
5.0
220.
721
3.4
235.
121
4.6
(156
.7–1
98.2
)(2
28.7
–263
.3)
(272
.6–3
16.9
)(2
02.4
–253
.3)
(199
.6–2
46.8
)(1
90.4
–242
.8)
(208
.6–2
69.3
)(1
74.1
–279
.9)
Fem
ale
163.
324
0.8
247.
622
4.5
237.
421
0.5
251.
523
9.0
(146
.0–1
85.3
)(2
24.8
–259
.3)
(230
.2–2
67.9
)(2
01.2
–253
.9)
(215
.3–2
64.6
)(1
88.4
–238
.5)
(224
.4–2
86.1
)(1
92.8
–314
.6)
EUR
-CM
ale
96.2
178.
625
4.9
220.
723
1.5
192.
617
6.3
165.
8(8
8.6–
105.
3)(1
70.3
–187
.8)
(247
.5–2
62.7
)(2
14.7
–227
.1)
(224
.3–2
39.3
)(1
83.5
–202
.6)
(159
.9–1
96.4
)(1
30.0
–228
.9)
Fem
ale
105.
515
5.9
163.
415
7.6
171.
616
8.2
153.
511
5.4
(97.
3–11
5.3)
(148
.4–1
64.2
)(2
06.3
–222
.2)
(189
.6–2
02.3
)(1
66.9
–176
.5)
(161
.2–1
75.1
)(1
44.2
–164
.1)
(102
.5–1
32.0
)
SEA
R-B
Mal
e96
.217
8.6
254.
922
0.7
231.
519
2.6
176.
316
5.8
(88.
6–10
5.3)
(170
.3–1
87.8
)(2
47.5
–262
.7)
(214
.7–2
27.1
)(2
24.3
–239
.3)
(183
.5–2
02.6
)(1
59.9
–196
.4)
(130
.0–2
28.9
)Fe
mal
e10
5.5
155.
916
3.4
157.
617
1.6
168.
215
3.5
115.
4(9
7.3–
115.
3)(1
48.4
–164
.2)
(206
.3–2
22.2
)(1
89.6
–202
.3)
(166
.9–1
76.5
)(1
61.2
–175
.1)
(144
.2–1
64.1
)(1
02.5
–132
.0)
SEA
R-D
Mal
e96
.217
8.6
254.
922
0.7
231.
519
2.6
176.
316
5.8
(88.
6–10
5.3)
(170
.3–1
87.8
)(2
47.5
–262
.7)
(214
.7–2
27.1
)(2
24.3
–239
.3)
(183
.5–2
02.6
)(1
59.9
–196
.4)
(130
.0–2
28.9
)Fe
mal
e10
5.5
155.
916
3.4
157.
617
1.6
168.
215
3.5
115.
4(9
7.3–
115.
3)(1
48.4
–164
.2)
(206
.3–2
22.2
)(1
89.6
–202
.3)
(166
.9–1
76.5
)(1
61.2
–175
.1)
(144
.2–1
64.1
)(1
02.5
–132
.0)
WPR
-AM
ale
201.
420
4.9
255.
523
9.6
268.
027
8.1
249.
823
8.7
(190
.9–2
13.2
)(1
98.7
–206
.7)
(249
.4–2
61.9
)(2
34.2
–245
.3)
(261
.4–2
75.1
)(2
68.1
–288
.8)
(237
.8–2
63.1
)(2
20.0
–260
.9)
Fem
ale
158.
119
0.4
234.
222
9.8
260.
026
2.0
241.
421
7.3
(149
.8–1
67.4
)(1
84.6
–196
.7)
(228
.7–2
40.1
)(2
24.8
–235
.1)
(253
.7–2
66.6
)(2
52.9
–271
.7)
(231
.6–2
52.1
)(2
03.7
–232
.8)
WPR
-BM
ale
110.
113
6.1
161.
515
7.3
167.
716
7.1
141.
314
7.1
(99.
2–12
3.7)
(130
.7–1
42.0
)(1
55.9
–167
.5)
(151
.8–1
63.2
)(1
61.2
–174
.7)
(157
.1–1
78.4
)(1
29.1
–156
.0)
(125
.0–1
78.8
)Fe
mal
e10
7.5
146.
015
0.2
153.
216
1.9
148.
413
0.9
136.
2(9
5.4–
123.
1)(1
39.9
–152
.7)
(144
.6–1
56.3
)(1
48.1
–158
.7)
(155
.6–1
68.8
)(1
40.0
–157
.9)
(120
.6–1
43.2
)(1
18.6
–159
.9)
aG
ram
s/pe
rson
per
day
.
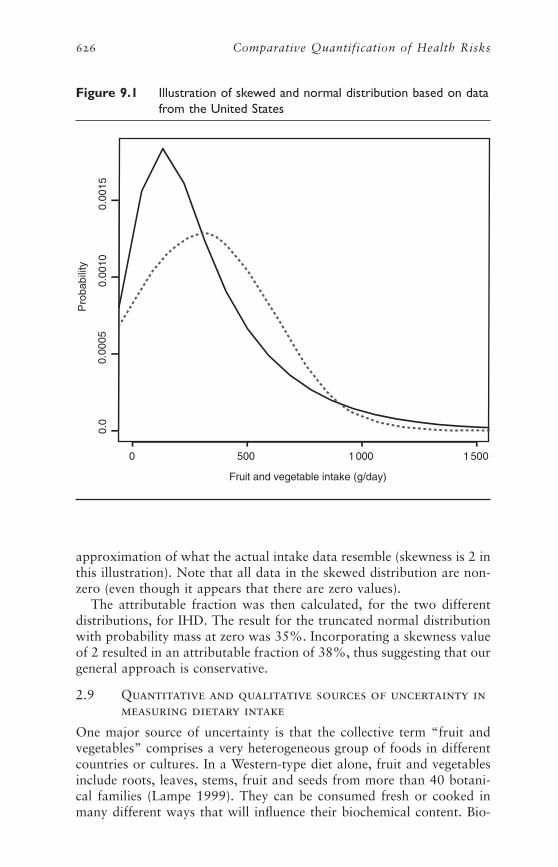
approximation of what the actual intake data resemble (skewness is 2 inthis illustration). Note that all data in the skewed distribution are non-zero (even though it appears that there are zero values).
The attributable fraction was then calculated, for the two differentdistributions, for IHD. The result for the truncated normal distributionwith probability mass at zero was 35%. Incorporating a skewness valueof 2 resulted in an attributable fraction of 38%, thus suggesting that ourgeneral approach is conservative.
2.9 Quantitative and qualitative sources of uncertainty inmeasuring dietary intake
One major source of uncertainty is that the collective term “fruit andvegetables” comprises a very heterogeneous group of foods in differentcountries or cultures. In a Western-type diet alone, fruit and vegetablesinclude roots, leaves, stems, fruit and seeds from more than 40 botani-cal families (Lampe 1999). They can be consumed fresh or cooked inmany different ways that will influence their biochemical content. Bio-
626 Comparative Quantification of Health Risks
Pro
babi
lity
0 500 1 000 1 500
0.0
0.00
100.
0015
0.00
05
Fruit and vegetable intake (g/day)
Figure 9.1 Illustration of skewed and normal distribution based on datafrom the United States
chemical composition also varies among different types of the same fruit.For example, the vitamin C content of different types of apple variestenfold. Composition is also subject to differences in growing conditions,such as soil composition, and storage conditions, a factor of increasingimportance as commodities are transported globally to ensure year-round supply in developed countries. It was decided to keep fruit andvegetables as a single entity for two main reasons. First, there remainsuncertainty as to which components of fruit and vegetables would confera protective effect. Even if the relevant effective constituents had beencorrectly identified, the nature of their relationship to disease risk wouldstill need to be correctly specified. Second, obtaining intake data for spe-cific foods (for this project) would have been even more difficult thanfor fruit and vegetables taken together.
Seasons also influence the amounts and variety of fruit and vegetablesconsumed. Indeed, evidence is emerging to link seasonality of consump-tion of fresh fruit and vegetables to the pattern of cardiovascular diseasemortality in some countries (Powles et al. 1996). It is possible that theconsequences for disease of an annual cycle of seasonal excesses and out-of-season shortages (as in the less economically developed countries ofthe former Soviet Union) may be quite different to the effects of con-suming a similar annual level where counter-seasonal supplies ensure thatthere is no period of very low consumption (as in the affluent countriesof north-west Europe). However, in the absence of information onnational variations in fruit and vegetable intake and epidemiological evi-dence, it was assumed that it is the long-term annualized average of fruitand vegetable intake that best predicts disease risk. The need for cautionis illustrated by the case of alcohol, where risk of cardiovascular diseaseappears to be more sensitive to the pattern of alcohol consumption overtime as well as the total amount consumed (Kauhanen et al. 1999; Rehmet al. 2001). It is also assumed that the estimates obtained for this projectrepresent annualized mean intakes, although some surveys collected dataduring only one or two seasons.
The choice of data sources may also have influenced the final esti-mates. It was decided that dietary surveys of representative populationsamples would be used as the primary source of information for thisproject. However, the quality and validity of individual level data dependon the ability (and willingness) of each individual to provide accurateinformation on his/her dietary intake (Johansson et al. 2001; Nelson andBingham 1997). If the aim is to assess current diet, the procedureinvolved in measuring dietary intake may lead to changes in behaviour.If the aim is to measure past diet, then the reliability of the informationprovided will depend on memory and on the conceptual abilities of therespondents. The high intakes observed in AMR-A and WPR-A suggestthat reported consumption could have been inflated by conscious (socialdesirability bias) or unconscious over-reporting of fruit and vegetableintake by the survey respondents (Hebert et al. 1995). The reported
Karen Lock et al. 627
intakes in some countries within these subregions are greater thanexpected. This is particularly the case for the United Kingdom andGermany where the estimated mean national fruit and vegetable con-sumption was higher than in Mediterranean countries such as Italy andIsrael. It is possible that recent public health campaigns, such as thosethat took place in Finland (Puska 2000), coupled with changes in theretail trade, and thus in marketing and distribution of fruit and vegeta-bles, have improved the dietary habits and increased the fruit and veg-etable intake of these populations. This would be consistent with thestriking improvements in cardiovascular mortality that they have expe-rienced. Conversely, it is possible that the inclusion of fruit juices in theestimates of fruit and vegetable intakes made the estimates appear largerthan expected. Other difficulties include the conversion of food fre-quencies into mean intakes in surveys that used food-frequency ques-tionnaires, and the limitations and completeness of the various foodanalysis software programs used in different countries. Finally, it is pos-sible that the survey respondents were not entirely representative of thereference populations, even though most data were from national surveysof dietary intakes.
In dietary surveys, variation as measured by standard deviations isinfluenced by the method used to collect data (see section 2.2). Most ofthe surveys used in this study were based on only one day (sometimestwo days) of information. It is thus expected that standard deviationswere overestimated. However, as described earlier, the method used topool data from two or more surveys tends to underestimate the level ofuncertainty surrounding the pooled standard deviation for the subregionbased on a subsample of countries if there is substantial between-countryvariation.
Although we aimed to obtain dietary survey data for each country,these do not exist and thus food availability statistics were used for sub-regions where no or few data were available. The validity of food balancesheet statistics depends on the availability and validity of the basicnational data on which they are based, including statistics of population,production, stock, import and export. These are known to vary amongcountries, and from one year to another, both in terms of coverage andaccuracy (Kelly et al. 1991). The net availability of vegetables is affectedby factors such as non-commercial production and uncertain losses toanimal feed, spoilage and waste. However, the FAO performs externalconsistency checking using supplementary information such as house-hold survey results as well as the application of relevant technical, nutri-tional and economic expertise in an attempt to eliminate these potentialdeficiencies. In this study we have used at least three years of FAO datain order to try to reduce the effect of potential yearly variations in cov-erage and accuracy. However, the current lack of information on adjust-ment factors to apply to FAO food balance sheet data in developingcountries is a source of uncertainty. Finally, extrapolation among coun-
628 Comparative Quantification of Health Risks
Karen Lock et al. 629
tries would be an important source of uncertainty, especially in the pres-ence of inter-country heterogeneity.
3. Estimating risk factor–diseaserelationships
3.1 Outcomes to be assessed, evidence of causality,excluded outcomes and reasons for exclusion
SELECTED OUTCOMES
The outcomes to be assessed are those for which the best evidence of arisk factor–disease relationship is available for fruit and vegetable intake.These include:
• IHD;
• cerebrovascular disease;
• lung cancer;
• stomach cancer;
• colon and rectum cancers; and
• oesophageal cancer.
EVIDENCE OF CAUSALITY AND EXCLUDED OUTCOMES
A general discussion of the evidence of causality for the association offruit and vegetable intake with health outcomes follows. Specific detailsof evidence for each outcome are included in section 3.7.
The choice of outcomes was guided mainly by previous reviews of theliterature, including those of Ness and Powles (1997) and Law andMorris (1998) that suggested a protective effect of fruit and vegetablesfor IHD and stroke. The review from the World Cancer Research Fund(WCRF) and the American Institute for Cancer Research (AICR) for awide range of cancers (1997) concluded that the evidence for fruit andvegetables decreasing cancer risk was convincing for lung and digestivetract cancers. In the present study, cancers of the lung, oesophagus,stomach, colon and rectum were examined, leaving cancers of the mouthand pharynx for future work. Cancers for which the WCRF/AICR reviewreported only a probable association (larynx, pancreas and bladdercancers) or limited evidence of an association (cancers which may have a hormonal etiology including ovary, endometrium, thyroid andprostate) were not included in the CRA project at this stage.
Although there is also limited evidence for other health outcomes such as type II diabetes, chronic obstructive pulmonary disease and cataract (Sargeant et al. 2001; Smit et al. 1999; Tavani et al. 1996b),it was decided not to include these in the 2000 revision of the GBD
project because the number of published studies is currently too limitedto draw conclusions on the size of the effect for these health problems.The evidence for these will be reconsidered in the future. Although other cardiovascular disease outcomes such as peripheral vasculardisease share most risk factors with IHD and occlusive stroke, these outcomes were also excluded from the present report due to the currentlack of information on a possible relationship with fruit and vegetableintake.
GENERAL DISCUSSION OF CAUSALITY FOR THE SELECTED EXPOSURE VARIABLE
Bradford Hill’s criteria of causality, comprising biological plausibility,temporality, strength, consistency, dose–response, and experimental evi-dence, were considered in order to determine the likelihood of causalityfor the association of fruit and vegetable intake with the six selectedhealth outcomes (Hill 1965).
Biological plausibility
Evidence of causality for the relationship between fruit and vegetableconsumption and health can be obtained from the identification of possible biological mechanisms. A number of mechanisms have been proposed (Lampe 1999). They generally involve specific nutrient andnon-nutrient constituents of fruit and vegetables, including antioxidantsand various other micronutrients in fruit and vegetables. Nutrients aresubstances in food that the body can use to obtain energy or synthesizetissues (Insel et al. 2003). Non-nutrients are substances, which may nothave a known nutrient function but are still important for biologicalmechanisms such as regulatory functions. Few attempts have been madeto simultaneously explore a combination of potential mechanisms.
The issue of biological plausibility is thus extremely complex and evi-dence remains fragmentary. There are several reasons for this. First, it isvery difficult, in conventional epidemiological studies, to specify preciselyexposure to different types of foods or food components over a pro-longed period of time. As mentioned, obtaining valid information onindividual dietary intake is very difficult. Even where this is possible, itis likely that the true content of the reported foods will have variedaccording to variations within particular types of food (such as differentbrands of oranges), differences in methods of food preparation, and sea-sonal variation in food composition. Second, while the growth in under-standing of molecular mechanisms of disease is identifying many newfactors, in particular non-nutrient components of food which may beimportant in preventing specific diseases, in many cases their existence,let alone their possible importance, was not known at the time whencohort studies now reporting results were established (e.g. glucosinolatesin brassicas [van Poppel et al. 1999] and isoflavones in soya [Messina1999], both of which appear to reduce the incidence of some types ofcancer). The incompleteness of current food composition tables is a
630 Comparative Quantification of Health Risks
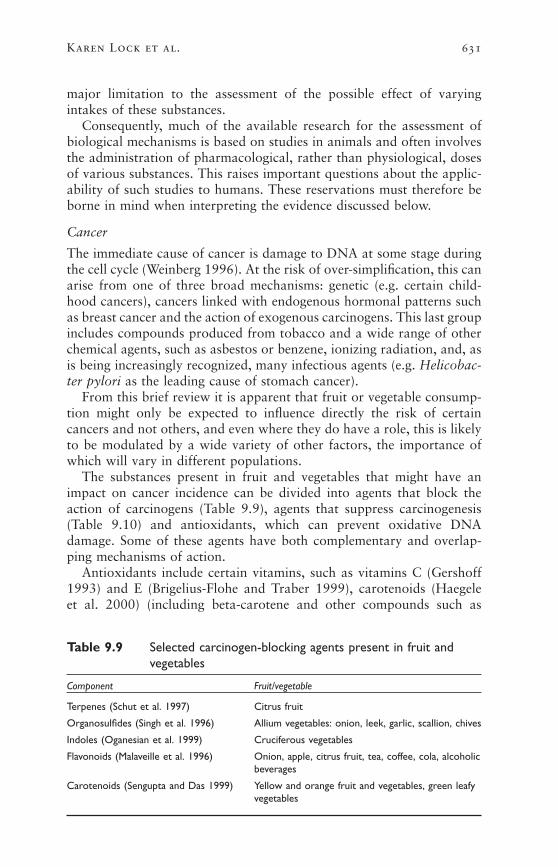
major limitation to the assessment of the possible effect of varyingintakes of these substances.
Consequently, much of the available research for the assessment ofbiological mechanisms is based on studies in animals and often involvesthe administration of pharmacological, rather than physiological, dosesof various substances. This raises important questions about the applic-ability of such studies to humans. These reservations must therefore beborne in mind when interpreting the evidence discussed below.
Cancer
The immediate cause of cancer is damage to DNA at some stage duringthe cell cycle (Weinberg 1996). At the risk of over-simplification, this canarise from one of three broad mechanisms: genetic (e.g. certain child-hood cancers), cancers linked with endogenous hormonal patterns suchas breast cancer and the action of exogenous carcinogens. This last groupincludes compounds produced from tobacco and a wide range of otherchemical agents, such as asbestos or benzene, ionizing radiation, and, asis being increasingly recognized, many infectious agents (e.g. Helicobac-ter pylori as the leading cause of stomach cancer).
From this brief review it is apparent that fruit or vegetable consump-tion might only be expected to influence directly the risk of certaincancers and not others, and even where they do have a role, this is likelyto be modulated by a wide variety of other factors, the importance ofwhich will vary in different populations.
The substances present in fruit and vegetables that might have animpact on cancer incidence can be divided into agents that block theaction of carcinogens (Table 9.9), agents that suppress carcinogenesis(Table 9.10) and antioxidants, which can prevent oxidative DNAdamage. Some of these agents have both complementary and overlap-ping mechanisms of action.
Antioxidants include certain vitamins, such as vitamins C (Gershoff1993) and E (Brigelius-Flohe and Traber 1999), carotenoids (Haegele et al. 2000) (including beta-carotene and other compounds such as
Karen Lock et al. 631
Table 9.9 Selected carcinogen-blocking agents present in fruit andvegetables
Component Fruit/vegetable
Terpenes (Schut et al. 1997) Citrus fruit
Organosulfides (Singh et al. 1996) Allium vegetables: onion, leek, garlic, scallion, chives
Indoles (Oganesian et al. 1999) Cruciferous vegetables
Flavonoids (Malaveille et al. 1996) Onion, apple, citrus fruit, tea, coffee, cola, alcoholicbeverages
Carotenoids (Sengupta and Das 1999) Yellow and orange fruit and vegetables, green leafyvegetables

flavonoids) and selenium. These act by scavenging free radicals thatwould otherwise damage DNA. In doing so, they would reduce theimpact of certain exogenous carcinogens.
In general, any protective effect that fruit and vegetables might exertis more likely to be apparent with cancers where exogenous carcinogensplay a major part. Examples include lung, stomach and colorectal cancer.Evidence from observational studies seems to support this. TheWCRF/AICR review of the literature (World Cancer Research Fund andAmerican Institute for Cancer Research 1997) concluded that the evi-dence for fruit and vegetables decreasing cancer risk was convincing fororal-pharyngeal, lung and digestive tract cancers; that there was a prob-able association for larynx, pancreas and bladder cancers; and that theevidence was limited for cancers which may have a hormonal etiologyincluding ovary, endometrium, thyroid and prostate.
Most human research investigating cancer risk has examined eitherthe effect of a specific compound or of overall fruit and vegetable con-sumption. Research into the former has yielded mixed results. Whilemany studies have shown an association between high beta-caroteneintake and reduced risk of cancer, especially lung and stomach cancer(van Poppel and Goldbohn 1995), a highly publicized study amongsmokers receiving vitamin supplements, including beta-carotene, foundthat supplementation was associated with an increased rate of lungcancer. Similarly, while a recent meta-analysis found a small reductionin the risk of breast cancer with high levels of fruit and vegetable con-sumption (Gandini et al. 2000), some large studies looking at vitaminsupplements have found no effect (Watkins et al. 2000; Wu et al. 2000).However, the effect of dietary composition on cancers with hormonaletiologies is likely to be greatest in the pre-pubertal years, as diet duringthis phase of growth may influence breast cancer risk substantially viaits effect on body size, age of menarche, etc.
Given the many substances potentially involved in protecting againstcancer, and the diverse mechanisms involved, these mixed results havehighlighted the need to look at non-nutrient components of fruit and
632 Comparative Quantification of Health Risks
Table 9.10 Selected carcinogenesis-suppressing agents present in fruitand vegetables
Component Fruit/vegetable
Protease inhibitors (Kennedy 1998) Legumes, potato, spinach, broccoli, cucumber
Terpenes Citrus fruit
Isothiocyanates Cruciferous vegetables
Plant sterols (Awad et al. 2000) Vegetables, beans, seed
Carotenoids Yellow and orange fruit and vegetables, greenleafy vegetables
vegetables. More research is now investigating, among others, the poten-tial impact of other food components such as bioactive compounds(allium compounds, dithiolthiones, isothiocyanates, terpenoids, isofla-vones, protease inhibitors, phytic acid, polyphenols, glucosinolates andindoles, flavonoids, plant sterols, saponins and coumarins) (Verhagen et al. 1995).
In summary, there are many possible mechanisms by which fruit andvegetable consumption might reduce the risk of cancer. However, ourknowledge is handicapped by the uncertainty with regard to the manypathways involved in carcinogenesis and the relative quantitative impor-tance of each of the mechanisms that, on current knowledge, could plau-sibly be involved. However, it appears that the impact of diet is likely tobe greatest for cancers caused by specific external carcinogens, such asgastrointestinal and lung cancer, and less important for cancers whereendocrine factors play a greater role, such as breast and prostate cancer.Furthermore, the overall importance of diet in a given population willclearly reflect the prevalent pattern of exposure to specific carcinogensas well as differences in genetic susceptibility. Thus, an agent that actsto protect against the effects of a particular carcinogen will have less ofan effect in a population where exposure to that carcinogen is rare thanwhere it is common.
Cardiovascular disease
As with cancer, the multiple mechanisms by which fruit and vegetableconsumption might act on the risk of cardiovascular disease are difficultto disentangle because of the inadequate understanding of the determi-nants of disease. Most research has concentrated on atherosclerosis.Other potential mechanisms by which fruit and vegetables could impactindirectly on cardiovascular risk include a link with blood pressure mod-ulation, through the high potassium content of some fruit and vegeta-bles (Ascherio et al. 1998; Lampe 1999), or with chronic respiratorydisease (associated with fruit and vegetables—and their constituents) andvascular disease risk. For the sake of simplicity, this short review willfocus on IHD, although some issues are also relevant to cerebrovascu-lar disease.
Atheroma is thought to arise as a result of monocytes adhering toendothelial cells and migrating into the arterial intima where theybecome macrophages, taking up low density lipoprotein, subsequentlybecoming foam cells. The role of fruit and vegetable constituents inmonocyte adhesion is increasingly well understood. Methionine, derivedfrom dietary protein, is converted within cells to homocysteine. Defi-ciency of folic acid, vitamins B12 and B6 will give rise to an elevated levelof homocysteine (Chambers et al. 2001). High levels of homocysteinecontribute to the generation of free radicals, and thus oxidative damage,in enthothelial cells, leading to the aggregation of monocytes andplatelets, as well as vasoconstriction (Kojda and Harrison 1999). These,
Karen Lock et al. 633
in turn, promote atherogenesis. There is now compelling epidemiologi-cal evidence to link homocysteine and vascular disease. A recent meta-analysis showed that the risk of cardiovascular disease increased withplasma homocysteine, with odds ratios of 1.6 (1.4–2.3) and 1.8 (1.4–2.3)per 5mol/l increment in plasma homocysteine in men and women,respectively. The relationship was similar for cerebrovascular disease(Boushey et al. 1995).
It has been suggested that other components of fruit and vegetables,in particular antioxidants, act at other stages in the process of athero-genesis. Such compounds could act by reducing the oxidation of low-density lipoprotein, thus reducing the formation of fatty streaks andplaques. These antioxidant compounds include vitamin C, which isinvolved in free radical scavenging, haemostasis and in the stabilizationof lipid membranes (Witztum 1994), and beta-carotene, which neutral-izes singlet oxygen molecules and prevents chain formation, so reducingoxidative processes that are important in atherogenesis (Gaziano andHennekens 1993). Flavonoids also inhibit the oxidation of low densitylipoprotein and reduce thrombotic tendencies.
Observational studies support a strong inverse association betweenplasma levels of vitamins C and E and cardiovascular mortality (Davigluset al. 1997; Gale et al. 1995; Gey 1995; Manson et al. 1992; Yokoyama2000). However, only a few studies have reported a significant inverserelationship between vitamin C specifically and cardiovascular risk(Khaw et al. 2001). Several reviews have found no significant benefitfrom vitamin C after controlling for other antioxidant intake or multi-vitamin use (Price and Fowkes 1997; Rexrode and Manson 1996). Eventhose that reported a benefit from vitamin C differ with regard to thepoint at which an effect appears and the potential magnitude of the rela-tionship. Some studies indicated an increased risk of cardiovasculardisease only at very low levels of plasma vitamin C, with no effect withinthe range seen in most populations. Other studies have reported a sig-nificantly reduced risk only in persons with the highest levels or withsupplemental intake. However, a recent study showed a significantdecrease in cardiovascular and IHD risk throughout the normal plasmarange (Khaw et al. 2001). Similarly, although results from many obser-vational studies suggest that higher serum levels of beta-carotene reducethe risk of cardiovascular disease, systematic reviews have concluded thatevidence for a protective effect is inconsistent (Jha et al. 1995; Rexrodeand Manson 1996).
As with studies of cancer, there is no clear evidence from interventiontrials that antioxidant supplements reduce the risk of cardiovasculardisease (Collins et al. 2002; Gaziano 1996; Greenberg and Sporn 1996;Hennekens et al. 1996; Lonn and Yusuf 1999). In the case of beta-carotene there is even some evidence of harm. Several trials were not,however, designed specifically to assess cardiovascular disease risk anddid not provide data on non-fatal cardiovascular end-points. Some
634 Comparative Quantification of Health Risks
authors have suggested that the apparent protective association found inobservational studies would be due to residual confounding by differ-ences in socioeconomic status, health behaviour and dietary intake (Ness2001).
Many of the same challenges that arise with studies of the etiology ofcancer also apply to IHD. First, if fruit and vegetables do affect athero-genesis, then their effect will be modulated by other important factorsthat are involved in atherogenesis and are also influenced by diet. Thisis particularly the case for high density and low density lipoproteins.These are determined primarily by the amount and nature of fat in thediet, but are also influenced by alcohol consumption, with the preciseeffect determined by the pattern of drinking. In addition, it is importantto remember that atherogenesis is only one factor involved in myocar-dial infarction. Another is thrombosis, which may also be influenced bycertain dietary factors (Chen et al. 2000).
Second, and less well recognized, cardiovascular disease embraces awide variety of different processes. In particular, it is becoming clear thatsome myocardial infarctions in young people have a different etiology.Even within the more conventional understanding of IHD, there areclearly differences between those whose atheroma predominantly takesthe form of plaques that are lipid-rich, and thus likely to lead to plaquerupture and so to acute infarction, and those that are predominantlyfibrous, with smooth muscle proliferation, which are more likely to causeprogressive angina (Kharbanda and Vallance 2001).
EXPERIMENTAL EVIDENCE
Trials of dietary changes
There is little experimental evidence for the health effects of increasingfruit and vegetables in the diet. Obviously foods that are part of a usualdiet are not easily amenable to traditional trials in the general popula-tion. Although no trial examined just giving advice to eat more fruit andvegetables on the disease outcomes considered in this report, a few trialsof dietary advice in secondary prevention of IHD have included adviceto eat more fruit and vegetables (Burr et al. 1989; de Lorgeril et al. 1994,1999; Rinzler 1968; Singh et al. 1992).
The Diet and Reinfarction Trial (DART) was set up to examine theeffect of diet on the secondary prevention of myocardial infarction. Par-ticipants were randomized to receive advice or no advice on each of threedietary factors: a reduction of fat intake and an increase in the ratio ofpolyunsaturated to saturated fat; an increase in fatty fish intake; or anincrease in cereal fibre intake. Although the fat advice arm of the trialwas associated with an increased fruit and vegetable consumption ofabout 50g/day, no effect on total mortality at two years was observed(RR = 1.00, 95% CI 0.77–1.30) and there was no effect on IHD events(IHD deaths plus non-fatal myocardial infarction: RR = 0.91, 95% CI
Karen Lock et al. 635

0.71–1.16) (Burr et al. 1989). It is possible, however, that the follow-upperiod was too short to allow for an effect to be detected or that theincrease in fruit and vegetable consumption was too small to produce adetectable effect.
The Lyon Diet Heart Study investigated whether a Mediterranean-type diet compared with a prudent Western-type diet could reduce therate of recurrence after a first myocardial infarction. Intermediate analy-sis showed a marked protective effect after 27 months of follow-up (73%reduction in rate of recurrence and death from cardiovascular causes;RR = 0.27, 95% CI 0.11–0.65), which was maintained for four yearsafter infarction (RR = 0.28, 95% CI 0.15–0.53) (de Lorgeril et al. 1999).The increase in fruit and vegetable consumption in the interventiongroup was thought to be an important factor in risk reduction. However,as in the DART study, diet changed in a number of ways during the trialand it is thus impossible to estimate the specific influence of increasedfruit and vegetable intake in either trial.
Evidence that increasing fruit and vegetable intake alone may beimportant as a dietary intervention in reducing cardiovascular diseaserisk comes from the Indian Experiment of Infarct Survival (IEIS) (Singhet al. 1992). This randomized controlled trial showed that the con-sumption of a low-fat diet enriched with fruit and vegetables comparedwith a standard low-fat diet was associated with about 40% (RR = 0.60,95% CI 0.31–0.75) reduction in cardiac events and 45% (RR = 0.55,95% CI 0.34–0.75) reduction in mortality in 406 men with acutemyocardial infarction after one year. These findings suggest a very rapideffect of dietary change on incidence and mortality from IHD that wouldappear to be difficult to explain.
Some recent trials also assessed the impact of increased fruit and veg-etable intake on blood pressure. In the Dietary Approaches to StopHypertension (DASH) trial, hypertensive participants were fed a controldiet for three weeks, and then were randomized to receive for eight weekseither the control diet, a diet rich in fruit and vegetables, or a combina-tion diet rich in fruit and vegetables, and reduced in saturated fat, fatand cholesterol (Conlin et al. 2000; Obarzanek et al. 2001). Both thecombination diet and the fruit-and-vegetables diet significantly reducedsystolic and diastolic blood pressure. After eight weeks, 70% of the par-ticipants on the combination diet had a normal blood pressure, 45% ofthose on the fruit and vegetable diet, and 23% of those on the controldiet. Unsurprisingly the fruit and vegetable diet produced few changesin blood lipids and had less effect on blood pressure reduction than thecombination diet. Both diets showed that they could potentially helpreduce IHD risk. However, studies with a longer follow-up would berequired to assess the true long-term effect of such changes.
Another trial assessed the specific effect of increased guava intake inhypertensive individuals (Singh et al. 1993b). After four weeks, the dietrich in guava (0.5–1kg/day) was associated with 7.5/8.5mmHg net
636 Comparative Quantification of Health Risks
decrease in mean systolic and diastolic pressures compared with thecontrol group, a significant decrease in serum total cholesterol (7.9%),triglycerides (7.0%), and an insignificant increase in high density lipopro-tein (HDL) cholesterol (4.6%) with a mild increase in the ratio of totalto HDL cholesterol. The authors suggested that an increased consump-tion of guava fruit could cause a substantial reduction in blood pressureand blood lipids without a decrease in HDL cholesterol. These changeswere attributed to its high potassium and soluble fibre content, respec-tively. Further research is needed to confirm this hypothesis with moreeasily applicable dietary changes.
Nutrient supplement trials
Due to the lack of trials of increased fruit and vegetable intake on healthoutcomes, most data from intervention studies relate to studies of nutri-ent supplements. Unfortunately, these trials have generally been of smallsample size and relatively short duration (Lampe 1999).
In contrast to the results of observational studies, findings from trialsof antioxidant and vitamin supplementation have mostly shown no effecton mortality, cardiovascular events or cancer (Blot et al. 1995; Correaet al. 2000; Egger et al. 1998; Hooper et al. 2001; Ness et al. 1999a).There has even been some concern following two trials that showed anincreased risk of lung cancer mortality with beta-carotene and vitaminA supplements in the Alpha-Tocopherol, Beta-Carotene and Cancer Prevention (ATBC) study (Anonymous 1994) and the Beta-Carotene andRetinol Efficacy Trial (CARET) (Omenn et al. 1996a, 1996b). However,the recent Heart Protection study (HPS) showed neither benefit nor harmof supplementation with antioxidant vitamins after 5.5 years follow-up.This double-blind randomized trial with a 2¥2 factorial design investi-gated, in over 20500 persons, the use of simvastatin and antioxidant vit-amins (vitamin E, vitamin C and beta-carotene) (Collins et al. 2002).
One exception is the Linxian trial in China (Blot et al. 1995). Thistrial showed reduced total mortality in the group supplemented withbeta-carotene, alpha-tocopherol and selenium compared with theplacebo group after six years. However, it is not possible to identifywhich antioxidant contributed most to the trend towards lower mortal-ity. Some trials have also suggested that vitamin E supplementation mayprevent ischaemic stroke in high-risk hypertensive patients (Leppala etal. 2000).
These generally null findings, while initially surprising, are not entirelyunexpected given the large number of potentially active compounds infood and the scope for interactions, both with other exogenous sub-stances and genetic status. Given that there are very few randomized-controlled trials that investigated the association of fruit and vegetableconsumption with disease outcomes, current evidence of causality ismainly based on observational studies.
Karen Lock et al. 637
STRENGTH OF ASSOCIATION
The review of the evidence from cohort and case–control studies for thisproject generally supports the hypothesis that a high dietary intake offruit and vegetables is protective for cardiovascular disease and theselected cancer (see results of the systematic review in sections 3.6 and3.7). We consider this to be a relatively strong association for the out-comes presented in this chapter, especially taking into account the poten-tial dilution inherent in dietary exposure measurement.
Consistency
The review of the literature performed for this project shows that moststudies of fruit and vegetable consumption demonstrated a generally con-sistent inverse relationship with the six disease outcomes in different pop-ulations (see section 3.7). There were virtually no studies of whole foods(thus excluding nutritional supplements) that showed harmful associa-tions, and many of the studies that reported a null association reportedin fact insignificant inverse trends. The major caveat to this statement is that there have been few studies in populations from developing countries.
Temporality
It is virtually axiomatic that fruit and vegetable consumption will precededisease outcomes. The many cohort studies reviewed here that have longfollow-up periods provide more convincing evidence for temporality, asthey are less likely to have been affected by information bias, a majorsource of bias in case–control studies (e.g. recall bias).
Dose response
Evidence from the literature shows that in general, people in the highestcategories of fruit and vegetable consumption have lower risk of car-diovascular disease and cancers compared with those in the lowest con-sumption categories. Many of the studies also reported a significant trendbetween the quartiles, quintiles or tertiles of consumption and diseaserisk, and a few studies have reported significant effects with fruit andvegetable treated as a continuous variable (see sections 3.6 and 3.7).
SUMMARY
There are still many uncertainties with regard to the mechanisms thatlead to common diseases, to the roles that fruit and vegetables could playin these mechanisms, and to the specific substances in fruit and vegeta-bles that are particularly important. Different studies have suggested thatflavonoids, carotenoids, vitamin C, folic acid, and fibre could play a pro-tective role. However, it must be kept in mind that studies based on singlefood constituents may underestimate the effects of exposures such asfoods, which are chemically complex. Also, single constituents can be a
638 Comparative Quantification of Health Risks
marker for other active constituents (as the conflicting results betweenobservational studies and trials have suggested for beta-carotene) (Eggeret al. 1998), or even for a combination of constituents that are respon-sible for the protective effect. Until these mechanisms are better under-stood, it will not be possible to determine, with any certainty, whatprecise role specific components of fruit and vegetables might play. Whatcan be said with some confidence is that there are a wide variety of sub-stances within fruit and vegetables that appear to play a role in the etiology of cardiovascular disease and some cancers.
3.2 Overview of methods for estimating riskfactor–disease relationships
The associations reported in this study were based on a systematic reviewof the literature. This provided evidence for the direction and size of therelationship between fruit and vegetable consumption and the selecteddisease outcomes. This was complemented with meta-analyses for fourdisease outcomes as described in section 3.7.
3.3 Criteria for identifying relevant studies
All studies that satisfied the following criteria were included in the sys-tematic review of the literature:
• studies that measured dietary intake of fruit and/or vegetables;
• studies of vegetarians that measured food intake; and
• a special focus was placed on studies that explored associations offruit and vegetable intake with diseases. However, for completenesswe have also included studies that used as their exposure variableproxy measures of intake derived from the measurement of interme-diate variables (such as dietary fibre) or biological markers (such ascarotenoids, folate, flavonoids, vitamins A and C not due to supple-ments) where there was a high correlation with the specific food type.
3.4 Search strategy and inclusion criteria for theliterature review
Studies were identified through a systematic review of the literature. Thefollowing databases were searched: Medline, Embase, Cochrane On-line,CABHealth and CABAbstracts using the keywords “fruit” or “vegeta-bles” and “coronary heart disease”, “cerebrovascular disorder”, “lung”,“colorectal”, “stomach” and “esophageal”, “neoplasms” and “cancer”.All search terms were linked to MESH headings and exploded. Searcheswere limited to human studies in English from 1980 onwards (for theCABabstracts, however, the search was from 1987 to 2000).
The outcomes included in this systematic review were the following.
• Cardiovascular diseases: symptomatic heart disease, cerebrovasculardisease and total circulatory disease. Studies of peripheral vascular
Karen Lock et al. 639

disease, all-cause mortality and cardiovascular risk factors wereexcluded.
• Cancer: all histological types of the site-specific cancers were includedbut not reviewed separately.
Relevant studies for inclusion were determined through the review oftitles and abstracts. If there was any doubt regarding study relevance,the full text of the study was retrieved.
This search was complemented with a hand search of citations frombooks, reviews and citations of references already located. Authors whohad published key studies and reviews in the field were also approachedto help us identify any other studies, published or unpublished.
3.5 Characteristics of excluded studies
Studies were excluded if any one of the following criteria was satisfied.
• The measurement of risk was based solely on blood biochemicalmarkers with no measure or estimate of dietary or nutrient intake.
• The study focus was on investigating the effect of non-dietary supplements.
• The outcome measure was prognosis, pre-cancerous lesions or pre-disease markers rather than incident cases or mortality.
• The statistical analyses of the study were not adjusted for major con-founding factors such as age, sex and smoking.
3.6 Description of studies
CHARACTERISTICS OF INCLUDED STUDIES
A short summary of the number of studies included in the systematicreview is given in Table 9.11. All studies included in the review of theliterature are described in section 3.7, where the assessment of causalityfor each outcome is discussed. Details of the studies included for eachspecific outcome are provided in Tables 9.21 to 9.28.
Limitations of the studies included in the review of the literature
The studies included in the review of the literature differed in many ways,including:
• the type of study design;
• the sex, age range and ethnicity of the study population;
• the method and validity of measurement of the dietary exposure;
• the method of reporting the dietary exposure (qualitative vs quanti-tative);
640 Comparative Quantification of Health Risks
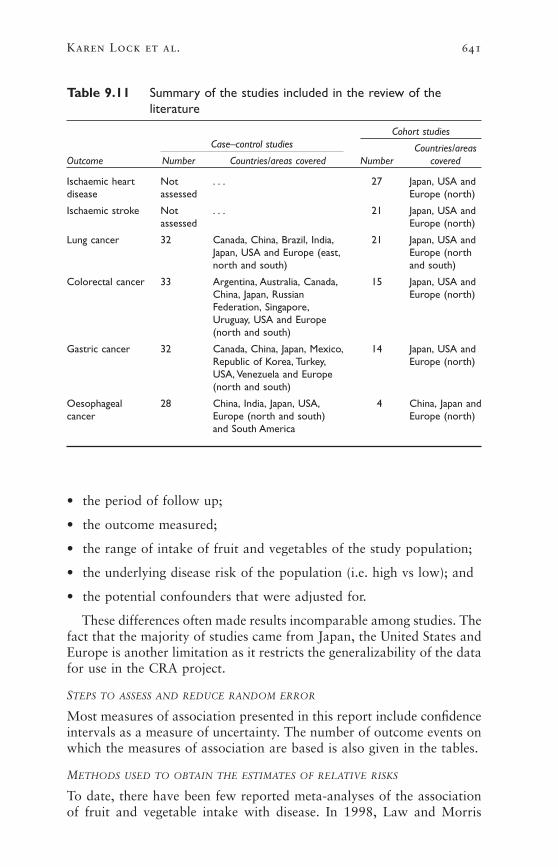
• the period of follow up;
• the outcome measured;
• the range of intake of fruit and vegetables of the study population;
• the underlying disease risk of the population (i.e. high vs low); and
• the potential confounders that were adjusted for.
These differences often made results incomparable among studies. Thefact that the majority of studies came from Japan, the United States andEurope is another limitation as it restricts the generalizability of the datafor use in the CRA project.
STEPS TO ASSESS AND REDUCE RANDOM ERROR
Most measures of association presented in this report include confidenceintervals as a measure of uncertainty. The number of outcome events onwhich the measures of association are based is also given in the tables.
METHODS USED TO OBTAIN THE ESTIMATES OF RELATIVE RISKS
To date, there have been few reported meta-analyses of the associationof fruit and vegetable intake with disease. In 1998, Law and Morris
Karen Lock et al. 641
Table 9.11 Summary of the studies included in the review of theliterature
Case–control studiesCohort studies
Countries/areasOutcome Number Countries/areas covered Number covered
Ischaemic heart Not . . . 27 Japan, USA anddisease assessed Europe (north)
Ischaemic stroke Not . . . 21 Japan, USA andassessed Europe (north)
Lung cancer 32 Canada, China, Brazil, India, 21 Japan, USA andJapan, USA and Europe (east, Europe (northnorth and south) and south)
Colorectal cancer 33 Argentina, Australia, Canada, 15 Japan, USA andChina, Japan, Russian Europe (north)Federation, Singapore,Uruguay, USA and Europe(north and south)
Gastric cancer 32 Canada, China, Japan, Mexico, 14 Japan, USA andRepublic of Korea, Turkey, Europe (north)USA, Venezuela and Europe(north and south)
Oesophageal 28 China, India, Japan, USA, 4 China, Japan andcancer Europe (north and south) Europe (north)
and South America

reported the results of a meta-analysis of published cohort studies of therelationship of different markers of fruit and vegetable consumption,including dietary intake of fruit and vegetables, on the risk of IHD,adjusted for other factors (Law and Morris 1998). However, the resultsof this study were criticized by some researchers who suggested thatpotential residual confounding and heterogeneity among studies couldhave influenced the results (Ness et al. 1999b).
More recently, a group of researchers reported the results of meta-analysis of previously published case–control and cohort studies. Thisestimated the association of total fruit or total vegetable consumptionwith oesophageal, gastric and colorectal cancer (Norat et al. 2001). Themethodology used had limitations: studies were included if there wasinformation necessary for the statistical analysis, but there was no assess-ment of study quality or potential confounding. The studies had mea-sured fruit and vegetable intake in a range of ways, both quantitativeand qualitative. If intake data were only available as a qualitative amount(i.e. a subjective categorization into high vs low consumption), theamount of fruit and vegetables consumed in grams was estimated fromaverage consumption in other studies or data sources, including FAOfood balance sheets. The methodology used in that meta-analysis high-lights the difficulties in obtaining an accurate summary measure of asso-ciation for studies of fruit and vegetable intake.
Selection of studies
Considering the large variations among studies with regard to studydesign, study quality and measurement of both exposure and outcome,it would be methodologically inappropriate, and potentially misleading,to pool results statistically from all the separate studies identified in thesystematic review to obtain summary measures of association. This viewhas also been taken by other researchers who believe, given the qualityand heterogeneity of the evidence for fruit and vegetable consumptionand the substantial potential error in the measurement of diet, that meta-analyses are not appropriate for pooling observational studies and willonly serve to attenuate the error without exploring the heterogeneitywhich may be important in diet–disease relationships (Ness and Powles1997, 1999; Wiseman 2002).
In this study, it was decided first to apply strict criteria to select onlythe best quality and most representative studies for the association offruit and vegetable intake with each disease outcome. Only the studiesmeeting these criteria were then eligible for inclusion in a meta-analysis.
The following selection criteria were applied to the studies identifiedin the systematic review.
• Results from cohort studies were considered as more reliable evidenceof association than results from case–control studies. So case–controlstudies were excluded from the analysis.
642 Comparative Quantification of Health Risks
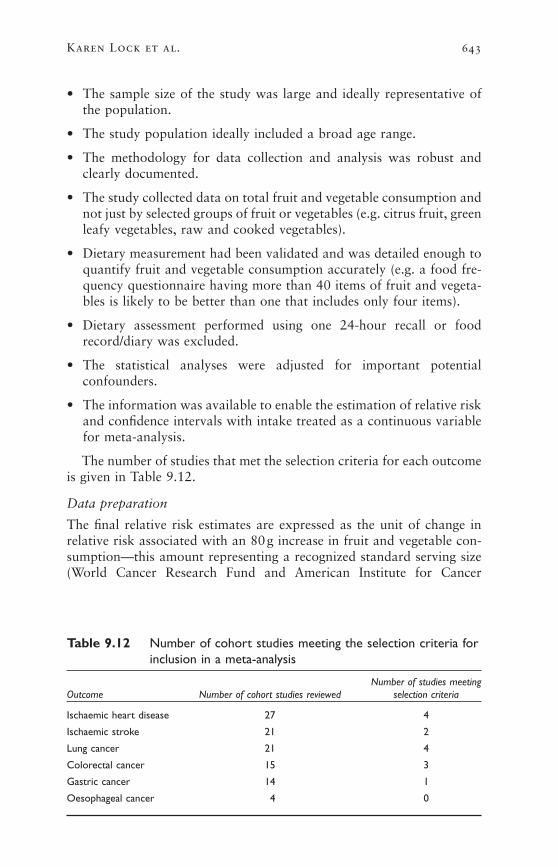
• The sample size of the study was large and ideally representative ofthe population.
• The study population ideally included a broad age range.
• The methodology for data collection and analysis was robust andclearly documented.
• The study collected data on total fruit and vegetable consumption andnot just by selected groups of fruit or vegetables (e.g. citrus fruit, greenleafy vegetables, raw and cooked vegetables).
• Dietary measurement had been validated and was detailed enough toquantify fruit and vegetable consumption accurately (e.g. a food fre-quency questionnaire having more than 40 items of fruit and vegeta-bles is likely to be better than one that includes only four items).
• Dietary assessment performed using one 24-hour recall or foodrecord/diary was excluded.
• The statistical analyses were adjusted for important potential confounders.
• The information was available to enable the estimation of relative riskand confidence intervals with intake treated as a continuous variablefor meta-analysis.
The number of studies that met the selection criteria for each outcomeis given in Table 9.12.
Data preparation
The final relative risk estimates are expressed as the unit of change inrelative risk associated with an 80g increase in fruit and vegetable con-sumption—this amount representing a recognized standard serving size(World Cancer Research Fund and American Institute for Cancer
Karen Lock et al. 643
Table 9.12 Number of cohort studies meeting the selection criteria forinclusion in a meta-analysis
Number of studies meetingOutcome Number of cohort studies reviewed selection criteria
Ischaemic heart disease 27 4
Ischaemic stroke 21 2
Lung cancer 21 4
Colorectal cancer 15 3
Gastric cancer 14 1
Oesophageal cancer 4 0
Research 1997). When data from the selected studies were not presentedin this format, the following methods were used.
• Where food consumption was expressed in frequencies (e.g. numberof servings per day), these were multiplied by 80g to give daily intakein grams per day.
• Where the relative risk estimates were reported for various incrementsin intake (e.g. for 100g or 1g increase in intake), the relative risk esti-mates were first transformed onto a log scale and then divided by thecomparison difference to give the log relative risk/gram per day; thesewere then multiplied by 80 to give final estimates expressed as per80g increase.
• Where an overall relative risk was not reported for consumption overthe entire population range, two methods were used to obtain the rel-ative risk estimates. In method 1, we estimated the additional gramper day for which the relative risks given applied (details are givenlater in the text for each selected study). In method 2, the method ofGreenland and Longnecker (1992), implemented in Stata 7, was usedto estimate the weighted regression slope over the published relativerisks, allowing for correlations due to a common reference category.This method uses all the published relative risks, and should coincideapproximately with method 1 if the log relative risks are linear onconsumption. When there is non-linearity, the two methods will differ,with the second giving the best “average” slope over the whole con-sumption range, while the first gives a better estimate of slope over asmaller consumption range. Where there is a tendency for risk reduc-tion to be less marked at higher consumption levels, method 2 willgive a more conservative estimate of the relative risk per consumptionincrease.
• Standard errors were calculated on the log scale by taking the upper(log) confidence limit minus the (log) estimated relative risk and divid-ing this by 1.96; standard errors were also scaled in the same way asestimates to apply to an 80g/day comparison difference.
Meta-analysis
Where more than one study was identified using our strict selection cri-teria, a meta-analysis was conducted to combine estimates and obtain asummary estimate of the relationship between fruit and vegetable intakeand the selected outcome (DerSimonian and Laird 1986). Meta-analysiswas performed using study log relative risks and the corresponding stan-dard errors and implemented in Stata 7 (“meta” macro). Heterogeneitybetween studies was tested using the chi-squared statistic. The random-effects result was pre-specified conditional on evidence of heterogeneity.When only two studies were available, fixed-effect meta-analysis was
644 Comparative Quantification of Health Risks

used. Forest plots, showing the results for individual studies, were prepared.
Extrapolations of the relative risk estimates
Subregion. For each outcome, the same relative risk estimates wereapplied to all subregions, assuming no interaction between the level ofintake and subregion on the associations. However, it is not possible toverify whether this assumption is true, as the study populations coveredby the literature reviews were from limited geographical areas, which didnot allow subregional comparisons.
Sex. Another issue is the fact that several studies pooled data for menand women. Due to the limitations of the evidence for men and womenseparately, it was decided to apply the same relative risk estimates toboth sexes for each outcome.
Age group. Many of the studies covered only limited age ranges, withmost being from middle-aged or elderly populations. None of the studiesincluded in the review were of children aged <16 years. Results from theBoyd Orr cohort suggest that childhood fruit consumption may have along-term protective effect on cancer risk in adults (Maynard et al.2003). This study measured intake of fruit and vegetables, energy, vita-mins C and E, carotene, and retinol during a study of family diet andhealth in 16 rural and urban areas of England and Scotland from 1937to 1939, and followed participants for up to 60 years. However, apartfrom this cohort, there are currently very few studies which have lookedat the impact of childhood intake. A previous review for the NewZealand burden of disease and injury study proposed that the age-specific relative risks for fruit-and-vegetable disease associations describean inverted u-curve, which assumes that the relative risk is one at theextremes of age (<25 years and >75 years) (Tobias 2001). The authorsof the review argued that they do not expect individuals aged <25 yearsto be at risk given that the outcomes are chronic diseases, that such outcomes are rare in children, and that children have probably had insufficient duration of exposure. They also applied reduced relative risksto older age groups (i.e. applying a relative risk of 1 to everyone aged>75 years), as there are high competing mortality risks at these ages. Inthis project, it was decided to apply the same relative risks to all agegroups between the ages of 15 and 69 years. It is reasonable to postu-late that there may be age attenuation in the relative risks at bothextremes of age. However, due to the current lack of information on how this would influence the relative risks at varying intakes of fruit and vegetables, approximate age attenuations were applied as follows:at older age groups, the excess risks were reduced by a quarter for ages 70–79 years, and by half for the age group of ≥80 years. For those
Karen Lock et al. 645

aged <15 years, a relative risk of 1 was applied as in the New Zealandstudy.
STEPS TO ASSESS AND REDUCE BIAS AND TO ASSESS CAUSALITY
There are a number of generic methodological issues that could lead tothe introduction of bias in nutritional epidemiological studies. The fol-lowing paragraphs briefly describe confounding and the major sourcesof measurement, recall and selection biases common to these studies,with a particular focus on issues that are specific to studying fruit andvegetables as a risk factor.
Confounding
Well-known potential confounders of the association of fruit and veg-etable intake with cardiovascular disease and cancer include, amongothers, sex, age and smoking. It is possible that a high intake of fruitand vegetables may be associated with other healthy behaviour, forexample lower consumption of saturated fat or non-smoking that alsohas a protective effect on the selected outcomes.
High intakes of fruit and vegetables may also displace other foodsfrom the diet, causing reduced intake of potentially harmful substancessuch as saturated fat and salt. Results from the DASH trial suggestedthat changes in dietary fats do not necessarily accompany an increase infruit and vegetable intake. In this trial, hypertensive participants werefed a control diet for three weeks and then randomized to receive foreight weeks either the control diet, a diet rich in fruit and vegetables, ora combination diet rich in fruit and vegetables and reduced in saturatedfat, fat and cholesterol (Conlin et al. 2000; Obarzanek et al. 2001). Boththe combination diet and the fruit-and-vegetables diet significantlyreduced systolic and diastolic blood pressure. After eight weeks, 70% ofthe participants on the combination diet had a normal blood pressure,45% of those on the fruit-and-vegetables diet did and 23% of those onthe control diet did as well. The fruit- and-vegetables diet produced fewchanges in blood lipids but was still likely to reduce IHD risk indepen-dently. Sodium/salt is perhaps an underacknowledged potential con-founder for IHD and stroke. Persons who consume more salads mayconsume less salt. The lack of evidence of confounding by salt mainlyrelates to the difficulty of measuring sodium exposure in individuals—not to its intrinsic importance.
In order to account for the potential effect of confounding on the rel-ative risk estimates, all studies that were identified in the review of theliterature must have performed some statistical adjustment for potentialconfounders. Most studies adjusted for the basic confounding factors,age and sex. The majority of recent studies also statistically controlledfor a range of other variables including smoking, alcohol consumption,total energy intake, other foods and food constituents (including satu-rated fat intake for heart disease), body mass index (BMI) and vitamin
646 Comparative Quantification of Health Risks
supplementation. Some studies also adjusted for socioeconomic status,educational level, ethnicity, occupation and place of residence. Thepotential confounders that are specific to each of the selected disease out-comes are discussed in more detail in section 3.7. It is important to notethat statistical adjustment for potential confounding implies acceptingthat the instruments used to measure these potential confounders did thisreasonably well. This may not be the case for all potential confounders(e.g. energy intake or physical activity level). In addition, even wherethere is a high degree of statistical control for potential confounding, thepossibility remains that part of the association estimated is due to uncon-trolled (residual) confounding (Ness et al. 1999b).
Selection bias
The issues related to selection bias in the studies reviewed for this projectare similar to those of studies investigating other risk factor–disease rela-tionships. For example, it is generally accepted that the selection of con-trols in case–control studies is likely to influence the study results. Studyparticipation is usually high for cases but lower for controls; those whoparticipate are more likely to be more health conscious, and thus perhapsconsume more fruit and vegetables (Michels et al. 2000).
There were a variety of approaches used to reduce selection bias in the studies reviewed. For example, many studies tried to match con-trols to their cases as closely as possible in terms of age and sex. Thegeneralizability of the results is also influenced by the source of controls,with population-based controls being better than hospital-based controls.
Information bias
Exposure. In the studies included in the review of the literature, data ondietary intake were collected using some form of diet history, food fre-quency questionnaire, 24-hour dietary recall(s) or diary/food record.Measurement of exposure will thus be influenced by the different limi-tations, sources of error and bias affecting each method. Some of thesewere described in sections 2.2 and 2.9.
Measurement error is an issue in all studies of dietary exposure(Smith-Warner et al. 1997). In general, this imprecision leads to a sub-stantial attenuation of diet–disease associations, and an underestimationof potential thresholds in these associations (Marshall and Chen 1999).This is the case, for example when a single 24-hour recall is used as themethod of dietary assessment (as in a few studies included in our reviewof the literature). A single 24-hour recall has a high degree of intra- tointer-individual variability and cannot accurately represent an individ-ual’s usual intake (Bingham et al. 1988). This may lead to important mis-classification (likely to be non-differential) error.
Food frequency questionnaires are more commonly used in nutritionalepidemiology. However, most food frequency questionnaires can be
Karen Lock et al. 647
criticized because of their limitations in collecting detailed accurate information on the intake of fruit and vegetables (Bingham et al. 1994;Michels et al. 2000). Little is known of the measurement error structurefor reported fruit and vegetable intake in food frequency questionnaires.Many early estimates based on comparisons with different question-naires or diet records had problems, underestimating both the degree oferror and the correlation between the sources of errors (Day and Ferrari2002; Thompson et al. 1997). Various problems are apparent. The levelof measurement error is large compared with the true variation of intakein many study populations; there may be systematic bias in reporting atthe individual level; and lack of independence of the measurement errorsbetween the food frequency questionnaire and reference instrument (Dayet al. 2001; Willett 2001). This may lead to considerably greater relativerisk attenuation than has been previously realized, making modestdecreases in relative risks difficult to detect (Kipnis et al. 1999). Nullresults of the diet–disease relationship in studies may thus be mislead-ing, and controlling for a number of correlated dietary variables whenexploring the diet–disease association of a specific dietary item can leadto uninterpretable or unpredictable results.
Other factors that can bias diet–disease relationships include the fre-quent assumption of unchanged dietary intake over long follow-upperiods, particularly affecting long-term cohort studies, and recall bias,which is a major problem in case–control studies (Willett 1998b). Insome cases, surrogate interviewees (spouses or immediate familymembers) are asked to provide information for the cases and controls incase–control studies; but this might also lead to misclassification bias.Another important issue to consider is the validity and reliability ofextrapolating results from studies based on micronutrient intakes orstatus to the effect of intakes of fruit and vegetables. In this review, wehave thus tried to select only studies with data based on food consump-tion rather than biomarkers of intakes. Where no appropriate food-exposure data existed, it was decided to include proxy nutrients (suchas vitamin C from diet) when this was validated by consumption studies.This approach was necessary, as there were a large number of studiesthat framed their hypotheses in terms of nutrients, and reported onlyassociations with nutrients. For example, studies such as the EPIC-Norfolk study (Bingham et al. 1997) have tried to reduce the subjectivenature of dietary assessment by using biological indicators such asplasma ascorbic acid, which they correlated with food intake. The useof plasma ascorbic acid measurement is thought to represent dietaryintake in the preceding few weeks and may overcome some of the issuesinvolved with dietary assessment (Bates et al. 1991). However, bio-markers are also prone to measurement error that could also explain thelack of consistency in studies in which such biomarkers have been used.In addition, these proxy measures of intake are not ideal, as it is clearthat any beneficial effect of fruit and vegetables involves many nutrient
648 Comparative Quantification of Health Risks

and non-nutrient factors. They would tend to underestimate the impactof a mixed intake of fruit and vegetables.
Finally, there is substantial variability among studies in the catego-rization of exposure groups, not only in terms of what constitutes the“fruit and vegetables” measured, but also the actual levels of intakewithin these groups. Exactly what level of intake represents a high or alow intake will vary significantly among populations and will be influ-enced by the method of data collection. This was discussed in section2.9. This literature review does not comment on the association ofdisease risk with specific fruit and vegetables, although several studieshave attempted to do this in their analyses.
Outcome. The best studies reviewed for this project were those that uti-lized more than one method to identify cases to avoid any losses to followup in the final analysis. The methods used included death certificates,hospital records, living relatives, self-report and cancer registries.
3.7 Structured assessment of causality for each outcome chosen
ISCHAEMIC HEART DISEASE
A detailed description of the studies included in the review of the liter-ature follows.
Previous reviews of the literature
Three recent reviews of the association between fruit and vegetable con-sumption and IHD were identified (Klerk et al. 1998; Law and Morris1998; Ness and Powles 1997). The review by Klerk et al. (1998) con-cluded that high vs low consumption of fruit and vegetables (increasingfrom 250 to 400g/day) is likely to reduce the risk of IHD by 20–40%in men and women; however, the methods used to derive the final esti-mates are unclear.
Law and Morris (1998) performed a meta-analysis of cohort studiesof the relationship between IHD and markers of fruit and vegetable con-sumption, namely dietary intake of fruit, vegetables, carotenoids, vitaminC, fruit fibre and vegetable fibre, and serum concentration of carotenoidsand vitamin C, adjusted for other factors. They estimated that the riskof IHD is about 15% lower at the 90th than at the 10th percentile offruit and vegetable consumption.
The review by Ness and Powles (1997) identified 10 ecological, threecase–control and 16 cohort studies investigating IHD. Of these, nine eco-logical studies, two case–control studies, and six cohort studies reporteda statistically significant negative relationship between IHD and the con-sumption of fruit and vegetables or proxy nutrients. Ness and Powlesdid not attempt to arrive at a summary statistic for the association asthe measures of exposure and disease varied considerably between
Karen Lock et al. 649

studies. They concluded that the results are consistent with a protectiveeffect of fruit and vegetables for IHD.
Current review of the literature
The literature review identified 27 references of prospective studies thatinvestigated the association of IHD risk with fruit and vegetable con-sumption. Details of the study characteristics are given in Table 9.13. Insummary, the study populations were all from Japan, the United Statesand Europe (Finland, the Netherlands, Norway, Sweden and the UnitedKingdom). Five of the studies each gave rise to more than one report;14 studies included men and women, nine studied men only and fourstudied women only. The follow-up time varied between four and 25years. The method used to measure fruit and vegetable intake differedconsiderably among studies, ranging from one 24-hour dietary recall anda seven-day prospective weighed food diary to a variety of food-fre-quency questionnaires.
Sixteen of the 27 studies reported a statistically significant inverseassociation between intake of fruit and vegetables and IHD. Thirteen ofthese showed an association with food intake, while the other threeshowed an association with a proxy diet measure that was correlatedwith fruit and vegetable intake. Nine further studies also reported aninverse association; seven of these were not statistically significant, twoothers not reporting confidence intervals or measures of statistical sig-nificance. The actual relative risks for the studies included in the meta-analysis are given in Table 9.23. Relative risks for the studies in thesystematic review are not given here due to the wide variation in howfruit and vegetables were reported and analysed.
Confounding
Most of the studies reviewed adjusted for some potential confoundingfactors shown to be associated with the risk of cardiovascular disease.All adjusted for age, and most studies adjusted for sex and smoking. Veryfew of the older studies had adequately addressed the issue of con-founding, and this cannot be discounted as an explanation for anobserved association in some studies. However, most recent studies havedealt with a comprehensive range of confounding factors, including themajority of the following: smoking, alcohol, total energy intake, satu-rated fat intake, cholesterol, BMI, hypertension, type II diabetes, physi-cal activity, hormone replacement therapy, educational status or socialclass and nutritional supplement use. Measurement of some of these can-didate confounders will potentially have substantial error (e.g. energyintake).
Summary
In summary, the review of the literature suggests that there is a stronginverse relationship between fruit and vegetable intake and
650 Comparative Quantification of Health Risks

Karen Lock et al. 651
Tabl
e 9.
13Su
mm
ary
of c
ohor
t st
udie
s re
port
ing
asso
ciat
ion
betw
een
inta
ke o
f fr
uit
and
vege
tabl
es a
nd is
chae
mic
hea
rt d
isea
se
Age
Stud
y po
pula
tion
rang
eSt
udy
Follo
w-u
pEx
posu
reAs
socia
tion
with
Asso
ciatio
n w
ith d
iet
Coun
try
(ref
eren
ce)
Sex
(yea
rs)
size
No.
of c
ases
(yea
rs)
mea
sure
frui
t or
veg
etab
les
prox
y
Finl
and
Finn
ish
Mob
ile C
linic
Mal
es a
nd30
–69
513
3M
orta
lity
(244
)14
Rep
eate
dIn
vers
e,st
atis
tical
ly..
.H
ealth
Exa
min
atio
nfe
mal
esdi
et h
isto
rysi
gnifi
cant
surv
ey c
ohor
t (K
nekt
et a
l.19
94,1
996)
Finl
and
Smok
ers
in A
TBC
stu
dyM
ales
50–6
921
930
Inci
denc
e (8
18),
6.1
Die
t hi
stor
yIn
vers
e,st
atis
tical
ly..
.(P
ietin
en e
t al
.199
6)m
orta
lity
(581
)si
gnifi
cant
Japa
nJa
pane
se g
ener
alM
ales
and
≥40
265
118
Mor
talit
y (N
A)
16C
rude
—no
tIn
vers
e,st
atis
tical
ly..
.po
pula
tion
surv
ey (
1965
fem
ales
clea
rsi
gnifi
cant
cens
us c
ohor
t) (
Hir
ayam
a(u
nadj
uste
d)19
90)
Net
herl
ands
Rot
terd
am s
tudy
Mal
es a
nd55
–95
480
2M
I (1
24)
4Fo
od f
requ
ency
...
Inve
rse,
stat
istic
ally
(Klip
stei
n-G
robu
sch
et a
l.fe
mal
esqu
estio
nnai
resi
gnifi
cant
1999
)(b
eta-
caro
tene
)
Net
herl
ands
Zut
phen
Eld
erly
stu
dyM
ales
65–8
480
5M
I (3
8),
5C
ross
-che
ck o
fIn
vers
e,no
tIn
vers
e (fl
avon
oids
)(H
erto
g et
al.
1993
)m
orta
lity
(43)
diet
ary
hist
ory
stat
istic
ally
sign
ifica
nt
Swed
enG
othe
nbur
g w
omen
Fem
ales
38–6
01
462
MI
(23)
,12
24-h
our
reca
ll..
.N
o as
soci
atio
n(L
apid
us e
t al
.198
6)m
orta
lity
(75)
(vita
min
C)
Uni
ted
Elde
rly
coho
rt,
Mal
es a
nd≥6
573
0M
orta
lity
(182
)20
7-da
y w
eigh
ed..
.In
vers
e,no
tK
ingd
omD
epar
tmen
t of
Hea
lth a
ndfe
mal
esfo
od r
ecor
dst
atis
tical
ly s
igni
fican
tSo
cial
Sec
urity
sur
vey
(vita
min
C)
(Gal
e et
al.
1995
)
cont
inue
d
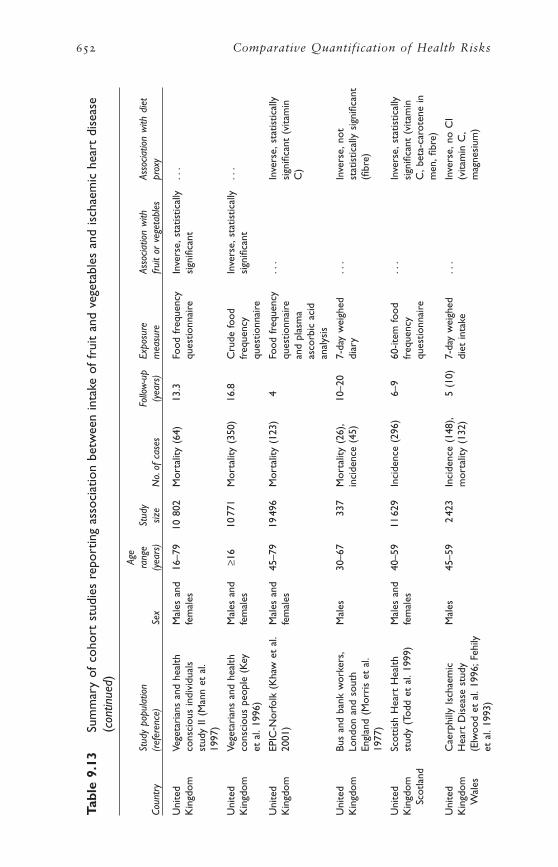
652 Comparative Quantification of Health Risks
Tabl
e 9.
13Su
mm
ary
of c
ohor
t st
udie
s re
port
ing
asso
ciat
ion
betw
een
inta
ke o
f fr
uit
and
vege
tabl
es a
nd is
chae
mic
hea
rt d
isea
se(c
ontin
ued)
Age
Stud
y po
pula
tion
rang
eSt
udy
Follo
w-u
pEx
posu
reAs
socia
tion
with
Asso
ciatio
n w
ith d
iet
Coun
try
(ref
eren
ce)
Sex
(yea
rs)
size
No.
of c
ases
(yea
rs)
mea
sure
frui
t or
veg
etab
les
prox
y
Uni
ted
Vege
tari
ans
and
heal
thM
ales
and
16–7
910
802
Mor
talit
y (6
4)13
.3Fo
od f
requ
ency
Inve
rse,
stat
istic
ally
...
Kin
gdom
cons
ciou
s in
divi
dual
sfe
mal
esqu
estio
nnai
resi
gnifi
cant
stud
y II
(Man
n et
al.
1997
)
Uni
ted
Vege
tari
ans
and
heal
thM
ales
and
≥16
1077
1M
orta
lity
(350
)16
.8C
rude
food
Inve
rse,
stat
istic
ally
...
Kin
gdom
cons
ciou
s pe
ople
(K
eyfe
mal
esfr
eque
ncy
sign
ifica
ntet
al.
1996
)qu
estio
nnai
re
Uni
ted
EPIC
-Nor
folk
(K
haw
et
al.
Mal
es a
nd45
–79
1949
6M
orta
lity
(123
)4
Food
fre
quen
cy..
.In
vers
e,st
atis
tical
lyK
ingd
om20
01)
fem
ales
ques
tionn
aire
sign
ifica
nt (
vita
min
and
plas
ma
C)
asco
rbic
aci
dan
alys
is
Uni
ted
Bus
and
bank
wor
kers
,M
ales
30–6
733
7M
orta
lity
(26)
,10
–20
7-da
y w
eigh
ed..
.In
vers
e,no
tK
ingd
omLo
ndon
and
sou
thin
cide
nce
(45)
diar
yst
atis
tical
ly s
igni
fican
tEn
glan
d (M
orri
s et
al.
(fibr
e)19
77)
Uni
ted
Scot
tish
Hea
rt H
ealth
Mal
es a
nd40
–59
1162
9In
cide
nce
(296
)6–
960
-item
food
...
Inve
rse,
stat
istic
ally
Kin
gdom
stud
y (T
odd
et a
l.19
99)
fem
ales
freq
uenc
ysi
gnifi
cant
(vi
tam
inSc
otla
ndqu
estio
nnai
reC
,bet
a-ca
rote
ne in
men
,fibr
e)
Uni
ted
Cae
rphi
lly I
scha
emic
Mal
es45
–59
242
3In
cide
nce
(148
),5
(10)
7-da
y w
eigh
ed..
.In
vers
e,no
CI
Kin
gdom
Hea
rt D
isea
se s
tudy
mor
talit
y (1
32)
diet
inta
ke(v
itam
in C
,W
ales
(Elw
ood
et a
l.19
96;F
ehily
mag
nesi
um)
et a
l.19
93)

Karen Lock et al. 653
USA
Ran
cho
Bern
ardo
coh
ort,
Mal
es a
nd50
–79
859
MI
and
1224
-hou
r re
call
...
Posi
tive,
not
Cal
iforn
ia (
Kha
w a
ndfe
mal
esm
orta
lity
stat
istic
ally
sig
nific
ant
Barr
ett-
Con
nor
1987
a)(d
ieta
ry p
otas
sium
)
USA
The
Adv
entis
t H
ealth
Mal
es a
nd≥2
526
473
MI
(134
),6
65-it
em fo
odPo
sitiv
e,no
t..
.st
udy,
Cal
iforn
ia (
Fras
erfe
mal
esm
orta
lity
(260
)fr
eque
ncy
stat
istic
ally
et a
l.19
92)
ques
tionn
aire
sign
ifica
nt
USA
Wes
tern
Ele
ctri
cM
ales
40–5
51
556
Mor
talit
y (2
31)
242x
cro
ss-c
heck
of
...
Inve
rse,
not
Com
pany
stu
dy,C
hica
godi
et h
isto
ry a
ndst
atis
tical
ly s
igni
fican
t(P
ande
y et
al.
1995
)fo
od f
requ
ency
(vita
min
C a
ndqu
estio
nnai
re (
tobe
ta-c
arot
ene)
part
icip
ant
and
hom
emak
er)
USA
Mas
sach
uset
ts H
ealth
Mal
es a
nd≥6
61
299
Mor
talit
y (4
8)4.
7543
-item
food
Inve
rse,
...
Car
e Pa
nel s
tudy
(G
azia
nofe
mal
esfr
eque
ncy
stat
istic
ally
et a
l.19
95)
ques
tionn
aire
sign
ifica
nt
USA
Iow
a W
omen
’s H
ealth
Fem
ales
55–6
934
486
Mor
talit
y (2
42)
712
7-ite
m fo
odIn
vers
e,st
atis
tical
lyIn
vers
e,no
tst
udy
(Kus
hi e
t al
.199
6;fr
eque
ncy
sign
ifica
nt fo
rst
atis
tical
ly s
igni
fican
tYo
chum
et
al.1
999)
ques
tionn
aire
som
e ve
geta
bles
(vita
min
C)
USA
NH
AN
ES 1
epi
dem
iolo
gic
Mal
es a
nd24
–74
1192
4M
orta
lity
(793
)19
24-h
our
reca
llIn
vers
e,st
atis
tical
ly..
.fo
llow
-up
stud
y (B
azza
nofe
mal
esan
d fo
odsi
gnifi
cant
et a
l.20
00)
freq
uenc
yqu
estio
nnai
re
USA
NH
S (L
iu e
t al
.200
0)Fe
mal
es34
–59
3987
6M
I (1
26)
5Fo
od f
requ
ency
Inve
rse,
not
...
ques
tionn
aire
stat
istic
ally
sign
ifica
nt
USA
HPF
S (L
iu e
t al
.200
1)M
ales
40–7
515
220
MI
(387
)12
Food
fre
quen
cyIn
vers
e,st
atis
tical
ly..
.qu
estio
nnai
resi
gnifi
cant
repe
ated
tw
ice
year
ly
cont
inue
d
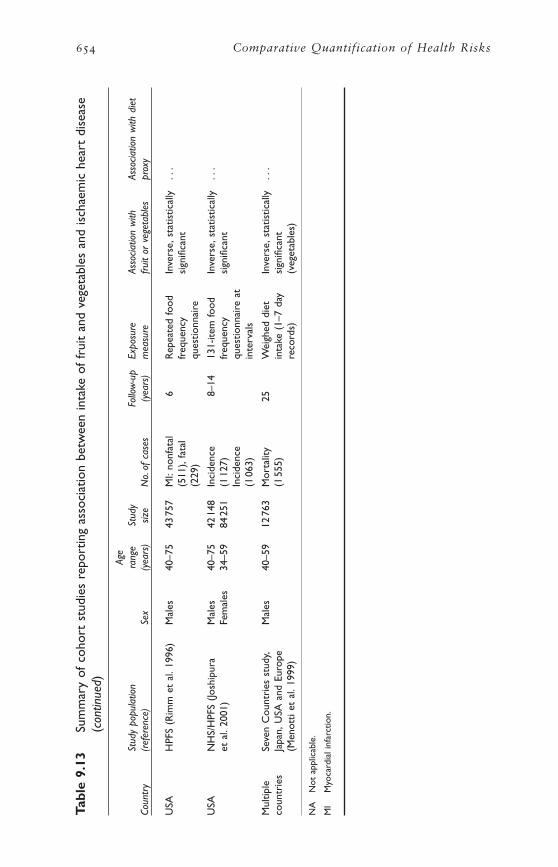
654 Comparative Quantification of Health Risks
Tabl
e 9.
13Su
mm
ary
of c
ohor
t st
udie
s re
port
ing
asso
ciat
ion
betw
een
inta
ke o
f fr
uit
and
vege
tabl
es a
nd is
chae
mic
hea
rt d
isea
se(c
ontin
ued)
Age
Stud
y po
pula
tion
rang
eSt
udy
Follo
w-u
pEx
posu
reAs
socia
tion
with
Asso
ciatio
n w
ith d
iet
Coun
try
(ref
eren
ce)
Sex
(yea
rs)
size
No.
of c
ases
(yea
rs)
mea
sure
frui
t or
veg
etab
les
prox
y
USA
HPF
S (R
imm
et
al.1
996)
Mal
es40
–75
4375
7M
I:no
nfat
al6
Rep
eate
d fo
odIn
vers
e,st
atis
tical
ly..
.(5
11),
fata
lfr
eque
ncy
sign
ifica
nt(2
29)
ques
tionn
aire
USA
NH
S/H
PFS
(Josh
ipur
aM
ales
40–7
542
148
Inci
denc
e8–
1413
1-ite
m fo
odIn
vers
e,st
atis
tical
ly..
.et
al.
2001
)Fe
mal
es34
–59
8425
1(1
127)
freq
uenc
ysi
gnifi
cant
Inci
denc
equ
estio
nnai
re a
t(1
063)
inte
rval
s
Mul
tiple
Seve
n C
ount
ries
stu
dy,
Mal
es40
–59
1276
3M
orta
lity
25W
eigh
ed d
iet
Inve
rse,
stat
istic
ally
...
coun
trie
sJa
pan,
USA
and
Eur
ope
(155
5)in
take
(1–
7 da
ysi
gnifi
cant
(Men
otti
et a
l.19
99)
reco
rds)
(veg
etab
les)
NA
Not
app
licab
le.
MI
Myo
card
ial i
nfar
ctio
n.

cardiovascular disease in over half the prospective observational studiesin many different populations. The relationship remains after someadjustment for confounding. This result needs to be interpreted in thelight of findings with regard to the more favoured diet hypotheses. In areview of the evidence for the classic diet–heart hypothesis, Willett founda positive association with saturated fat intake in only two of the 12cohort studies reviewed, and a positive association with cholesterolintake in two (Willett 1998b).
ISCHAEMIC STROKE
This analysis is confined to ischaemic stroke. Most of the studies in thesystematic review had only considered outcomes of ischaemic stroke.Although a few studies had analysed ischaemic and haemorrhagic strokeseparately, there was insufficient evidence to draw any conclusions onthe association of differential outcomes with fruit and vegetable intake.As it is more biologically plausible that the relationship of fruit and veg-etable protection is with ischaemic stroke, we decided to limit our analy-ses to this outcome. For the attributable burden calculations, stroke wasdivided into ischaemic and haemorrhagic using the method described inchapter 7.
Previous reviews of the literature
Three recent reviews that previously studied the association between fruitand vegetable consumption and stroke were identified (Klerk et al. 1998;Ness and Powles 1997, 1999). The review by Klerk et al. (1998) con-cluded that the risk of stroke is reduced by 0–25% with higher intakesof fruit and vegetables. The reviews by Ness and Powles (1997, 1999)identified five ecological, one case–control and eight cohort studiesreporting measures of association between the intake of fruit and veg-etables and stroke. Of these, three ecological studies and six cohortstudies reported a statistically significant negative association with theconsumption of fruit and vegetables or proxy nutrients. The authors con-cluded that the results were consistent with a strong protective effect offruit and vegetables for stroke, but they did not calculate a summary sta-tistic for the association as the measures of exposure and outcome variedconsiderably among studies.
Current review of the literature
As with IHD, evidence from case–control and ecological studies was notreviewed because the number of cohort studies identified was sufficientlyhigh (cohort studies represent a stronger study design), and because thegeneral pattern of findings observed was consistent among studies.Overall, the evidence suggests a strong protective effect of fruit and veg-etable consumption on ischaemic stroke risk.
Twenty-one references of prospective studies of the associationbetween stroke and the consumption of fruit and vegetables were iden-
Karen Lock et al. 655
656 Comparative Quantification of Health Risks
tified. Details of the study characteristics are described in Table 9.14. Insummary, the study populations were all from China, Japan, the UnitedStates or Europe (Finland, the Netherlands, Norway, Sweden and theUnited Kingdom). Three of the studies gave rise to more than one report.Ten studies had populations of men and women, eight studied men onlyand four studied women only. The follow-up period varied between fiveand 28 years. The method used to measure dietary intake of fruit andvegetables also varied considerably, including postal diet survey, 24-hourdietary recall, seven-day prospective weighed diet record, and variousfood-frequency questionnaires of differing length and quality.
Thirteen studies showed a statistically significant inverse associationbetween the intake of fruit and vegetables and stroke. Six studies showedan association with food, while the other eight showed an associationwith a nutrient considered to be a proxy for fruit and vegetable intake.
Confounding
As discussed for IHD, the observed protective association for fruit andvegetables and stroke could, in theory, be explained by confounding. Allstudies included in the literature review adjusted for age and sex, andmost recent studies reviewed also dealt with a comprehensive range ofmajor measured confounders.
Summary
There is a strong inverse relationship between the level of fruit and veg-etable consumption and stroke risk in prospective observational studiesin many populations. The relationship persists after adjustment for majorconfounders.
LUNG CANCER
A detailed description of the studies included in the review of the liter-ature follows.
Previous reviews of the literature
Five recent comprehensive reviews of the association of fruit and veg-etable intake with lung cancer risk were identified. Three concluded thatthere was convincing evidence that a diet rich in fruit and vegetablesdecreases the risk of lung cancer.
One of these three reviews was that of the WCRF/AICR (1997), whichreviewed seven cohort and 17 case–control studies. Of the seven cohortstudies, after adjustment for smoking, all showed a protective associa-tion for some fruit or vegetable. Most of the relative risks (23 of 31) theypresented were for a protective association, although not all were sta-tistically significant. No studies showed a statistically significant increasein risk for any type of fruit or vegetable. Sixteen of the case–controlstudies reported statistically significant inverse associations for one ormore vegetable or fruit categories. The evidence was most abundant for
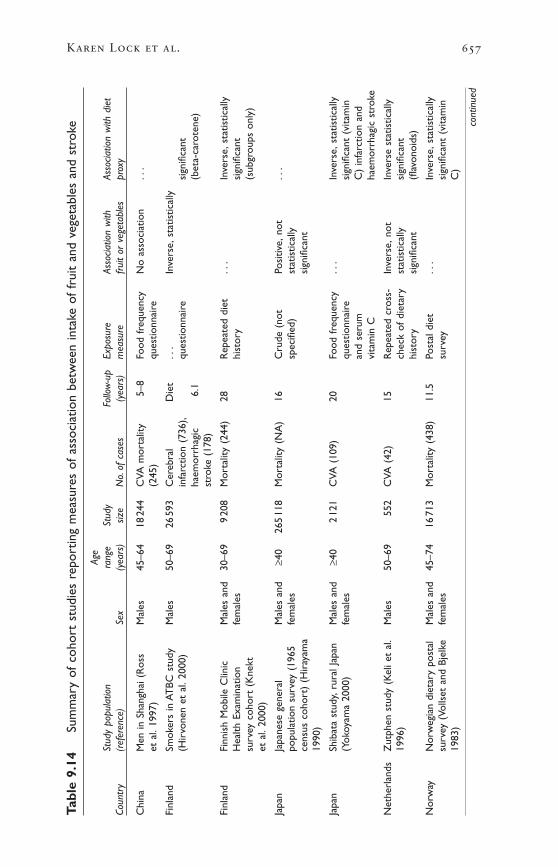
Karen Lock et al. 657
Tabl
e 9.
14Su
mm
ary
of c
ohor
t st
udie
s re
port
ing
mea
sure
s of
ass
ocia
tion
betw
een
inta
ke o
f fr
uit
and
vege
tabl
es a
nd s
trok
e
Age
Stud
y po
pula
tion
rang
eSt
udy
Follo
w-u
pEx
posu
reAs
socia
tion
with
Asso
ciatio
n w
ith d
iet
Coun
try
(ref
eren
ce)
Sex
(yea
rs)
size
No.
of c
ases
(yea
rs)
mea
sure
frui
t or
veg
etab
les
prox
y
Chi
naM
en in
Sha
ngha
i (R
oss
Mal
es45
–64
1824
4C
VA m
orta
lity
5–8
Food
fre
quen
cyN
o as
soci
atio
n..
.et
al.
1997
)(2
45)
ques
tionn
aire
Finl
and
Smok
ers
in A
TBC
stu
dyM
ales
50–6
926
593
Cer
ebra
l D
iet
...
Inve
rse,
stat
istic
ally
(Hir
vone
n et
al.
2000
)in
farc
tion
(736
),qu
estio
nnai
resi
gnifi
cant
haem
orrh
agic
6.1
(bet
a-ca
rote
ne)
stro
ke (
178)
Finl
and
Finn
ish
Mob
ile C
linic
Mal
es a
nd30
–69
920
8M
orta
lity
(244
)28
Rep
eate
d di
et..
.In
vers
e,st
atis
tical
lyH
ealth
Exa
min
atio
nfe
mal
eshi
stor
ysi
gnifi
cant
surv
ey c
ohor
t (K
nekt
(sub
grou
ps o
nly)
et a
l.20
00)
Japa
nJa
pane
se g
ener
alM
ales
and
≥40
265
118
Mor
talit
y (N
A)
16C
rude
(no
tPo
sitiv
e,no
t..
.po
pula
tion
surv
ey (
1965
fem
ales
spec
ified
)st
atis
tical
lyce
nsus
coh
ort)
(H
iray
ama
sign
ifica
nt19
90)
Japa
nSh
ibat
a st
udy,
rura
l Jap
anM
ales
and
≥40
212
1C
VA (
109)
20Fo
od f
requ
ency
...
Inve
rse,
stat
istic
ally
(Yok
oyam
a 20
00)
fem
ales
ques
tionn
aire
sign
ifica
nt (
vita
min
and
seru
mC
) in
farc
tion
and
vita
min
Cha
emor
rhag
ic s
trok
e
Net
herl
ands
Zut
phen
stu
dy (
Kel
i et
al.
Mal
es50
–69
552
CVA
(42
)15
Rep
eate
d cr
oss-
Inve
rse,
not
Inve
rse
stat
istic
ally
1996
)ch
eck
of d
ieta
ryst
atis
tical
lysi
gnifi
cant
hist
ory
sign
ifica
nt(fl
avon
oids
)
Nor
way
Nor
weg
ian
diet
ary
post
alM
ales
and
45–7
416
713
Mor
talit
y (4
38)
11.5
Post
al d
iet
...
Inve
rse,
stat
istic
ally
surv
ey (
Volls
et a
nd B
jelk
efe
mal
essu
rvey
sign
ifica
nt (
vita
min
1983
)C
)
cont
inue
d
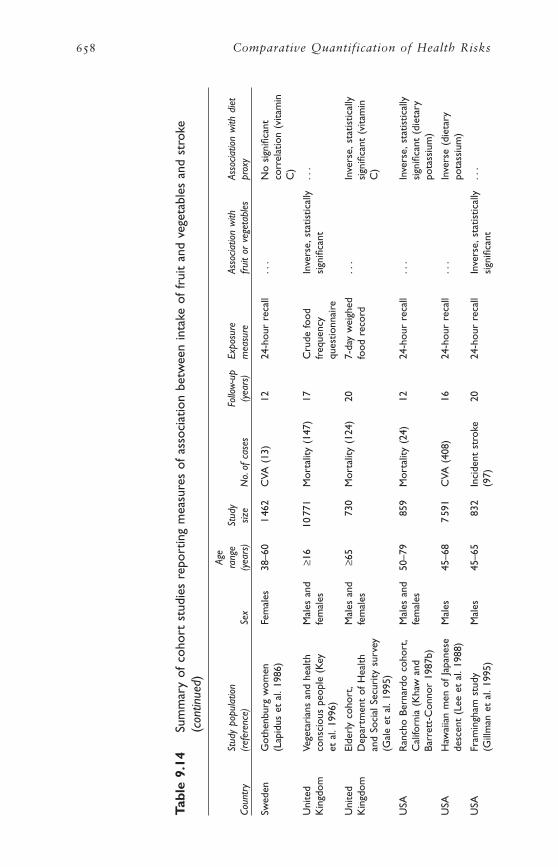
658 Comparative Quantification of Health Risks
Tabl
e 9.
14Su
mm
ary
of c
ohor
t st
udie
s re
port
ing
mea
sure
s of
ass
ocia
tion
betw
een
inta
ke o
f fr
uit
and
vege
tabl
es a
nd s
trok
e(c
ontin
ued)
Age
Stud
y po
pula
tion
rang
eSt
udy
Follo
w-u
pEx
posu
reAs
socia
tion
with
Asso
ciatio
n w
ith d
iet
Coun
try
(ref
eren
ce)
Sex
(yea
rs)
size
No.
of c
ases
(yea
rs)
mea
sure
frui
t or
veg
etab
les
prox
y
Swed
enG
othe
nbur
g w
omen
Fem
ales
38–6
01
462
CVA
(13
)12
24-h
our
reca
ll..
.N
o si
gnifi
cant
(Lap
idus
et
al.1
986)
corr
elat
ion
(vita
min
C)
Uni
ted
Vege
tari
ans
and
heal
thM
ales
and
≥16
1077
1M
orta
lity
(147
)17
Cru
de fo
odIn
vers
e,st
atis
tical
ly..
.K
ingd
omco
nsci
ous
peop
le (
Key
fem
ales
freq
uenc
ysi
gnifi
cant
et a
l.19
96)
ques
tionn
aire
Uni
ted
Elde
rly
coho
rt,
Mal
es a
nd≥6
573
0M
orta
lity
(124
)20
7-da
y w
eigh
ed..
.In
vers
e,st
atis
tical
lyK
ingd
omD
epar
tmen
t of
Hea
lthfe
mal
esfo
od r
ecor
dsi
gnifi
cant
(vi
tam
inan
d So
cial
Sec
urity
sur
vey
C)
(Gal
e et
al.
1995
)
USA
Ran
cho
Bern
ardo
coh
ort,
Mal
es a
nd50
–79
859
Mor
talit
y (2
4)12
24-h
our
reca
ll..
.In
vers
e,st
atis
tical
lyC
alifo
rnia
(K
haw
and
fem
ales
sign
ifica
nt (
diet
ary
Barr
ett-
Con
nor
1987
b)po
tass
ium
)
USA
Haw
aiia
n m
en o
f Ja
pane
seM
ales
45–6
87
591
CVA
(40
8)16
24-h
our
reca
ll..
.In
vers
e (d
ieta
ryde
scen
t (L
ee e
t al
.198
8)po
tass
ium
)
USA
Fram
ingh
am s
tudy
Mal
es45
–65
832
Inci
dent
str
oke
2024
-hou
r re
call
Inve
rse,
stat
istic
ally
...
(Gill
man
et
al.1
995)
(97)
sign
ifica
nt
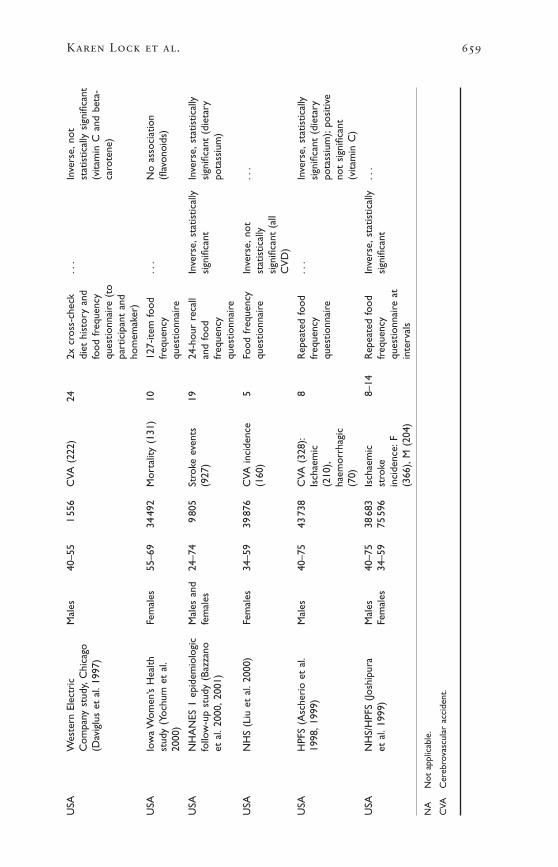
Karen Lock et al. 659
USA
Wes
tern
Ele
ctri
cM
ales
40–5
51
556
CVA
(22
2)24
2x c
ross
-che
ck..
.In
vers
e,no
tC
ompa
ny s
tudy
,Chi
cago
diet
his
tory
and
stat
istic
ally
sig
nific
ant
(Dav
iglu
s et
al.
1997
)fo
od f
requ
ency
(vita
min
C a
nd b
eta-
ques
tionn
aire
(to
caro
tene
)pa
rtic
ipan
t an
dho
mem
aker
)
USA
Iow
a W
omen
’s H
ealth
Fem
ales
55–6
934
492
Mor
talit
y (1
31)
1012
7-ite
m fo
od..
.N
o as
soci
atio
nst
udy
(Yoc
hum
et
al.
freq
uenc
y(fl
avon
oids
)20
00)
ques
tionn
aire
USA
NH
AN
ES 1
epi
dem
iolo
gic
Mal
es a
nd24
–74
980
5St
roke
eve
nts
1924
-hou
r re
call
Inve
rse,
stat
istic
ally
Inve
rse,
stat
istic
ally
follo
w-u
p st
udy
(Baz
zano
fem
ales
(927
)an
d fo
odsi
gnifi
cant
sign
ifica
nt (
diet
ary
et a
l.20
00,2
001)
freq
uenc
ypo
tass
ium
)qu
estio
nnai
re
USA
NH
S (L
iu e
t al
.200
0)Fe
mal
es34
–59
3987
6C
VA in
cide
nce
5Fo
od f
requ
ency
Inve
rse,
not
...
(160
)qu
estio
nnai
rest
atis
tical
lysi
gnifi
cant
(al
lC
VD
)
USA
HPF
S (A
sche
rio
et a
l.M
ales
40–7
543
738
CVA
(32
8):
8R
epea
ted
food
...
Inve
rse,
stat
istic
ally
1998
,199
9)Is
chae
mic
freq
uenc
ysi
gnifi
cant
(di
etar
y(2
10),
ques
tionn
aire
pota
ssiu
m);
posi
tive
haem
orrh
agic
not
sign
ifica
nt(7
0)(v
itam
in C
)
USA
NH
S/H
PFS
(Josh
ipur
aM
ales
40–7
538
683
Isch
aem
ic8–
14R
epea
ted
food
Inve
rse,
stat
istic
ally
...
et a
l.19
99)
Fem
ales
34–5
975
596
stro
kefr
eque
ncy
sign
ifica
ntin
cide
nce:
Fqu
estio
nnai
re a
t(3
66),
M (
204)
inte
rval
s
NA
Not
app
licab
le.
CVA
Cer
ebro
vasc
ular
acc
iden
t.

green vegetables and carrots. Results of an analysis of dose–responserelationship between vegetable intake and risk of lung cancer estimatedthat the relative risk decreases by about 50% as intake increases from150g/day to 400g/day. An intake of >400g/day is always associated witha lower risk than 100g/day or less.
In their review, Ziegler et al. (1996b) asserted that the results of obser-vational studies of diet and lung cancer suggest strongly that an increasedfruit and vegetable intake is associated with a reduced risk in men and women; in various countries; in smokers, ex-smokers, and never-smokers; and for all types of lung cancer.
The review by Klerk et al. (1998) concluded that high vs low con-sumption of fruit and vegetables (an average difference of 150g/day) is likely to reduce the risk of lung cancer by 35–55% in men and women.
Koo (1997), in contrast, concluded that epidemiological studies per-formed over the last 20 years do not provide overwhelming evidence ofan inverse association between fruit and vegetable consumption and lungcancer risk. Koo proposed the imperfect control of smoking-associateddietary correlates and “lifestyle” differences as the major problems withthe perceived associations between diet and lung cancer.
Current review of the literature
The literature review identified 21 cohort and 32 case–control studiesthat examined the association of fruit and vegetable intake with the riskof lung cancer incidence and mortality. Details of the studies are pro-vided in Tables 9.15 and 9.16. Overall, the evidence appears to supportan inverse relationship between fruit and vegetable consumption andlung cancer risk (both incidence and mortality).
The cohort studies identified were conducted in a range of countriesincluding Finland, Japan, the Netherlands, the United States and othersouthern and northern European countries included in the Seven Coun-tries study. The study populations were not necessarily nationally repre-sentative as some studies were limited to religious groups or those withparticular lifestyle characteristics (Fraser et al. 1991; Key et al. 1996),specific occupational groups (Feskanich et al. 2000; Michaud et al. 2000)or very narrow age groups such as the elderly (Shibata et al. 1992). Threestudies from the United States analysed national survey data and aretherefore perhaps more nationally representative. Very few studies wereof young people.
It should be noted that, of the 21 cohort studies, five of the study populations were each used in more than one study. The studies differedin their analysis by reporting different risk factors (i.e. carotenoids vsfruit and vegetables) or using different outcome measures (mortality vsincidence).
Twelve studied incidence of lung cancer as the outcome measure, whileeight studied lung cancer mortality. Follow-up periods varied between
660 Comparative Quantification of Health Risks
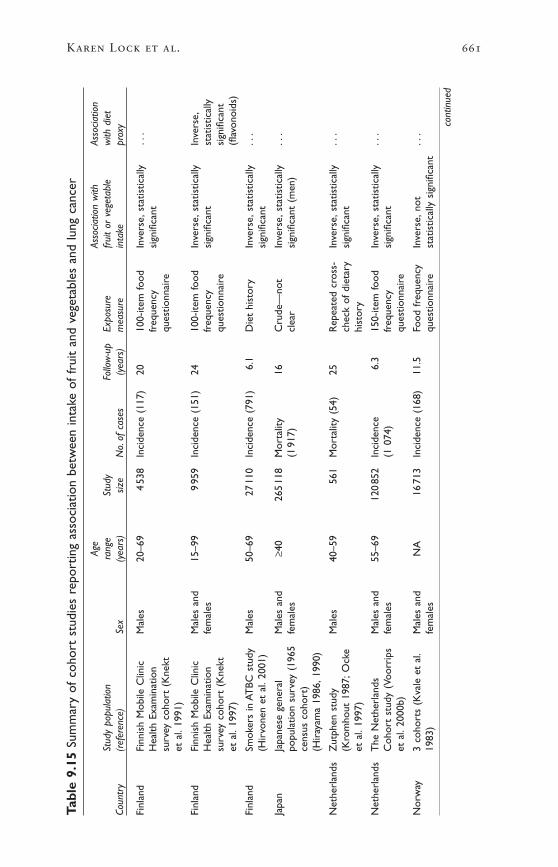
Karen Lock et al. 661
Tabl
e 9.
15Su
mm
ary
of c
ohor
t st
udie
s re
port
ing
asso
ciat
ion
betw
een
inta
ke o
f fr
uit
and
vege
tabl
es a
nd lu
ng c
ance
r
Age
Asso
ciatio
n w
ithAs
socia
tion
Stud
y po
pula
tion
rang
eSt
udy
Follo
w-u
pEx
posu
refr
uit
or v
eget
able
with
die
tCo
untr
y(r
efer
ence
)Se
x(y
ears
)siz
eN
o.of
cas
es(y
ears
)m
easu
rein
take
prox
y
Finl
and
Finn
ish
Mob
ile C
linic
Mal
es20
–69
453
8In
cide
nce
(117
)20
100-
item
food
Inve
rse,
stat
istic
ally
...
Hea
lth E
xam
inat
ion
freq
uenc
ysi
gnifi
cant
surv
ey c
ohor
t (K
nekt
ques
tionn
aire
et a
l.19
91)
Finl
and
Finn
ish
Mob
ile C
linic
Mal
es a
nd15
–99
995
9In
cide
nce
(151
)24
100-
item
food
Inve
rse,
stat
istic
ally
Inve
rse,
Hea
lth E
xam
inat
ion
fem
ales
freq
uenc
ysi
gnifi
cant
stat
istic
ally
surv
ey c
ohor
t (K
nekt
ques
tionn
aire
sign
ifica
ntet
al.
1997
)(fl
avon
oids
)
Finl
and
Smok
ers
in A
TBC
stu
dyM
ales
50–6
927
110
Inci
denc
e (7
91)
6.1
Die
t hi
stor
yIn
vers
e,st
atis
tical
ly..
.(H
irvo
nen
et a
l.20
01)
sign
ifica
nt
Japa
nJa
pane
se g
ener
alM
ales
and
≥40
265
118
Mor
talit
y16
Cru
de—
not
Inve
rse,
stat
istic
ally
...
popu
latio
n su
rvey
(19
65fe
mal
es(1
917)
clea
rsi
gnifi
cant
(m
en)
cens
us c
ohor
t)(H
iray
ama
1986
,199
0)
Net
herl
ands
Zut
phen
stu
dyM
ales
40–5
956
1M
orta
lity
(54)
25R
epea
ted
cros
s-In
vers
e,st
atis
tical
ly..
.(K
rom
hout
198
7;O
cke
chec
k of
die
tary
sign
ifica
ntet
al.
1997
)hi
stor
y
Net
herl
ands
The
Net
herl
ands
Mal
es a
nd55
–69
120
852
Inci
denc
e6.
315
0-ite
m fo
odIn
vers
e,st
atis
tical
ly..
.C
ohor
t st
udy
(Voo
rrip
sfe
mal
es(1
074)
freq
uenc
ysi
gnifi
cant
et a
l.20
00b)
ques
tionn
aire
Nor
way
3 co
hort
s (K
vale
et
al.
Mal
es a
ndN
A16
713
Inci
denc
e (1
68)
11.5
Food
fre
quen
cyIn
vers
e,no
t..
.19
83)
fem
ales
ques
tionn
aire
stat
istic
ally
sig
nific
ant
cont
inue
d
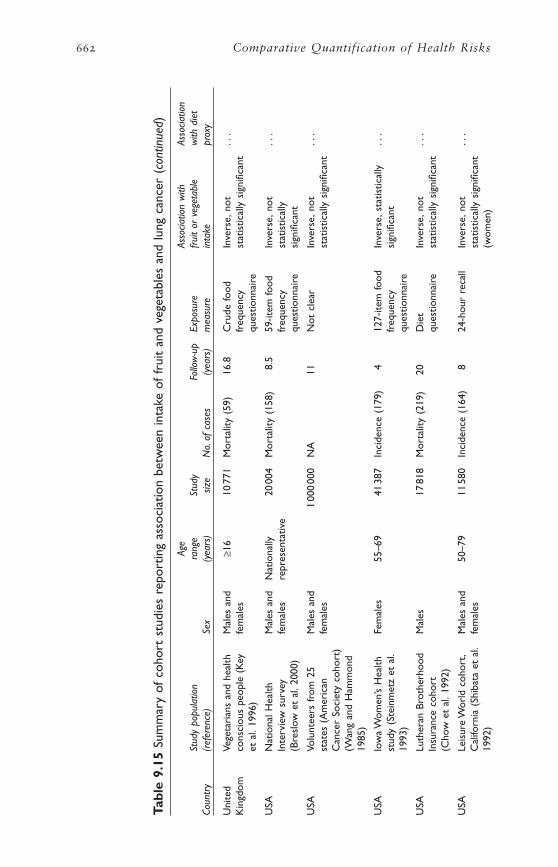
662 Comparative Quantification of Health Risks
Tabl
e 9.
15Su
mm
ary
of c
ohor
t st
udie
s re
port
ing
asso
ciat
ion
betw
een
inta
ke o
f fr
uit
and
vege
tabl
es a
nd lu
ng c
ance
r (c
ontin
ued)
Age
Asso
ciatio
n w
ithAs
socia
tion
Stud
y po
pula
tion
rang
eSt
udy
Follo
w-u
pEx
posu
refr
uit
or v
eget
able
with
die
tCo
untr
y(r
efer
ence
)Se
x(y
ears
)siz
eN
o.of
cas
es(y
ears
)m
easu
rein
take
prox
y
Uni
ted
Vege
tari
ans
and
heal
thM
ales
and
≥16
1077
1M
orta
lity
(59)
16.8
Cru
de fo
odIn
vers
e,no
t..
.K
ingd
omco
nsci
ous
peop
le (
Key
fem
ales
freq
uenc
yst
atis
tical
ly s
igni
fican
tet
al.
1996
)qu
estio
nnai
re
USA
Nat
iona
l Hea
lthM
ales
and
Nat
iona
lly20
004
Mor
talit
y (1
58)
8.5
59-it
em fo
odIn
vers
e,no
t..
.In
terv
iew
sur
vey
fem
ales
repr
esen
tativ
efr
eque
ncy
stat
istic
ally
(Bre
slow
et
al.2
000)
ques
tionn
aire
sign
ifica
nt
USA
Volu
ntee
rs f
rom
25
Mal
es a
nd1
000
000
NA
11N
ot c
lear
Inve
rse,
not
...
stat
es (
Am
eric
anfe
mal
esst
atis
tical
ly s
igni
fican
tC
ance
r So
ciet
y co
hort
)(W
ang
and
Ham
mon
d19
85)
USA
Iow
a W
omen
’s H
ealth
Fem
ales
55–6
941
387
Inci
denc
e (1
79)
412
7-ite
m fo
odIn
vers
e,st
atis
tical
ly..
.st
udy
(Ste
inm
etz
et a
l.fr
eque
ncy
sign
ifica
nt19
93)
ques
tionn
aire
USA
Luth
eran
Bro
ther
hood
Mal
es17
818
Mor
talit
y (2
19)
20D
iet
Inve
rse,
not
...
Insu
ranc
e co
hort
ques
tionn
aire
stat
istic
ally
sig
nific
ant
(Cho
w e
t al
.199
2)
USA
Leis
ure
Wor
ld c
ohor
t,M
ales
and
50–7
911
580
Inci
denc
e (1
64)
824
-hou
r re
call
Inve
rse,
not
...
Cal
iforn
ia (
Shib
ata
et a
l.fe
mal
esst
atis
tical
ly s
igni
fican
t19
92)
(wom
en)
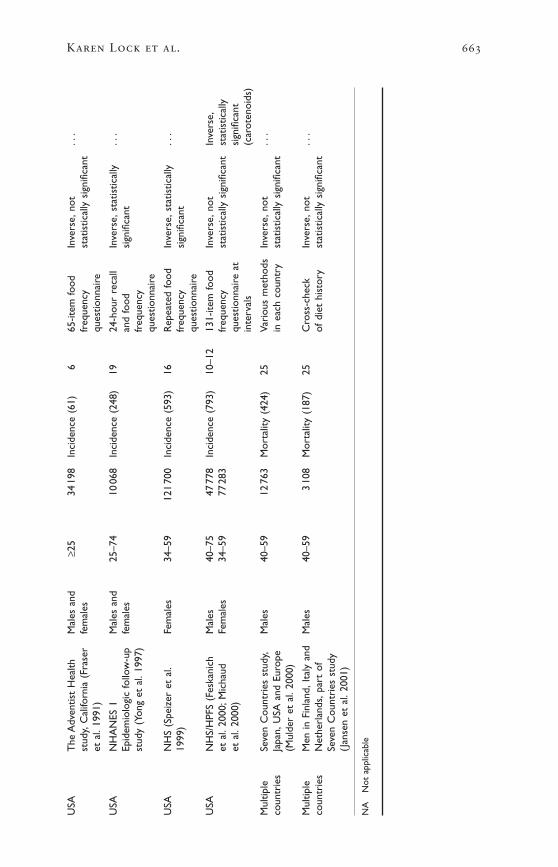
Karen Lock et al. 663
USA
The
Adv
entis
t H
ealth
Mal
es a
nd≥2
534
198
Inci
denc
e (6
1)6
65-it
em fo
odIn
vers
e,no
t..
.st
udy,
Cal
iforn
ia (
Fras
erfe
mal
esfr
eque
ncy
stat
istic
ally
sig
nific
ant
et a
l.19
91)
ques
tionn
aire
USA
NH
AN
ES 1
Mal
es a
nd25
–74
1006
8In
cide
nce
(248
)19
24-h
our
reca
llIn
vers
e,st
atis
tical
ly..
.Ep
idem
iolo
gic
follo
w-u
pfe
mal
esan
d fo
odsi
gnifi
cant
stud
y (Y
ong
et a
l.19
97)
freq
uenc
yqu
estio
nnai
re
USA
NH
S (S
peiz
er e
t al
.Fe
mal
es34
–59
121
700
Inci
denc
e (5
93)
16R
epea
ted
food
Inve
rse,
stat
istic
ally
...
1999
)fr
eque
ncy
sign
ifica
ntqu
estio
nnai
re
USA
NH
S/H
PFS
(Fes
kani
chM
ales
40–7
547
778
Inci
denc
e (7
93)
10–1
213
1-ite
m fo
odIn
vers
e,no
tIn
vers
e,et
al.
2000
;Mic
haud
Fem
ales
34–5
977
283
freq
uenc
yst
atis
tical
ly s
igni
fican
tst
atis
tical
lyet
al.
2000
)qu
estio
nnai
re a
tsi
gnifi
cant
inte
rval
s(c
arot
enoi
ds)
Mul
tiple
Seve
n C
ount
ries
stu
dy,
Mal
es40
–59
1276
3M
orta
lity
(424
)25
Vari
ous
met
hods
Inve
rse,
not
...
coun
trie
sJa
pan,
USA
and
Eur
ope
in e
ach
coun
try
stat
istic
ally
sig
nific
ant
(Mul
der
et a
l.20
00)
Mul
tiple
Men
in F
inla
nd,I
taly
and
Mal
es40
–59
310
8M
orta
lity
(187
)25
Cro
ss-c
heck
Inve
rse,
not
...
coun
trie
sN
ethe
rlan
ds,p
art
ofof
die
t hi
stor
yst
atis
tical
ly s
igni
fican
tSe
ven
Cou
ntri
es s
tudy
(Jan
sen
et a
l.20
01)
NA
Not
app
licab
le

664 Comparative Quantification of Health Risks
Tabl
e 9.
16Su
mm
ary
of c
ase–
cont
rol s
tudi
es r
epor
ting
an a
ssoc
iatio
n be
twee
n fr
uit
and
vege
tabl
e in
take
and
lung
can
cer
Asso
ciatio
n w
ith f
ruit
Asso
ciatio
n w
ith s
pecifi
cCo
untr
ySt
udy
popu
latio
n/ar
ea (
refe
renc
e)Se
xor
veg
etab
les
risk
fact
ors
only
Braz
ilR
io d
e Ja
neir
o (S
uzuk
i et
al.1
994)
Mal
es a
nd fe
mal
esN
ull
—
Can
ada
Toro
nto
(Jain
et
al.1
990)
Mal
es a
nd fe
mal
esIn
vers
e (v
eget
able
s)—
Chi
na(H
u et
al.
1997
)M
ales
and
fem
ales
Nul
l—
Chi
naYu
nnan
min
ers
(For
man
et
al.1
992)
Mal
esN
ull
—
Chi
naYu
nnan
min
ers
(Sw
anso
n et
al.
1992
)M
ales
Inve
rse
(veg
etab
les)
—
Nul
l (fr
uit)
Chi
naN
orth
-eas
t C
hina
,wom
en (
Wu-
Will
iam
s et
al.
1990
)Fe
mal
esN
ull
—
Chi
na
Hon
g K
ong
SAR
Nev
er-s
mok
ers
(Koo
198
8)Fe
mal
esN
ull
—
Gre
ece
Nev
er-s
mok
ers
(Kal
andi
di e
t al
.199
0)Fe
mal
esIn
vers
e (fr
uit)
—
Indi
aK
eral
a (S
anka
rana
raya
nan
et a
l.19
94)
Mal
es a
nd fe
mal
esN
ull
Inve
rse
(pum
pkin
,oni
on)
Ital
yLo
mba
rdy
(Pis
ani e
t al
.198
6)M
ales
and
fem
ales
—In
vers
e (c
arro
t)
Japa
nN
agoy
a (T
akez
aki e
t al
.200
1)M
ales
and
fem
ales
Inve
rse
—
Japa
nTo
kai (
Gao
et
al.1
993)
Mal
es a
nd fe
mal
esIn
vers
e—
Pola
nd(P
awle
ga e
t al
.199
7)M
ales
Inve
rse
Nul
l (gr
een
vege
tabl
es)
Pola
nd(R
acht
an a
nd S
okol
owsk
i 199
7)Fe
mal
esIn
vers
e—no
sm
okin
g ad
just
men
t—
Spai
nBa
rcel
ona
(Agu
do e
t al
.199
7)Fe
mal
esIn
vers
e (v
eget
able
s),n
ull (
frui
t)—
Swed
enSt
ockh
olm
,nev
er-s
mok
ers
(Nyb
erg
et a
l.19
98)
Mal
es a
nd fe
mal
esN
ull
—
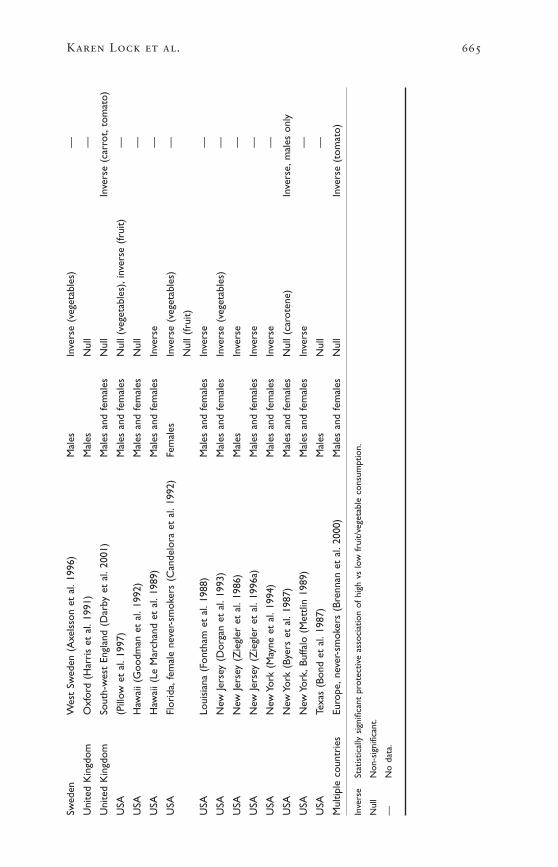
Karen Lock et al. 665
Swed
enW
est
Swed
en (
Axe
lsso
n et
al.
1996
)M
ales
Inve
rse
(veg
etab
les)
—
Uni
ted
Kin
gdom
Oxf
ord
(Har
ris
et a
l.19
91)
Mal
esN
ull
—
Uni
ted
Kin
gdom
Sout
h-w
est
Engl
and
(Dar
by e
t al
.200
1)M
ales
and
fem
ales
Nul
lIn
vers
e (c
arro
t,to
mat
o)
USA
(Pill
ow e
t al
.199
7)M
ales
and
fem
ales
Nul
l (ve
geta
bles
),in
vers
e (fr
uit)
—
USA
Haw
aii (
Goo
dman
et
al.1
992)
Mal
es a
nd fe
mal
esN
ull
—
USA
Haw
aii (
Le M
arch
and
et a
l.19
89)
Mal
es a
nd fe
mal
esIn
vers
e—
USA
Flor
ida,
fem
ale
neve
r-sm
oker
s (C
ande
lora
et
al.1
992)
Fem
ales
Inve
rse
(veg
etab
les)
—
Nul
l (fr
uit)
USA
Loui
sian
a (F
onth
am e
t al
.198
8)M
ales
and
fem
ales
Inve
rse
—
USA
New
Jers
ey (
Dor
gan
et a
l.19
93)
Mal
es a
nd fe
mal
esIn
vers
e (v
eget
able
s)—
USA
New
Jers
ey (
Zie
gler
et
al.1
986)
Mal
esIn
vers
e—
USA
New
Jers
ey (
Zie
gler
et
al.1
996a
)M
ales
and
fem
ales
Inve
rse
—
USA
New
Yor
k (M
ayne
et
al.1
994)
Mal
es a
nd fe
mal
esIn
vers
e—
USA
New
Yor
k (B
yers
et
al.1
987)
Mal
es a
nd fe
mal
esN
ull (
caro
tene
)In
vers
e,m
ales
onl
y
USA
New
Yor
k,Bu
ffalo
(M
ettli
n 19
89)
Mal
es a
nd fe
mal
esIn
vers
e—
USA
Texa
s (B
ond
et a
l.19
87)
Mal
esN
ull
—
Mul
tiple
cou
ntri
esEu
rope
,nev
er-s
mok
ers
(Bre
nnan
et
al.2
000)
Mal
es a
nd fe
mal
esN
ull
Inve
rse
(tom
ato)
Inve
rse
Stat
istic
ally
sig
nific
ant
prot
ectiv
e as
soci
atio
n of
hig
h vs
low
fru
it/ve
geta
ble
cons
umpt
ion.
Nul
lN
on-s
igni
fican
t.
—N
o da
ta.

four and 25 years, with 16 studies having follow-up periods longer than10 years. Twelve of the studies investigated populations of men andwomen, seven studies had male-only cohorts and two studies wereentirely female. Most studies have pooled the results for men andwomen, the explanation being that the number of lung cancer cases inwomen is too small to justify a meaningful separate analysis. Only a fewstudies have analysed men and women separately, usually where theentire study cohort was either men or women. More detailed character-istics of all studies are given in Table 9.15.
Eleven studies showed a statistically significant inverse associationbetween a diet high in fruit or vegetables (one of these was significantfor dietary carotenoids) and lung cancer. The remainder of the studiesshowed an inverse association that was not statistically significant. Insome studies with non-significant results for total fruit and vegetables,subcohort analyses were reported as having significant associations.
Of particular interest are studies of lung cancer incidence and mor-tality that considered non-smokers, former smokers and smokers sepa-rately in the analyses. It appears that the benefit conferred through a highintake of fruit and vegetables more often reaches statistical significancein current smokers than in non-smokers (however, confidence intervalsare often large and overlap). In summary, eight of the cohort studiesreviewed for this project stratified the analyses by smoking status. Threeof these showed a significant relationship between fruit and vegetableconsumption and lung cancer incidence in smokers but not in non-smokers (but for one of these, the relative risks of both groups weresimilar) (Fraser et al. 1991; Knekt et al. 1991; Yong et al. 1997), whileonly one study showed an inverse relationship in non-smokers only(Knekt et al. 1997). The other studies showed non-significant results(Feskanich et al. 2000; Mulder et al. 2000; Steinmetz et al. 1993; Voor-rips et al. 2000b) for both smokers and non-smokers. These resultswould tend to agree with the hypothesized biological mechanisms for thebenefits of fruit and vegetables in lung cancer through late stage modi-fication of carcinogenesis following an initial carcinogen exposure.Further research is needed to consider the current inconsistencies in find-ings, including exposure among non-smokers to environmental tobaccosmoke and the range of other lung cancer risk factors.
The literature review identified 32 case–control studies that satisfiedthe inclusion criteria. These are summarized in Table 9.16. As thecase–control studies were not used in the meta-analyses, fewer studydetails are provided here for conciseness. These studies were conductedacross a range of populations including Brazil (1), Canada (13), China(4), Greece (1), India (1), Italy (1), Japan (2), Poland (2), Spain (1),Sweden (2), the United Kingdom (2) and the United States. Of thestudies, 19 collected data from men and women, seven from men onlyand six from women only.
666 Comparative Quantification of Health Risks

Eighteen found an inverse relationship between a high intake of fruitor vegetables and lung cancer. When separate associations with fruit andvegetables were analysed, there seemed to be a greater number of studiesfinding significant associations with vegetables as a group compared tofruit as a group. Four of the studies found significant associations onlywith specific types of vegetables, such as pumpkin and onion (Sankara-narayanan et al. 1994), or tomato (Brennan et al. 2000), or carrot (Pisaniet al. 1986) or in specific age groups such as men aged 60–79 years (Byerset al. 1987). The results of these subgroup analyses should be treatedwith caution.
Of the four case–control studies that specifically collected andanalysed data on non-smokers, two found no association, while twofound a significant inverse association between fruit or vegetable con-sumption and lung cancer. But due to the inherent limitations ofcase–control studies, the results do not necessarily imply that dietarymodification after quitting smoking is effective in reducing risk. Ex-smokers with elevated vegetable and fruit consumption could have beenhigh consumers while they were smokers as well. However, the resultsof case–control studies seem consistent with the results of the cohortstudies.
Although outside the criteria of this review, it is important to mentionsome of the evidence from experimental studies that may appear to con-tradict the protective relationship of fruit and vegetables on lung cancer.The CARET study (Anonymous 1994) and the ATBC study (Omenn etal. 1996b) were randomized control trials designed to investigate theeffect of beta-carotene high-dose supplementation on lung cancer. Theresults of these trials suggested a harmful effect (increase in incidenceand mortality) of beta-carotene supplementation in current smokers.This suggests that raised beta-carotene may be a marker associated withother protective factors found in foods (Lonn and Yusuf 1999), and thatthe status of the antioxidant hypothesis might need to be re-evaluatedcritically (Ness et al. 1999a).
Confounding and interactions
All studies of lung cancer adjusted for age, sex and smoking in theiranalyses, except for one case–control study from Poland (Rachtan andSokolowski 1997), which did not adjust for smoking. Other potentialconfounders dealt with statistically included: environmental tobaccosmoke; previous lung disease; occupational exposure (arsenic, asbestos,chloromethyl ethers and nickel); radon; air pollution; total energy intake;intake of other macronutrients; BMI; physical activity; and socioeco-nomic status (using educational level or occupation used as a proxy).The actual adjustment varied among studies.
Smoking is the most important potential confounder to consider giventhe strength of the association between smoking and lung cancer. Thereis also the possibility of smoking being an effect modifier but published
Karen Lock et al. 667
results are contradictory. The studies reviewed here have dealt withsmoking in a number of ways. Some studies have not only adjusted forcurrent smoking status, but have also considered the intensity of currentsmoking behaviour (as the number of cigarettes smoked per day), age ofstarting smoking and duration of smoking. For current non-smokers,several studies have also adjusted for time since quitting (including inten-sity) in ex-smokers. A couple of studies also adjusted for time since quit-ting for subjects who quit during follow-up.
An important issue, highlighted by Ziegler et al. (1996b), is thatseveral studies have shown that consumption of fruit, vegetables andcarotenoids is higher in non-smokers compared with current smokers,and that consumption is inversely related to smoking intensity insmokers. Thus, those studies that only considered smoking statuswithout smoking intensity might have generated inflated estimates of theprotective effect of fruit and vegetables.
The interpretation of these studies is difficult given the strong mis-classification bias and the strong association between lung cancer andtobacco use, making it difficult to ensure that all the confounding effectsfrom smoking have been removed (Boshuizen et al. 2002).
Summary
There is some evidence of an inverse relationship in many populationsbetween lung cancer risk and fruit and vegetable consumption. There iscurrently not enough evidence to justify stratifying the results by smokingstatus.
GASTRIC CANCER
A detailed description of the studies included in the review of the liter-ature follows.
Previous reviews of the literature
Four recent reviews of the literature concluded that epidemiological evi-dence shows a consistent protective effect of fruit and vegetable intakeon stomach cancer risk (Klerk et al. 1998; Kono and Hirohata 1996;Steinmetz and Potter 1996; World Cancer Research Fund and AmericanInstitute for Cancer Research 1997).
The report from the WCRF/AICR (1997) reviewed six cohort and 32case–control studies. Three of the six cohort studies and 27 of the 32case–control studies reported a statistically significant protective associ-ation for one or more vegetable or fruit categories. The evidence for rawvegetables, allium vegetables and citrus fruit in particular is consistentwith a protective effect. Any contradictory evidence related entirely tosalted and pickled vegetables. Analyses of dose–response relationshipssuggested that the risk of stomach cancer decreases by about 50% asfruit and vegetable intake increases from 50g/day to 300g/day. An intakeof >150g/day is always associated with a lower risk than 100g/day or
668 Comparative Quantification of Health Risks
less. In comparison, the review by Klerk et al. (1998) concluded that highvs low consumption of fruit and vegetables (an average difference of150g/day) is likely to reduce the risk of stomach cancer by 40–55% inmen and women.
A recent meta-analysis by Norat et al. (2001) of previously publishedcase–control and cohort studies examined the association of total fruitor total vegetable consumption with gastric, colorectal and oesophagealcancer. It included all studies published in English from 1973–2000 andreferenced in Medline that provided data on total fruit or vegetableintake. There was no assessment of study quality, adjustment for con-founders was not assessed and studies were included as long as theycould provide the information necessary for the statistical analysis. Forgastric cancer, 32 studies were included that analysed total fruit intakeand 22 studies were included for total vegetable intake. The pooled rel-ative risks associated with an increase of consumption of 100g/day were0.75 (95% CI 0.67–0.83) for fruit and 0.80 (0.74–0.86) for vegetables.
Current review of the literature
The current literature review identified 14 cohort and 32 case–controlstudies that investigated the association between gastric cancer risk (inci-dence and mortality) and the consumption of fruit and/or vegetables.Overall, the evidence seems to support an inverse association betweenfruit and vegetable consumption and gastric cancer risk.
The 14 cohort studies were conducted in populations from both devel-oped and developing countries including one from China, two fromJapan, two from mainland USA, three of Japanese descendants in Hawaiiand six from Europe. The Asian populations had a relatively high risk of stomach cancer. The results of the studies are summarized in Table 9.17.
Of these studies, nine investigated the effect of fruit and vegetableintake on gastric cancer incidence, while the remaining five studied mor-tality. Two cohorts were investigated in more than one study (the Nether-lands Cohort study, and Japanese descendants in Hawaii in the HonoluluHeart Program). Seven cohorts consisted of both men and women, sixstudies investigated men only and one study focused exclusively on post-menopausal women. Follow-up of cohorts ranged from five to 25years.
A statistically significant inverse association between gastric cancerand fruit and vegetable intake was reported in four studies. This inverserelationship was found in populations of both European and Japaneseorigin. The 10 other studies showed inverse relationships, but they werenot statistically significant for fruit and vegetable, or nutrient intake.
The 32 case–control studies, summarized in Table 9.18, represented awider range of populations and geographical areas than the cohortstudies. Studies were conducted in Canada and the United States (5),China (3), Japan (4), Mexico (1), Poland (1), the Republic of Korea (1),
Karen Lock et al. 669

670 Comparative Quantification of Health Risks
Tabl
e 9.
17Su
mm
ary
of c
ohor
t st
udie
s re
port
ing
a m
easu
re o
f as
soci
atio
n be
twee
n in
take
of
frui
t an
d ve
geta
bles
and
gas
tric
canc
er
Age
Asso
ciatio
nSt
udy
popu
latio
nra
nge
Stud
yFo
llow
-up
Expo
sure
Asso
ciatio
n w
ithw
ith d
iet
Coun
try
(ref
eren
ce)
Sex
(yea
rs)
size
No.
of c
ases
(yea
rs)
mea
sure
frui
t or
veg
etab
les
prox
y
Chi
naLi
nxia
n N
utri
tion
Inte
rven
tion
Mal
es a
ndN
A29
584
Inci
denc
e (5
39)
5D
ieta
ryIn
vers
e,no
t—
Tria
l coh
ort
(Guo
et
al.1
994)
fem
ales
inte
rvie
wst
atis
tical
lysi
gnifi
cant
(fr
uit)
Finl
and
Smok
ers
in A
TBC
stu
dyM
ales
50–6
927
110
Inci
denc
e (1
11)
6.1
Food
fre
quen
cy—
Inve
rse,
not
(Hir
vone
n et
al.
2001
)qu
estio
nnai
rest
atis
tical
lysi
gnifi
cant
(flav
onoi
ds)
Japa
nJa
pane
se g
ener
al p
opul
atio
nM
ales
and
≥40
265
118
Mor
talit
y (5
247)
17C
rude
—no
tIn
vers
e,st
atis
tical
ly—
surv
ey (
1965
cen
sus
coho
rt)
fem
ales
clea
rsi
gnifi
cant
tre
nd(H
iray
ama
1986
,199
0)
Japa
nR
ural
coh
ort
(Kat
o et
al.
1992
)M
ales
and
NA
975
3M
orta
lity
(57)
6Fo
od f
requ
ency
Inve
rse,
not
—fe
mal
esqu
estio
nnai
rest
atis
tical
lysi
gnifi
cant
Net
herl
ands
The
Net
herl
ands
Coh
ort
stud
yM
ales
and
55–6
912
085
2In
cide
nce
(282
)6.
315
0-ite
m fo
odIn
vers
e,st
atis
tical
lyN
on-s
igni
fican
t(B
otte
rwec
k et
al.
1998
,200
0)fe
mal
esfr
eque
ncy
sign
ifica
nttr
ends
:inv
erse
ques
tionn
aire
(vita
min
C),
posi
tive
(bet
a-ca
rote
ne,
retin
ol)
Swed
enC
ohor
t of
Sw
edis
h tw
ins
Mal
es a
ndN
A11
546
Inci
denc
e (1
16)
21C
rude
food
Inve
rse,
stat
istic
ally
—(T
erry
et
al.1
998)
fem
ales
freq
uenc
ysi
gnifi
cant
ques
tionn
aire
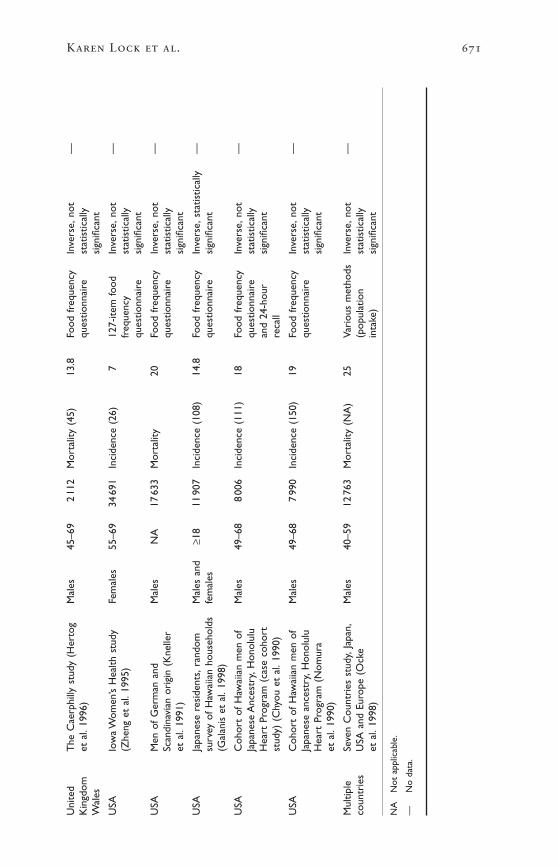
Karen Lock et al. 671
Uni
ted
The
Cae
rphi
lly s
tudy
(H
erto
gM
ales
45–6
92
112
Mor
talit
y (4
5)13
.8Fo
od f
requ
ency
Inve
rse,
not
—K
ingd
omet
al.
1996
)qu
estio
nnai
rest
atis
tical
lyW
ales
sign
ifica
nt
USA
Iow
a W
omen
’s H
ealth
stu
dyFe
mal
es55
–69
3469
1In
cide
nce
(26)
712
7-ite
m fo
odIn
vers
e,no
t—
(Zhe
ng e
t al
.199
5)fr
eque
ncy
stat
istic
ally
ques
tionn
aire
sign
ifica
nt
USA
Men
of
Ger
man
and
Mal
esN
A17
633
Mor
talit
y20
Food
fre
quen
cyIn
vers
e,no
t—
Scan
dina
vian
ori
gin
(Kne
ller
ques
tionn
aire
stat
istic
ally
et a
l.19
91)
sign
ifica
nt
USA
Japa
nese
res
iden
ts,r
ando
mM
ales
and
≥18
1190
7In
cide
nce
(108
)14
.8Fo
od f
requ
ency
Inve
rse,
stat
istic
ally
—su
rvey
of
Haw
aiia
n ho
useh
olds
fem
ales
ques
tionn
aire
sign
ifica
nt(G
alan
is e
t al
.199
8)
USA
Coh
ort
of H
awai
ian
men
of
Mal
es49
–68
800
6In
cide
nce
(111
)18
Food
fre
quen
cyIn
vers
e,no
t—
Japa
nese
Anc
estr
y,H
onol
ulu
ques
tionn
aire
stat
istic
ally
Hea
rt P
rogr
am (
case
coh
ort
and
24-h
our
sign
ifica
ntst
udy)
(C
hyou
et
al.1
990)
reca
ll
USA
Coh
ort
of H
awai
ian
men
of
Mal
es49
–68
799
0In
cide
nce
(150
)19
Food
fre
quen
cyIn
vers
e,no
t—
Japa
nese
anc
estr
y,H
onol
ulu
ques
tionn
aire
stat
istic
ally
Hea
rt P
rogr
am (
Nom
ura
sign
ifica
ntet
al.
1990
)
Mul
tiple
Seve
n C
ount
ries
stu
dy,J
apan
,M
ales
40–5
912
763
Mor
talit
y (N
A)
25Va
riou
s m
etho
dsIn
vers
e,no
t—
coun
trie
sU
SA a
nd E
urop
e (O
cke
(pop
ulat
ion
stat
istic
ally
et a
l.19
98)
inta
ke)
sign
ifica
nt
NA
Not
app
licab
le.
—N
o da
ta.
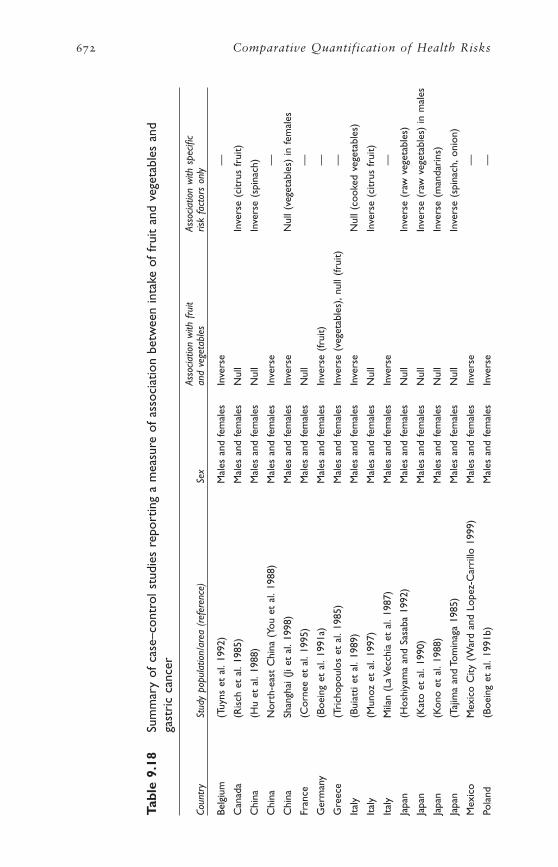
672 Comparative Quantification of Health Risks
Tabl
e 9.
18Su
mm
ary
of c
ase–
cont
rol s
tudi
es r
epor
ting
a m
easu
re o
f as
soci
atio
n be
twee
n in
take
of
frui
t an
d ve
geta
bles
and
gast
ric
canc
er
Asso
ciatio
n w
ith f
ruit
Asso
ciatio
n w
ith s
pecifi
cCo
untr
ySt
udy
popu
latio
n/ar
ea (
refe
renc
e)Se
xan
d ve
geta
bles
risk
fact
ors
only
Belg
ium
(Tuy
ns e
t al
.199
2)M
ales
and
fem
ales
Inve
rse
—
Can
ada
(Ris
ch e
t al
.198
5)M
ales
and
fem
ales
Nul
lIn
vers
e (c
itrus
fru
it)
Chi
na(H
u et
al.
1988
)M
ales
and
fem
ales
Nul
lIn
vers
e (s
pina
ch)
Chi
naN
orth
-eas
t C
hina
(Yo
u et
al.
1988
)M
ales
and
fem
ales
Inve
rse
—
Chi
naSh
angh
ai (
Ji et
al.
1998
)M
ales
and
fem
ales
Inve
rse
Nul
l (ve
geta
bles
) in
fem
ales
Fran
ce(C
orne
e et
al.
1995
)M
ales
and
fem
ales
Nul
l—
Ger
man
y(B
oein
g et
al.
1991
a)M
ales
and
fem
ales
Inve
rse
(frui
t)—
Gre
ece
(Tri
chop
oulo
s et
al.
1985
)M
ales
and
fem
ales
Inve
rse
(veg
etab
les)
,nul
l (fr
uit)
—
Ital
y(B
uiat
ti et
al.
1989
)M
ales
and
fem
ales
Inve
rse
Nul
l (co
oked
veg
etab
les)
Ital
y(M
unoz
et
al.1
997)
Mal
es a
nd fe
mal
esN
ull
Inve
rse
(citr
us f
ruit)
Ital
yM
ilan
(La
Vecc
hia
et a
l.19
87)
Mal
es a
nd fe
mal
esIn
vers
e—
Japa
n(H
oshi
yam
a an
d Sa
saba
199
2)M
ales
and
fem
ales
Nul
lIn
vers
e (r
aw v
eget
able
s)
Japa
n(K
ato
et a
l.19
90)
Mal
es a
nd fe
mal
esN
ull
Inve
rse
(raw
veg
etab
les)
in m
ales
Japa
n(K
ono
et a
l.19
88)
Mal
es a
nd fe
mal
esN
ull
Inve
rse
(man
dari
ns)
Japa
n(T
ajim
a an
d To
min
aga
1985
)M
ales
and
fem
ales
Nul
lIn
vers
e (s
pina
ch,o
nion
)
Mex
ico
Mex
ico
City
(W
ard
and
Lope
z-C
arri
llo 1
999)
Mal
es a
nd fe
mal
esIn
vers
e—
Pola
nd(B
oein
g et
al.
1991
b)M
ales
and
fem
ales
Inve
rse
—
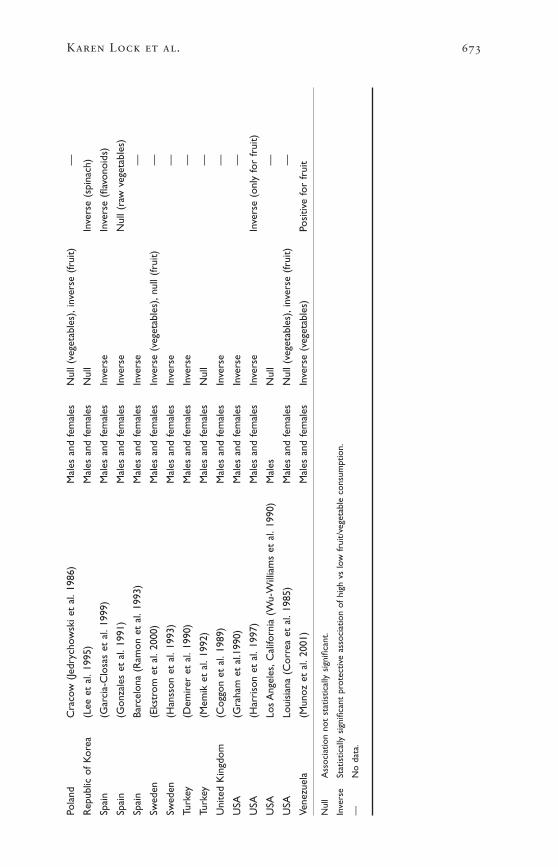
Karen Lock et al. 673
Pola
ndC
raco
w (
Jedr
ycho
wsk
i et
al.1
986)
Mal
es a
nd fe
mal
esN
ull (
vege
tabl
es),
inve
rse
(frui
t)—
Rep
ublic
of
Kor
ea(L
ee e
t al
.199
5)M
ales
and
fem
ales
Nul
lIn
vers
e (s
pina
ch)
Spai
n(G
arci
a-C
losa
s et
al.
1999
)M
ales
and
fem
ales
Inve
rse
Inve
rse
(flav
onoi
ds)
Spai
n(G
onza
les
et a
l.19
91)
Mal
es a
nd fe
mal
esIn
vers
eN
ull (
raw
veg
etab
les)
Spai
nBa
rcel
ona
(Ram
on e
t al
.199
3)M
ales
and
fem
ales
Inve
rse
—
Swed
en(E
kstr
om e
t al
.200
0)M
ales
and
fem
ales
Inve
rse
(veg
etab
les)
,nul
l (fr
uit)
—
Swed
en(H
anss
on e
t al
.199
3)M
ales
and
fem
ales
Inve
rse
—
Turk
ey(D
emir
er e
t al
.199
0)M
ales
and
fem
ales
Inve
rse
—
Turk
ey(M
emik
et
al.1
992)
Mal
es a
nd fe
mal
esN
ull
—
Uni
ted
Kin
gdom
(Cog
gon
et a
l.19
89)
Mal
es a
nd fe
mal
esIn
vers
e—
USA
(Gra
ham
et
al.1
990)
Mal
es a
nd fe
mal
esIn
vers
e—
USA
(Har
riso
n et
al.
1997
)M
ales
and
fem
ales
Inve
rse
Inve
rse
(onl
y fo
r fr
uit)
USA
Los
Ang
eles
,Cal
iforn
ia (
Wu-
Will
iam
s et
al.
1990
)M
ales
Nul
l—
USA
Loui
sian
a (C
orre
a et
al.
1985
)M
ales
and
fem
ales
Nul
l (ve
geta
bles
),in
vers
e (fr
uit)
—
Vene
zuel
a(M
unoz
et
al.2
001)
Mal
es a
nd fe
mal
esIn
vers
e (v
eget
able
s)Po
sitiv
e fo
r fr
uit
Nul
lA
ssoc
iatio
n no
t st
atis
tical
ly s
igni
fican
t.
Inve
rse
Stat
istic
ally
sig
nific
ant
prot
ectiv
e as
soci
atio
n of
hig
h vs
low
fru
it/ve
geta
ble
cons
umpt
ion.
—N
o da
ta.

Turkey (2), Venezuela (1) and northern and southern Europe (14). Allbut two of these studies were carried out on both men and women. Notall the populations were at high risk of stomach cancer.
Of the 32 studies, 20 reported a significant inverse associationbetween total fruit or vegetable consumption and gastric cancer risk. Afurther nine studies found an inverse association only with specific foodtypes or within a subcohort. Particular attention was placed on the con-sumption of allium vegetables (onion, leek, garlic and chives). One study(from Venezuela) found that the risk of gastric cancer incidence wasinversely related (protective effect) with vegetable intake but directlyrelated (harmful effect) with fruit intake. This is the only study report-ing a significant positive (harmful) relationship (Munoz et al. 2001).Despite the inherent limitations of information bias in case–controlstudies, the evidence is strong and consistent for a protective effect froma diet high in fruit and vegetables, and supports the findings of the cohortstudies.
Confounding
Most studies appear to have adjusted adequately for potential con-founding factors. All adjusted for age and sex, and most studies adjustedfor smoking and alcohol consumption. Other factors, considered partic-ularly in prospective studies, were previous history of stomach illness,family history of stomach cancer, other dietary components and socio-economic status. Protective associations remained even after adjustmentfor other dietary factors such as salty foods or starchy foods in somestudies (Coggon et al. 1989; Hansson et al. 1993; La Vecchia et al. 1987;Lee et al. 1995; Ramon et al. 1993; Risch et al. 1985).
H. pylori infection is a major risk factor for gastric cancer, yet few studies were able to collect this information given the retrospectivenature of many studies and the recent ability of testing to confirm infection.
Summary
There is an inverse relationship between fruit and vegetable intake andgastric cancer risk in both cohort and case–control studies in differentpopulations worldwide. The relationship remains after adjustment forconfounding. Some of the variations in the findings from separate studiescould be due to the between-country differences in the varieties of fruitand vegetables consumed, the methods of consumption (raw or cooked),the number of specific fruit or vegetable items included in the question-naires used or the validity of the dietary assessment methods.
Although H. pylori infection is an established risk factor, its relation-ship with fruit and vegetable consumption remains inadequately under-stood. A multistage model of gastric carcinogenesis is now accepted,according to which different dietary and non-dietary factors, involvinggenetic susceptibility, are involved at different stages in the cancer
674 Comparative Quantification of Health Risks
process. A protective effect of supplementation of vitamin C and beta-carotene in the progression of pre-malignant gastric lesions was foundin Latin America (Correa et al. 2000), but alpha-tocopherol and beta-carotene supplement trials in Finland showed no effect. In spite of this,results from the observational studies suggest a protective effect of dietsrich in fruit and vegetables.
COLORECTAL CANCER
A detailed description of the studies included in the review of the liter-ature follows.
Previous reviews of the literature
Four recent comprehensive reviews of the literature investigating fruit and vegetable consumption and risk of colorectal cancer werefound. They all concluded that the evidence is consistent in supportinga decreased risk of colorectal cancer with higher consumption of veg-etables, and that data for an association with fruit consumption areinconsistent (Klerk et al. 1998; Norat et al. 2001; Potter 1996; WorldCancer Research Fund and American Institute for Cancer Research1997).
The review by Klerk et al. (1998) estimated that high vs low con-sumption of fruit and vegetables (an average difference of 150g/day) islikely to reduce the risk of colorectal cancer by 20–45% in men andwomen.
The meta-analysis by Norat et al. (2001) (see description above in thesection on gastric cancer) included 13 studies assessing the effect of totalfruit intake and 28 studies assessing the effect of total vegetable intake.The pooled relative risks associated with an increased intake of 100g/daywere 0.94 (95% CI 0.90–0.98) for fruit and 0.90 (95% CI 0.84–0.96)for vegetables (subanalyses found similar relative risks for men andwomen, and for European and USA populations).
Current review of the literature
The systematic review identified 15 cohort studies and 34 case–controlstudies that examined the association between colorectal cancer risk(both incidence and mortality) and the consumption of fruit and veg-etables. Details of these studies are given in Tables 9.19 and 9.20.Overall, the evidence supports an inverse relationship between fruit andvegetable intake and colorectal cancer risk (incidence and mortality),although it is not as strong as that for gastric cancer.
The studies investigating colorectal cancer also included a number of studies that looked separately at colon and rectal cancers. For the purposes of this review, we have combined the results of all these outcomes.
The cohort studies were conducted on a limited range of populationswith most studies being from the United States (10), the others being
Karen Lock et al. 675

676 Comparative Quantification of Health Risks
Tabl
e 9.
19Su
mm
ary
of c
ohor
t st
udie
s re
port
ing
a m
easu
re o
f as
soci
atio
n be
twee
n in
take
of
frui
t an
d ve
geta
bles
and
col
orec
tal
canc
er
Age
Asso
ciatio
n w
ithSt
udy
popu
latio
nra
nge
Stud
yFo
llow
-up
Expo
sure
Asso
ciatio
n w
ithdi
et p
roxy
Coun
try
(ref
eren
ce)
Sex
(yea
rs)
size
No.
of c
ases
(yea
rs)
mea
sure
frui
t or
veg
etab
lein
take
Finl
and
Mal
e sm
oker
s in
AT
BCM
ales
50–6
927
111
Inci
denc
e (1
85)
8Fo
od f
requ
ency
Posi
tive,
not
...
stud
y (P
ietin
en e
t al
.qu
estio
nnai
rest
atis
tical
ly s
igni
fican
t19
99)
Japa
nJa
pane
se g
ener
alM
ales
and
≥40
265
118
Mor
talit
y:co
lon
17C
rude
—no
t cl
ear
Inve
rse
(col
on),
...
popu
latio
n su
rvey
(19
65fe
mal
es(5
52),
rect
um (
563)
posi
tive
(rec
tum
),ce
nsus
coh
ort)
not
stat
istic
ally
(Hir
ayam
a 19
86,1
990)
sign
ifica
nt
Net
herl
ands
The
Net
herl
ands
Coh
ort
Mal
es a
nd55
–69
120
852
Inci
denc
e (9
10)
6.3
150-
item
food
Inve
rse,
not
Non
-sig
nific
ant
stud
y (V
oorr
ips
et a
l.fe
mal
esfr
eque
ncy
stat
istic
ally
sig
nific
ant
tren
ds:i
nver
se20
00a)
ques
tionn
aire
(vita
min
C),
posi
tive
(bet
a-ca
rote
ne,
retin
ol)
Swed
enSw
edis
h M
amm
ogra
phy
Fem
ales
NA
6146
3In
cide
nce
(460
)9.
6Fo
od f
requ
ency
Inve
rse,
stat
istic
ally
...
stud
y (T
erry
et
al.2
001)
ques
tionn
aire
sign
ifica
nt
USA
NH
S (F
uchs
et
al.1
999)
Fem
ales
34–5
988
757
Inci
denc
e (7
87)
16R
epea
ted
food
Inve
rse,
not
freq
uenc
yst
atis
tical
lyqu
estio
nnai
resi
gnifi
cant
(fib
re)
USA
HPF
S (G
iova
nnuc
ci e
t al
.M
ales
40–7
547
949
Inci
denc
e (2
05)
6R
epea
ted
food
Inve
rse
(frui
t),
...
1994
)fr
eque
ncy
posi
tive
(veg
etab
les)
,qu
estio
nnai
reno
t st
atis
tical
lysi
gnifi
cant

Karen Lock et al. 677
USA
NH
S/H
PFS
(Mic
hels
et
al.
Mal
es40
–75
8876
4In
cide
nce:
colo
n10
–16
Rep
eate
d fo
odPo
sitiv
e,no
t..
.20
00,2
002)
Fem
ales
30–5
547
325
(937
),re
ctum
(24
4)fr
eque
ncy
stat
istic
ally
sig
nific
ant
ques
tionn
aire
USA
The
Adv
entis
t H
ealth
Mal
es a
nd≥1
625
493
Mor
talit
y (1
82)
21Fo
od f
requ
ency
Inve
rse
(rec
tum
),..
.st
udy
(Phi
llips
and
fem
ales
ques
tionn
aire
posi
tive
(col
on),
not
Snow
don
1985
)st
atis
tical
ly s
igni
fican
t
USA
Leis
ure
Wor
ld c
ohor
t,M
ales
and
Elde
rly
1047
3In
cide
nce
(110
)6
Food
fre
quen
cyN
o as
soci
atio
nC
alifo
rnia
(Pa
gani
ni-H
illfe
mal
esqu
estio
nnai
re(b
eta-
caro
tene
)et
al.
1987
)
USA
Leis
ure
Wor
ld c
ohor
t,M
ales
and
Elde
rly
1158
0In
cide
nce
(202
)9
Food
fre
quen
cyIn
vers
e,no
t..
.C
alifo
rnia
(Sh
ibat
a et
al.
fem
ales
ques
tionn
aire
stat
istic
ally
sig
nific
ant
1992
)(fe
mal
es)
USA
Coh
ort
of H
awai
ian
men
Mal
es49
–68
800
6In
cide
nce:
colo
n18
Food
fre
quen
cyIn
vers
e,of
Jap
anes
e an
cest
ry,
(102
),re
ctum
(60
)qu
estio
nnai
rest
atis
tical
lyH
onol
ulu
Hea
rt P
rogr
amsi
gnifi
cant
(Hei
lbru
n et
al.
1989
)(v
itam
in C
)
USA
Iow
a W
omen
’s H
ealth
Fem
ales
55–6
934
691
Inci
denc
e (2
12)
512
7-ite
m fo
odIn
vers
e,no
t..
.st
udy
(Ste
inm
etz
et a
l.fr
eque
ncy
stat
istic
ally
sig
nific
ant
1994
)qu
estio
nnai
re
USA
New
Yor
k U
nive
rsity
Fem
ales
34–6
514
727
Inci
denc
e (1
00)
7.1
Food
fre
quen
cyPo
sitiv
e,no
t..
.w
omen
’s he
alth
stu
dyqu
estio
nnai
rest
atis
tical
ly s
igni
fican
t(K
ato
et a
l.19
97)
USA
Am
eric
an C
ance
r So
ciet
yM
ales
and
≥30
764
343
Mor
talit
y—co
lon
632
-item
food
Inve
rse,
stat
istic
ally
...
Prev
entio
n st
udy,
USA
fem
ales
(115
0)fr
eque
ncy
sign
ifica
ntan
d Pu
erto
Ric
o (T
hun
ques
tionn
aire
et a
l.19
92)
NA
Not
app
licab
le.

678 Comparative Quantification of Health Risks
Tabl
e 9.
20Su
mm
ary
of c
ase–
cont
rol s
tudi
es r
epor
ting
a m
easu
re o
f as
soci
atio
n be
twee
n in
take
of
frui
t an
d ve
geta
bles
and
colo
rect
al c
ance
r
Asso
ciatio
n w
ith f
ruit
orAs
socia
tion
with
spe
cific
risk
fact
ors
Coun
try
Stud
y po
pula
tion
(ref
eren
ce)
Sex
vege
tabl
es
Arg
entin
a(Is
covi
ch e
t al
.199
2)M
ales
and
fem
ales
Inve
rse
(veg
etab
les)
...
Aus
tral
ia(K
une
et a
l.19
87,1
992)
Mal
es a
nd fe
mal
esIn
vers
e (v
eget
able
s)..
.
Aus
tral
ia(S
tein
met
z an
d Po
tter
199
3)M
ales
and
fem
ales
Nul
l..
.
Belg
ium
(Tuy
ns e
t al
.198
8)M
ales
and
fem
ales
Inve
rse
(frui
t)..
.
Can
ada
Fren
ch C
anad
ians
(G
hadi
rian
et
al.1
997)
Mal
es a
nd fe
mal
esIn
vers
e (v
eget
able
s)..
.
Chi
na(H
u et
al.
1991
)M
ales
and
fem
ales
Inve
rse
(veg
etab
les)
...
Fran
ce(F
aivr
e et
al.
1997
)M
ales
and
fem
ales
Nul
l..
.
Fran
ce(M
acqu
art-
Mou
lin e
t al
.198
6)M
ales
and
fem
ales
Inve
rse
...
Ital
y(B
idol
i et
al.1
992)
Mal
es a
nd fe
mal
esN
ull
Inve
rse
(spi
nach
)
Ital
y(F
ranc
esch
i et
al.1
994)
Mal
es a
nd fe
mal
esIn
vers
eTo
mat
o
Ital
y(F
ranc
ecsh
i et
al.1
997)
Mal
es a
nd fe
mal
esIn
vers
e..
.
Ital
y(F
ranc
esch
i et
al.1
998)
Mal
es a
nd fe
mal
esIn
vers
e..
.
Ital
y(L
a Ve
cchi
a et
al.
1987
)M
ales
and
fem
ales
Inve
rse
(veg
etab
les)
...
Ital
y(N
egri
et
al.1
998)
Mal
es a
nd fe
mal
esIn
vers
e..
.
Japa
n(K
otak
e et
al.
1995
)M
ales
and
fem
ales
Nul
l..
.
Japa
n(T
ajim
a an
d To
min
aga
1985
)M
ales
and
fem
ales
Nul
lIn
vers
e (s
pina
ch,o
nion
,pum
pkin
)
Net
herl
ands
(Kam
pman
et
al.1
995)
Mal
es a
nd fe
mal
esIn
vers
e (v
eget
able
s)..
.
Rus
sian
Fed
erat
ion
(Zar
idze
et
al.1
993)
Mal
es a
nd fe
mal
esN
ull
Posi
tive
(dri
ed f
ruit)

Karen Lock et al. 679
Sing
apor
e(L
ee e
t al
.198
9)M
ales
and
fem
ales
Nul
l..
.
Spai
n(B
enito
et
al.1
990)
Mal
es a
nd fe
mal
esN
ull
...
Switz
erla
nd(L
evi e
t al
.199
9)M
ales
and
fem
ales
Inve
rse
...
Uru
guay
(Den
eo-P
elle
grin
i et
al.1
996)
Mal
es a
nd fe
mal
esIn
vers
e (fr
uit
and
vege
tabl
es)
...
USA
(Sha
nnon
et
al.1
996)
Mal
esN
ull
...
Fem
ales
Inve
rse
...
USA
(Sla
tter
y et
al.
1997
)M
ales
Inve
rse
(veg
etab
les)
...
Fem
ales
Nul
l..
.
USA
Cal
iforn
ia (
Pete
rs e
t al
.199
2)M
ales
and
fem
ales
Nul
l..
.
USA
Haw
aii (
Le M
arch
and
et a
l.19
97)
Mal
es a
nd fe
mal
esIn
vers
e..
.
USA
New
Yor
k U
nive
rsity
,NY
(K
ato
et a
l.19
99)
Mal
es..
.In
vers
e (fo
late
)
USA
New
Yor
k (w
este
rn)
(Fre
uden
heim
et
al.1
990;
Mal
es a
nd fe
mal
esN
ull
Inve
rse
(tom
ato,
pepp
er,c
eler
y)G
raha
m e
t al
.198
8)
USA
Uta
h (S
latt
ery
et a
l.19
88)
Mal
es a
nd fe
mal
esIn
vers
e (fr
uit)
Inve
rse
(cru
cife
rous
veg
etab
les)
USA
Uta
h (W
est
et a
l.19
89)
Mal
esIn
vers
e..
.
Fem
ales
Nul
l..
.
USA
Was
hing
ton
(Mey
er a
nd W
hite
199
3)M
ales
Nul
l..
.
Fem
ales
Inve
rse
...
USA
Wis
cons
in (
Youn
g an
d W
olf
1988
)M
ales
and
fem
ales
…In
vers
e (c
ruci
fero
us v
eget
able
s)
NA
Not
app
licab
le.
Nul
lA
ssoc
iatio
n no
t st
atis
tical
ly s
igni
fican
t.
Inve
rse
Stat
istic
ally
sig
nific
ant
prot
ectiv
e as
soci
atio
n of
hig
h vs
low
fru
it/ve
geta
ble
cons
umpt
ion.
from Europe (3) and Japan (1). It should be noted that three of the studycohorts were common to more than one study.
The majority of studies measured cancer incidence as the outcome,with mortality being used as the study outcome in only four studies.Eight studies investigated both men and women, while three investigatedmen only and four looked at women only.
Although a number of the studies reported a protective effect of fruitand vegetable consumption on colorectal cancer risk, only three of the15 showed a statistically significant inverse trend. This is summarized inTable 9.19. A further eight studies did show some inverse associationbetween vegetable consumption and colorectal cancer risk for certainsubgroup analyses of fruit, vegetables or colon or rectal cancer sepa-rately; three studies showed a statistically insignificant positive associa-tion between fruit and vegetable intake and colorectal cancer.
The case–control study populations came from a wider range of countries than those of the cohort studies. They included studies fromArgentina, Australia, Belgium, Canada, China, France, Italy, Japan, theRussian Federation, Singapore, Spain, Switzerland, the United States andUruguay. All studies collected data on both men and women. It shouldbe noted that two of the population cohorts (Australia and New York)were each common to two studies.
Results from 21 out of the 33 populations showed an inverse associ-ation with fruit or vegetables, while three found an inverse associationonly with specific food types (tomato; or spinach, onion and pumpkin;or tomato, pepper and celery). This is summarized in Table 9.20.
It should be noted that although the majority of colorectal cancers areadenocarcinomas, some studies found differences depending on tumourlocation (proximal vs distal, colon vs rectum). This suggests that poolingof results from different anatomical sites and cell types in many of thecohort and case–control studies may have obscured a true relationshipfor subgroups.
Confounding and interaction
All studies adjusted for the effect of sex and age. Other confounderstaken into account in the statistical analyses included total energy, meat,fat and protein intakes, BMI, smoking, alcohol consumption, physicalactivity, family history, dietary supplements, education and area of resi-dence. By analogy with the evidence of lung and stomach cancer, it isconceivable that an effect might only be anticipated in those with par-ticular genetic states (e.g. fast acetylators) that also consume significantquantities of meat. Many studies have excluded cases with strong familyhistory of colorectal cancer or with conditions such as familial polypo-sis coli, and inflammatory bowel diseases such as ulcerative colitis orCrohn disease from the final analyses.
680 Comparative Quantification of Health Risks
Summary
On their own, the prospective epidemiological studies have yet toproduce conclusive evidence to support an association of colorectalcancer with fruit and vegetable intake. However, the hypothesis is stillworthy of further consideration, as there appears to be an inverse rela-tionship in many cohort studies and in two thirds of the case–controlstudies in a wide range of different populations. The relationshipsremained after adjustment for confounding.
The uncertainty in the studies of colorectal cancer is relatively unsur-prising in view of the complex biological mechanisms involved in its etiology. The incidence can be expected to reflect a complex combina-tion of genetic factors (including factors that affect the colonic mucosaand those that determine whether certain toxins are excreted in bile orurine), diet (both carcinogenic and protective factors) and hormonalstatus.
OESOPHAGEAL CANCER
A detailed description of the studies included in the review of the liter-ature follows.
Previous reviews of the literature
Three recent reviews of the literature (Cheng and Day 1996; Klerk et al.1998; World Cancer Research Fund and American Institute for CancerResearch 1997) concluded that there is convincing evidence that dietshigh in fruit and vegetables decrease the risk of oesophageal cancer.
WCRF/AICR reviewed 22 case–control studies (1997). Of these, 18showed a statistically significant protective association with at least onecategory of fruit or vegetables. The protective association in the studiesremained after controlling for smoking and alcohol consumption. TheDutch review (Klerk et al. 1998) concluded that high vs low consump-tion of fruit and vegetables (an average difference of 150g/day) is likelyto reduce the risk of oesophageal cancer by 40–55% in men and women.
Finally, the meta-analysis by Norat et al. (2001) pooled the results of 10 studies assessing the effect of fruit intake and 11 studies assessingthe effect of vegetable intake on oesophageal cancer (see more details ofmethods described in the section on stomach cancer). This estimated thatan increase in food intake of 100g/day is associated with a relative riskfor oesophageal cancer of 0.79 (95% CI 0.65–0.95) for fruit; and 0.92(95% CI 0.85–1.01) for vegetables.
Current review of the literature
This systematic review identified four cohort and 28 case–control studies investigating the association of fruit and vegetable intake withoesophageal cancer risk (incidence and mortality). Most studies looked
Karen Lock et al. 681
at oesophageal cancer mortality or at the effect of fruit and vegetableconsumption on incidence and mortality considered jointly. In thisreview, we have also considered these outcomes together, assuming that,since oesophageal cancer survival rates are very poor, incidence is closelycorrelated with mortality.
The four cohort studies considered are from China (2), Japan andNorway. Details of the studies are given in Table 9.21. Both Chinesestudies were based on the same population in the Linxian province,which has one of the highest incidence rates of oesophageal cancer inthe world. The study population is part of a Nutrition Intervention Trial.
Three of the studies showed a statistically non-significant inverse trendwith fruit and vegetable intake. One Chinese study found an inverse rela-tionship with fresh vegetable consumption (Yu et al. 1993), while theother found an inverse relationship between the intake of both fruit andvegetables and oesophageal cancer incidence (Guo et al. 1994). The mostrecent study of Norwegian men also found a non-significant inverse rela-tionship between fruit and vegetable intake and oesophageal cancer inci-dence, but this was based on only 22 cancer events.
Case–control studies provide the majority of evidence for the associ-ation of fruit and vegetable consumption and oesophageal cancer risk.The 28 case–control studies identified are summarized in Table 9.22.
The studies came from a wide range of populations worldwide includ-ing China (4), Hong Kong Special Administrative Region of China (HongKong SAR) (2), India (2), Japan (2) the United States (4), Europe (11)and South America (3). Most of these studies investigated populationsof men and women, but five investigated only men and two studied onlywomen. Not all of the study populations were from populations at ahigh risk of oesophageal cancer.
Of the 28 studies, 20 reported significant inverse associations betweenoesophageal cancer and fruit and/or vegetable consumption. Interest-ingly, more of these inverse associations were with fruit rather than vegetables.
Although many studies did not specifically look at the histological typeof oesophageal cancer, the majority of the results presented here are likelyto be limited to squamous cell cancer. There was one study, in womenfrom the United Kingdom (Cheng et al. 2000), which focused onoesophageal adenocarcinoma. This study found an inverse association ofcancer risk with a higher consumption of fruit but not vegetables.
Confounding
Most studies adjusted for age and sex. Other potential confounders con-sidered in several studies, included smoking, total energy intake, pickledvegetable intake, BMI, marital status, occupational status, educationalor socioeconomic status and ethnicity. Supplement intakes, such as vit-amins, and intake of hot teas, were also considered in a few studies.
682 Comparative Quantification of Health Risks
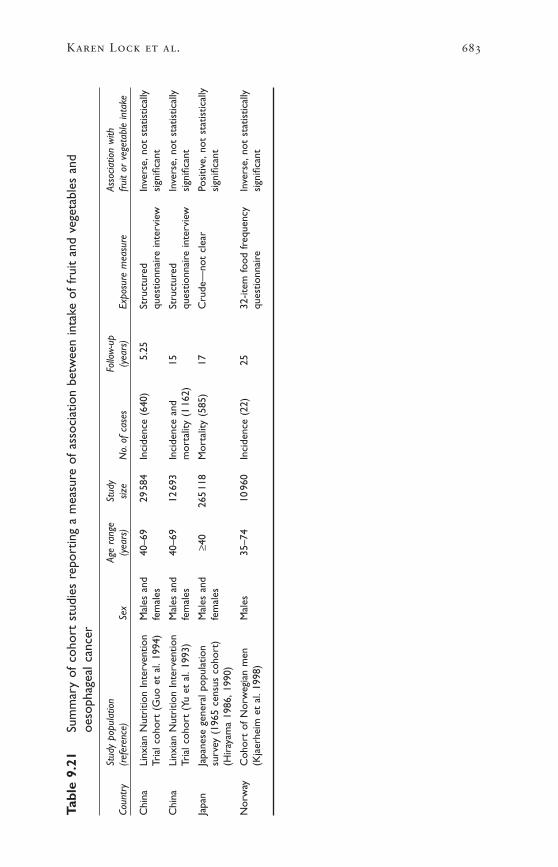
Karen Lock et al. 683
Tabl
e 9.
21Su
mm
ary
of c
ohor
t st
udie
s re
port
ing
a m
easu
re o
f as
soci
atio
n be
twee
n in
take
of
frui
t an
d ve
geta
bles
and
oeso
phag
eal c
ance
r
Stud
y po
pula
tion
Age
rang
eSt
udy
Follo
w-u
pAs
socia
tion
with
Coun
try
(ref
eren
ce)
Sex
(yea
rs)
size
No.
of c
ases
(yea
rs)
Expo
sure
mea
sure
frui
t or
veg
etab
le in
take
Chi
naLi
nxia
n N
utri
tion
Inte
rven
tion
Mal
es a
nd40
–69
2958
4In
cide
nce
(640
)5.
25St
ruct
ured
Inve
rse,
not
stat
istic
ally
Tria
l coh
ort
(Guo
et
al.1
994)
fem
ales
ques
tionn
aire
inte
rvie
wsi
gnifi
cant
Chi
naLi
nxia
n N
utri
tion
Inte
rven
tion
Mal
es a
nd40
–69
1269
3In
cide
nce
and
15St
ruct
ured
Inve
rse,
not
stat
istic
ally
Tria
l coh
ort
(Yu
et a
l.19
93)
fem
ales
mor
talit
y (1
162)
ques
tionn
aire
inte
rvie
wsi
gnifi
cant
Japa
nJa
pane
se g
ener
al p
opul
atio
nM
ales
and
≥40
265
118
Mor
talit
y (5
85)
17C
rude
—no
t cl
ear
Posi
tive,
not
stat
istic
ally
surv
ey (
1965
cen
sus
coho
rt)
fem
ales
sign
ifica
nt(H
iray
ama
1986
,199
0)
Nor
way
Coh
ort
of N
orw
egia
n m
enM
ales
35–7
410
960
Inci
denc
e (2
2)25
32-it
em fo
od f
requ
ency
Inve
rse,
not
stat
istic
ally
(Kja
erhe
im e
t al
.199
8)qu
estio
nnai
resi
gnifi
cant
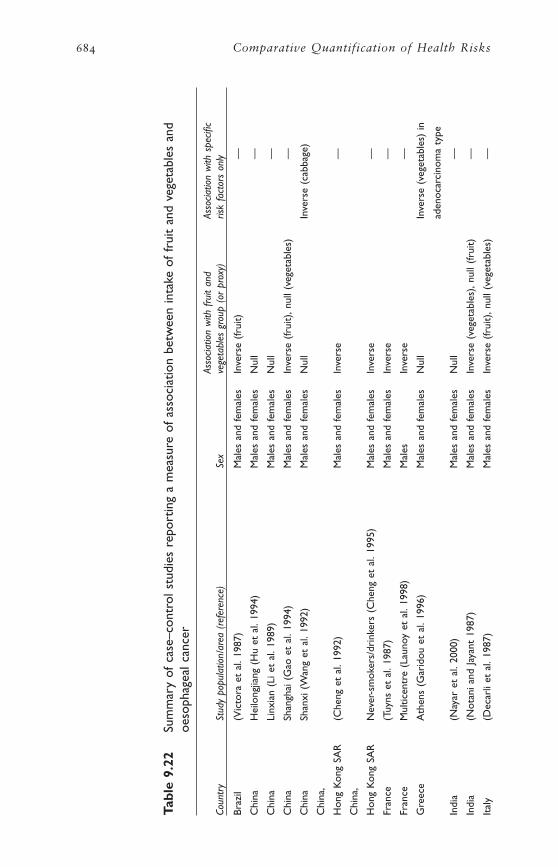
684 Comparative Quantification of Health Risks
Tabl
e 9.
22Su
mm
ary
of c
ase–
cont
rol s
tudi
es r
epor
ting
a m
easu
re o
f as
soci
atio
n be
twee
n in
take
of
frui
t an
d ve
geta
bles
and
oeso
phag
eal c
ance
r
Asso
ciatio
n w
ith f
ruit
and
Asso
ciatio
n w
ith s
pecifi
cCo
untr
ySt
udy
popu
latio
n/ar
ea (
refe
renc
e)Se
xve
geta
bles
gro
up (
or p
roxy
)ris
k fa
ctor
s on
ly
Braz
il(V
icto
ra e
t al
.198
7)M
ales
and
fem
ales
Inve
rse
(frui
t)—
Chi
naH
eilo
ngjia
ng (
Hu
et a
l.19
94)
Mal
es a
nd fe
mal
esN
ull
—
Chi
naLi
nxia
n (L
i et
al.1
989)
Mal
es a
nd fe
mal
esN
ull
—
Chi
naSh
angh
ai (
Gao
et
al.1
994)
Mal
es a
nd fe
mal
esIn
vers
e (fr
uit)
,nul
l (ve
geta
bles
)—
Chi
naSh
anxi
(W
ang
et a
l.19
92)
Mal
es a
nd fe
mal
esN
ull
Inve
rse
(cab
bage
)
Chi
na,
Hon
g K
ong
SAR
(Che
ng e
t al
.199
2)M
ales
and
fem
ales
Inve
rse
—
Chi
na,
Hon
g K
ong
SAR
Nev
er-s
mok
ers/
drin
kers
(C
heng
et
al.1
995)
Mal
es a
nd fe
mal
esIn
vers
e—
Fran
ce(T
uyns
et
al.1
987)
Mal
es a
nd fe
mal
esIn
vers
e—
Fran
ceM
ultic
entr
e (L
auno
y et
al.
1998
)M
ales
Inve
rse
—
Gre
ece
Ath
ens
(Gar
idou
et
al.1
996)
Mal
es a
nd fe
mal
esN
ull
Inve
rse
(veg
etab
les)
in
aden
ocar
cino
ma
type
Indi
a(N
ayar
et
al.2
000)
Mal
es a
nd fe
mal
esN
ull
—
Indi
a(N
otan
i and
Jay
ant
1987
)M
ales
and
fem
ales
Inve
rse
(veg
etab
les)
,nul
l (fr
uit)
—
Ital
y(D
ecar
li et
al.
1987
)M
ales
and
fem
ales
Inve
rse
(frui
t),n
ull (
vege
tabl
es)
—

Karen Lock et al. 685
Ital
y(T
avan
i et
al.1
996a
)M
ales
and
fem
ales
Nul
lIn
vers
e (fr
uit)
in s
mok
ers
Ital
yN
orth
ern
Ital
y (B
oset
ti et
al.
2000
)M
ales
and
fem
ales
Inve
rse
Nul
l (co
oked
veg
etab
les)
Ital
yM
ilan
(Neg
ri e
t al
.199
1)M
ales
and
fem
ales
Inve
rse
—
Ital
yM
ilan
(Tav
ani e
t al
.199
3)Fe
mal
esIn
vers
e (fr
esh
frui
t),n
ull (
gree
n—
vege
tabl
es)
Ital
yN
on-s
mok
ers
(Tav
ani e
t al
.199
4)M
ales
and
fem
ales
Inve
rse
—
Japa
n(H
anao
ka e
t al
.199
4)M
ales
Nul
l—
Japa
n(T
akez
aki e
t al
.200
0)M
ales
Inve
rse
—
Switz
erla
nd(L
evi e
t al
.200
0)M
ales
and
fem
ales
Inve
rse
—
Uni
ted
Kin
gdom
Engl
and;
Scot
land
(C
heng
et
al.2
000)
Fem
ales
Nul
l (ve
geta
bles
),in
vers
e (fr
uit)
Ade
noca
rcin
oma
only
Uru
guay
(DeS
tefa
ni e
t al
.199
0)M
ales
and
fem
ales
Nul
l—
USA
(Bro
wn
et a
l.19
95)
Mal
es a
nd fe
mal
esIn
vers
e—
USA
(Bro
wn
et a
l.19
98)
Mal
esIn
vers
eSq
uam
ous
cell
carc
inom
a on
ly
USA
Cal
iforn
ia (
Yu e
t al
.198
8)M
ales
and
fem
ales
Inve
rse
—
USA
Sout
h C
arol
ina
(Bro
wn
et a
l.19
88)
Mal
esIn
vers
e (fr
uit)
,nul
l (ve
geta
bles
)—
Mul
tiple
cou
ntri
esSo
uth
Am
eric
a (5
cou
ntri
es)
(Cas
tells
ague
et
al.2
000)
Mal
es a
nd fe
mal
esIn
vers
e—
Nul
lA
ssoc
iatio
n no
t st
atis
tical
ly s
igni
fican
t.
Inve
rse
Stat
istic
ally
sig
nific
ant
prot
ectiv
e as
soci
atio
n.
—N
o da
ta.
Summary
The epidemiology of oesophageal cancer shows wide geographical vari-ation in incidence and mortality rates. Striking differences have beenreported not only between regions of the world and countries, but alsowithin smaller geographical areas (Muir and McKinney 1992; Walker etal. 2002). Oesophageal cancer risk also varies with race, ethnicity andsex. Changes in incidence patterns observed in migrant studies appearto indicate that environmental factors, among which diet may be impor-tant, play an important role in the etiology of oesophageal cancer.
The main risk factors for oesophageal cancer in Europe were previouslythought to be tobacco smoking and alcohol consumption. However, timetrends of oesophageal mortality from 1950–1985 in 17 European coun-tries showed that oesophageal cancer had either decreased or increasedonly slightly (Cheng et al. 1992). This trend differed from that of lungcancer, cirrhosis and alcohol consumption, which had increased substan-tially during the same period. The results suggest that other population-wide changes in protective risk factors, such as improvements in diet afterWorld War II, had mitigated against the effect of tobacco and alcohol andresulted in a reduction of oesophageal cancer risk. In China, which has avery high incidence of oesophageal cancer, an ecological study of 65 coun-ties showed that oesophageal cancer mortality was significantly associ-ated with fruit consumption, but no correlation was observed withtobacco smoking or alcohol consumption (Guo et al. 1990). There isstrong evidence from ecological studies that dietary factors, especially fruitand vegetable consumption, may affect rates of oesophageal cancer.
This review of the literature showed that there are few prospectiveobservational studies of the effect of fruit and vegetable consumption onoesophageal cancer, and that most of these show non-significant inverseassociations. Evidence from supplement intervention trials is also incon-clusive. Two randomized supplement intervention trials in Linxian,China tested the effect of nutrient/vitamin supplementation in a popula-tion with very high rates of oesophageal cancer (Blot et al. 1995). Modestprotective effects were seen for mortality in the supplemented group inboth trials, but none of the results was statistically significant foroesophageal or gastric cancer. In spite of this, evidence from case–controlstudies appears to support an inverse relationship between fruit and veg-etable consumption and oesophageal cancer risk (incidence and mortal-ity), although this is not as strong as that for stomach cancer.
3.8 Estimates of risk factor–disease relationships bysubregion, sex and age
ESTIMATES OF RELATIVE RISKS
This section describes, for each selected outcome, the studies that werechosen based on the strict selection criteria for meta-analysis outlined insection 3.6, and the final estimates of relative risks derived for CRA.
686 Comparative Quantification of Health Risks
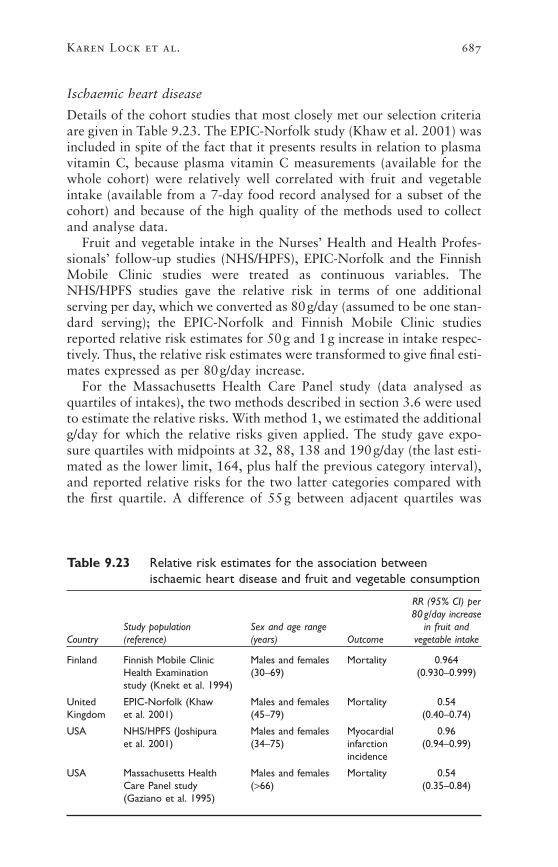
Ischaemic heart disease
Details of the cohort studies that most closely met our selection criteriaare given in Table 9.23. The EPIC-Norfolk study (Khaw et al. 2001) wasincluded in spite of the fact that it presents results in relation to plasmavitamin C, because plasma vitamin C measurements (available for thewhole cohort) were relatively well correlated with fruit and vegetableintake (available from a 7-day food record analysed for a subset of thecohort) and because of the high quality of the methods used to collectand analyse data.
Fruit and vegetable intake in the Nurses’ Health and Health Profes-sionals’ follow-up studies (NHS/HPFS), EPIC-Norfolk and the FinnishMobile Clinic studies were treated as continuous variables. TheNHS/HPFS studies gave the relative risk in terms of one additionalserving per day, which we converted as 80g/day (assumed to be one stan-dard serving); the EPIC-Norfolk and Finnish Mobile Clinic studiesreported relative risk estimates for 50g and 1g increase in intake respec-tively. Thus, the relative risk estimates were transformed to give final esti-mates expressed as per 80g/day increase.
For the Massachusetts Health Care Panel study (data analysed asquartiles of intakes), the two methods described in section 3.6 were usedto estimate the relative risks. With method 1, we estimated the additionalg/day for which the relative risks given applied. The study gave expo-sure quartiles with midpoints at 32, 88, 138 and 190g/day (the last esti-mated as the lower limit, 164, plus half the previous category interval),and reported relative risks for the two latter categories compared withthe first quartile. A difference of 55g between adjacent quartiles was
Karen Lock et al. 687
Table 9.23 Relative risk estimates for the association betweenischaemic heart disease and fruit and vegetable consumption
RR (95% CI) per80g/day increase
Study population Sex and age range in fruit andCountry (reference) (years) Outcome vegetable intake
Finland Finnish Mobile Clinic Males and females Mortality 0.964Health Examination (30–69) (0.930–0.999)study (Knekt et al. 1994)
United EPIC-Norfolk (Khaw Males and females Mortality 0.54Kingdom et al. 2001) (45–79) (0.40–0.74)
USA NHS/HPFS (Joshipura Males and females Myocardial 0.96et al. 2001) (34–75) infarction (0.94–0.99)
incidence
USA Massachusetts Health Males and females Mortality 0.54Care Panel study (>66) (0.35–0.84)(Gaziano et al. 1995)

assumed, which gives exposures of approximately 30, 85, 140 and195g/day. This approximation yielded comparable relative risks per 55gdifference whichever of the two reported relative risks was converted,and the relative risk reported for the 4th vs 1st quartile was used, whichwas expressed as a difference in exposure of 3¥55=165g/day. Themethod of Greenland and Longnecker (method 2) was then used to esti-mate the weighted regression slope over the published relative risks,allowing for correlations due to common reference category. Because ofits advantages, method 2 was chosen to obtain the final estimates forinclusion in the meta-analysis.
Meta-analysis was used to pool relative risk estimates using themethod described in section 3.6. The test of heterogeneity gave a chi-squared value of 19.044 (df=3; P<0.001). The resulting variationbetween studies suggests that it is inappropriate to pool estimates accord-ing to the fixed effects method. Using random effects meta-analysis, thepooled relative risk estimate was 0.903 (95% CI 0.824–0.989) for an80g/day increase in fruit and vegetable consumption. The random effectsresults are shown in Figure 9.2.
688 Comparative Quantification of Health Risks
Relative risk per 80 g intake.5 .6 .7 .8 .9 1
Combined
Stu
dy
4
3
2
1
Figure 9.2 Random effects meta-analysis of the association of fruit andvegetable intake with ischaemic heart disease
Key: 1, NHS/HPFS; 2, EPIC-Norfolk study; 3, Finnish Mobile Clinic Health Examination study;4, Massachusetts Health Care Panel study.

Karen Lock et al. 689
Table 9.24 Relative risk estimates for the association between strokeand fruit and vegetable consumption
RR (95% CI) perSex and 80g/day increase
Study population age range in fruit andCountry (reference) (years) Outcome vegetable intake
Netherlands Zutphen study (Keli Males Incidence 0.87et al. 1996) (50–69) cerebrovascular (0.49–1.53)
accident
USA NHS/HPFS (Joshipura Males and Incidence 0.96et al. 2001) females ischaemic (0.94–0.99)
(34–75) stroke
The figure shows that there is marked heterogeneity in the best avail-able evidence on the effects of fruit and vegetable consumption on therisk of IHD. The sources of this heterogeneity are currently not under-stood scientifically, and there is, therefore, no fully satisfactory meansfor arriving at a summary effect estimate. The random effects model usedhere provides a pragmatic interim solution to summarizing this evidence,pending better scientific understanding of the underlying relationships.The derived effect size seems plausible in the light of the consistency ofthe study findings set out in Table 9.13, but it remains subject to sub-stantial uncertainty—only some of that derives from the statistical uncer-tainty associated with the four studies included in Figure 9.2.
Ischaemic stroke
Only two cohort studies met the selection criteria for meta-analysis.These are summarized in Table 9.24.
The NHS/HPFS gave the relative risk in terms of one additionalserving per day, which we converted as 80g/day. As the Zutphen studydid not give a single estimate of linear (log) relative risk per consump-tion, the relative risk estimates were derived using the two methodsdescribed earlier for IHD. Since vegetable and fruit consumption wereseparately analysed, the relative risk for vegetable consumption wasused: it seems to us likely that vegetable and fruit consumption wouldconfound each other, so that what is reported as a purely “vegetable”effect includes the effect of fruit eaten by vegetable consumers. Since adiet of only fruit is rare, the vegetable effect reported was assumed to besimilar to that which would have been reported for a combined fruit andvegetable diet (although this may underestimate the effect). Method 2,of Greenland and Longnecker (1992), gave an almost identical estimateto Method 1, which used a consumption difference of the 4th vs 1st quar-tile (249.9 - 128.1 = 121g/day) for the 0.82 relative risk (vegetables) asthe basis for the estimate. Results based on method 2 are thereforereported here.

Relative risk estimates were combined using fixed-effect meta-analysis, as the random effects could not be estimated. The pooled rel-ative risk estimate was 0.939 (95% CI 0.892–0.989) for an 80g/dayincrease in fruit and vegetable consumption. The results are shown inFigure 9.3.
Lung cancer
Four studies met our selection criteria for meta-analysis. These are shownin Table 9.25.
Relative risks in the NHS/HPFS and the Finnish Mobile Clinic HealthExamination study were available with fruit and vegetable intake treatedas a continuous variable. The NHS/HPFS gave the relative risk in termsof one additional serving per day, which we converted as 80g/day. Theauthors of the Finnish Mobile Clinic study provided relative risks per1g/day which were transformed on a log scale to give estimates expressedas an 80g/day increase (as discussed earlier in this section).
For the Netherlands Cohort study and the National Health Interviewstudy, data had been analysed as quintiles and quartiles of intake respec-tively. The method of Greenland and Longnecker (1992) was used to
690 Comparative Quantification of Health Risks
.5 .6 .7 .8 .9 1
Combined
2
1
Relative risk per 80 g/day intake
Stu
dyFigure 9.3 Fixed effects meta-analysis of the association of fruit and
vegetable intake with ischaemic stroke
Key: 1, Zupthen study; 2, NHS/HPFS.
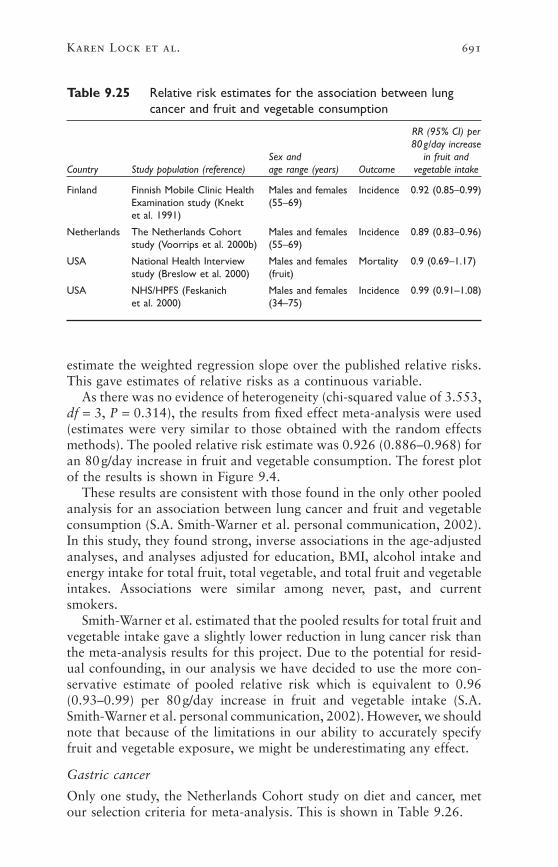
estimate the weighted regression slope over the published relative risks.This gave estimates of relative risks as a continuous variable.
As there was no evidence of heterogeneity (chi-squared value of 3.553,df = 3, P = 0.314), the results from fixed effect meta-analysis were used(estimates were very similar to those obtained with the random effectsmethods). The pooled relative risk estimate was 0.926 (0.886–0.968) foran 80g/day increase in fruit and vegetable consumption. The forest plotof the results is shown in Figure 9.4.
These results are consistent with those found in the only other pooledanalysis for an association between lung cancer and fruit and vegetableconsumption (S.A. Smith-Warner et al. personal communication, 2002).In this study, they found strong, inverse associations in the age-adjustedanalyses, and analyses adjusted for education, BMI, alcohol intake andenergy intake for total fruit, total vegetable, and total fruit and vegetableintakes. Associations were similar among never, past, and currentsmokers.
Smith-Warner et al. estimated that the pooled results for total fruit andvegetable intake gave a slightly lower reduction in lung cancer risk thanthe meta-analysis results for this project. Due to the potential for resid-ual confounding, in our analysis we have decided to use the more con-servative estimate of pooled relative risk which is equivalent to 0.96(0.93–0.99) per 80g/day increase in fruit and vegetable intake (S.A.Smith-Warner et al. personal communication, 2002). However, we shouldnote that because of the limitations in our ability to accurately specifyfruit and vegetable exposure, we might be underestimating any effect.
Gastric cancer
Only one study, the Netherlands Cohort study on diet and cancer, metour selection criteria for meta-analysis. This is shown in Table 9.26.
Karen Lock et al. 691
Table 9.25 Relative risk estimates for the association between lungcancer and fruit and vegetable consumption
RR (95% CI) per80g/day increase
Sex and in fruit andCountry Study population (reference) age range (years) Outcome vegetable intake
Finland Finnish Mobile Clinic Health Males and females Incidence 0.92 (0.85–0.99)Examination study (Knekt (55–69)et al. 1991)
Netherlands The Netherlands Cohort Males and females Incidence 0.89 (0.83–0.96)study (Voorrips et al. 2000b) (55–69)
USA National Health Interview Males and females Mortality 0.9 (0.69–1.17)study (Breslow et al. 2000) (fruit)
USA NHS/HPFS (Feskanich Males and females Incidence 0.99 (0.91–1.08)et al. 2000) (34–75)
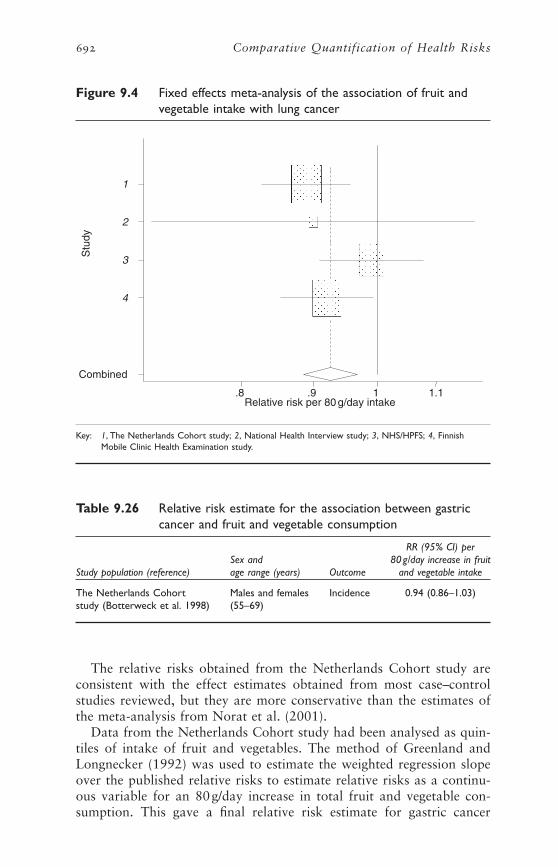
The relative risks obtained from the Netherlands Cohort study areconsistent with the effect estimates obtained from most case–controlstudies reviewed, but they are more conservative than the estimates ofthe meta-analysis from Norat et al. (2001).
Data from the Netherlands Cohort study had been analysed as quin-tiles of intake of fruit and vegetables. The method of Greenland andLongnecker (1992) was used to estimate the weighted regression slopeover the published relative risks to estimate relative risks as a continu-ous variable for an 80g/day increase in total fruit and vegetable con-sumption. This gave a final relative risk estimate for gastric cancer
692 Comparative Quantification of Health Risks
Table 9.26 Relative risk estimate for the association between gastriccancer and fruit and vegetable consumption
RR (95% CI) perSex and 80g/day increase in fruit
Study population (reference) age range (years) Outcome and vegetable intake
The Netherlands Cohort Males and females Incidence 0.94 (0.86–1.03)study (Botterweck et al. 1998) (55–69)
Stu
dy
Relative risk per 80 g/day intake.8 .9 1 1.1
Combined
4
3
2
1
Figure 9.4 Fixed effects meta-analysis of the association of fruit andvegetable intake with lung cancer
Key: 1, The Netherlands Cohort study; 2, National Health Interview study; 3, NHS/HPFS; 4, FinnishMobile Clinic Health Examination study.
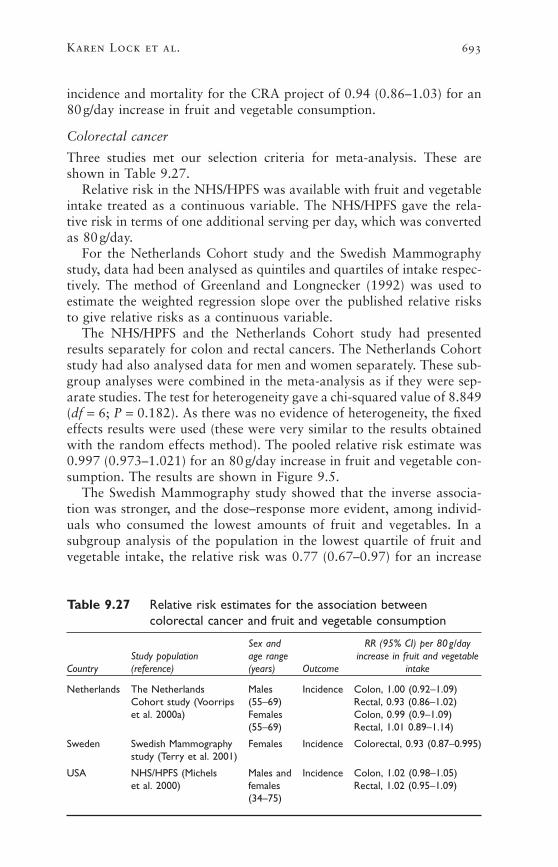
incidence and mortality for the CRA project of 0.94 (0.86–1.03) for an80g/day increase in fruit and vegetable consumption.
Colorectal cancer
Three studies met our selection criteria for meta-analysis. These areshown in Table 9.27.
Relative risk in the NHS/HPFS was available with fruit and vegetableintake treated as a continuous variable. The NHS/HPFS gave the rela-tive risk in terms of one additional serving per day, which was convertedas 80g/day.
For the Netherlands Cohort study and the Swedish Mammographystudy, data had been analysed as quintiles and quartiles of intake respec-tively. The method of Greenland and Longnecker (1992) was used toestimate the weighted regression slope over the published relative risksto give relative risks as a continuous variable.
The NHS/HPFS and the Netherlands Cohort study had presentedresults separately for colon and rectal cancers. The Netherlands Cohortstudy had also analysed data for men and women separately. These sub-group analyses were combined in the meta-analysis as if they were sep-arate studies. The test for heterogeneity gave a chi-squared value of 8.849(df = 6; P = 0.182). As there was no evidence of heterogeneity, the fixedeffects results were used (these were very similar to the results obtainedwith the random effects method). The pooled relative risk estimate was0.997 (0.973–1.021) for an 80g/day increase in fruit and vegetable con-sumption. The results are shown in Figure 9.5.
The Swedish Mammography study showed that the inverse associa-tion was stronger, and the dose–response more evident, among individ-uals who consumed the lowest amounts of fruit and vegetables. In asubgroup analysis of the population in the lowest quartile of fruit andvegetable intake, the relative risk was 0.77 (0.67–0.97) for an increase
Karen Lock et al. 693
Table 9.27 Relative risk estimates for the association betweencolorectal cancer and fruit and vegetable consumption
Sex and RR (95% CI) per 80g/dayStudy population age range increase in fruit and vegetable
Country (reference) (years) Outcome intake
Netherlands The Netherlands Males Incidence Colon, 1.00 (0.92–1.09)Cohort study (Voorrips (55–69) Rectal, 0.93 (0.86–1.02)et al. 2000a) Females Colon, 0.99 (0.9–1.09)
(55–69) Rectal, 1.01 0.89–1.14)
Sweden Swedish Mammography Females Incidence Colorectal, 0.93 (0.87–0.995)study (Terry et al. 2001)
USA NHS/HPFS (Michels Males and Incidence Colon, 1.02 (0.98–1.05)et al. 2000) females Rectal, 1.02 (0.95–1.09)
(34–75)
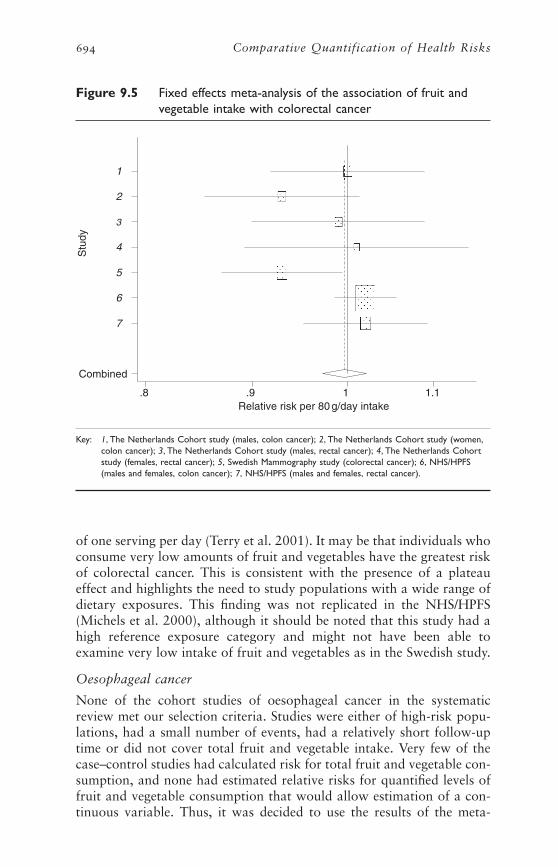
of one serving per day (Terry et al. 2001). It may be that individuals whoconsume very low amounts of fruit and vegetables have the greatest riskof colorectal cancer. This is consistent with the presence of a plateaueffect and highlights the need to study populations with a wide range ofdietary exposures. This finding was not replicated in the NHS/HPFS(Michels et al. 2000), although it should be noted that this study had ahigh reference exposure category and might not have been able toexamine very low intake of fruit and vegetables as in the Swedish study.
Oesophageal cancer
None of the cohort studies of oesophageal cancer in the systematicreview met our selection criteria. Studies were either of high-risk popu-lations, had a small number of events, had a relatively short follow-uptime or did not cover total fruit and vegetable intake. Very few of thecase–control studies had calculated risk for total fruit and vegetable con-sumption, and none had estimated relative risks for quantified levels offruit and vegetable consumption that would allow estimation of a con-tinuous variable. Thus, it was decided to use the results of the meta-
694 Comparative Quantification of Health Risks
Stu
dy
Relative risk per 80 g/day intake.8 .9 1 1.1
Combined
7
6
5
4
3
2
1
Figure 9.5 Fixed effects meta-analysis of the association of fruit andvegetable intake with colorectal cancer
Key: 1, The Netherlands Cohort study (males, colon cancer); 2, The Netherlands Cohort study (women,colon cancer); 3, The Netherlands Cohort study (males, rectal cancer); 4, The Netherlands Cohortstudy (females, rectal cancer); 5, Swedish Mammography study (colorectal cancer); 6, NHS/HPFS(males and females, colon cancer); 7, NHS/HPFS (males and females, rectal cancer).

analysis from Norat et al. (2001) to derive the final RR estimates. Thismeta-analysis calculated risk estimates for fruit and vegetables separatelyper 100g/day intake. The pooled relative risks associated with anincrease of consumption of 80g/day were calculated. These were 0.828(0.708–0.960) for fruit, and 0.935 (0.878–1.008) for vegetables. Theresults suggested risk reductions of between 17.2% and 6.5% per80g/day increase in fruit intake and vegetable intake, respectively. Forthis study, the most conservative relative risks were used, that is, thosefor vegetables only, 0.935 (95% CI 0.878–1.008).
Summary of the estimates of relative risks
The relative risk estimates and 95% confidence intervals are summarizedin Table 9.28. Estimates are expressed as the change in relative risk asso-ciated with an 80-g increase in daily fruit and vegetable intake.
As discussed earlier, the relative risks are applied to all subregions andto both men and women. Assuming age attenuation at the extremes ofage, these relative risks apply for individuals aged 15–69 years. For olderadults, the relative risks were reduced by a quarter for ages 70–79 years,and by half for the age group ≥80 years. A relative risk of 1 was appliedfor those aged <15 years.
ESTIMATES OF RISK REVERSIBILITY
There is very little published evidence of risk reversibility for an increasedfruit and vegetable intake, mainly due to the difficulty of conductingdietary intervention trials. Hence, the period of the latency betweenincreased fruit and vegetable intake and risk reduction are difficult topredict.
Cardiovascular diseases
There is some limited evidence from randomized-controlled trials, whichsuggests that the effect of fruit and vegetables is not immediate for IHD.As was described in section 3.1, the DART study and the Lyon DietHeart study examined the effect of dietary changes on the secondary pre-vention of myocardial infarction. The DART study showed no effect onmortality after two years, in the fat advice arm of the trial (advice toreduce fat intake and increase polyunsaturated to saturated fat ratio vsno advice) which was associated with an increased fruit and vegetableintake of about 50g/day. However, the Lyon Diet Heart study showedthat a Mediterranean-style diet had a marked protective effect on therate of recurrence of myocardial infarction after 27 months, with aneffect still maintained after four years of follow-up. The main disadvan-tage of these trials was that the interventions encompassed several dietarychanges. As a result, it is not possible to estimate the specific influenceof increasing fruit and vegetables intake.
Evidence for the specific benefits of an increase in fruit and vegetableintake on cardiovascular health comes from the IEIS and the DASH trial.
Karen Lock et al. 695
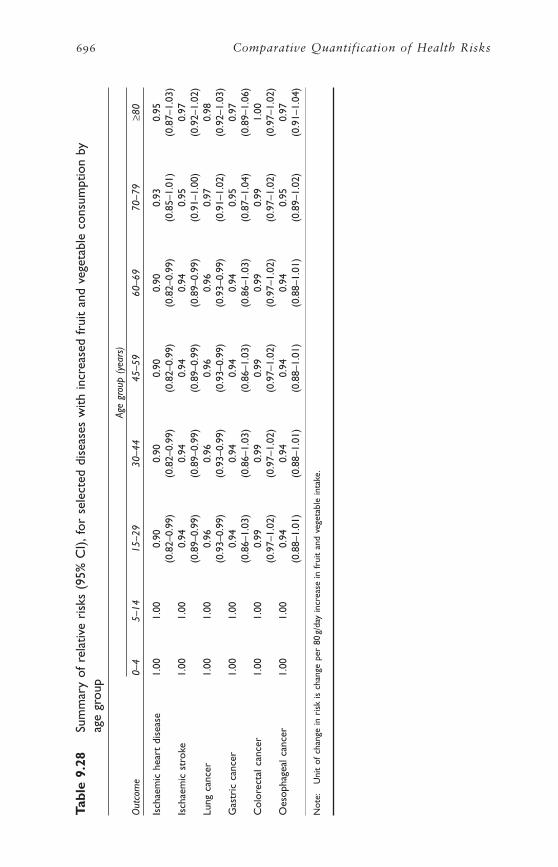
696 Comparative Quantification of Health Risks
Tabl
e 9.
28Su
mm
ary
of r
elat
ive
risk
s (9
5% C
I),fo
r se
lect
ed d
isea
ses
with
incr
ease
d fr
uit
and
vege
tabl
e co
nsum
ptio
n by
ag
e gr
oup
Age
grou
p (y
ears
)
Out
com
e0–
45–
1415
–29
30–4
445
–59
60–6
970
–79
≥80
Isch
aem
ic h
eart
dis
ease
1.00
1.00
0.90
0.90
0.90
0.90
0.93
0.95
(0.8
2–0.
99)
(0.8
2–0.
99)
(0.8
2–0.
99)
(0.8
2–0.
99)
(0.8
5–1.
01)
(0.8
7–1.
03)
Isch
aem
ic s
trok
e1.
001.
000.
940.
940.
940.
940.
950.
97(0
.89–
0.99
)(0
.89–
0.99
)(0
.89–
0.99
)(0
.89–
0.99
)(0
.91–
1.00
)(0
.92–
1.02
)Lu
ng c
ance
r1.
001.
000.
960.
960.
960.
960.
970.
98(0
.93–
0.99
)(0
.93–
0.99
)(0
.93–
0.99
)(0
.93–
0.99
)(0
.91–
1.02
)(0
.92–
1.03
)G
astr
ic c
ance
r1.
001.
000.
940.
940.
940.
940.
950.
97(0
.86–
1.03
)(0
.86–
1.03
)(0
.86–
1.03
)(0
.86–
1.03
)(0
.87–
1.04
)(0
.89–
1.06
)C
olor
ecta
l can
cer
1.00
1.00
0.99
0.99
0.99
0.99
0.99
1.00
(0.9
7–1.
02)
(0.9
7–1.
02)
(0.9
7–1.
02)
(0.9
7–1.
02)
(0.9
7–1.
02)
(0.9
7–1.
02)
Oes
opha
geal
can
cer
1.00
1.00
0.94
0.94
0.94
0.94
0.95
0.97
(0.8
8–1.
01)
(0.8
8–1.
01)
(0.8
8–1.
01)
(0.8
8–1.
01)
(0.8
9–1.
02)
(0.9
1–1.
04)
Not
e:U
nit
of c
hang
e in
ris
k is
cha
nge
per
80g/
day
incr
ease
in f
ruit
and
vege
tabl
e in
take
.

As was described in section 3.1, the IEIS showed that after only one year,cardiac events and mortality were reduced by 40% and 45%, respec-tively, in a group of men who had previously suffered an acute myocar-dial infarction and who followed a low-fat fruit and vegetable-rich dietcompared with men on a standard low-fat diet (Singh et al. 1993a). TheDASH trial showed that hypertensive individuals achieved a reductionin their blood pressure after eight weeks of dietary changes (Conlin etal. 2000; Obarzanek et al. 2001). Both a diet rich in fruit and vegeta-bles and a combination diet rich in fruit and vegetables and low in sat-urated fat, fat and cholesterol reduced systolic and diastolic bloodpressure. After eight weeks, 70% of the participants on a combinationdiet rich in fruit and vegetables and low in saturated fat, fat and cho-lesterol, had a normal blood pressure, with 45% of those on a diet richin fruit and vegetables, and 23% of those on a control diet. The truelong-term effect of such dietary changes needs to be assessed usingstudies of longer duration.
Further evidence for risk reversibility of cardiovascular disease comesfrom time series analyses in countries of central and eastern Europe. Onenatural experiment in terms of rapid dietary change occurred with thereunification of Germany in 1989. After reunification, fruit and vegetableavailability increased markedly, doubling between 1989 and 1992 (J.W.Powles, personal communication, 2001). But although the previousdecline in vascular disease mortality accelerated, the change of trend wasnot noticeably greater than that in Poland and the Czech and Slovakrepublics where the increase in fruit and vegetable consumption wasalmost certainly less marked. However, the results of an ecological studyperformed in Poland suggested that the observed increase in supply offresh fruit and vegetables and changes in the type of dietary fat between1986–1990 and 1994 may have had a short-term positive effect on mor-tality risk (Zatonski et al. 1998). This study investigated the reasons forthe decline in deaths attributed to IHD in Poland since 1991 after twodecades of rising rates. For most of the potentially explanatory variablesstudied (i.e. alcohol consumption, cigarette smoking, socioeconomicindices and medical services) there were no corresponding changes intrend. The authors concluded that dietary changes could provide the bestexplanation to the reduced IHD mortality rates, with an effect notice-able within four years. While these findings cannot be dismissed, due tothe limitations of ecological studies, these exploratory analyses wouldneed to be confirmed with stronger study designs.
Cancer
The evidence for cancer outcomes is more limited and comes from onemajor source. The NHS/HPFS studies have both collected dietary intakedata repeatedly during a long follow-up period. This enables the exam-ination of the temporal aspects of diet–cancer associations, although thishas not yet been published for all the cancer outcomes covered in this
Karen Lock et al. 697

report. For lung cancer risk, the findings support a relatively long latencyperiod for carotenoids (used as a proxy for fruit and vegetable intake),consistent with the known natural history of the disease, and suggestthat the critical period for exposure to carotenoids to maximize protec-tion may be between four to eight years before diagnosis (Michaud etal. 2000). This may explain why some observational studies and shortsupplement intervention trials may not have detected a significant association.
Proposed risk reversibility for the CRA project
Assuming that the future population intake of fruit and vegetables isincreased to the proposed counterfactual, we propose the following esti-mates of risk reduction:
• ten per cent reduction in relative risk in four years for IHD and stroke;and
• ten per cent reduction in relative risk in eight years for cancer outcomes.
Due to the current limitations of the evidence, it is assumed that riskreversibility following an increase in fruit and vegetable consumption isage independent and that it does not vary among subregions. As this maynot be the case, the estimates should be seen as first approximations. Dueto the high level of uncertainty, it is proposed that a ±10% range of erroris included in the calculations of avoidable burden for the CRA project.
3.9 Quantitative and qualitative sources of uncertainty inmeasuring the diet–disease relationship
There are several sources of uncertainty in risk assessment. Some of thesewill be described in this section with regard to the study of the rela-tionship between fruit and vegetable intake and health outcomes. It islikely that these underestimate the true level of uncertainty that affectedthe estimates presented in this report.
Little is known of the relative importance of early and late dietaryexposure of fruit and vegetables for the risk of the chronic diseases exam-ined in this report. Results from the Boyd Orr cohort suggest that fruitand vegetable intake in childhood could have a protective effect on therisk of cancer in adulthood (Maynard et al. 2003). However, we do notknow whether an increased intake of fruit and vegetables is more impor-tant in young or middle age for greatest risk reversibility. Hence, it is notpossible to comment on how the time trends of risk reversibility mayvary among age groups.
In this project, it was assumed that there was no difference in relativerisk across populations. However, it is not possible to verify whether thisassumption is true as the study populations covered by the literaturereview were from limited geographical areas and ethnic groups. The
698 Comparative Quantification of Health Risks
majority of cohort studies were from China, Japan, the United States andEurope, although there was at least one case–control study from the following countries: Australia, Brazil, China (Hong Kong SAR), India, Mexico, the Republic of Korea, Singapore, Turkey, Uruguay andVenezuela.
Relative risks in the developed world may not provide good estimatesof the effect in the less developed world. For example, the impact ofincreasing fruit and vegetable intake may be stronger in undernourished,micronutrient-poor (e.g. vitamin A deficiency) populations in developingcountries. However, this has to be considered in the wider context ofnutritional requirements (energy and protein may be more important forsurvival in some populations) and relative causes of deaths (non-communicable diseases may not be as important killers as in developedcountries).
One possibility refers to the ascertainment of exposure. There remainsconsiderable uncertainty as to which constituents, or combination ofconstituents, of fruit and vegetables would confer a protective effect.Several components have been suggested, but it is unlikely that any singlecompound will capture the benefits, which seem to arise from a varieddiet rich in fruit and vegetables. The sources of uncertainty described for exposure measurement in section 2.9 also need to be taken intoaccount here. Errors in measurement of dietary intake mean that thestrength of true associations, if they exist, is likely to be reduced. In addition, the definition of the exposure as “fruit and vegetables” intro-duces a substantial amount of non-specificity with the resultant poten-tial attenuation of underlying causal relations. That is, the currentlyunknown active constituents contained within the category “fruit andvegetables” are likely to have a varying quantitative relationship to the less specific category of fruit and vegetables. This is especially impor-tant across food cultures with substantial differences in the make-up offoods that constitute the fruit and vegetable group, but also applies even within cultures because of differences in food composition. At aminimum, this suggests that findings of protective associations betweenfruit and vegetable consumption and a specific disease within one foodculture may not generalize well to another culture where the fruit andvegetables in the diet are constituted by different foods—in which thecausally active constituents may be present to substantially differingamounts.
Another major source of uncertainty refers to the fact that con-founding is a real possibility in observational studies of the relationshipbetween fruit and vegetable intake and health outcomes. Although thestudies considered in this project have attempted to adjust for con-founding, measurement error in the assessment of potential confoundersand the possibility of residual confounding need to be considered.
Karen Lock et al. 699

4. Discussion of estimates of attributable burden
The results of the analysis showed that a lack of dietary fruit and veg-etables contributes an important share of the worldwide disease burden.It was estimated that increasing individual fruit and vegetable con-sumption up to the theoretical-minimum-risk distribution could reducethe worldwide burden of disease for IHD and ischaemic stroke by about31% (30% for men and 31% for women) and 19% (18% for men and19% for women), respectively. For cancers of the stomach and oesoph-agus, the potential reduction in disease attributable to an increase in fruitand vegetable intake was 19% and 20%, respectively. Attributable riskfractions were lower for lung and colorectal cancers (12% and 2%).
There were relatively few sex and age differences in the attributablefractions of disease attributable to low fruit and vegetable consumption,mainly because relative risk estimates were assumed to be constant in alladult men and women. However, larger variations were observed in theestimates of attributable DALYs due to low fruit and vegetable intake,as this is a function of both the attributable fractions and the amount ofburden of disease accounted for by each health outcome studied in thevarious age–sex groups, itself affected by other risk factors. The numberof DALYs was generally higher in men (except for stroke). As expectedfor chronic diseases, it tended to be lower in young adults.
There were some subregional variations in the attributable risk frac-tions and number of DALYs attributable to low fruit and vegetableintake. These tended to reflect differences in exposure levels and diseasepatterns among subregions.
The total worldwide mortality attributable to inadequate fruit andvegetable consumption was estimated to be 2.726 million deaths or26.662 million DALYs in 2000. These results need to be interpreted inthe light of the current limitations of the methods used, as describedearlier in the chapter (e.g. residual confounding, misclassification ofexposure). However, they highlight that increasing fruit and vegetableconsumption could play an important role in improving public healthworldwide.
5. Methods for projection of future exposure
An aggregate approach based on subregional trends in fruit and veg-etable availability was used to project future exposure levels. Themethods used are described below.
5.1 Trends in fruit and vegetable availability over time
The projection of future fruit and vegetable consumption for the years2000 to 2030 was based primarily on the observation of subregional
700 Comparative Quantification of Health Risks
trends in fruit and vegetable availability. The FAO food balance sheetdata (FAO 2001) show that there has been an overall worldwide increasein the availability of fruit and vegetables during the past decades.However, large variations exist, among subregions and countries, in theobserved trends and amounts available. These variations are describedbelow.
FAO food balance sheet statistics (1961–1999) for each country wereused to calculate three-year average subregional fruit and vegetable avail-ability. These calculations show that there has been a relatively steadyincreasing trend in availability in AMR-A, AMR-B, EMR-D, EUR-A,SEAR-B, SEAR-D and WPR-B between 1961 and 1999. In contrast,downward trends have been observed since the late 1970s or early 1980sin WPR-A and AFR-E. However, as the trend has been slowing down inWPR-A during the last decade, we also assumed that the downwardtrend would stop. Based on the observed trends in AFR-D, we alsoassumed that the downward trend would stop in AFR-E. Large fluctua-tions were observed in AFR-D between 1961 and 1981, followed by arelatively steady increase in fruit and vegetable availability. In AMR-D,the trend also was downwards between the late 1960s until the early1990s, but this has been followed by a small recovery. In EMR-B, a steepincrease was seen between the early 1970s until the mid-1980s. This was followed by a decrease in fruit and vegetable availability betweenabout 1985 and 1990. Thereafter, the trend has been upward again.Finally, in EUR-B and EUR-C, the general increase in fruit and vegetableavailability observed during the 1960s, 1970s and early 1980s was fol-lowed by a 10-year decrease in availability. This coincided with the sig-nificant political and economic changes that occurred in the subregionbefore and after the collapse of the former Soviet Union. Around1993/1994, the trend then changed and a recovery was observed. Thecurrent upward trend is relatively gradual in EUR-C, but relatively steepin EUR-B.
5.2 Predicting subregional fruit and vegetable intake to 2030
In order to predict subregional fruit and vegetable intakes by age andsex between 2000 and 2030, a two-step process was used. First, the pre-dicted subregional availability figures were obtained using linear regres-sion analyses with fruit and vegetable availability and time (years) as thedependent and independent variables, respectively. For subregions wherea relatively steadily increasing trend was observed (AMR-A, AMR-B,EMR-D, EUR-A, SEAR-B, SEAR-D and WPR-B), FAO data from 1961onwards were used. For WPR-A and AFR-E, it was conservativelyassumed that a plateau was reached during the prediction period. Forthe other subregions, a case-by-case approach was used based on thetrends observed. For AFR-D and AMR-D, 1978 and 1992 were used asrespective cut-off points for the regression analyses, as these years rep-
Karen Lock et al. 701
resented a point in time where a steep downward trend was stopped.Both EUR-B and EUR-C have experienced large fluctuations recently,and it is thus very difficult to predict future trends. For EUR-C, 1993was selected as a cut-off since the downward trend slowed down fromthat point in time. The conservative increasing trend from 1993 onwardswas thus used to predict future fruit and vegetable availability in thatsubregion. In EUR-B, a steep upward trend was observed from 1993.However, it is assumed that this trend will slow down and thus theaverage of the trend from 1993 onwards and the trend during the lasttwo decades (1980+) was arbitrarily chosen. A similar approach wasused for EMR-B where it is assumed that the observed trend since 1988is too steep to reflect future projections.
The second step calculated the proportional changes in fruit and veg-etable availability between 1997 (arbitrarily selected as representing thetime when intake data were obtained) and 2000, 2005, 2010, 2015,2020, 2025 and 2030. These were then applied to the intake data pre-sented in section 2.8, assuming the same proportional increase in intakesin both genders and all age groups within each subregion.
The results obtained for AMR-D, EMR-B, EUR-B and EUR-C, whichare based on smaller numbers of data points, should be treated with par-ticular caution.
5.3 Limitations of the methods
The results obtained for the projected fruit and vegetable intakes needto be treated with caution as the approach used has several limitations.One major limitation is related to the lack of time trend data on fruitand vegetable intake around the world, and the resulting need to basethe calculations on food balance sheet data. Availability statistics can bea useful tool to observe trends in food availability in the past. However,predicting availability in the future (outside the range of available data)using linear regression analysis and making the assumption that trendswill not change, may lead to false conclusions as current trends maychange in the next 30 years for many reasons. For example, had weundertaken this analysis for EUR-C 10 years previously, the resultswould have been completely different. The values obtained for EMR-B,for example, appear to be too high compared with those obtained forthe other subregions. In addition, as food balance sheets reflect foodavailability and not food intake, it is not possible to know whether therelative changes in availability are explained by variations in intakes orby other changes such as an increase in waste at the household level.
Predicting fruit and vegetable consumption is especially difficultbecause of the range of factors influencing dietary intakes, including foodavailability, economic situation, seasons, cultural preferences, fashionsand knowledge and potential interactions between these factors. To basefuture estimates of fruit and vegetable intake on the predicted levels ofany one of these factors (e.g. predicted gross national product [GNP] of
702 Comparative Quantification of Health Risks
a country in 20 years) is not justified, in part due to the lack of infor-mation on future trends in these factors themselves. Furthermore,assumptions of such relationships would overlook the multiple determi-nants of diet. For example, we have seen that intakes vary considerablyamong countries with similar GNP (e.g. Ireland, Italy and the UnitedKingdom). Thus, the predictions presented in this chapter simply assumea continuation of complex patterns of social, economic and agriculturaldevelopment of these countries in recent years.
AcknowledgementsWe would like to thank Dan Altmann, Majid Ezzati and Steve VanderHoorn for their statistical advice. The Stata program used to implementthe method of Greenland and Longnecker was written and tested by IanWhite.
We also wish to thank Aileen Robertson for her contributions, and toacknowledge the help of many people worldwide who provided us withdata on fruit and vegetable intake, those who helped us identify poten-tial sources of intake data and research evidence, and all those whooffered advice on methods (see list below).
We would like to thank M.E. Rio, L. Cappelen, M.C. PerezSomigliana, N.M. de Parada, N. Piazza, B. Houssay, H. Lareyna, S.Closa, K. Baghurst, S. Record, S. De Henauw, S. Petrova, S. Fagt, M.Lahti Koski, G.B.M. Mensink, S. Friel, D. Nitzan Kaluski, R. Goldberg,A. Turrini, Y. Matsumura, N. Yoshiike, T. Sharmanov, J. Rivera Dommarco, L. Johansson, M. Deurenberg-Yap, T-Bee Yian, C. Suok-Kai,J.S. Hampl and B.M. Popkin for providing us with data stratified accord-ing to the GBD age–sex categories.
Further acknowledgements go to: M.A.G. Bendech, M.K. Gabr, C.Fatoumata, F. Staubli Asobayire, P. Bovet, D. Labadarios, N. Stein, N.A.Ouedraogo, A. Pacin, L. Cappelen, M.C. Perez Somigliana, N. Marcilla,N. Piazza, H. Lareina, S. Closa, M.E. Gomez del Rio, D.R. Petteta, J.Montero, M. Esther, A. Achutti, R. Costa Ribeiro, M. Pastor, C.A. Monteiro, F. Begin, E. Boy, S. Alary, B. Choi, C. Koeune, P. Fisher, M.Houde Nadeau, S. Kirkland, C. Leinweber, L. Marrett, J. MacDonald,T. Wolever, O.F. Herran Falla, A. Rodriguez-Ojea, J. Gonzalez, F. Henry,J. Rivera Dommarco, C.P. Sanchez-Castillo, B. Popkin, T. Forrester, W.Freire, J. Potter, C. Garza, N. Scrimshaw, E. Murray, L.B. Dixon, J.Hampl, J. Hart, J. Kause, J. McClelland, S. McPherson, Lee Soo-Kyung,P. Terry, J.R. Hebert, P. Kaufmann, C. Junshi, W. Zhao, C. Chumming,J. Chen, J. Woo Wong, S. Sung, R. Gupta, H. Soori, Y. Matsumura, S.Mizushima, K. Ogawa, N.M. Al Hamad, N. Hwalla Baba, S. Jabbour,S. Reijo, J.A. Al Lawati, L.T. Cavalli-Sforza, M.O.O. Alcantara, C. Suok-Kai, M. Deurenberg-Yap, T. Bee-Yian, K. Cho-il Kim, W.H. Pan,S. Durongkadaj, P. Rawdaree, P. Chompook, L. Georgieva, S. Petrova,A. Kaic-Rak, Z. Brázdová, A.M. Beck, L. Ovesen, S. Fagt, J.
Karen Lock et al. 703

Haraldsdóttir, J.M. Lauritsen, A. Kasmel, S. Vaask, M. Lahti-Koski, R.Prattala, P. Knekt, M. Chauliac, J.L. Volatier, C. Cohidon, S. Hercberg,P. Wild, T. Norat, E. Riboli, K. Nemsadze, L. Bregvadze, G. Mensink,A. Potz, W. Sichert-Hellert, M. Thamm, G. Biro, P. Józan, J. Fodor, M.Szabo, T. Varga, G. Zajkás, J.M. Kearney, S. Friel, D. Kaluski, R. Goldsmith, F. Branca, A. Turrini, A. Ferro-Luzzi, A. Zucchi, P. Merrikin,B. Sarbayev, T.S. Sharmanov, G. Abuova, I. Pudule, M. Ellul, K .Hulshof,C.A.J. van Mierlo, H. Boshuizen, B. Blaker, L. Johansson, L. Szponar, P.Graça, P. Moreira, A.D. Deev, J. Maucec Zakotnik, B. Tivadar, A.Agudo, J. De Irala Estevez, O. Moreiras, I. López Azpiazu, K. Manderbacka, S. Hess, F.S. Asobayire, P. Bovet, E. Brunner, N. Day, A.Draper, S. Green, L. Hayes, P. James, K.T. Khaw, T. Lobstein, A. Ness,J. Powles, I. Sharp, H. Teomainen, M. Thorogood, P. Warner, T. Vos, K.Baghurst, S. Record, M. Coad, M. Anthea Magarey, E. RutishauserEngel, I. Coles-Rutishauser, M. Watson, D. Woodward, D. Schulz, L.Andrew, K. Sladden and M. Tobias.
This work was supported by a grant from the English Department ofHealth. However, the English Department of Health cannot acceptresponsibility for any information provided or views expressed.
Notes1 See preface for an explanation of this term.
2 Estimating the subregional mean
• Estimation of the subregional (pooled) mean:
where i = 1, . . . , k sampled countries, Ni is the
population of the ith country and is the mean of the ith country.
• 95% confidence interval (CI) for this estimator:
The variance of this estimator can be derived using:
and assuming the means are independent
Where now:
with si the standard deviation for the ith country,
sample size ni.
The term is the finite population correction.
The standard error of the estimator is the square root of the variance.
The 95% CI for the subregional (pooled) mean is calculated as:
1 -ÊË
ˆ¯
nN
i
i
Var xsn
nN
ii
i
i
i
( ) = -ÊË
ˆ¯
2
1 ,
= ÊËÁ
ˆ¯ ¥( ) = Ê
ËÁˆ¯
( )Â Â Â Â1 12 2
2
NVar N x
NN Var x
ii i
ii i
VarN
Var N xi
i im( ) = ÊËÁ
ˆ¯ ¥( ) Â1
2
xi
m =¥Â
ÂN x
Ni i
i
704 Comparative Quantification of Health Risks

= Subregional mean ± (1.96 x standard error of this estimator)
Estimating the subregional standard deviation
• Estimation of the subregional (pooled) variance and standard deviation:
where s2 = pooled variance for the subregion, I = 1, . . . , k sampled coun-tries, Ni is the population of the ith country and si
2 is the variance (squareof SD) of the ith country; N is the sum of the Ni, in other words the sumof the populations of the sampled countries. This is unbiased because theexpected value of a sample country’s variance is the subregional variance,that is, E(si
2) = s2,
then
• 95% CI for this estimator:
The 95% CI for the subregional (pooled) variance is approximatedusing:
Lower CI = Subregional variance x (n - 1) /c2(n - 1,0.025)
Upper CI = Subregional variance x (n - 1) /c2(n - 1,0.975)
where and ni is the sample size for the ith country: n is thusthe total size of the sample taken from the subregion.
ReferencesAgudo A, Esteve MG, Pallares C et al. (1997) Vegetable and fruit intake and the
risk of lung cancer in women in Barcelona, Spain. European Journal onCancer, 33:1256–1261.
Ahmad K, Hassan N (1982) Nutrition survey of rural Bangladesh. Institute ofNutrition and Food Science, Dhaka University, Dhaka.
Andersen NL, Fagt S, Groth MV et al. (1996) Danskernes kostvaner 1995[Danish dietary patterns 1995]. National Food Agency, Copenhagen. (InDanish; English summary).
Anonymous (1994) The effect of vitamin E and beta-carotene on the incidenceof lung cancer and other cancers in male smokers. The Alpha-Tocopherol,Beta-Carotene Cancer Prevention Study group. New England Journal of Medicine, 330:1029–1035.
Ascherio A, Rimm EB, Hernan MA et al. (1998) Intake of potassium, magne-sium, calcium and fiber and risk of stroke among US men. Circulation,98:1198–1204.
Ascherio A, Rimm EB, Hernan MA et al. (1999) Relation of consumption ofvitamin E, vitamin C and caretonoids to risk for stroke among men in theUnited States. Annals of Internal Medicine, 130:963–970.
n ni= ( )Â
s 2( )
E s s s2 2 2 21 1( ) = ( ) = =Â ÂNN E s
NNi i i
ˆ ˆs s22
22
=¥
= =¥Â
ÂÂN s
N
N s
Ni i
i
i i
Karen Lock et al. 705

Awad AB, Downie A, Fink CS, Kim U (2000) Dietary phytosterol inhibits thegrowth and metastasis of MDA-MB-231 human breast cancer cells grown inSCID mice. Anticancer Research, 20:821–824.
Axelsson G, Liljeqvist T, Andersson L, Bergman B, Rylander R (1996) Dietaryfactors and lung cancer among men in west Sweden. International Journal ofEpidemiology, 25:32–39.
Bates C, Thurnham S, Bingham S, Margetts B, Nelson M (1991) Biochemicalmarkers of nutrient intake. In: Design concepts in nutritional epidemiology.Margetts B, Nelson M, eds. Oxford Medical Publications, Oxford.
Bazzano LA, He J, Ogden LG et al. (2001) Dietary potassium intake and risk ofstroke in US men and women: National Health and Nutrition ExaminationSurvey I epidemiologic follow-up study. Stroke, 32:1473–1480.
Bazzano L, Ogden LG, Vupputur IS, Loria C, Meyers L, Whelton PK (2000)Fruit and vegetable intake reduces cardiovascular disease mortality: resultsfrom the NHANES I epidemiologic follow-up study (NHEFS). AmericanHeart Association, 40th Annual Conference on Cardiovascular Disease Epi-demiology and Prevention. San Diego, CA.
Benito E, Obrador A, Stiggelbout A et al. (1990) A population-based case-controlstudy of colorectal cancer in Majorca. I. Dietary factors. International Journalof Cancer, 45:69–76.
Bidoli E, Franceschi S, Talamini R, Barra S, La Vecchia C (1992) Food con-sumption and cancer of the colon and rectum in north-eastern Italy. Interna-tional Journal of Cancer, 50:223–229.
Bingham SA, Gill, C, Welch, A et al. (1994) Comparison of dietary assessmentmethods in nutritional epidemiology: weighed records v. 24 h recalls, food-frequency questionnaires and estimated-diet records. British Journal of Nutrition, 72:619–643.
Bingham SA, Gill C, Welch A et al. (1997) Validation of dietary assessmentmethods in the UK arm of EPIC using weighed records, and 24-hour urinarynitrogen and potassium and serum vitamin C and carotenoids as biomarkers.International Journal of Epidemiology, 26:S137–151.
Bingham SA, Nelson M, Paul AA, Haraldsdottir J, Løken EB, van Staveren WA(1988) Methods of data collection at an individual level. In: Manual onmethodology for food consumption studies. Cameron ME, van Staveren WA,eds. Oxford University Press, Oxford.
Blot WJ, Li JY, Taylor PR, Guo W, Dawsey SM, Li B. (1995) The Linxian trials:mortality rates by vitamin-mineral intervention group. American Journal ofClinical Nutrition, 62:S1424–1426.
Boeing H, Frentzel-Beyme R, Berger M et al. (1991a) Case-control study on dietand stomach cancer in Germany. International Journal of Cancer, 47:858–864.
Boeing H, Jedrychowski W, Wahrendorf J, Popiela T, Tobiasz-Adamczyk B, KuligA (1991b) Dietary risk factors in intestinal and diffuse types of stomachcancer: a multicenter case-control study in Poland. Cancer Causes andControl, 2:227–233.
706 Comparative Quantification of Health Risks

Bond GG, Thompson FE, Cook RR (1987) Dietary vitamin A and lung cancer:results of a case-control study among chemical workers. Nutrition andCancer, 9:109–121.
Bosetti C, La Vecchia C, Talamini R et al. (2000) Food groups and risk of squa-mous cell esophageal cancer in northern Italy. International Journal ofCancer, 87:289–294.
Boshuizen HC, Bueno-de-Mesquita HB, Altenburg HP et al. (2002) Adjust-ment for smoking in lung cancer analyses in the EPIC cohort. IARC Scien-tific Publications, 156:59–61.
Botterweck AA, van den Brandt PA, Goldbohm RA (1998) A prospective cohortstudy on vegetable and fruit consumption and stomach cancer in the Nether-lands. American Journal of Epidemiology, 148:842–853.
Botterweck AA, van den Brandt PA, Goldbohm RA (2000) Vitamins,carotenoids, dietary fiber, and the risk of gastric carcinoma. Cancer,88:737–748.
Boushey CJ, Beresford SA, Omenn GS, Motulsky AG (1995) A quantitativeassessment of plasma homocysteine as a risk factor for vascular disease.Journal of the American Medical Association, 274:1049–1057.
Brennan P, Fortes C, Butler J et al. (2000) A multicenter case-control study ofdiet and lung cancer among non-smokers. Cancer Causes and Control,11:49–58.
Breslow RA, Graubard BI, Sinha R, Subar AF (2000) Diet and lung cancer mor-tality: a 1987 National Health Interview Survey cohort study. Cancer Causesand Control, 11:419–431.
Brigelius-Flohe R, Traber MG (1999) Vitamin E: function and metabolism.FASEB Journal, 13:1145–1155.
Brown LM, Blot WJ, Schuman SH et al. (1988) Environmental factors and highrisk of esophageal cancer among men in coastal South Carolina. Journal ofthe National Cancer Institute, 80:1620–1625.
Brown LM, Swanson CA, Gridley C et al. (1995) Adenocarcinoma of the esoph-agus: role of obesity and diet. Journal of the National Cancer Institute,87:104–109.
Brown LM, Swanson CA, Gridley et al. (1998) Dietary factors and the risk ofsquamous cell esophageal cancer among black and white men in the UnitedStates. Cancer Causes and Control, 9:467–474.
Buiatti E, Palli D, Decarli A et al. (1989) A case-control study of gastric cancerand diet in Italy. International Journal of Cancer, 44:61–616.
Burr ML, Fehily AM, Gilbert JF et al. (1989) Effects of changes in fat, fish andfibre intakes on death and myocardial infarction: diet and reinfarction trial(DART). The Lancet, 2:757–761.
Byers TE, Graham S, Haughey BP, Marshall JR, Swanson MK (1987) Diet andlung cancer risk: findings from the Western New York Diet Study. AmericanJournal of Epidemiology, 125:351–363.
Karen Lock et al. 707

Cameron M, van Staveren WA (1988) Manual on methodology for food con-sumption studies. Oxford University Press, Oxford.
Candelora EC, Stockwell HG, Armstrong AW, Pickham PA (1992) Dietary intakeand risk of lung cancer in women who never smoked. Nutrition and Cancer,17:263–270.
Castellsague X, Munoz N, De Stefani E, Victoria CG, Castelletto R, Rolon PA(2000) Influence of mate drinking, hot beverages and diet on esophagealcancer risk in South America. International Journal of Cancer, 88:658–664.
Chambers JC, Seddon MD, Shah S, Kooner JS (2001) Homocysteine—a novelrisk factor for vascular disease. Journal of Royal Society of Medicine,94:10–13.
Chen LY, Jokela R, Li DY et al. (2000) Effect of stable fish oil on arterial throm-bogenesis, platelet aggregation, and superoxide dismutase activity. Journal ofCardiovascular Pharmacology, 35:502–505.
Cheng KK, Day NE (1996) Nutrition and esophageal cancer. Cancer Causes andControl, 7:33–40.
Cheng KK, Day NE, Davies TW (1992) Oesophageal cancer mortality in Europe:paradoxical time trend in relation to smoking and drinking. British Journalof Cancer, 65:613–617.
Cheng KK, Day NE, Duffy SW, Lam TH, Fok M, Wong J (1992) Pickled veg-etables in the aetiology of oesophageal cancer in Hong Kong Chinese. TheLancet, 339:1314–1318.
Cheng KK, Duffy SW, Day NE, Lam TH (1995) Oesophageal cancer in never-smokers and never-drinkers. International Journal of Cancer, 60:820–822.
Cheng KK, Sharp L, McKinney PA et al. (2000) A case-control study ofoesophageal adenocarcinoma in women: a preventable disease. BritishJournal of Cancer, 83:127–132.
Chow WH, Schuman LM, McLaughlin JK et al. (1992) A cohort study oftobacco use, diet, occupation, and lung cancer mortality. Cancer Causes andControl, 3:247–254.
Chyou PH, Nomura AM, Hankin JH, Stemmermann GN (1990) A case-cohortstudy of diet and stomach cancer. Cancer Research, 50:7501–7504.
Coggon D, Barker DJ, Cole RB, Nelson M (1989) Stomach cancer and foodstorage. Journal of the National Cancer Institute, 81:1178–1182.
Collins R, Peto R, Armitage J (2002) The MRC/BHF Heart Protection study:preliminary results. International Journal of Clinical Practice, 56:53–56.
Conlin PR, Chow D, Miller ER 3rd et al. (2000) The effect of dietary patternson blood pressure control in hypertensive patients: results from the DietaryApproaches to Stop Hypertension (DASH) trial. American Journal of Hypertension, 13:949–955.
Cornee J, Pobel D, Riboli E, Guyader M, Hemon B (1995) A case-control studyof gastric cancer and nutritional factors in Marseille, France. EuropeanJournal of Epidemiology, 11:55–65.
708 Comparative Quantification of Health Risks
Correa P, Fontham ET, Bravo JC et al. (2000) Chemoprevention of gastric dys-plasia: randomized trial of antioxidant supplements and anti-helicobacterpylori therapy. Journal of the National Cancer Institute, 92:1881–1888.
Correa P, Fontham E, Pickle LW, Chen V, Lin YP, Haenszel W (1985) Dietarydeterminants of gastric cancer in south Louisiana inhabitants. Journal of theNational Cancer Institute, 75:645–654.
Darby S, Whitley E, Doll R, Key TJA, Silcocks P (2001) Diet, smoking and lungcancer: a case control study of 1000 cases and 1500 controls in south-westEngland. British Journal of Cancer, 84:728–735.
Daviglus ML, Orencia AJ, Dyer AR et al. (1997) Dietary vitamin C, beta-carotene and 30-year risk of stroke: results from the Western Electric study.Neuroepidemiology, 16:69–77.
Day NE, Ferrari P (2002) . Some methodological issues in nutritional epidemi-ology. IARC Scientific Publications, 156:5–10.
Day N, McKeown N, Wong M, Welch A, Bingham S (2001) Epidemiologicalassessment of diet: a comparison of a 7-day diary with a food frequency ques-tionnaire using urinary markers of nitrogen, potassium and sodium. Interna-tional Journal of Epidemiology, 30:309–317.
De Henauw S, De Backer G (1999) Nutrient and food intakes in selected sub-groups of Belgian adults. British Journal of Nutrition, 81:S37–42.
de Lorgeril M, Renaud S, Mamelle N et al. (1994) Mediterranean alpha-linolenicacid-rich diet in secondary prevention of coronary heart disease. The Lancet,343:1454–1459.
de Lorgeril M, Salen P, Martin JL, Monjaud I, Delaye J, Mamelle N (1999)Mediterranean diet, traditional risk factors, and the rate of cardiovascularcomplications after myocardial infarction: final report of the Lyon Diet Heartstudy. Circulation, 99:779–785.
Decarli A, Liati P, Negri E, Franceschi S, La Vecchia C (1987) Vitamin A andother dietary factors in the etiology of esophageal cancer. Nutrition andCancer, 10:29–37.
Demirer T, Icli F, Uzunalimoglu O, Kucuk O (1990) Diet and stomach cancerincidence. A case control study in Turkey. Cancer, 65:2344–2348.
Deneo-Pellegrini PH, De Stephani E, Ronco A (1996) Vegetables, fruits, and riskof colorectal cancer: a case-control study from Uruguay. Nutrition andCancer, 25:297–304.
DerSimonian R, Laird N (1986) Meta-analysis in clinical trials. Controlled Clin-ical Trials, 7:177–188.
Directorate of Intelligence (2000) World fact book 2000. Central IntelligenceAgency, Washington, DC.
Dorgan JF, Ziegler RG, Schoenberg JB et al. (1993) Race and sex differences inassociations of vegetables, fruits and carotenoids with lung cancer risk in NewJersey (United States). Cancer Causes and Control, 4:273–281.
Egger M, Schneider M, Davey Smith G (1998) Spurious precision? Meta-analysis of observational studies. British Medical Journal, 316:140–144.
Karen Lock et al. 709
Ekstrom AM, Serafini M, Nyren O, Hansson LE, Ye W, Wolk A (2000) Dietaryantioxidant intake and the risk of cardia cancer and noncardia cancer of theinterstitial and diffuse types: a population-based case-control study inSweden. International Journal of Cancer, 87:133–140.
Elwood PC, Fehily AM, Ising H, Poor DJ, Pickering J, Kamel F (1996) Dietarymagnesium does not predict ischaemic heart disease in the Caerphilly cohort.European Journal of Clinical Nutrition, 50:694–697.
Faivre J, Boutron MC, Senesse P, Couillault C, Belighiti C, Meny B (1997) Envi-ronmental and familial risk factors in relation to the colorectal-carcinomasequence: results of a case-control study in Burgundy (France). EuropeanJournal of Cancer Prevention, 6:127–131.
Fehily AM, Yarnell JW, Sweetnam PM, Elwood PC (1993) Diet and incidentischaemic heart disease: the Caerphilly study. British Journal of Nutrition,69:303–314.
Feskanich D, Ziegler R, Michaud DS et al. (2000) Prospective study of fruit andvegetable consumption and risk of lung cancer among men and women.Journal of the National Cancer Institute, 92:1812–1823.
Finch S, Doyle, W, Lowe C, Bates C, Prentice A, Smithers G, Clarke PC (1998)National diet and nutrition survey—people aged 65 years and over. HMSO,London.
Findiet Study Group (1998) Dietary survey of Finnish adults 1997. NationalPublic Health Institute, Helsinki.
Fontham ET, Pickle LW, Haenszel W, Correa P, Lin YP, Falk RT (1988) Dietaryvitamin A and C and lung cancer risk in Louisiana. Cancer, 62:2267–2273.
FAO (1983) A comparative study of food consumption data from food balancesheets and household surveys. Food and Agriculture Organization of theUnited Nations, Rome.
FAO (1998a) Nutrition country profile: Nepal. Food and Agriculture Organiza-tion of the United Nations, Rome.
FAO (1998b) Nutrition country profile: Pakistan. Food and Agriculture Orga-nization of the United Nations, Food and Nutrition Division, Rome.
FAO (2001) FAOSTAT. Available at http://apps.fao.org/. Food and AgricultureOrganization of the United Nations, Rome (checked February 28, 2003).
Forman MR, Yao SX, Graubard BI et al. (1992) The effect of dietary intake offruits and vegetables on the odds ratio of lung cancer among Yunnan tinminers. International Journal of Epidemiology, 21:437–441.
Franceschi S, Bidoli E, La Vecchia C, Talamini R, D’Avanzo B, Negri E (1994)Tomatoes and risk of digestive-tract cancers. International Journal of Cancer,59:181–184.
Francecshi S, Favero A, La Vecchia C et al. (1997) Food groups and risk of col-orectal cancer in Italy. International Journal of Cancer, 72:56–61.
Franceschi S, Parpinel M, La Vecchia C, Favero A, Talamini R, Negri E (1998)Role of different types of vegetables and fruit in the prevention of cancer ofthe colon, rectum and breast. Epidemiology, 9:338–341.
710 Comparative Quantification of Health Risks
Fraser GE, Beeson WL, Phillips RL (1991) Diet and lung cancer in CaliforniaSeventh-day Adventists. American Journal of Epidemiology, 133:683–693.
Fraser GE, Sabate J, Beeson WL, Strahan TM (1992) A possible protective effectof nut consumption on risk of coronary heart disease. The Adventist healthstudy. Archives of Internal Medicine, 152:1416–1424.
Freudenheim JL, Graham S, Horvath PJ, Marshall JR, Haughey BP, WilkinsonG (1990) Risk associated with source of fiber and fiber components in cancerof the colon and rectum. Cancer Research, 50:3295–3300.
Friel S, NicGabhann S, Kelleher C (1999) The National Health and LifestyleSurvey (SLÁN)—Survey of lifestyles, attitudes and nutrition. Health Promo-tion Unit/NUI Galway, Dublin.
Fuchs CS, Giovannucci, EL, Colditz GA et al. (1999) Dietary fiber and the riskof colorectal cancer and adenoma in women. New England Journal of Medicine, 340:169–176.
Galanis DJ, Kolonel LN, Lee J, Nomura A (1998) Intakes of selected foods andbeverages and the incidence of gastric cancer among the Japanese residentsof Hawaii: a prospective study. International Journal of Epidemiology,27:173–180.
Gale CR, Martyn CN, Winter PD, Cooper C (1995) Vitamin C and risk of deathfrom stroke and coronary heart disease in cohort of elderly people. BritishMedical Journal, 310:1563–1566.
Gandini S, Merzenich H, Robertson C, Boyle P (2000) Meta–analysis of studieson breast cancer risk and diet: the role of fruit and vegetable consumptionand the intake of associated micronutrients. European Journal of Cancer,36:636–646.
Gao C, Tajima K, Kuroishi T, Hirose K, Inoue M (1993) Protective effects ofraw vegetables and fruit against lung cancer among smokers and ex-smokers:a case-control study in the Tokai area of Japan. Japanese Journal of CancerResearch, 84:594–600.
Gao YT, McLaughlin JK, Gridley G et al. (1994) Risk factors for esophagealcancer in Shanghai, China. II. Role of diet and nutrients. International Journalof Cancer, 58:197–202.
Garcia-Closas R, Gonzales CA, Agudo A, Riboli E (1999) Intake of specificcarotenoids and flavonoids and the risk of gastric cancer in Spain. CancerCauses and Control, 10:71–75.
Garidou A, Tzonou A, Lipworth L, Signorello LB, Kalapothaki V, TrichopoulosD (1996) Life-style factors and medical conditions in relation to esophagealcancer by histologic type in a low-risk population. International Journal ofCancer, 68:295–299.
Gaziano JM (1996) Antioxidants in cardiovascular disease: randomized trials.Nutrition, 12:583–588.
Gaziano JM, Hennekens CH (1993) The role of beta-carotene in the preventionof cardiovascular disease. Annals of the New York Academy of Science,691:148–155.
Karen Lock et al. 711
Gaziano JM, Manson JE, Branch LG, Colditz GA, Willett WC, Buring JE (1995) A prospective study of consumption of carotenoids in fruits and vegetables and decreased cardiovascular mortality in the elderly. Annals ofEpidemiology, 5:255–260.
Gershoff SN (1993) Vitamin C (ascorbic acid): new roles, new requirements?Nutrition Reviews, 51:313–326.
Gey K (1995) Cardiovascular disease and vitamins. Concurrent correction of‘suboptimal’ plasma antioxidant levels may, as important part of ‘optimal’nutrition, help to prevent early stages of cardiovascular disease and cancer,respectively. Bibliotheca Nutritio et Dieta, 52:75–91.
Ghadirian P, Lacroix A, Maisonneuve P et al. (1997) Nutritional factors andcolon carcinoma: a case-control study involving French Canadians in Mon-treal, Quebec, Canada. Cancer, 80:858–864.
Gillman MW, Cupples LA, Gagnon D et al. (1995) Protective effect of fruits andvegetables on development of stroke in men. Journal of the American MedicalAssociation, 273:1113–1117.
Giovannucci E, Rimm EB, Stampfer MJ, Colditz GA, Ascherio A, Willett WC(1994) Intake of fat, meat, and fiber in relation to risk of colon cancer in men.Cancer Research, 54:2390–2397.
Gonzales CA, Sanz JM, Marcos G et al. (1991) Dietary factors and stomachcancer in Spain: a multi-centre case-control study. International Journal ofCancer, 49:513–519.
Goodman MT, Hankin JH, Wilens LR, Kolonel LN (1992) High-fat foods andthe risk of lung cancer. Epidemiology, 3:288–299.
Government of India (1998) India nutrition profile. Ministry of Human ResourceDevelopment, Delhi.
Graham S, Haughey B, Marshall J et al. (1990) Diet in the epidemiology ofgastric cancer. Nutrition and Cancer, 65:2344–2348.
Graham S, Marshall J, Haughey B et al. (1988) Dietary epidemiology of cancerof the colon in western New York. American Journal of Epidemiology,128:490–503.
Greenberg E, Sporn MB (1996) Antioxidant vitamins, cancer and cardiovascu-lar disease. New England Journal of Medicine, 334:1189–1190.
Greenland S, Longnecker MP (1992) Methods for trend estimation from sum-marized dose–response data, with applications to meta-analysis. AmericanJournal of Epidemiology, 135:1301–1309.
Gregory J (1990) The dietary and nutritional survey of British adults a surveyof the dietary behaviour, nutritional status and blood pressure of adults aged16 to 64 living in Great Britain. HMSO, London.
Gregory J (1995) National diet and nutrition survey children aged 1 1/2 to 4 1/2years. HMSO, London.
Gregory J (2000) National diet and nutrition survey: young people aged 4 to 18years. Report of the diet and nutrition survey. HMSO, London.
712 Comparative Quantification of Health Risks
Guo W, Blot WJ, Li JY et al. (1994) A nested case-control study of oesophagealand stomach cancers in the Linxian nutrition intervention trial. InternationalJournal of Epidemiology, 23:444–450.
Guo WD, Li JY, Blot WJ, Hsing AW, Chen JS, Fraumeni JF Jr (1990) Correla-tions of dietary intake and blood nutrient levels with esophageal cancer mor-tality in China. Nutrition and Cancer, 13:121–127.
Haegele AD, Gillette C, O’Neill C et al. (2000) Plasma xanthophyll carotenoidscorrelate inversely with indices of oxidative DNA damage and lipid peroxi-dation. Cancer Epidemiology, Biomarkers and Prevention, 9:421–425.
Hanaoka T, Tsugane S, Ando N et al. (1994) Alcohol consumption and risk ofesophageal cancer in Japan: A case-control study in seven hospitals. JapaneseJournal of Clinical Oncology, 24:241–246.
Hansson LE, Nyren O, Bergstrom R et al. (1993) Diet and risk of gastric cancer.A population-based case-control study in Sweden. International Journal ofCancer, 55:181–189.
Harris RW, Key TJ, Silcocks PB, Bull D, Wald NJ (1991) A case-control studyof dietary carotene in men with lung cancer and in men with other epithelialcancers. Nutrition and Cancer, 15:63–68.
Harrison LE, Zhang ZF, Karpeh MS, Sun M, Kurtz RC (1997) The role of dietaryfactors in the intestinal and diffuse histological subtypes of gastric adenocar-cinoma: a case-control study in the US. Cancer, 80:1021–1028.
Hebert JR, Clemow L, Pbert L, Ockene IS, Ockene JK (1995) Social desirabil-ity bias in dietary self-report may compromise the validity of dietary intakemeasures. International Journal of Epidemiology, 24:389–398.
Heilbrun LK, Nomura A, Hankin JH, Stemmermann GN (1989) Diet and col-orectal cancer with special reference to fiber intake. International Journal ofCancer, 44:1–6.
Hennekens CH, Buring JE, Manson JE et al. (1996) Lack of effect of long-termsupplementation with beta-carotene on the incidence of malignant neoplasmsand cardiovascular disease. New England Journal of Medicine, 334:1145–1149.
Hertog M, Bueno-de-Mesquita HB, Fehili AM et al. (1996) Fruit and vegetableconsumption and cancer mortality in the Caerphilly study. Cancer Epidemi-ology, Biomarkers and Prevention, 5:673–677.
Hertog MG, Feskens EJ, Holliman PC, Katan MB, Kromhout D (1993) Dietaryantioxidant flavonoids and risk of coronary heart disease: the Zutphen Elderlystudy. The Lancet, 342:1007–1011.
Hill AB (1965). The environment and disease: Association or causation? Pro-ceedings of the Royal Society of Medicine, 58:295–300.
Hirayama T (1986) Nutrition and cancer—a large scale cohort study. Progressin Clinical and Biological Research, 206:299–311.
Hirayama T (1990) Diet and mortality. In: Lifestyle and mortality. Hirayama T,ed. Karger, Basel.
Karen Lock et al. 713

Hirvonen T, Virtamo J, Korhonen P, Albanes D, Pietinen P (2000) Intake offlavonoids, carotenoids, vitamin C and E, and risk of stroke in male smokers.Stroke, 31:2301–2306.
Hirvonen T, Virtamo J, Korhonen P, Albanes D, Pietinen P (2001) Flavonol andflavone intake and the risk of cancer in male smokers (Finland). CancerCauses and Control, 12:789–796.
Hooper L, Ness AR, Smith GD (2001) Antioxidant strategy for cardiovasculardiseases. The Lancet, 357:1705–1706.
Hoshiyama Y, Sasaba T (1992) A case-control study of single and multiplestomach cancers in Saitama Prefecture, Japan. Japanese Journal of CancerResearch, 83:937–943.
Hu J, Johnson KC, Mao Y et al. (1997) A case-control study of diet and lungcancer in northeast China. International Journal of Cancer, 71:924–931.
Hu JF, Liu YY, Yu YK, Zhao TZ, Lui SD, Wang QQ (1991) Diet and cancer ofthe colon and rectum: a case-control study in China. International Journal ofEpidemiology, 20:362–367.
Hu J, Nyren O, Wolk A et al. (1994) Risk factors for oesophageal cancer innortheast China. International Journal of Cancer, 57:38–46.
Hu JF, Zhang SF, Jia EM et al. (1988) Diet and cancer of the stomach: a case-control study in China. International Journal of Cancer, 41:331–335.
Insel P, Turner RE, Ross D (2003) Discovering nutrition—interactive glossary.Jones and Bartlett Publishers, Boston, MA. http://nutrition.jbpub.com/dis-covering/.
Iscovich JM, L’Abbe KA, Castelleto R et al. (1992) Colon cancer in Argentina.I. Risk from intake of dietary items. International Journal of Cancer,51:851–857.
Jain M, Burch JD, Howe GR, Risch HA, Miller AB (1990) Dietary factors andrisk of lung cancer: results from a case-control study, Toronto, 1981–1985.International Journal of Cancer, 45:287–293.
Jansen MC, Bueno-de-Mesquita HB, Rasanen L et al. (2001) Cohort analysis offruit and vegetable consumption and lung cancer mortality in European men.International Journal of Cancer, 92:913–918.
Jedrychowski W, Wahrendorf J, Popiela T, Rachtan J (1986) A case-control studyof dietary factors and stomach cancer risk in Poland. International Journalof Cancer, 37:837–842.
Jha P, Flather M, Lonn E, Farkouh M, Yusuf S (1995) The antioxidant vitaminsand cardiovascular disease. A critical review of epidemiologic and trial data.Annals of Internal Medicine, 123:860–872.
Ji BT, Chow WH, Yang G et al. (1998) Dietary habits and stomach cancer inShanghai, China. International Journal of Cancer, 76:659–664.
Joffe M, Robertson A (2001) The potential contribution of increased vegetableand fruit consumption to health gain in the European Union. Public HealthNutrition, 4:893–901.
714 Comparative Quantification of Health Risks

Johansson G, Wikman A, Ahren AM, Hallmans G, Johansson I (2001) Under-reporting of energy intake in repeated 24-hour recalls related to gender, age,weight status, day of interview, educational level, reported food intake,smoking habits and area of living. Public Health Nutrition, 4:919–927.
Joshipura KJ, Ascherio A, Manson JE et al. (1999) Fruit and vegetable intake inrelation to risk of ischemic stroke. Journal of the American Medical Association, 282:1233–1239.
Joshipura KJ, Hu FB, Manson JE et al. (2001) The effect of fruit and vegetableintake on risk for coronary heart disease. Annals of Internal Medicine,134:1106–1114.
Kalandidi A, Katsouyanni K, Voropoulou N, Bastas G, Saracci R, TrichopoulosD (1990) Passive smoking and diet in the etiology of lung cancer and amongnonsmokers. Cancer Causes and Control, 1:15–21.
Kampman E, Verhoeven D, Sloots L, van’t Veer P (1995) Vegetable and animalproducts as determinants of colon cancer in Dutch men and women. CancerCauses and Control, 6:225–234.
Kantor LS, Kipton K, Manchester A, Oliveria V (1997) Estimating and address-ing America’s food losses. Food Review U.S. Department of Agriculture, Eco-nomic Research Service, Washington, DC.
Kato I, Akhmedkhanov A, Koenig K, Toniolo PG, Shore RE, Riboli E (1997)Prospective study of diet and female colorectal cancer: the New York Uni-versity Women’s Health study. Nutrition and Cancer, 28:276–281.
Kato I, Dnistrian, A, Schwartz M et al. (1999) Serum folate, homocysteine andcolorectal cancer risk in women: a nested case-control study. British Journalof Cancer, 79:1917–1922.
Kato I, Tominaga S, Ito Y et al. (1990) A comparative case-control analysis ofstomach cancer and atrophic gastritis. Cancer Research, 50:6559–6564.
Kato I, Tominaga S, Matsumoto K (1992) A prospective study of stomach canceramong a rural Japanese population: a 6-year survey. Japanese Journal ofCancer Research, 83:568–575.
Kauhanen J, Kaplan GA, Goldberg DE, Salonen R, Salonen JT (1999) Patternof alcohol drinking and progression of atherosclerosis. Arteriosclerosis,Thrombosis and Vascular Biology, 19:3001–3006.
Keli SO, Hertog MG, Feskens EJ, Kromhout D (1996) Dietary flavonoids,antioxidant vitamins, and incidence of stroke: the Zutphen study. Archives ofInternal Medicine, 156:637–642.
Kelly A, Becker W, Helsing E (1991) Food balance sheets. In: Food and healthdata. Their use in nutrition policy-making. Becker W, Helsing E, eds. (Euro-pean Series No. 34.) WHO Regional Publications, World Health Organiza-tion, Copenhagen.
Kennedy AR (1998) Chemopreventive agents: protease inhibitors. Pharmacol-ogy and Therapeutics, 78:167–209.
Key TJ, Thorogood M, Appleby PN, Burr ML (1996) Dietary habits and mor-tality in 11 000 vegetarians and health conscious people: results of a 17-yearfollow-up. British Medical Journal, 313:775–779.
Karen Lock et al. 715
Kharbanda R, Vallance P (2001) Coronary artery disease—from bench tobedside. Journal of Royal Society of Medicine, 94:61–64.
Khaw KT, Barrett-Connor E (1987a) Dietary fiber and reduced ischemic heartdisease mortality rates in men and women: a 12-year prospective study. Amer-ican Journal of Epidemiology, 126:1093–1102.
Khaw KT, Barrett-Connor E (1987b) Dietary potassium and stroke-associatedmortality. A 12-year prospective population study. New England Journal ofMedicine, 316:235–240.
Khaw KT, Bingham S, Welch A et al. (2001) Relation between plasma ascorbicacid and mortality in men and women in EPIC-Norfolk prospective study: aprospective population study. European Prospective Investigation into Cancerand Nutrition. The Lancet, 357:657–663.
Kipnis V, Carroll RJ, Freedman LS, Li L (1999) Implications of a new dietarymeasurement error model for estimation of relative risk: application to fourcalibration studies. American Journal of Epidemiology, 150:642–651.
Kjaerheim K, Gaard M, Andersen A (1998) The role of alcohol, tobacco, anddietary factors in upper aerodigestive tract cancers: a prospective study of10 900 Norwegian men. Cancer Causes and Control, 9:99–108.
Klerk M, Jansen MCJF, van’t Veer P, Kok FJ (1998) Fruits and vegetables inchronic disease prevention. Wageningen Agricultural University, Wageningen.
Klipstein-Grobusch K, Geleijnse JM, den Breeijen JH et al. (1999) Dietaryantioxidants and risk of myocardial infarction in the elderly: the Rotterdamstudy. American Journal of Clinical Nutrition, 69:261–266.
Knekt P, Isotupa S, Rissanen H et al. (2000) Quercetin intake and the incidenceof cerebrovascular disease. European Journal of Clinical Nutrition, 54:415–417.
Knekt P, Jarvinen R, Reunanen A, Maatela J (1996) Flavonoid intake and coro-nary mortality in Finland: a cohort study. British Medical Journal, 312:478–481.
Knekt P, Jarvinen R, Seppanen R et al. (1991) Dietary antioxidants and the riskof lung cancer. American Journal of Epidemiology, 134:471–479.
Knekt P, Jarvinen R, Seppanen R et al. (1997) Dietary flavonoids and the risk oflung cancer and other malignant neoplasms. American Journal of Epidemi-ology, 146:223–230.
Knekt P, Reunanen A, Jarvinen R, Seppanen R, Heliovaara M, Aromaa A (1994)Antioxidant vitamin intake and coronary mortality in a longitudinal popula-tion study. American Journal of Epidemiology, 139:1180–1189.
Kneller RW, McLaughlin JK, Bjelke E et al. (1991) A cohort study of stomachcancer in a high risk American population. Cancer, 68:672–678.
Kojda G, Harrison D (1999) Interactions between NO and reactive oxygenspecies: pathophysiological importance in atherosclerosis, hypertension, dia-betes and heart failure. Cardiovascular Research, 43:562–571.
Kono S, Hirohata T (1996) Nutrition and stomach cancer. Cancer Causes andControl, 7:41–55.
716 Comparative Quantification of Health Risks

Kono S, Ikeda M, Tokudome S, Kuratsune M (1988) A case-control study ofgastric cancer and diet in northern Kyushu, Japan. Japanese Journal of CancerResearch, 79:1067–1074.
Koo L (1988) Dietary habits and lung cancer risk among Chinese females inHong Kong who never smoked. Nutrition and Cancer: An InternationalJournal, 11:155–172.
Koo L (1997) Diet and lung cancer 20+ years later: more questions than answers?International Journal of Cancer, Suppl. 10:S22–29.
Kotake K, Koyama Y, Nasu J, Fukutomi T, Yamaguchi N (1995) Relation offamily history of cancer and environmental factors to the risk of colorectalcancer: a case-control study. Japanese Journal of Clinical Oncology, 25:195–202.
Kristenson M, Zieden B, Kucinskiene Z et al. (1997) Antioxidant state and mor-tality from coronary heart disease in Lithuanian and Swedish men: concomi-tant cross sectional study of men aged 50. British Medical Journal, 314:629–633.
Kromhout D (1987) Essential micronutrients in relation to carcinogenesis. Amer-ican Journal of Clinical Nutrition, 45:S1361–1367.
Kune GA, Bannerman S, Watson LF (1992) Attributable risk to diet, alcohol andfamily history in the Melbourne Colorectal Cancer study. Nutrition andCancer, 18:231–235.
Kune S, Kune GA, Watson LF (1987) Case-control study of dietary etiologicalfactors: the Melbourne Colorectal Cancer study. Nutrition and Cancer,9:21–42.
Kushi LH, Folsom AR, Prinaes RJ, Mink PJ, Wu Y, Bostick RM (1996) Dietaryantioxidant vitamins and deaths from coronary heart disease in post-menopausal women. New England Journal of Medicine, 334:1156–1162.
Kvale G, Bjelke E, Gart JJ (1983) Dietary habits and lung cancer risk. Interna-tional Journal of Cancer, 31:397–405.
La Vecchia C, Negri E, Decarli A, D’Avanzo B, Franceschi S (1987) A case-control study of diet and gastric cancer in northern Italy. International Journalof Cancer, 40:484–489.
Lampe J (1999) Health effects of vegetables and fruits: assessing mechanisms ofaction in human experimental studies. American Journal of Clinical Nutri-tion, 70:S475–490.
Lapidus L, Andersson H, Bengtsson C, Bosaeus I (1986) Dietary habits in rela-tion to incidence of cardiovascular disease and death in women: a 12-yearfollow-up of the participants in the population study of women in Gothen-berg, Sweden. American Journal of Clinical Nutrition, 44:444–448.
Launoy G, Milan C, Day NE, Pienkowski MP, Gignoux M, Faivre J (1998) Dietand squamous-cell cancer of the oesophagus: a French multicentre case-control study. International Journal of Cancer, 76:7–12.
Law M, Morris J (1998) By how much does fruit and vegetable consumptionreduce the risk of ischaemic heart disease? European Journal of ClinicalNutrition, 52:549–556.
Karen Lock et al. 717
Le Marchand L, Hankin JH, Wilkens LR, Kolonel LN, Englyst HN, Lyu LC(1997) Dietary fibre and colorectal cancer risk. Epidemiology, 8:658–665.
Le Marchand L, Yoshizawa CN, Kolonel LN, Hankin JH, Goodman MT (1989)Vegetable consumption and lung cancer risk: a population-based case-controlstudy in Hawaii. Journal of the National Cancer Institute, 81:1158–1164.
Lee CN, Reed DM, MacLean CJ, Yano K, Chiu D (1988) Dietary potassium andstroke. New England Journal of Medicine, 318:995–996.
Lee HP, Gourley L, Duffy SW, Esteve J, Lee J, Day NE (1989) Colorectal cancerand diet in an Asian population: a case-control study among SingaporeChinese. International Journal of Cancer, 43:1007–1016.
Lee JK, Park BJ, Yoo KY, Ahn YO (1995) Dietary factors and stomach cancer:case-control study in Korea. International Journal of Epidemiology, 24:33–41.
Leppala JM, Virtamo J, Fogelholm R, Albanes D, Taylor PR, Heinonen OP(2000) Vitamin E and beta-carotene supplementation in high risk for stroke:a subgroup analysis of the Alpha-Tocopherol, Beta-Carotene Cancer Preven-tion study. Archives of Neurology, 57:1503–1509.
Levi F, Pasche C, La Vecchia C, Lucchini F, Franceschi S (1999) Food groupsand colorectal cancer risk. British Journal of Cancer, 79:1283–1287.
Levi F, Pasche C, Lucchini F et al. (2000) Food groups and oesophageal cancerrisk in Vaud, Switzerland. European Journal of Cancer Prevention, 9:257–263.
Li JY, Ershow AG, Chen ZJ et al. (1989) A case-control study of cancer of theesophagus and gastric cardia in Linxian. International Journal of Cancer,43:755–761.
Liu S, Lee IM, Ajani U, Cole SR, Buring JE, Manson JE (2001) Intake of veg-etables rich in carotenoids and risk of coronary heart disease in men: ThePhysicians’ Health study. International Journal of Epidemiology, 30:130–135.
Liu S, Manson JE, Lee IM et al. (2000) Fruit and vegetable intake and risk ofcardiovascular disease: the Women’s Health study. American Journal of Clin-ical Nutrition, 72:922–928.
Lonn EM, Yusuf S (1999) Evidence-based cardiology: emerging approaches inpreventing cardiovascular disease. British Medical Journal, 318:1337–1341.
Macquart-Moulin G, Riboli E, Cornee J, Charnay B, Berthezene P, Day N (1986)Case-control study on colorectal cancer and diet in Marseilles. InternationalJournal of Cancer, 38:183–191.
Malaveille C, Hautefeuille A, Pignatelli B, Talaska G, Vineis P, Bartsch H (1996)Dietary phenolics as anti-mutagens and inhibitors of tobacco-related DNAadduction in the urothelium of smokers. Carcinogenesis, 17:2193–200.
Mann JI, Appleby PN, Key TJ, Thorogood M (1997) Dietary determinants ofischemic heart disease in health conscious individuals. Heart, 78:450–455.
Marshall JR, Chen Z (1999) Diet and health risk: risk patterns and disease-specific associations. American Journal of Clinical Nutrition, 69:S1351–1356.
718 Comparative Quantification of Health Risks
Mathers C, Vos T, Stevenson C (1999) The burden of disease and injury in Aus-tralia. Australian Institute of Health and Welfare, Canberra.
Maynard M, Gunnell D, Emmett P, Frankel S, Davey Smith G (2003) Fruit, veg-etables, and antioxidants in childhood and risk of adult cancer: the Boyd Orrcohort. Journal of Epidemiology and Community Health, 57:218–225.
Mayne ST, Janerich DT, Greenwald P et al. (1994) Dietary beta-carotene andlung cancer risk in U.S. nonsmokers. Journal of the National Cancer Insti-tute, 86:33–38.
Memik F, Nak SG, Gulten M, Ozturk M (1992) Gastric carcinoma in north-western Turkey: epidemiologic characteristics. Journal of EnvironmentalPathology, Toxicology and Oncology, 11:335–338.
Menotti A, Kromhout D, Blackburn H, Fidanza F, Buzina R, Nissinen A (1999)Food intake patterns and 25-year mortality from coronary heart disease: crosscultural correlations from the Seven Countries study. The Seven Countriesstudy research group. European Journal of Epidemiology, 15:507–515.
Mensink G, Hermann-Kunz E, Thamm M (1998) Der Ernährungssurvey. DasGesundheitswesen, 60:S83–86.
Messina MJ (1999) Legumes and soybeans: overview of their nutritional profilesand health effects. American Journal of Clinical Nutrition, 70:S439–450.
Mettlin C (1989) Milk drinking, other beverage habits, and lung cancer risk.International Journal of Cancer, 43:608–612.
Meyer F, White E (1993) Alcohol and nutrients in relation to colon cancer inmiddle-aged adults. American Journal of Epidemiology, 138:225–236.
Michaud DS, Feskanich D, Rimm ED et al. (2000) Intake of specific carotenoidsand risk of lung cancer in 2 prospective US cohorts. American Journal of Clin-ical Nutrition, 72:990–997.
Michels KB, Giovannucci E, Joshipura KJ et al. (2000) Prospective study of fruitand vegetable consumption and incidence of colon and rectal cancers. Journalof the National Cancer Institute, 92:1740–1752.
Michels KB, Giovannucci E, Joshipura KJ et al. (2002). Fruit and vegetable con-sumption and colorectal cancer incidence. IARC Scientific Publications,156:139–140.
Ministry of Health and Welfare (2000) Annual report of the national nutritionsurvey in 1998. Daiichi Publishing Co, Tokyo.
Morris JN, Marr JW, Clayton DG (1977) Diet and heart: a postscript. BritishMedical Journal, 2:1307–1314.
Muir C, McKinney PA (1992) Cancer of the oesophagus: a global overview.European Journal of Cancer Prevention, 1:259–264.
Mulder I, Jansen MC, Smit HA et al. (2000) Role of smoking and diet in thecross-cultural variation in lung cancer mortality: the Seven Countries study.Seven Countries study research group. International Journal of Cancer, 88:665–671.
Munoz N, Plummer M, Vivas J et al. (2001) A case-control study of gastriccancer in Venezuela. International Journal of Cancer, 93:417–423.
Karen Lock et al. 719
Munoz SE, Ferraroni M, La Vecchia C, Decarli A (1997) Gastric cancer riskfactors in subjects with family history. Cancer Epidemiology, Biomarkers andPrevention, 6:137–140.
National Institute of Public Health (1997) Determinants of the burden of diseasein the EU. National Institute of Public Health, Stockholm.
Nayar D, Kapil U, Joshi YK et al. (2000) Nutritional risk factors in esophagealcancer. Journal of the Association of Physicians in India, 48:781–787.
Negri E, Franceschi S, Parpinel M, La Vecchia C (1998) Fiber intake and risk ofcolorectal cancer. Cancer Epidemiology, Biomarkers and Prevention, 7:667–671.
Negri E, La Vecchia C, Franceschi S, D’Avanzo B, Parazzini F (1991) Vegetableand fruit consumption and cancer risk. International Journal of Cancer,48:350–354.
Nelson M, Bingham S (1997) Assessment of food consumption and nutrientintake. In: Design concepts in nutritional epidemiology. Margetts BM, NelsonM, eds. Oxford University Press, Oxford.
Ness A (2001) Commentary: beyond beta-carotene-antioxidants and cardiovas-cular disease. International Journal of Epidemiology, 30:143–144.
Ness A (2002) Is olive oil a key ingredient in the Mediterranean recipe for health?International Journal of Epidemiology. 31:481–482.
Ness A, Egger M, Davey Smith G (1999a) Role of antioxidant vitamins in pre-vention of cardiovascular diseases. Meta-analysis seems to exclude benefit ofvitamin C supplementation. British Medical Journal, 319:577.
Ness A, Egger M, Powles J (1999b) Fruit and vegetables and ischaemic heartdisease: systematic review or misleading meta-analysis? European Journal ofClinical Nutrition, 53:900–902.
Ness AR, Powles JW (1997) Fruit and vegetables, and cardiovascular disease: areview. International Journal of Epidemiology, 26:1–13.
Ness AR, Powles JW (1999) The role of diet, fruit and vegetables and antioxi-dants in the aetiology of stroke. Journal of Cardiovascular Risk, 6:229–234.
Nomura AM, Grove JS, Stemmermann GN, Severson RK (1990) A prospectivecohort study on stomach cancer and its relation to diet, cigarettes and alcoholconsumption. Cancer Research, 50:627–631.
Norat T, Van Bakel M, Riboli E (2001) Fruit and vegetable consumption andrisk of cancer of the digestive tract: meta-analysis of published case controland cohort studies. European Conference on Diet and Cancer. Lyon.
Notani PN, Jayant K (1987) Role of diet in upper aerodigestive tract cancers.Nutrition and Cancer, 10:103–113.
Nyberg F, Agrenius V, Svartengren K, Svensson C, Pershagen G (1998) Dietaryfactors and risk of lung cancer in never-smokers. International Journal ofCancer, 78:430–436.
Obarzanek E, Sacks FM, Vollmer VM et al. (2001) Effects on blood lipids of ablood pressure-lowering diet: the Dietary Approaches to Stop Hypertension(DASH) trial. American Journal of Clinical Nutrition, 74:80–89.
720 Comparative Quantification of Health Risks

Ocke M, Bueno-de-Mesquita HB, Feskens EJ, Kromhout D, Menotti A, Black-burn H (1998) Adherence to the European Code Against Cancer in relationto long-term cancer mortality: intercohort comparisons from the Seven Coun-tries study. Nutrition and Cancer, 30:14–20.
Ocke M, Bueno-de-Mesquita HB, Feskens EJ, van Staveren WA, Kromhout D(1997) Repeated measurements of vegetables, fruits, beta-carotene, and vita-mins C and E in relation to lung cancer. The Zutphen study. American Journalof Epidemiology, 145:358–365.
Oganesian A, Hendricks JD, Pereira CB, Orner GA, Bailey GS, Williams DE(1999) Potency of dietary indol-3-carbinol as a promoter of aflatoxin B1-initiated hepatocarcinogenesis: results from a 9000 animal tumor study. Carcinogenesis, 20:453–458.
Omenn G, Goodman GE, Thornquist MD et al. (1996a) Risk factors for lungcancer and for intervention effects in CARET, the Beta-Carotene and RetinolEfficacy Trial. Journal of the National Cancer Institute, 88:1550–1559.
Omenn GS, Goodman G, Thornquist MD et al. (1996b) Effects of a combina-tion of beta-carotene and vitamin A on lung and cardiovascular disease. NewEngland Journal of Medicine, 334:1150–1155.
Paganini-Hill GM, Ross RK, Gray GE, Henderson BE (1987) Vitamin A, beta-carotene and risk of cancer: a prospective study. Journal of the NationalCancer Institute, 79:443–448.
Pandey DK, Shekelle R, Selwyn BJ, Tangney C, Stamler J (1995) Dietary vitaminC and beta-carotene and risk of death in middle-aged men. The Western Elec-tric study. American Journal of Epidemiology, 142:1269–1278.
Pawlega J, Rachtan J, Dyba T (1997) Evaluation of certain risk factors for lungcancer in Cracow (Poland)-a case-control study. Acta Oncologica, 36:471–476.
Peters RK, Pike MC, Garabrant D, Mack TM (1992) Diet and colon cancer inLos Angeles County, California. Cancer Causes and Control, 3:457–473.
Petrova S, Angelova K, Ivanova L et al. (2000) National dietary and nutritionalstatus survey of the population in Bulgaria, 1998. Food consumption.Hygiene and Public Health, XLIII:55–62.
Phillips RL, Snowdon DN (1985) Dietary relationships with fatal colorectalcancer among Seventh-Day Adventists. Journal of the National Cancer Institute, 74:307–317.
Pietinen P, Malila N, Virtene M et al. (1999) Diet and risk of colorectal cancerin a cohort of Finnish men. Cancer Causes and Control, 10:387–396.
Pietinen P, Rimm EB, Korhonen P et al. (1996) Intake of dietary fiber and riskof coronary heart disease in a cohort of Finnish men. The Alpha-Tocopherol,Beta-Carotene Cancer Prevention study. Circulation, 94:2720–2727.
Pillow PC, Hursting SD, Duphorne CM et al. (1997) Case-control assessment ofdiet and lung cancer risk in African Americans and Mexican Americans.Nutrition and Cancer, 29:169–173.
Karen Lock et al. 721
Pisani P, Berrino F, Macaluso M, Pastorino U, Crosignani P, Baldasseroni A(1986) Carrots, green vegetables and lung cancer: a case-control study. Inter-national Journal of Epidemiology, 15:463–468.
Potter JD (1996) Nutrition and colorectal cancer. Cancer Causes and Control,7:127–146.
Powles JW, Day NE, Sanz MA, Bingham SA (1996) Protective foods in winterand spring: a key to lower vascular mortality? The Lancet, 348:898–899.
Price JE, Fowkes FG (1997) Antioxidant vitamins in the prevention of cardio-vascular disease. The epidemiological evidence. European Heart Journal,18:719–727.
Puska P (2000) Nutrition and mortality: the Finnish experience. Acta Cardio-logica, 55:213–220.
Rachtan J, Sokolowski A (1997) Risk factors for lung cancer among women inPoland. Lung Cancer, 18:137–145.
Ramon JM, Serra L, Cerdo C, Oromi J (1993) Dietary factors and gastric cancerrisk. A case control study in Spain. Cancer, 71:1731–1735.
Rehm J, Monteiro M, Room R et al. (2001) Steps towards constructing a globalcomparative risk analysis for alcohol consumption: determining indicatorsand empirical weights for patterns of drinking, deciding about theoreticalminimum, and dealing with different consequences. European AddictionResearch, 7:138–147.
Rexrode KM, Manson JE (1996) Antioxidants and coronary heart disease: obser-vational studies. Journal of Cardiovascular Risk, 3:363–367.
Rimm EB, Ascherio A, Giovannucci E, Speigelman D, Stampfer MJ, Willett WC(1996) Vegetable, fruit, and cereal fiber intake and risk of coronary heartdisease among men. Journal of the American Medical Association, 275:447–451.
Rinzler SH (1968) Primary prevention of coronary heart disease by diet. Bulletinof the New York Academy of Medicine, 44:936–949.
Risch HA, Jain M, Choi NW et al. (1985) Dietary factors and the incidence ofcancer of the stomach. American Journal of Epidemiology, 122:947–959.
Rivera Dommarco J, Shamah Levy T, Villalpando Hernándes S, González deCosío T, Hernández Prado B, Sepúlveda J, eds. (2001b) Encuesta nacional denutrición 1999. Estado nutricio de niños y mujeres en México. [Nationalnutrition survey 1999. Nutritional status of women and children in Mexico.]Instituto Nacional de Salud Pública National Institute of Public Health, Cuer-navaca, Mexico.
Ross RK, Yuan JM, Henderson BE, Park J, Gao YT, Yu MC (1997) Prospectiveevaluation of dietary and other predictors of fatal stroke in Shanghai, China.Circulation, 96:50–55.
Sankaranarayanan R, Varghese C, Duffy SW, Padmakumary G, Day NE, NairMK (1994) A case-control study of diet and lung cancer in Kerala, southIndia. International Journal of Cancer, 58:644–649.
722 Comparative Quantification of Health Risks

Sargeant LA, Khaw KT, Bingham S et al. (2001) Fruit and vegetable intake andpopulation glycosylated haemoglobin levels: the EPIC-Norfolk study. Euro-pean Journal of Clinical Nutrition, 55:342–348.
Sawaya WN, al-Awadi FA, Saeed T et al. (1999) Kuwait’s total diet study, dietaryintake of organochlorine, carbamate, benzimidazole and pheylurea pesticideresidues. Journal of AOAC International, 82:1458–1465.
Schut HA, Cummings DA, Smale MH, Josyula S, Friesen MD (1997) DNAadducts of heterocyclic amines: formation removal and inhibition by dietarycomponents. Mutation Research, 376:185–194.
Sekula W, Becker W, Trichopoulou A, Zajkas G (1991) Comparison of dietarydata from different sources: some examples. In: Food and health data. Theiruse in nutrition policy-making. Becker W, Helsing E, eds. (European Series No. 34.) WHO Regional Publications, World Health Organization,Copenhagen.
Sengupta A, Das S (1999) The anti-carcinogenic role of lycopene, abundantlypresent in tomatoes. European Journal of Cancer Prevention, 8:325–330.
Shannon J, White E, Shattuck AL, Potter JD (1996) Relationship of food groupsand water intake to colon cancer risk. Cancer Epidemiology, Biomarkers andPrevention, 5:495–502.
Shibata A, Paganini-Hill A, Ross RK, Henderson BE (1992) Intake of vegeta-bles, fruits, beta-carotene, vitamin C and vitamin supplements and cancerincidence among the elderly: a prospective study. British Journal of Cancer,66:673–680.
Singh RB, Niaz MA, Gosh S, Singh R, Rastogi SS (1993a) Effect on mortalityand reinfaction of adding fruits and vegetables to a prudent diet in the Indianexperiment of infarct survival (IEIS). Journal of the American College ofNutrition, 12:255–261.
Singh RB, Rastogi SS, Singh NK, Ghosh S, Gupta S, Niaz MA (1993b) Can guavafruit decrease blood pressure and blood lipids? Journal of Human Hyperten-sion, 7:33–38.
Singh RR, Rastogi SS, Verma R et al. (1992) Randomised controlled trial of car-dioprotective diet in patients with recent acute myocardial infarction: resultsof one year follow up. British Medical Journal, 304:1015–1019.
Singh SV, Mohan RR, Agarwal R et al. (1996) Novel anti-carcinogenic activityof an organosulfide from garlic: inhibition of H-RAS oncogene transformedtumor growth in vivo by diallyl disulfide is associated with inhibition ofp21H-ras processing. Biochemical Biophysical Research Communications,225:660–665.
Slattery ML, Potter JD, Coates A et al. (1997) Plant foods and colon cancer: anassessment of specific foods and their related nutrients (United States). CancerCauses and Control, 8:575–590.
Slattery ML, Schumacher MC, Smith KR, West DW, Abd-Elghany N (1988)Physical activity, diet, and risk of colon cancer in Utah. American Journal ofEpidemiology, 128:989–999.
Karen Lock et al. 723
Smit HA, Grievink L, Tabak C (1999) Dietary influences on chronic obstructivelung disease and asthma: a review of the epidemiological evidence. Proceed-ings of the Nutrition Society, 58:309–319.
Smith-Warner SA, Elmer PJ, Fosdick L, Tharp TM, Randall B (1997) Reliabil-ity and comparability of three dietary assessment methods for estimating fruitand vegetable intakes. Epidemiology, 8:196–201.
Speizer FE, Colditz GA, Hunter DJ, Rosner B, Hennekens C (1999) Prospectivestudy of smoking, antioxidant intake and lung cancer in middle-aged women.Cancer Causes and Control, 10:475–482.
Steinmetz KA, Kushi LH, Bostick RM, Folsom AR, Potter JD (1994) Vegetables,fruits, and colon cancer in the Iowa women’s health study. American Journalof Epidemiology, 139:1–15.
Steinmetz KA, Potter JD (1993) Food-group consumption and colon cancer inthe Adelaide Case-Control study. I. Vegetables and fruit. International Journalof Cancer, 53:711–719.
Steinmetz KA, Potter JD (1996) Vegetables, fruit, and cancer prevention: areview. Journal of the American Dietetic Association, 96:1027–1039.
Steinmetz KA, Potter JD, Folsom AR (1993) Vegetables, fruit, and lung cancerin the Iowa Women’s Health study. Cancer Research, 53:536–543.
Suzuki I, Hamada GS, Zamboni MM, de Biasi Cordeiro P, Watanabe S, TsuganeS (1994) Risk factors for lung cancer in Rio de Janeiro, Brazil: a case-controlstudy. Lung Cancer, 11:179–190.
Swanson CA, Mao BL, Li JY et al. (1992) Dietary determinants of lung cancerrisk: results from a case-control study in Yunnan Province, China. Interna-tional Journal of Cancer, 50:876–880.
Tajima K, Tominaga S (1985) Dietary habits and gastro-intestinal cancers: a com-parative case-control study of stomach and large intestinal cancers in Nagoya,Japan. Japanese Journal of Cancer Research, 76:705–716.
Takezaki T, Hirose K, Inoue M et al. (2001) Dietary factors and lung cancer riskin Japanese: with special reference to fish consumption and adenocarcinomas.British Journal of Cancer, 84:1199–1206.
Takezaki T, Shinoda M, Hatooka et al. (2000) Subsite-specific risk factors forhypopharyngeal and esophageal cancer (Japan). Cancer Causes and Control,11:597-608.
Tavani A, Negri E, Francesch, La Vecchia C (1993) Risk factors for esophagealcancer in women in northern Italy. Cancer, 72:2531–2536.
Tavani A, Negri E, Franceschi S, La Vecchia C (1994) Risk factors for esopha-geal cancer in lifelong nonsmokers. Cancer Epidemiology, Biomarkers andPrevention, 3:387–392.
Tavani A, Negri E, Franceschi S, La Vecchia C (1996a) Tobacco and other riskfactors for oesophageal cancer in alcohol non-drinkers. European Journal ofCancer Prevention, 5:313–318.
Tavani A, Negri E, La Vecchia C (1996b) Food and nutrient intake and risk ofcataract. Annals of Epidemiology, 6:41–46.
724 Comparative Quantification of Health Risks

Taylor CA, Hampl JS, Johnston CS (2000) Low intakes of vegetables and fruits,especially citrus fruits, lead to inadequate vitamin C intakes among adults.European Journal of Clinical Nutrition, 54:573–578.
Terry P, Giovanucci E, Michels KB et al. (2001) Fruit, vegetables, dietary fiber,and risk of colorectal cancer. Journal of the National Cancer Institute,93:525–533.
Terry P, Nyren, O, Yuen J (1998) Protective effect of fruit and vegetables onstomach cancer in a cohort of Swedish twins. International Journal of Cancer,76:35–37.
Thompson FE, Moler JE, Freedman LS, Cliffors CK, Stables GJ, Willet WC(1997) Register of dietary assessment calibration-validation studies: a statusreport. American Journal of Clinical Nutrition, 65:S1142–1147.
Thun MJ, Calle EE, Namboodiri MM et al. (1992) Risk factors for fatal coloncancer in a large prospective study. Journal of the National Cancer Institute,84:1491–1500.
Tobias M (2001) The burden of disease and injury in New Zealand. NewZealand Ministry of Health, Wellington.
Todd S, Woodward M, Tunstall-Pedoe H, Bolton-Smith C (1999) Dietary antiox-idant vitamins and fiber in the etiology of cardiovascular disease and all-causes mortality: results of the Scottish Heart Health study. American Journalof Epidemiology, 150:1073–1080.
Trichopoulos D, Ouranos G, Day N et al. (1985) Diet and cancer of the stomach:a case-control study in Greece. International Journal of Cancer, 36:291–297.
Turrini A, Saba A, Perrone D, Cialfa E, D’Amicis A (2001) Food consumptionpatterns in Italy: the INN-CA study 1994–1996. European Journal of Clini-cal Nutrition, 55:571–588.
Tuyns AJ, Kaaks R, Haelterman M (1988) Colorectal cancer and the consump-tion of foods: a case-control study in Belgium. Nutrition and Cancer,11:189–204.
Tuyns AJ, Kaaks R, Haelterman M, Riboli E (1992) Diet and gastric cancer. Acase-control study in Belgium. International Journal of Cancer, 51:1–6.
Tuyns AJ, Riboli E, Doornbos G, Pequignot G (1987) Diet and esophageal cancerin Calvados (France). Nutrition and Cancer, 9:81–92.
van Poppel G, Goldbohm RA (1995) Epidemiologic evidence for beta-caroteneand cancer prevention. American Journal of Clinical Nutrition, 62:S1393–1402.
van Poppel G, Verhoeven DT, Verhagen H, Goldbohm RA (1999) Brassica veg-etables and cancer prevention. Epidemiology and mechanisms. Advances inExperimental Medicine and Biology, 472:159–168.
Verhagen H, Poulson HE, Loft S, van Poppel G, Willems MI, van Bladeren PJ(1995) Reduction of oxidative DNA damage in humans by brussel sprouts.Carcinogenesis, 16:969–970.
Victora CG, Munoz N, Day NE, Barcelos LB, Peccin DA, Braga NM (1987) Hotbeverages and oesophageal cancer in southern Brazil: a case-control study.International Journal of Cancer, 39:710–716.
Karen Lock et al. 725
Volatier J (1999) Enquête individuelle et nationale sur les consummations ali-mentaires. Editions TEC et DOC, Paris.
Vollset SE, Bjelke E (1983) Does consumption of fruit and vegetables protectagainst stroke? The Lancet, 2:742.
Voorrips LE, Goldbohm RA, van Poppel G, Sturmans F, Hermus RJ, van denBrandt PA (2000a) Vegetable and fruit consumption and risks of colon andrectal cancer in a prospective cohort study: the Netherlands Cohort Study ondiet and cancer. American Journal of Epidemiology, 152:1081–1092.
Voorrips LE, Goldbohm RA, Verhoeven DT et al. (2000b) Vegetable and fruitconsumption and lung cancer risk in the Netherlands Cohort study on dietand cancer. Cancer Causes and Control, 11:101–115.
Walker A, Adam F, Walker J, Walker BF (2002) Cancer of the oesophagus inAfricans in sub-Saharan Africa: any hopes for its control? European Journalof Cancer Prevention, 11:413–418.
Wang LD, Hammond EC (1985) Lung cancer, fruit, green salad and vitamin pills.Chinese Medical Journal, 98:206–210.
Wang YP, Han XY, Su W et al. (1992) Esophageal cancer in Shanxi Province,People’s Republic of China: a case-control study in high and moderate riskareas. Cancer Causes and Control, 3:107–113.
Ward MH, Lopez-Carrillo L (1999) Dietary factors and the risk of gastric cancerin Mexico. American Journal of Epidemiology, 149:925–932.
Watkins ML, Erickson JD, Thun MJ, Mulinare J, Heath CW Jr (2000) Multivi-tamin use and mortality in a large prospective study. American Journal ofEpidemiology, 152:149–162.
Weinberg RA (1996) How cancer arises. Scientific American, 275:62–70.
West DW, Slattery, ML, Robinson, LM et al. (1989) Dietary intake and coloncancer: sex- and anatomic site-specific associations. American Journal of Epidemiology, 130:883–894.
Willett W (1998a) Nature of variation in diet. In: Nutritional epidemiology.Willett W, ed. Oxford University Press, Oxford.
Willett W, ed. (1998b) Nutritional epidemiology. Oxford University Press,Oxford.
Willett W (2001) Commentary: dietary diaries versus food frequency question-naires—a case of undigestible data. International Journal of Epidemiology,30:317–319.
Wiseman M (2002) The World Cancer Research Fund Expert Report: the nextsteps. IARC Scientific Publications, 156:523–524.
Witztum JL (1994) The oxidation hypothesis of atherosclerosis. The Lancet,344:793–795.
World Bank (2000) Classification of economies. World Bank, Washington DC.Available at http://www.worldbank.org/data/databytopic/class.htm#Low_income.
726 Comparative Quantification of Health Risks

World Cancer Research Fund, American Institute for Cancer Research (1997)Food, nutrition and the prevention of cancer: a global perspective. AmericanInstitute for Cancer Research, Washington.
WHO (1985) Energy and protein requirements. (Technical Report Series No.724). World Health Organization, Geneva.
WHO (1990) Diet, nutrition and the prevention of chronic diseases. (TechnicalReport Series No. 797). World Health Organization, Geneva.
WHO (2000) World health report 2000. Health Systems: Improving perfor-mance. World Health Organization, Geneva.
Wu K, Helzlsouer KJ, Alberg AJ, Comstock GW, Norkus EP, Hoffman SC (2000)A prospective study of plasma ascorbic acid concentrations and breast cancer(United States). Cancer Causes and Control, 11:279–283.
Wu-Williams AH, Dai XD, Blot W et al. (1990) Lung cancer among women innorth-east China. British Journal of Cancer, 62:982–987.
Yochum LA, Folsom AR, Kushi LH (2000) Intake of antioxidant vitamins andrisk of death from stroke in postmenopausal women. American Journal ofClinical Nutrition, 72:476–483.
Yochum L, Kushi, LH, Meyer K, Folsom AR (1999) Dietary flavonoid intakeand risk of cardiovascular disease in postmenopausal women. AmericanJournal of Epidemiology, 149:943–949.
Yokoyama T, Date C, Kokubo Y, Yoshiike N, Matsumura Y, Tanaka H (2000)Serum vitamin C concentration was inversely associated with subsequent 20-year incidence of stroke in a Japanese rural community. The Shibata study.Stroke, 31:2287–2294.
Yong LC, Brown CC, Schatzkin A et al. (1997) Intake of vitamins E, C and Aand risk of lung cancer. The NHANES I epidemiologic follow-up study. FirstNational Health and Nutrition Examination Survey. American Journal of Epidemiology, 146:231–243.
You WC, Blot WJ, Chang YS et al. (1988) Diet and high risk of stomach cancerin Shandong, China. Cancer Research, 48:3518–3523.
Young TB, Wolf DA (1988) Case-control study of proximal and distal coloncancer and diet in Wisconsin. International Journal of Cancer, 42:167–175.
Yu MC, Garabrant DH, Peters JM, Mack TM (1988) Tobacco, alcohol, diet, occupation, and carcinoma of the esophagus. Cancer Research, 48:3843–3848.
Yu Y, Taylor PR, Li JY et al. (1993) Retrospective cohort study of risk-factorsfor esophageal cancer in Linxian, People’s Republic of China. Cancer Causesand Control, 4:195–202.
Zaridze D, Filipchenko V, Kustov V, Serdyuk V, Duffy S (1992) Diet and col-orectal cancer: results of two case-control studies in Russia. European Journalof Cancer, 29A:112–115.
Zatonski WA, McMichael AJ, Powles JW (1998) Ecological study of reasons forsharp decline in mortality from ischaemic heart disease in Poland since 1991.British Medical Journal, 316:1047–1051.
Karen Lock et al. 727

Zheng W, Sellers TA, Doyle TJ, Kushi LH, Potter JD, Folsom AR (1995) Retinol, antioxidant vitamins, and cancers of the upper digestive tract in aprospective cohort study of postmenopausal women. American Journal ofEpidemiology, 142:955–960.
Ziegler RG, Colavito EA, Hartge P et al. (1996a) Importance of alpha-carotene,beta-carotene, and other phytochemicals in the etiology of lung cancer.Journal of the National Cancer Institute, 88:612–615.
Ziegler RG, Mason TJ, Stemhagen, A et al. (1986) Carotenoid intake, vegeta-bles, and the risk of lung cancer among white men in New Jersey. AmericanJournal of Epidemiology, 123:1080–1093.
Ziegler RG, Mayne ST, Swanson CA (1996b) Nutrition and lung cancer. CancerCauses and Control, 7:157–177.
728 Comparative Quantification of Health Risks


