
CHAPTER-VI
EMPLOYMENT AND POVERTY IN THE STATE
6.1 Introduction
Economic access to food depends on the purchasing power of the household,
which in turn depends on the regular employment. Hence employment security is
essential pre-requisite for gaining food security at the household level. Mere
availability of foodgrains will have little relevance, if people do not possess
purchasing power to buy them for their consumption. Given the predominance of the
agricultural sector in the State's economy both in terms of its contribution to the
State Domestic Product and more so in terms of employment, it will be necessary to
look in to the nexus between employment and food security. The structure of
employment in the State is largely unorganized basically rural and non-industrial in
nature. Female work participation rates are quite high, highest among the major
states and Andhra Pradesh has the highest incidence of child labour and state has
the highest proportion of agricultural labour households in the country next only to
Tamilnadu (Parthasarathy, 1995) in such situation changes in the economy will have
impact on the employment growth and wages, which in turn influences the food
security at household level. Poverty has been identified not merely with inequality
but also with unemployment (Raj Krishna, 1973). We shall raise the following issues:
Nature of the employment problem in the State? How far does economic growth lead
to a reduction in poverty and increase in employment? . This chapter tries to analyse
the changes in the employment and poverty over the years using the NSSO data.
6.2 Changing structure of employment
The estimates of employment and unemployment by NSSO are derived on
three concepts, usual status, current weekly status and current daily status. These
three concepts are based on the reference periods for ascertaining the activity status
of an individual and therefore manifest it in different form of economic significance.
Under the usual status concept the reference period is one year and the activity
status of a person as employed, unemployed or out of labour force is determined on
the basis of activity pursued by him for the major part of the year. It indicates a
sustained position of the persons involved. On the current weekly status criterion, a
person is considered as employed or unemployed if he has worked even for one hour
156

during the week. Under the current daily status, the unit of classification is half day.
The work participation rates in urban and rural Andhra Pradesh increased in 1993-94
before declining significantly in 1999-2000 (Table-6.1).
Table-6.1: Work participation rates in Andhra Pradesh
Year Rural Urban
1983 53.5 34.8 1987-88 53.3 35.8 1993-94 57.6 37.6 1999-2000 54.2 34.8
Source: NSSO rounds on Employment and Unemployment.
Work participation rates (WPR) indicate the density of workers and higher WPRs are
taken as indicators of lower development states. We find that WPR in rural Andhra
Pradesh is higher and that was quite an expected result. But most intriguing aspect
is the marginal changes in WPR for over the period of almost two decades. One
naturally tends to question if there was any significant employment growth in the
state. As can be seen from table-6.2, employment growth in rural as well as urban
areas has declined. In rural Andhra Pradesh it declined from 2.4 percent per annum
during 1983 to 1993-94 to 0.29 percent during 1993-94 to 1999-2000.The
corresponding numbers for the urban sector are 4.3 percent and 0.01 percent. The
employment growth in the State during 1993-94 to 1999-00 was 0.35 percent per
annum (Rural and Urban together). It has declined sharply in the case of females
when compared with males and that is not in tune with the overall observation at
country level.
Table-6.2: Employment growth in Andhra Pradesh (Percent per annum)
Sector 1983 to 1993-94 to 1993-94 1999-2000
Rural 2.4 0.29 Male 1.7 1.30 Female 2.5 0.10 Urban 4.3 0.01 Male 3.5 2.40 Female 4.2 1.60
th ,m tn Source. Computed based on 38 ,50 and 55 NSSO data on Employment Situation in India.
The reasons for the decline in employment growth in the 1990's could be due
to (i) decline in the labour force growth itself (ii) preferred formal employment
inevitably declined with the cutback in public sector jobs. This meant a greater
growth in informal employment and this trend may probably continue (iii) a decline
157

in the participation rates among the younger age groups (iv) a sharp deceleration in
the growth rate of agriculture in general and crop production in particular has led to
the decline in rural employment and capitalization of agriculture (Mahendra Dev,
2003). The changes in the employment could be observed through employment
elasticities. The employment elasticity in the 1990's reflects the fact that although
economic growth in terms of State Domestic Product (SOP) is taking place could not
influence employment growth. In other words the growth was not employment
oriented. Employment elasticity in agriculture is negative during 1993-94 to 1999-
2000 i.e., -0.13. A number of factors, contributed to this negative declining elasticity.
First, area under high yielding varieties has come to a saturation point and therefore,
possibly a technology optima is reached. Secondly, the rate of growth of irrigation
has also declined arresting in increase in demand for labour in these regions. Thirdly,
there has been a shift away from labour intensive crops like rice to social forestry
and fish culture that require not as many labour. Fourth, casualties of urban work
force also changed the composition of work force with more casual migration
workers not featuring in the surveys.
Employment in the organised sector generally provides higher levels of wages
and job security than in the unorganized sector. In the State, 20.7 lakh workers are
in the organised sector in 199-2000, but in the same year there are approximately
387.5 lakh total workers in the State, it clearly shows that a small fraction of the
work force is in the organised sector. Employment in the organized sector increased
from 14.46 lakhs in 1980-81 to 20.7 lakhs in 1999-2000 (Table-6.3) but the growth
rate of employment in the organised sector during 1995-95 and 1999-2000 is lower
compared to the earlier period. This may be due to slowdown in public sector
employment in the 1990's. Public sector accounts for the nearly 80 percent of the
organised employment in the state. Out of the total employment of 20.70 lakhs in
the organised sector Public sector accounted for 14.9 lakhs and the remaining 5.8
lakh were employed in Private sector.
Table-6.3: Employment in organized sector
Year Employment Year Growth rate (in lakhs)
1980-81 14.46 1980-81 to 1985-86 2.2 1985-86 16.11 1985-86 to 1990-91 1.8 1990-95 17.62 1990-91 to 1995-96 1.9 1995-96 19.40 1995-96 to 1999-2000 1.6
1999-2000 20.70 Source: Various Issues of Economic SUivey, government. Of Andhra Pradesh
158

A high percentage of non-agricultural workers is a sign of economic growth
since non-agricultural work is normally more paying than agricultural work. Presently
agriculture in the state has to bear the burden of 65 to 70 percent workers, which
led to low labour productivity in agriculture. As a result, rural non-farm sector
becomes an important absorbent for agricultural workers. Tables note of these
trends and in order to increase wages in agriculture and to shift the workers to more
productive areas, rural diversification is advocated (Mahendra Dev, 2003). The
percentage of non-agricultural workers to total workers is 24.8 percent in Andhra
Pradesh. This indicates the diversification has been much slower in Andhra Pradesh.
The proportion of workers in primary sector in rural Andhra Pradesh was 79.7
percent in 1983 and that of 1999-2000 was 78.8 percent and that in the secondary
sector in rural Andhra Pradesh was 9.8 percent in 1983 and 8.6 percent in 1999-
2000. In 1983, the tertiary sector's share in work force was 11.9 and 12.6 in 1999-
2000 (NSS rounds). These trends indicate the possibility of increase in employment
only in service sector.
Non-farm employment in Andhra Pradesh increased from 17.6 percent in
1977-78 to 22.8 percent in 1983 but subsequently it declined during 1993-94 to
record a slight improvement in 1999-2000. Male employment increased almost
steadily but female employment has declined sharply after 1983.
Table-6.4: Non-farm employment in rural Andhra Pradesh (In percentaqe)
Year Male Female Total 1977-78 19.7 14.6 17.6 1983 25.6 18.7 22.8 1987-88 25.9 17.9 22.4 1993-94 24.4 16.3 20.7 1999-2000 . 25.6 15.7 21.2
Source: NSSO rounds on Employment and Unemployment.
These trends could be due to the poor backward and forward linkages of
agriculture with service and manufacturing sectors. High rates of agricultural growth
should lead to increase in per capita income for the mass of people in rural areas and
consequently through changes in consumption pattern which increases the share of
non-agricultural products, trade and service sector in rural areas. This is feasible, if
there is a shift in investment in backward areas in which current yields are low and
under employment rates are high. Slowing down of non-agricultural employment is
also confirmed by the census data (Table-6.5).
159

Table-6.S: Non-agricultural workers in Andhra Pradesh .. . . -~ .
(In million) -- .. - -_.-...
Catego!L 1981 1991 Total workers 8.773 10.447 Main and marginal 24.505 29.963 workers Marginal workers 1.872 1.518 Other workers 5.832 7.974 Household industry 1.064 0.955 Non-agricultural 35.80 34.8 workers as percent of total workers Source: Statistical abstract of Andhra Pradesh 1990-91 and 2000-01
The percentage of main and marginal non-agricultural workers showed a
decline between 1981 and 1991 from 35.8 to 34.8 percent. The proportion of self
employment has been declining over time in rural Andhra Pradesh. One of the
reasons could be fragmentation of land, which led to increase in casual labour
(Table-6.6). One of the important observation in the changing of employment
structure is the emergence and increase of casualisation of work force. The
proportion of employed under self-employment are declining and similar are the
trends about regular employment. But on the contrary casual labour have
conSistently posted an increase over the years. It must be noted here that
casualisation of work force has some special significance towards food security. The
consumption data of these casual employed labourers may show sufficient
consumption during the reference period (in terms of per capita) but there may not
be consistency in their capacity to buy food.
Table-6.6: Distribution of employment by category in Andhra Pradesh (Percent)
Year Self-employed Rqular em~o.yed Casual labourers 1983 47.3 8.9 43.8
1987-88 49.0 6.8 44.2 1993-94 47.5 5.2 47.3
1999-2000 45.8 5.9 48.3 Source: Various Issues of NSSO reports
...
The percentage of casual labour increased both for males and females over the
years.
160

6.3 Trends in unemployment
NSS provides unemployment rates by usual status, current weekly status and
current daily status. Current daily status captures chronic unemployment, seasonal
unemployment and intermittent unemployment in one single measure
(Parthasarathy, 1995).
Table-6.7: Trends in daily status of unemployment
Year Rural Urban Male Female Male Female
1983 7.9 10.5 9.5 12.1 1987-88 4.9 9.4 10.1 13.2 1993-94 5.9 7.0 7.5 9.5 1999-2000 8.8 8.7 7.7 9.7
Source: Vanous rounds of NSSO reports
Rural rate of unemployment for males was 7.9 percent in 1983 and 8.8
percent in 1999-2000 (Table-6.7). In rural and urban sectors, unemployment rate
increased during 1990s. There is a sharp decline in rural unemployment in 1987-88,
despite it being a drought year, it may be due to outflow of labour from rural to
urban areas. The urban rate of unemployment for females was higher than the
males during all the years. The usual status unemployment rate by principal
occupation shows the different picture compared to daily status of unemployment.
The unemployment rates are relatively high in urban sector than rural Andhra
Pradesh. Unemployment rates among males are high compared to female (Table-
6.8). One clear observation emerges from these tables to suggest a spill over of rural
unemployed to urban areas.
Table-6.S: Usual status unemployment rates in Andhra Pradesh
Year Rural Urban Male Female Male Female
1983 1.4 0.9 5.4 5.1 1987-88 2.5 4.5 6.4 9.0 1993-94 1.0 0.5 3.5 4.3
1999-2000 1.2 0.7 4.3 4.4 Source: Vanous rounds of NSSO reports
A study on unemployment rates by CESS shows that irrigated zones record a
higher rate of unemployment both in poor and non-poor categories. Between 1983
and 1987-88 both in dry and irrigated zones, the rates of unemployment for the poor
have risen. Rural non-farm employment is crucial for poverty reduction, the Andhra
Pradesh experience in 1990s with regard to non-farm employment is declining and
the trend growth rate of real wages are declining for male and female, which in turn
effect the livelihood of the households. Our analysis clearly shows that at aggregate
161

level there is a decline in employment growth rate and increase in unemployment
rate in the State. Now we will look in to the trends at regional level within the State,
because employment rates vary from region to region.
6.4 Regional dimensions of employment
Work participation rates at regional level are available from the population
census data. Across regions North Telangana has the highest participation rate of
45.7 percent followed by Rayalaseema and South coastal Andhra (Table-6.9).
Table-6.9: Work participation rates among regions in Andhra Pradesh
Region Rural Urban Combined
1971 1981 1991 1971 1981 1991 1971 1981 1991 NCA 44.0 44.3 46.5 29.8 28.4 29.7 41.6 40.8 41.7 SCA 41.7 41.7 45.5 31.6 31.9 32.3 39.7 41.4 42.0 RAY 43.4 43.4 46.8 31.8 31.0 31.0 41.5 42.6 43.1 STE 47.1 47.1 49.1 29.1 28.4 27.6 42.0 40.9 41.2 NTE 45.5 45.5 49.8 31.3 30.5 29.7 43.6 44.8 45.7
Source: Population census, Government of India Note: Data on 2001 census was not available at the time of analysis.
North Coastal Andhra (NCA) and South Telangana (STE) exhibit low
participation rates. In all the regions rural work participation rates are higher than
the urban. The urban work participation rate remained constant around 30 percent,
rural work participation rates increased from 41.7 percent in 1971 to 49.8 percent in
1991 among the regions. While urban participation rate is highest in the highly
developed south coastal Andhra, rural participation rate is the lowest in this region.
On the other hand Telangana regions have very high participation rates of more than
49 percent in rural areas, while the corresponding rates in the urban areas are low.
Among the regions, North Telangana has high participation rate among
females (15.6) in the secondary sector, while the female participation rates in the
other four regions are below 7.5 percent. Rayalaseema region has the highest female
participation in the primary sector during 1971 and 1991. The occupational structure
of females remained more or less the same. On the other hand, occupational
structure of males has undergone significant shifts (Table-6.10).
162

Table-6.10: Sectoral distribution of workers among the regions (Percentage of total workers)
Region Primary sector Secondary sector Tertiary sector
Male Female Male Female Male Female
1971 1991 1971 1991 1971 1991 1971 1991 1971 1991 1971 1991 NCA 72.7 62.2 86.5 83.7 9.5 11.9 4.5 5.6 17.8 26.0 8.9 SCA 66.7 65.3 73.4 84.7 12.0 10.9 7.8 5.2 19.1 23.8 10.7 RAY 73.5 68.1 89.0 87.3 11.0 11.0 5.5 5.4 15.5 20.9 6.6 STE 62.7 55.6 82.7 83.1 14.4 15.4 7.5 7.6 22.8 29.0 9.8 NTE 70.6 66.1 81.1 78.9 15.2 15.3 11.8 15.6 14.1 18.4 7.1 Source: Population census, Government of India. Note: Data on 2001 census was not available at the time of analysis.
Male workers seem to be shifting away from primary sector to tertiary sector. The
shift in South Coastal Andhra is lower and highest in North Coastal Andhra and South
Telangana. The share of male workers in primary sector in North Coastal Andhra
declined from 72.6 percent to 62.2 percent and the share of tertiary sector increased
from 17.8 percent to 26.0 percent. Because of the high growth rate of female
workers and their absorption in agricultural sector, the share of non-farm activity in
total workers has not increased, though the occupational structure of males changed
significantly. While the share of non-farm workers in total male workers increased
from 31.1 percent to 34.7 in South Coastal Andhra (Table-6.11).
Table-6.11: Percentage of non-farm workers in total workers
Regions 1971 1981 1991
10,7 10.1 7.2 9.3 '5.5
Male Female Persons Male Female Persons Male Female Persons
NCA 27.3 13.5 15.7 33.6 16.4 17.9 37.9 16.3 SCA 31.1 18.5 18.2 33.2 16.4 17.1 34.7 15.3 RAY 26.5 12.1 14.3 29.4 12.6 14.4 31.9 12.6 STE 37.3 17.2 16.8 40.5 17.4 15.2 44.4 16.9 NTE 29.4 18.9 20.2 30.0 19.4 18.6 33.6 21.1
Source: Population census, Government of India.
One interesting observation from the table-6.11 is that percentage of male non-farm
workers increased in all the regions where as female non-farm workers declined in all
the regions except in North Telangana region during 1991 and in Rayalaseema it
remains to be same during 1981 and 1991. This result indicates that there is a shift
from agriculture to other allied activities like livestock, fishing etc., in this region. The
type of non-farm activities that have been growing in the state are either allied to
agriculture or related to tertiary sector rather than manufacturing sector.
Manufacturing employment in total workforce is highest in North Telangana region at
163
16.9 17.0 14.7 15.8 20.2

19 percent followed by South Telangana at 10 percent. The agriculturally prosperous
South Coastal Andhra has a very low share of manufacturing employment to total
workforce.
6.5 Changes in Wages
Growth in labour force does not necessarily mean the growth in the quality of
employment or increased wage income per household. Income or wages is one such
variable that reflects quality of employment. Many persons are employed but if they
get low wage rates and consequently income, this would result in forming a gap
between unemployment and poverty. Changes in the real wages also serve as an
indicator of changes in food security at the household level. It is quite clear that
higher the real wages higher the economic access to food.
Growth rates in real wages were low during 1990s for both men and women.
The growth rate for males declined from 5.74 percent in the 1980s to 1.53 percent in
the 1990s. Similarly for women, the rate of growth in real wages declined from 4.76
percent in the 1980s to 1.94 percent in the 1990s (Table-6.12).
Table-6.12: Nominal and real wages of field labour in Agriculture.
Year Nominal wages Real wages (1980-1981=100J
Males Females Males Females
1981 5.9 4,4 5.9 4,4 1983 8.0 6.0 6.6 4.9 1985 10,4 7.7 7.8 5.8 1987 12.0 8.9 8.4 6.2 1989 14.6 10.6 8.1 5.9 1991 19.6 14.2 9.0 6.5 1993 25.1 17.8 9.0 6.4 1995 31.1 22.2 9.3 6.6 1997 37.9 28.5 9.7 7.3 1999 43.5 32.2 9.8 7.2
Growth rates (%) 1981-90 11.64 I 9.84 5.74 4.76 1990-99 10.70 I 10.23 1.53 1.94
Source: Mahendra Dev (2003).
The declining real wage growth rates have a direct impact on food security as well as
poverty at the household. During nineties, growth rates in real wages of females
were slightly higher than the male wage rate. Datt and Ravallion (1998) found a
strong interlink age between real wage rates and rural poverty (as it was obvious).
Across regions we noted that Rayalaseema, North Coastal Andhra and Telangana
could be termed as low wage pockets. And within coastal Andhra, Prakasam district
164

is a low wage district. Whereas, all districts from Rayalaseema record low wage
rates. Within Rayalaseema region, Kurnool and Chittoor show lower wage rates than
Cuddapah and Ananthapur. Ranga Reddy district among Telangana region records
the lowest wage rate. Two observations clearly emerge from the above discussion.
First, employment growth rates in nineties are lower than those during eighties.
Second is decline in real wages for both males and females. Which invariably effect
the purchasing power of the households.
6.6 Incidence of poverty
The official poverty ratios, based on the expert group methodology, show very
low levels of rural poverty (Table-6.13) and high levels of urban poverty for Andhra
Pradesh for 1999-2000. Thus the official estimates of poverty ratio in urban areas of
Andhra Pradesh are more than double than those of rural areas. This is quite
contrary given rural-urban differences in per capita income and wages.
Table-6.13: Estimates of poverty in Andhra Pradesh
Sector 1973-74 1977-78 1983-84 1987-88 1993-94 1999-2000
Rural Expert group 48.41 38.11 26.53 20.92 15.92 11.05 (1993) Datt (1997) 56.84 47.84 37.99 34.02 28.93 Deaton and -- -- -- 35.0 29.2 26.2 Dreze (2002) Datt et al -- -- -- -- 28.9 23.8 (2002) Urban Expert group 52.56 46.46 40.13 44.63 41.51 26.63 (1993) Datt (1997) 51.02 43.53 35.63 39.98 30.82 --Deaton and -- -- -- 23.4 17.8 10.8 Dreze (2002) Combined Expert group 49.25 39.96 29.88 27.2 23.08 15.77 (1993) & Planning Commission (2002) Source: Reddy (2003).
Alternative estimates by Deaton and Dreze show that the poverty ratios for
rural Andhra Pradesh were 26 percent and 10.8 percent for rural and urban areas.
The very low level of official rural poverty ratios in Andhra Pradesh were due to its
base-year poverty line in 1973-74 being the lowest among the major states in India.
165

This in turn was due to low level of consumer price index for agricultural labour for
Andhra Pradesh. The estimates of Deaton and Dreze (2002) have constructed
poverty line on the basis of the consumer prices computed from the national sample
survey data. Official estimates of poverty in Andhra Pradesh gives a different picture.
A micro-level study on poverty profile for Srikakulam and Vizianagaram districts
conducted by the council for social development, Southern Regional office at
Hyderabad, covered 1,442 households in these two districts. It divided the poverty
households in to three categories: (a) lowest with income up to Rs.3000 per annum
and between Rs.3000 and Rs.SOOO per annum (b) middle-level with income of
Rs.S001 to Rs.7000 per annum and (c) higher level with income of Rs.7001 to
Rs.10000 per annum. The average annual requirement of foodgrains per household
should be 11.8 quintals. The average availability of foodgrains per household was
found to be 7.7 quintals. In the lower groups the average availability was 6 qUintals,
which meant that at the lower income group households were suffering from acute
hunger verging on starvation. Since the availability of foodgrains was not even
throughout the year, there were periods of severe starvation. Forty-seven percent
households did not posses any land. Around 27 percent had land less than an acre,
and most of the land is uncultivable with no source of irrigation. Thus 74 percent of
poor households did not have any land or had land but not cultivable. Survey
brought out an interesting fact that over 80 percent of landless household~. did not
receive any help from the government. The poverty studies in India were based on
nutritional adequacy, but what nutritional adequacy really means is a debatable
issue. There is a range of dietary intake that may be considered adequate among
adults depending on activity levels, climate, etc Sukhatme (1980). A question often
crops up can the nutritional adequacy method assure consistency in terms of real
expenditure? Because the relationship between food intake and income will shift
according to differences in tastes, activity levels, relative prices. These results call for
a close calculating poverty in India.
District wise incidence of rural poverty was highest in North Coastal Andhra
and the lowest in South Coastal Andhra during 1977-78 (Reddy, 1991) (Table-6.14).
Rayalaseema and Telangana recorded similar levels of poverty. All regions
show a decline in poverty, but the decrease is the lower in Rayalaseema and the
highest in South Coastal Andhra in 1987-88, the incidence of poverty was highest in
drought prone Rayalaseema during the drought year 1987-88.
166

Table-6.14: Regional distribution of incidence of rural poverty.
Region 1977-78 1987-88 Percentage Decline
North Coastal 73.81 48.73 -33.69 Andhra South Coastal 53.83 32.89 -38.86 Andhra Rayalaseema 67.59 49.37 -26.66 Telangana 66.88 44.65 -33.24
Source: Reddy (1991).
Among the districts North Coastal Andhra and Rayalaseema districts show
higher level of rural poverty compared to other regions.
Table-6.15: Percentage of persons below poverty line among the three regions
Region Rural Urban
1993-94 1999- 0/0 1993-94 1999- 0/0
2000 Change 2000 Change
Coastal Andhra 17.08 7.06 -10.02 43.46 28.05 -15.41
Telangana 13.92 9.24 -4.68 30.60 22.39 -8.21
Rayalaseema 17.01 21.20 4.19 43.77 37.61 -6.16 :th Source. Computed from NSS 50 and 55 rounds household consumer expenditure
data.
There exits no Significant variation in the incidence of poverty in rural areas
between the three regions in 1993-94, but in 1999-2000 the estimated incidence of
poverty in Rayalaseema region is about more than two times to those in Telangana
and three times to those in Coastal Andhra region (Table-6.15). The increase in
poverty levels in rural areas of Rayalaseema region could be due to consistent
drought conditions. Urban poverty declined in all three regions, however, it is noticed
that the poverty levels in urban areas are uniformly higher compared to those in
rural areas. Poverty declined at faster rate during 1980s compared to 1990s.
Among the social groups Schedule Tribes and Schedule castes are more
vulnerable to poverty and the incidence of poverty in these groups of households is
more than twice the incidence among other caste groups during 1993-94 and 1999-
2000 (Table-6.16)
167

Table-6.16: Poverty among social and occupational groups
(PercentaJle) Social Group Rural Urban
1993-94 1999-2000 1993-94 1999-2000
ST 26.87 24.45 45.61 47.12 SC 25.99 19.81 45.88 43.49 Others 11.89 7.8 38.10 25.66 Occupational Group Agricultural labour 22.79 15.12 NA NA Non-agricultural 19.21 10.30 67.61 57.41 labour/casual labour Self-employed in non- 11.19 7.10 24.10 14.51 agriculture Others 12.65 6.51 38.68 17.89 Source: Computed from NSSO.
Real wages act as a proxy for poverty. Real wage rates increased substantially during
1980s in Andhra Pradesh at 4.62 per cent per annum for males and 3.89 for females.
In the 1990s, there was a declining trend in the real wage rates at a growth rate of
1. 76 percent per annum for males and 2.34 percent. The slow growth in real wages
indicates that the decline in poverty is also slow during nineties. Which in turn affect
the food security at the household level.
6.7 Poverty alleviation programmes
Public intervention for poverty alleviation include programmes such as (i)
access to land (ii) asset development and access to institutional credit (iii)
employment and minimum wages (iv) basic needs covering food through PDS (v)
SOCial security. These programmes are expected to support the income of the poor to
equip them with adequate purchasing power required for food security.
6.7.1 Access to land
Poverty alleviation programmes have been designed from time to time to
enlarge income-earning opportunities for the poor. During 1950's and 60's access to
land through land reforms is the first public intervention, for poverty alleviation.
Some of the important land legislations enforced in Andhra Pradesh are
briefly mentioned here:
(i). Andhra Pradesh (Andhra area) Estate's land (reduction of rent) act, 1947
- the major objective of this act was to provide for reduction of rents payable by
ryots in estates approximately to the level of assessment levied on lands in ryotwari
area in the neighbourhood.
168 .

(ii). The Madras Estates (abolition and conversion in to Ryotwari) Act, 1948 -
it provided for the repeal of the permanent settlement. The acquisition of the rights
of land-holders in permanently settled and certain other estates in the province of
Andhra and the introduction of ryotwari settlement in such estates. 'Estate' means a
Jamindari, or under-tenure or an Inam Estate. This Act extends to the whole of the
state of Andhra.
(iii). The Andhra Pradesh (Telangana Area) Tenancy and Agricultural Lands
Act, 1950. The major objectives of this Act are (1). To regulate the relations of land
lords and tenants of agricultural lands (2) to regulate alienations of land (3) to
prevent excessive sub-division of agricultural holdings (4) to provide for the
legislation of co-operative farm and (5) to empower government to assume in certain
circumstances management of agricultural lands.
(iv). Andhra Inams (abolition and Conversion in to Ryotwari) Act, 1956 to
abolish and convert certain inam lands in to Ryotwari lands. It extends to the whole
of the state of Andhra but applies only to inam lands.
(v). Andhra Tenancy Act of 1956 provides for the payment of fair rent by
cultivating tenants and for fixing the minimum period of agricultural leases in the
state.
(vi). The Andhra Pradesh ceiling on agricultural holdings Act, 1961 provides
for the imposition of ceiling on agricultural holdings ranges from 27 acres to 324
acres depending upon the class of land.
(vii). The Andhra Pradesh Land reforms (ceiling on Agricultural holdings) Act,
1972 which provides for a ceiling area of one standard holding ranging from 4.05
hectares (10 hectares) to 10.93 hectares (about 27 acres) in the case of wet land
and from 14.16 hectares (35 acres) to 21.85 hectares (54 acres) in the case of day
land (Nancharaiah, 1985).
Abolition of intermediaries did not change the ownership structure of land
holdings directly. But, it had two indirect effects: (i). Growth through its percolation
effect on poverty (ii). It freed rural labour from the grip of the zamindar and his
control over common property resources (Parthasarathy, 1995). Under the land
ceiling legislation, only 3.03 percent of the total area owned was declared surplus. Of
this less than one-half was redistributed. The surplus distributed formed only 1.43
percent of the total owned area. Beneficiaries formed only 7.61 percent of the total
owners of below one hectare including, the landless. The total lack of r~ords of
169

rights of tenants and overall insecure tenancies rendered Tenancy legislation
ineffective.
A study conducted recently in Nalgonda district to assess the impact of
distribution of surplus land reveals that the land distributed per household for
agriculture, mining and free putta categories is 1.83 acres, 2.82 acres and 3.00 acres
respectively. Twenty-five percent of the beneficiaries have sold the agricultural land
to clear debts and to due to their inability to cultivate the land because of lack of
finance, and lack of access to inputs. Bu the indirect impact of land reforms
contributed to a shift from rentier to entrepreneurial agriculture, to growth and there
by to a reduction in poverty through percolation effects in the deltas of Coastal
Andhra (Parthasarathy, 1995).
Banjar land constitutes an important component of the land reforms
programme in Andhra Pradesh. By the end of 1992, about 37.29 lakh acres have
been assigned to the landless poor, careering to about 19.13 lakh beneficiaries, of
this, 11.24 lakh acres were allotted to members of Scheduled Castes and 6.06 lakh
acres to Scheduled Tribes (Sankaran, 1996).
The grains from tenancy legislation were considerable for the tenants in the
Telangana area, though the impact was very little in the Andhra area. Recent trends
in the districts of Andhra Pradesh suggest a rise in tenancy due to a number of
factors such as: (i) shift of large and middle class owners in to more lucrative non
agricultural occupations, along with a shift from rural to urban locations, (ii). Entry of
the entrepreneurial agriculturist class in to trading ventures in rural areas and partial
leasing out by resident land owners (iii). Growing shortage of labour especially
during peak seasons, resulting in increased leasing out by large land owners
(Parthasarathy, 1995). Depriving Tribals of their land, which in turn may have
resulted in the growing Naxalite movement, Tribal deprivation took two major forms:
(i). Alienation of land and (ii). Declining access to forests, a source of tribal livelihood
(Reddy, 1988).
Due to demographic pressures, the number and share of marginal and small
farmers have been increasing. The distribution of land holdings show that the share
of marginal farmers and small farmers in area and number of holdings increased
significantly over time (Table-6.17).
170
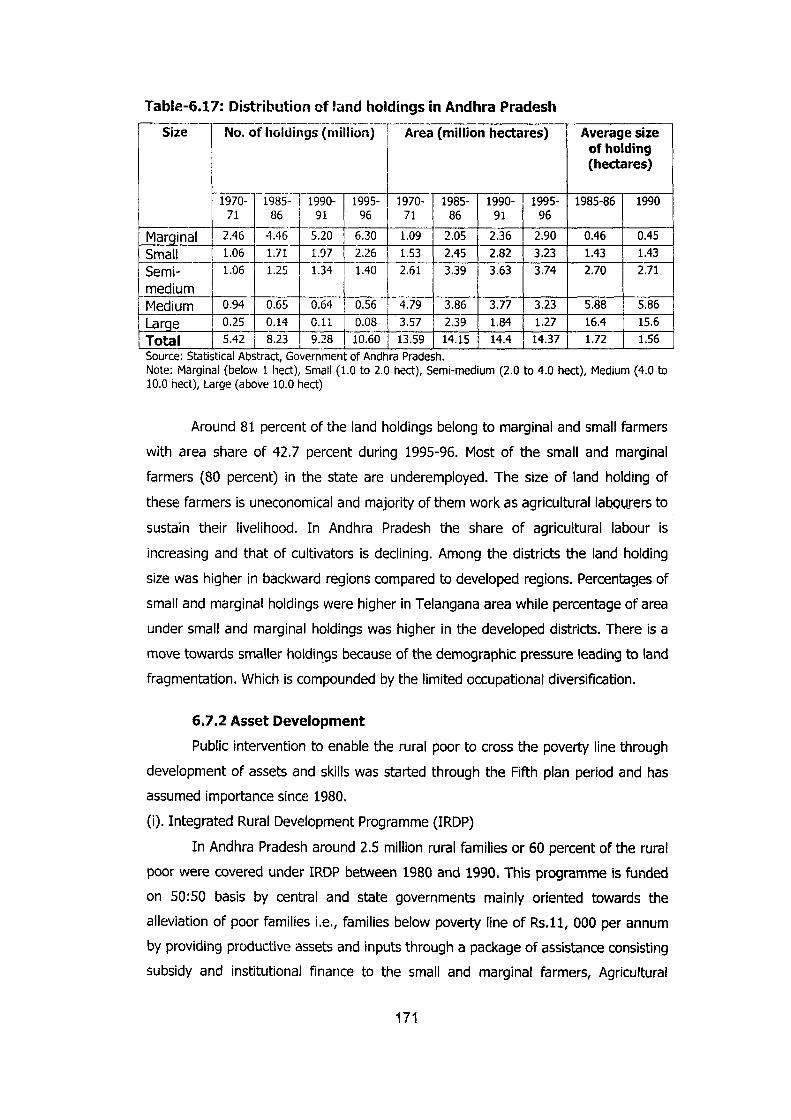
Table-6.17: Distribution af land holdings in Andhra Pradesh
Size No. of huldings (million) i Area (million hectares) I Average size '-----1--------------------'------- " --yo
I I of holding (hectares)
! 1970- -198S--T 1990- 1995- I 1970- 1985- 1990-1 1995- 1985-86 1990
71 86 I 91 96 71 86 91 96
~l!!nal 2.46 I 'o46-r 5.20 6.30 1.09 2.05 2.36 2.90 0.46 0.45
Small 1.06 1.71 1.~7 r-2.26 \ 1.53 2.45 2.82 3.23 1.43 1.43
Semi-~r--
1.40 I 2.61 3.39 3.63 3.74 2.70 2.71 1.06 1.25 1.34
medium I_~tedium 0.94 0.65 0.64 'O:S6"i 4.79 3.86 3.77 3.23 5.88 5.86
Large 0.25 0.14 0.11 0.08 3.57 2.39 1.84 1.27 16.4 15.6
Total 5.42 \
8.23 9.28 10.60 13.59 14.15 14.4 14.37 1.72 1.56 I ---'----
Source: Statistical Abstract, Government of Andhra Pradesh. Note: Marginal (below 1 !lect), Small (1.0 to 2.0 hect), Semi-medium (2.0 to 4.0 hect), Medium (4.0 to 10.0 heet), Large (above 10.0 hect)
Around 81 percent of the land holdings belong to marginal and small farmers
with area share of 42.7 percent during 1995-96. Most of the small and marginal
farmers (80 percent) in the state are underemployed. The size of land holding of
these farmers is uneconomical and majority of them work as agricultural la~Qurers to
sustain their livelihood. In Andhra Pradesh the share of agricultural labour is
increasing and that of cultivators is declining. Among the districts the land holding
size was higher in backward regions compared to developed regions. Percentages of
small and marginal holdings were higher in Telangana area while percentage of area
under small and marginal holdings was higher in the developed districts. There is a
move towards smaller holdings because of the demographic pressure leading to land
fragmentation. Which is compounded by the limited occupational diversification.
6.7.2 Asset Development
Public intervention to enable the rural poor to cross the poverty line through
development of assets and skills was started through the Fifth plan period and has
assumed importance since 1980.
(i). Integrated Rural Development Programme (IRDP)
In Andhra Pradesh around 2.5 million rural families or 60 percent of the rural
poor were covered under IRDP between 1980 and 1990. This programme is funded
on 50:50 basis by central and state governments mainly oriented towards the
alleviation of poor families i.e., families below poverty line of Rs.ll, 000 per annum
by providing productive assets and inputs through a package of assistance consisting
subsidy and institutional finance to the small and marginal farmers, Agricultural
171

labourers, non agricultural labourers and rural artisans. The percentage of
beneficiaries under IRDP has been declining since 1992 in the state. Most of the
households covered under the programme are non-poor. The average net income
from IRDP asset is Rs.1898 per annum and is equivalent to less than two months of
prevailing wage earnings for the male agricultural field labour in the state (Sudhakar
Reddy, 2003). A rupee of investment in IRDP assets yielded an income of Rs.0.55.
there has been a reduction in the proportion of the very poor from 3 percent to 16
percent among the beneficiaries.
Studies on regional variation revealed that the more developed regions and
those families near the poverty line showed a better performance when compared to
others (Subba Rao, 1985). The entry of non-poor in to the programme is around 26
percent across the selected districts viz, Ananthapur, Nalgonda and Vizianagaram.
The expenditure incurred in obtaining the assets under the programme accounted for
7 percent of the subsidy provided to the poor. The average net income from IRDP
assets is Rs.1273 per annum. While 77 percent of the beneficiaries retained the
assets. The employment gain to the beneficiary households came to around 120
man-days in the selected districts. The income gains are more pronounced in the
developed districts and among the relatively better of among the poor.
(ii). Employment Focused Programmes:
The rural employment programmes such as the National Rural Employment
Programme (NREP), the Rural Landless Employment Guarantee Programme (RLEGP),
the Jawahar Gram Samriddhi Yojana (JGSY) and Employment Assurance Scheme
(EAS) have resulted in the creation of community assets as well as assets for the
poorer sections besides providing wage employment to them. The benefits derived
by the poor from the wage employment programmes are higher than those derived
from the self-employment programmes. However, these programmes have not
contributed to a rise in wages (Galab, 1997). The JRY programme covered 15
percent of the unemployed. However the programme needed improvements in four
vital components.
(iii). Development of women and children in rural areas:
This scheme was started as one of the sub-schemes if IRDP. It was initiated
in 1982-83 with an objective of focusing attention on women members of rural
families below the poverty line with a view to provide opportunities for self
employment on sustained basis. This distinguishing feature of the scheme is a group
strategy as against family as a unit under other poverty alleviation programmes. The
172

women members of DWCRA form groups of 10 to 15 women taken up economic
activities suited to their skills, aptitude and the local conditions. The programme has
benefited the members of the groups in terms of diversifying their activities away
from their traditional economic activities and increasing their income levels which
ultimately resulted in increased intake of nutritious food (Kanchanya, 1998). On the
other hand, there are some DWCRA groups in the drought-prone and the backward
district like Ananthapur which are not undertaking any economic activity either
individually or collectively but utilizing the financial assistance as an interest free loan
among themselves (Galab,1997).
Regional level study conducted in three districts of Andhra Pradesh viz,
Adilabad, Kurnool and Visakhapatnam show that DWCRA groups are homogeneous
and cohesive, 22 percent belong to SCs, 11 percent to STs, 67 percent to BCs and
the remaining 4 percent to others. The average age of members is 35. For 60
percent of the groups, saving is the main purpose of group formation. There is high
regularity in saving (Dev and Rao, 2002) arrangements for maintaining the group
activity and the support mechanism provided by the programme implementation
authority are the determinants of the success of the programme.
(iv). Self Help Groups:
Providing the poor with access to financial services will help to increase their
incomes and access to food. Credit is provided by using different mechanisms such
as group based lending to the poor and other clients including women, who lack
access to formal financial institutions. Andhra Pradesh has 60 percent of the
country's self help groups. 40.3 lakh SHGs comprising 54.23 lakh members are
functioning during 2000-2001. The groups are characterized by regular savings of
the members and total savings in all the SHGs is Rs.553.99 crores. There is a corpus
fund of Rs.1043.00 crores with these SHGs (Economic Survey GOAP, 2001-2002).
Dependency on moneylenders and landlords seems to be declining and particularly,
there is a gradual shift from consumption loans to productive loans. Future, security
is becoming a more important purpose for the women to be active within the group.
(v). Swarnjayanti Gram Swarozgar Yojana:
This is a centrally sponsored scheme funded by the government of India and
the state government in the ratio of 75:25. All the existing schemes up to 1998-99
namely IRDP, TRYSEM, TOOLKITS, DWCRA, GKY and MWS have been merged in the
new scheme called Swarnjayanti Gram Swarozgar Yojana since 01.04.1999. The
objective of the SGSY is to bring poor families above the poverty line by providing
173

them income-generating assets through a mix of bank credit and government
subsidy. The key elements in these programmes are the choice of activity based on
local resources and aptitude as well as the skills of Swarozgaries.
(vi). Drought Prone Area Programme (DPAP / DDP):
This is a centrally sponsored scheme funded by central and station 75:25
basis aimed at developing the drought prone area with an objective of drought
proofing by taking up of soil land moisture conservation, Water harvesting structures,
a forestation and Horticulture programmes on a comprehensive micro watershed
basis. Watershed approaches have come to be the primary strategy under these
programmes. In Andhra Pradesh over the years the utilization of resources had seen
a steady decline indicating that the delivery mechanism did not get strengthened in
correspondence with the increase in resource flow.
Area development on watershed basis is also an important programme for
employment generation and poverty reduction. The government of Andhra Pradesh
has recently embarked on a programme in five districts with the financial support
from Department for International Development (DFID). This programme aims to
address some of the shortcomings of the existing watershed programmes and to
provide support for strengthening particularly processes and providing sustained
capacity building for the community-based organizations involved in w.atershed
management.
(vii). Integrated Waste Land Development (IWDP):
Rapid depletion of green cover and vast stretches of marginal lands lying
fallow, found to be causing enormous ecological imbalance. Productivity is also
negligent on account of soil erosion and marginalisation of lands. To arrest this,
massive integrated wasteland development project was undertaken during 1991.
This project i!5 implemented in 17 districts with 38 projects covering an area of
362985 hectares with an outlay of Rs.17784.28 lakh.
(viii). Joint Forest Management (JFM):
At present JFM is implemented in a total of 6575 villages covering an area of
16.32 lakh hectares. About 5.28 lakh hectares of degraded forests have been treated
through JFM. Around 13 lakh people, including 6 lakh women are participating in the
activity for bringing back greenery to the forests. Widespread implementation of JFM
is leading to an increased flow of minor forest products to communities and an
174

increase in environmental benefits resulting from improved forest condition
particularly with respect to soil and water regimes.
6.7.3 Nutrition Programmes
The government has introduced several programmes to improve the access
to food (Table-6.18). We have already disused about the PDS in earlier chapter.
Antyodaya Anna Yojana and Annapurna schemes are the programmes associated
with PDS.
Antyodaya Anna Yojana (MY) was launched on 25th December 2000 to provide food
security to the poorest of the poor. It is estimated that 5 percent of our population
(i.e. 5 crore persons or 1 crore families are unable to get two square meals a day on
sustained basis through out the year). Their purchasing power is so low that they are
not in a position to buy ration from PDS even at BPL rates. MY is intended to ensure
food security to such families. Under MY scheme, the Central Government issues
wheat at Rs.2/- per Kg. And rice at Rs.3/- per Kg. In view of the adjunct poverty of
the target group, the State Governments as per to the suggestion of Central
Government have maintained the end retail price at the rates supplied by the Central
Government. Initially, beneficiary family was entitled 25 Kgs. Of rice per month and
later on, it was enhanced to 35 Kgs.
The success of such Scheme, no doubt, depends on the correct identification of
the beneficiary household. It is estimated that there were 6.52 crore families below
poverty line in the country as on 1-3-2000. These families are being provided ration
at BPL rates. One crore families i.e. (15.33 percent families) constitute the target
group for MY. Based on state-level poverty estimates, the number of beneficiaries of
MY at State level was derived. In Andhra Pradesh 6,22,800, MY families were
identified. The scheme in Andhra Pradesh was implemented from February 2001.
The white cards of identified beneficiaries were to be replaced by blue cards.
Initially, there was an apprehension among MY beneficiaries that only rice will be
supplied to blue cardholders and therefore were reluctant to surrender their white
cards. In order to ensure that there is no diversion of supplies meant for MY
beneficiaries to open market there is a need to issue rice coupons to blue
cardholders too.
175

Table-6.18: Programmes to improve accessibility and adequacy of food and nutrition. Programme I Scheme Food Made Availability Programme
Interventions A. Targeted Public Distribution BPL/APL: 25Kg rice and wheat/ Price subsidies on rice, wheat, System family/ month sugar, edible oils. A higher price
1. Antyodaya Anna Yojna 25 Kg of rice and wheat per subsidy on rice and wheat than family classified as poorest of BPL rates.
2. Anupama Scheme the poor Free grain to indigent senior 10 Kg/ month! indigent senior citizens citizen
B. Food for work Employment in lean agricultural 1. Jawahar Gram 1 Kg of rice or wheat/ workday season for rural workers below
Samriddhi Yojana poverty line. 2. Employment Assurance 1 Kg of rice or wheat/workday 100 days employment during
Scheme lean agricultural season up to 2 members/family
3. Swarnjayanti Gram Up to 5 kg grains per person per Employment at minimum wage, Swarozgar Yojana day partly paid in kind
4. Food-for-Work Food grains up to 5 kg per man- Employment in natural calamity day areas
C. Mid-day Meals Scheme 3 Kg rice or wheat/child/month Cooked meal or distribution of for 10 mos. Or cooked meal foodgrains to primary schools (100 gm/day) for 200 days
D. Nutrition Schemes with food o to 6 years: 300 calories (ready Supplementary feeding, growth Supplementation to eat food) + 8-10 gm protein monitoring and promotion,
for 300 days nutrition and health education to adult women and adolescent
1. Integrated Child Malnourished children: girls, pre-school education to 3-6 Development Services 600 calories + 20 gm protein for years old, immunization,health Scheme / Tamilnadu 300 days check-ups and referrals, income Integrated Nutrition Adolescent girls: 500 calories + generating programs. Program 20-25 gm protein for 300 days
Pregnant & nursing mothers: 500 calories + 20-25 gm protein for 300 days.
2. Pradhan Mantri 300 calories and 8-10 gms of Supplementary feeding Gramodaya Yojana protein for Grade I & II children,
double the amount for Grade III and N children.
3. Balwadi Nutrition 300 calories + 12-15 gm protein Supplementary feeding to Program for 270 days children 3-5 years, promote
child's social and emotional development.
4. Day Care Centers 300 calories + 12-15 gm protein Day care services to children for 270 days below 5 years to low income
families, supplementary nutrition, health care, medical check up and immuni~~ti9n.
Source: World Bank (2001).
176

Table-6.19: District-wise Distribution of Beneficiaries of Antyodaya Anna
Yojana in Andhra Pradesh
District Number of families Srikakulam 21298 Viziana~aram 20824 Visakhapatnam 29292 East Godavari 30941 West Godavari 27246 Krishna 28015 Guntur 30941 Prakasam 28194 Nellore 23468 Kurnool 27088 Anantapur 26099 Cudda~ah 20687 Chittoor 28963 Rangareddy 29979 Nizamabad 22589 Medak 27308 Mahaboobnagar 32005 Nalgonda 30453 Warangal 32006 Khammam 30178 Karimnagar 29856 Adilabad 32005 Hyderabad 13365 Total 622800
Source: Indrakant (2003)
Consequent to the introduction of MY, there are some changes in the cost of PDS
rice to the State Government and sales realisation from it. Earlier, the Government
was purchasing 21.6 lakhs tonnes to distribute to 113 lakh white cardholders. The
rice for 40.628 lakh families was purchased at half the central issue price. After the
introduction of MY, the rice for 6.228 lakh families was made available at much
lower rate and the State Government had no additional burden. The quantity
distributed in 2001-02 is estimated to be 20.8 lakh tonnes. Out of this, a quantity of
1.87 lakh tonnes are estimated to have been distributed to 6.228 lakh MY families
at the rate of 25 Kgs per month per family. Out of remaining 18.93 lakh tonnes, it is
assumed that 1.84 lakhs tonnes is distributed to social welfare hostels. Thus, the
quantity distributed to the white cardholders is estimated to be 17.09 lakh tonnes.
After the introduction of MY, only 34.40 lakh BPL families are eligible to get rice at
half the central price at 20 Kg per family as remaining 6.228 lakh BPL families are
covered under MY scheme. Thus, the State Government could purchase 8.256 lakh
177

tonnes at half the central issue price i.e. at Rs.5650 per tonne. The remaining
quantity of rice required for white cardholders i.e. 8.834 lakh tonne (17.09 - 8.2.56)
had to be purchased at full economic cost of FC! (Rs. 950 per qUintal). The total cost
of rice for MY cardholders, BPL families and non-BPL white cardholders is estimated
to be Rs.13.62 crores. The sales realisation from sale of 1.87 lakh tonnes to MY at
Rs. 3 per Kg and 17.09 lakhs tonnes to white cardholders at Rs. 5.25 per Kg is
estimated to be Rs.953 crores. Thus, the subsidy incurred by the State Government
to distribute 18.96 lakh tonnes through FPS is estimated to be Rs. 409 crores. The
subsidy per tonne works out Rs. 2157.
Annapurna Scheme was started to provide food security to those senior
citizens who, though eligible have remained uncovered under the National Old Age
Pension Scheme. At national level, it was envisaged to cover 20 percent of 68.81
lakh persons (i.e. 13.76 lakh persons) under Annapurna Scheme. In Andhra Pradesh,
the beneficiary target was fixed at 93,200. Under the scheme 10 Kgs. Of foodgrains
per month are being provided free of cost to the beneficiary. However, the supply is
not regular. There are instances, where 2 or 3 months quota is given at one time.
Some beneficiaries find it difficult to carry the ration (20 or 30 Kgs.) from FPS to
their house. The district-wise break-up was mostly on the basis of population (Table-
6.20). As identification of beneficiaries is left to the local authorities and Gram Sabha
with certain guidelines, which include (i) the beneficiary must be above 65 years of
age. (ii). The beneficiary should have little or no regular source of income or financial
assistance from family members. (iii). The beneficiary should not be in receipt of old
age pension or any other pension.
With multiple programmes launched by Central and State Government,
the structure of existing PDS has become very complex. According to the central
Government estimates about 40 lakh families live below poverty line. Among these 6
lakh families belong to poorest of the poor. They have been given blue cards. The
Central Government releases 35 Kgs of rice per month per family at Rs. 3 per Kg. For
the remaining BPL families (34 lakhs) 20 Kgs rice per family at half the central issue
price to these families at Rs. 5.25 per Kg (below the price recommended by the
Central Government) at the rate of 4 Kgs per head subject to a ceiling of 20 Kgs per
family. Besides these 341akh families, the State Government has issued additional 73
lakh white cards.
178

Table- 6.20: District-wise distribution of beneficiaries of Annapurna
scheme in Andhra Pradesh
District Number of families Srikakulam 3101 Vizianagaram 3032 Visakhapatnam 4265 East Godavari 3967 West Godavari 4505 Krishna 4079 Guntur 4505 Prakasam 4105 Nellore 3417 Kurnool 3944 Anantapur 3800 Cuddapah 3810 Chittoor 4217 Rangareddy 4365 Nizamabad 3389 Medak 3976 Mahaboobnagar 4660 Najgonda 4434 Warangal 4660 Khammam 4394 KarimnCigar 4347 Adilabad 4460 Hyderabad 4467 Total 93,200
Source: Economic Survey (2001-2002)
The non-BPL white cardholders get the rice at the same rate as BPL households.
With introduction of coupon scheme, about 8 lakh white cards have gone out of
circulation and thereby reducing subsidy burden of the State Government. With an
introduction of MY beneficiaries have been receiving larger quantities of rice at
~ch lower rate. In addition to these household beneficiaries there are 93,000 senior
citizens in the state receiving 10 Kgs of rice free of cost under Annapurna Anna
Yojana.
Malnutrition among children and women is severe in Andhra Pradesh.
Integrated child development services (rCDS) are one of the main programmes for
providing nutrition. At present rCDS covers 220 blocks in the state. The total
beneficiaries covered in ICDS are: (i). 27 lakh children under 6 years (ii). 7 lakh
adolescent girls and (iii). 6.35 lakh expectant and nursing mothers during 1999-2000.
Overall impact of all these schemes on food security seems to be marginal as most of
the beneficiaries are non-poor households.
179

6.8 Conclusions
Employment security is essential pre-requisite for gaining food security at the
household level. Mere availability of foodgrains will have little relevance, if people do
not possess purchasing power to buy them for their consumption. Employment is
largely unorganised, rural and the incidence of child labour is the highest in the
State. Employment growth rate declined during 1993-94 to 1999-2000 as compared
to 1983-84 to 1993-94. Although State Domestic Product increased during 1990s it
could not increase the employment opportunities during 1990s. The urban work
participation rate remained constant around 30 percent, rural work participation
rates increased from 41.7 percent in 1971 to 49.8 percent in 1991 among the.
regions. While urban participation rate is highest in the highly developed south
coastal Andhra, rural participation rate is the lowest in this region. On the other hand
Telangana regions have very high participation rates of more than 49 percent in rural
areas, while the corresponding rates in the urban areas are low among the regions,
North Telangana has high participation rate among females (15.6) in the secondary
sector, while the female participation rates in the other four regions are below 7.5
percent. Rayalaseema region has the highest female participation in the_primary
sector during 1971 and 1991.Growth rates in real wages were low during 1990s for
both men and women. The growth rate for males declined from 5.74 percent in the
1980s to 1.53 percent in the 1990s. Similarly for women, the rate of growth in real
wages declined from 4.76 percent in the 1980s to 1.94 percent in the 1990s.
The official poverty ratios, based on the expert group methodology, show
very low levels of rural poverty and high levels of urban poverty for Andhra Pradesh
for 1999-2000. But other estimates show different picture. There exits no significant
variation in the incidence of poverty in rural areas between the three regions in
1993-94, but in 1999-2000 the estimated incidence of poverty in Rayalaseema region
is about more than two times to those in Telangana and three times to those in
Coastal Andhra region. Urban poverty declined in all three regions, however, it is
noticed that the poverty levels in urban areas are uniformly higher compared to
those in rural areas. Poverty declined at faster rate during 19805 compared to 19905.
180

With the decline in real wages economic access to food declined which intern effect
the intra-household food distribution (which we will be dealing in the next chapter).
Most of the anti-poverty interventions such as food subsidies and rural public works
are miss targeted as most of the beneficiaries are non-poor households. The
development of human capital through education and health has been neglected in
poverty alleviation programmes.
181


