
NCES 2013-316 U.S. DEPARTMENT OF EDUCATION
Characteristics of Private Schools in the United States: Results From the 2011–12 Private School Universe Survey First Look


Characteristics of Private Schools in the United States: Results From the 2011–12 Private School Universe Survey First Look JULY 2013
Stephen P. Broughman National Center for Education Statistics
Nancy L. Swaim U.S. Census Bureau
NCES 2013-316 U.S. DEPARTMENT OF EDUCATION

U.S. Department of Education Arne Duncan Secretary
Institute of Education Sciences John Q. Easton Director
National Center for Education Statistics Jack Buckley Commissioner
Elementary/Secondary and Library Studies Division Jeffrey Owings Associate Commissioner The National Center for Education Statistics (NCES) is the primary federal entity for collecting, analyzing, and reporting data related to education in the United States and other nations. It fulfills a congressional mandate to collect, collate, analyze, and report full and complete statistics on the condition of education in the United States; conduct and publish reports and specialized analyses of the meaning and significance of such statistics; assist state and local education agencies in improving their statistical systems; and review and report on education activities in foreign countries. NCES activities are designed to address high-priority education data needs; provide consistent, reliable, complete, and accurate indicators of education status and trends; and report timely, useful, and high-quality data to the U.S. Department of Education, the Congress, the states, other education policymakers, practitioners, data users, and the general public. Unless specifically noted, all information contained herein is in the public domain. We strive to make our products available in a variety of formats and in language that is appropriate to a variety of audiences. You, as our customer, are the best judge of our success in communicating information effectively. If you have any comments or suggestions about this or any other NCES product or report, we would like to hear from you. Please direct your comments to
NCES, IES, U.S. Department of Education 1990 K Street NW Washington, DC 20006-5651
July 2013 The NCES Home Page address is http://nces.ed.gov. The NCES Publications and Products address is http://nces.ed.gov/pubsearch. This publication is only available online. To download, view, and print the report as a PDF file, go to the NCES Publications and Products address shown above. Suggested Citation Broughman, S.P., and Swaim, N.L. (2013). Characteristics of Private Schools in the United States: Results From the 2011–12 Private School Universe Survey (NCES 2013-316). U.S. Department of Education. Washington, DC: National Center for Education Statistics. Retrieved [date] from http://nces.ed.gov/pubsearch.
Content Contact Stephen Broughman (202) 502-7315 [email protected]

iii
Contents Page List of Tables ................................................................................................................................. iv
Introduction ......................................................................................................................................1
Selected Findings .............................................................................................................................2
References ........................................................................................................................................4
Tables ...............................................................................................................................................5
Appendix A—Glossary .............................................................................................................. A-1
Appendix B—Technical Notes ....................................................................................................B-1
Appendix C—Standard Error Tables ...........................................................................................C-1

iv
List of Tables Table Page 1 Number and percentage distribution of private schools, students, and full-time
equivalent (FTE) teachers, by selected school characteristics: United States, 2011–12.............................................................................................................................6
2 Number and percentage distribution of private schools, students, and full-time equivalent (FTE) teachers, by religious or nonsectarian orientation of school: United States, 2011–12 .....................................................................................................7
3 Percentage distribution of private schools, by program emphasis and selected school characteristics: United States, 2011–12 .................................................................8
4 Number and percentage distribution of private schools, by urbanicity type and selected school characteristics: United States, 2011–12 ...................................................9
5 Number and percentage distribution of private school students, by urbanicity type and selected school characteristics: United States, 2011–12 ..................................10
6 Number and percentage distribution of private school students, by grade and private school typology: United States, 2011–12 ...........................................................11
7 Average private school size, by school level and selected school characteristics: United States, 2011–12 ...................................................................................................12
8 Number and percentage distribution of private schools, by school size and selected school characteristics: United States, 2011–12 .................................................13
9 Percentage distribution of private school students, by racial/ethnic background and selected school characteristics: United States, 2011–12 ..........................................14
10 Percentage male enrollment in private schools and percentage distribution of private schools, by coeducational category and selected school characteristics: United States, 2011–12 ...................................................................................................15
11 Number and percentage distribution of private school teachers (headcount), by work status and selected characteristics: United States, 2011–12 ..................................16
12 Pupil/teacher ratio of private schools, by school level and selected characteristics: United States, 2011–12 ..........................................................................17
13 Percentage of private schools with 12th-graders, number of graduates, graduation rate, and percentage of graduates who attended 4-year colleges, by selected characteristics: United States, 2010–11 ............................................................18
14 Number of private schools, students, and teachers (headcount), by school membership in private school associations: United States, 2011–12 .............................19
15 Number of private schools, students, full-time equivalent (FTE) teachers, and 2010–11 high school graduates, by state: United States, 2011–12 .................................20

v
List of Tables—Continued Table Page
Appendix B—Technical Notes Table B-1 Number of responding and nonresponding schools, out-of-scope cases,
and school response rate, by frame: 2011–12 ...............................................................B-2
Appendix C—Standard Error Tables C-1 Standard errors for number and percentage distribution of private schools,
students, and full-time equivalent (FTE) teachers, by selected school characteristics: United States, 2011–12 ........................................................................C-2
C-2 Standard errors for number and percentage distribution of private schools, students, and full-time equivalent (FTE) teachers, by religious or nonsectarian orientation of school: United States, 2011–12 .........................................C-3
C-3 Standard errors for percentage distribution of private schools, by program emphasis and selected school characteristics: United States, 2011–12 ........................C-4
C-4 Standard errors for number and percentage distribution of private schools, by urbanicity type and selected school characteristics: United States, 2011–12 ...............C-5
C-5 Standard errors for number and percentage distribution of private school students, by urbanicity type and selected school characteristics: United States, 2011–12.........................................................................................................................C-6
C-6 Standard errors for number and percentage distribution of private school students, by grade and private school typology: United States, 2011–12 ....................C-7
C-7 Standard errors for average private school size, by school level and selected school characteristics: United States, 2011–12 ........................................................................C-8
C-8 Standard errors for number and percentage distribution of private schools, by school size and selected school characteristics: United States, 2011–12 .....................C-9
C-9 Standard errors for percentage distribution of private school students, by racial/ethnic background and selected school characteristics: United States, 2011–12.......................................................................................................................C-10
C-10 Standard errors for percentage male enrollment in private schools and percentage distribution of private schools, by coeducational category and selected school characteristics: United States, 2011–12 .............................................C-11
C-11 Standard errors for number and percentage distribution of private school teachers (headcount), by work status and selected characteristics: United States, 2011–12 ...........................................................................................................C-12
C-12 Standard errors for pupil/teacher ratio of private schools, by school level and selected characteristics: United States, 2011–12 ........................................................C-13

vi
List of Tables—Continued Table Page C-13 Standard errors for percentage of private schools with 12th-graders, number of
graduates, graduation rate, and percentage of graduates who attended 4-year colleges, by selected characteristics: United States, 2010–11 ....................................C-14
C-14 Standard errors for number of private schools, students, and teachers (headcount), by school membership in private school associations: United States, 2011–12 ...........................................................................................................C-15
C-15 Standard errors for number of private schools, students, full-time equivalent (FTE) teachers, and 2010–11 high school graduates, by state: United States, 2011–12.......................................................................................................................C-16

1
Introduction In 1988, the National Center for Education Statistics (NCES) developed a private school data collection that improved on the sporadic collection of private school data dating back to 1890 by developing an alternative to commercially available private school sampling frames. Since 1989, the U.S. Bureau of the Census has conducted the biennial Private School Universe Survey (PSS) for NCES. The PSS is designed to generate biennial data on the total number of private schools, students, and teachers, and to build a universe of private schools to serve as a sampling frame of private schools for NCES sample surveys. For more information about the methodology and design of the PSS, please see the Technical Notes in appendix B of this report.
The target population for the PSS is all schools in the 50 states and the District of Columbia that are not supported primarily by public funds, provide classroom instruction for one or more of grades kindergarten through 12 (or comparable ungraded levels), and have one or more teachers. Organizations or institutions that provide support for home schooling, but do not provide classroom instruction, are not included.
The 2011–12 PSS data were collected between September 2011 and May 2012. All data are for the 2011–12 school year except the high school graduate data, which are for the 2010–11 school year.
Because the purpose of this report is to introduce new NCES survey data through the presentation of tables containing descriptive information, only selected findings are listed below. These findings are purely descriptive in nature and are not meant to imply causality. These findings have been chosen to demonstrate the range of information available from the 2011–12 PSS rather than to discuss all of the observed differences, emphasize any particular issue, or make comparisons over time.
The tables in this report contain counts and percentages demonstrating bivariate relationships. All of the results have been weighted to reflect the sample design and to account for nonresponse and other adjustments. Comparisons drawn in the selected findings have been tested for statistical significance at the .05 level using Student’s t statistics to ensure that the differences are larger than those that might be expected due to sampling variation. No adjustments were made for multiple comparisons. Many of the variables examined are related to one another, and complex interactions and relationships have not been explored. Statistical Analysis Software (SAS 9.2) and SUDAAN (10.0) were used to compute the statistics for this report.

2
Selected Findings
•
•
•
•
•
•
•
•
•
•
•
•
•
•
In the fall of 2011, there were 30,861 private elementary and secondary schools with 4,494,845 students and 420,880 full-time equivalent (FTE) teachers in the United States (table 1).
Sixty-eight percent of private schools, enrolling 80 percent of private school students and employing 72 percent of private school FTE teachers in 2011–12, had a religious orientation or purpose (table 2).
Seventy percent of private schools in 2011–12 emphasized a regular elementary/secondary program, 8 percent emphasized a Montessori program, 2 percent emphasized a special program emphasis, 6 percent emphasized a special education program, 3 percent emphasized an alternative program, and 12 percent emphasized an early childhood program (table 3).
In 2011–12 there were more private schools in suburban locations (10,911), compared to those in cities (10,005), followed by those in rural areas (7,045), and then by those in towns (2,900) (tables 1 and 4).
More private school students in 2011–12 were enrolled in schools located in cities (1,900,639), followed by those enrolled in suburban schools (1,672,501), followed by those in rural areas (620,862), and then by those in towns (300,842) (tables 1 and 5).
More private school students in 2011–12 were enrolled in kindergarten (449,819) than in any other grade level (table 6).
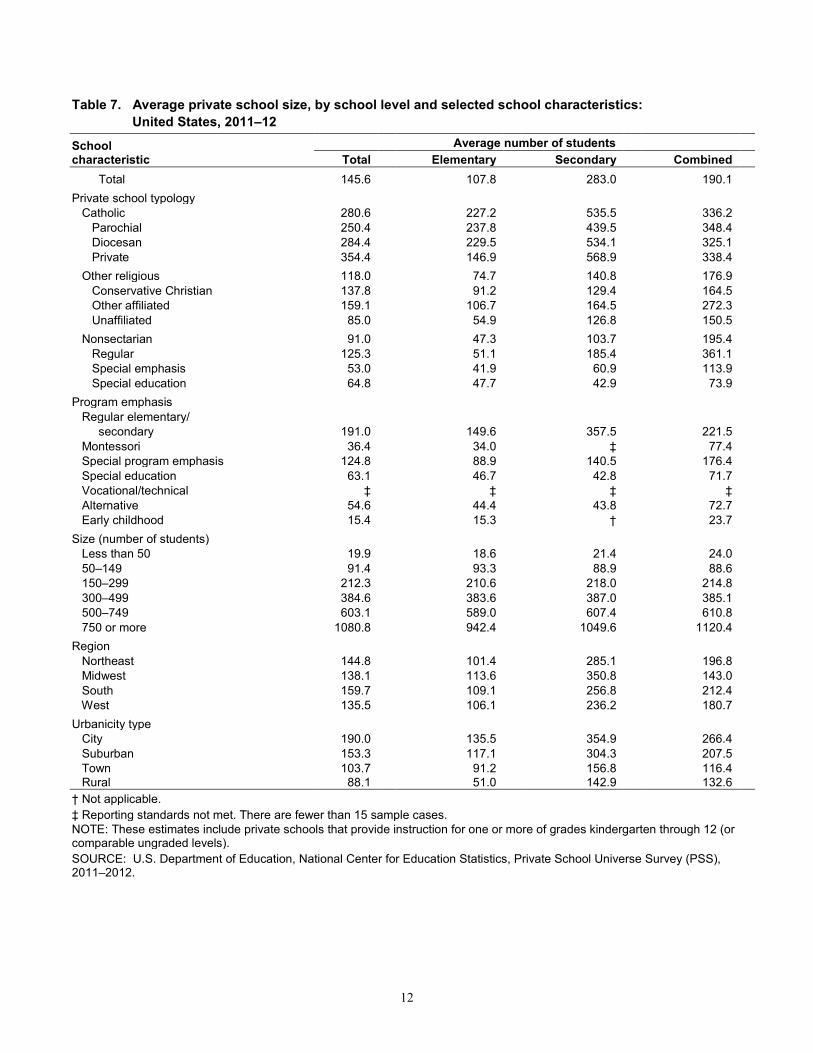
The average school size in 2011–12 was 146 students across all private schools. Private school size differed by instructional level. On average, elementary schools had 108 students, secondary schools had 283 students, and combined schools had 190 students (table 7).
Forty-four percent of all private schools in 2011–12 enrolled fewer than 50 students (table 8).
Seventy-one percent of private school students in 2011–12 were White; 10 percent were Hispanic or Latino, regardless of race; 9 percent were Black or African American; 5 percent were Asian; 3 percent were of two or more races, and less than 1 percent was American Indian or Alaska Native, or Native Hawaiian or other Pacific Islander, respectively (table 9).
Ninety-six percent of all private schools in 2011–12 were coeducational, while 2 percent enrolled all girls and 2 percent enrolled all boys (table 10).
Seventy-eight percent of private school teachers in 2011–12 were full-time teachers; 5 percent taught less than full time, but at least three-quarter time; 9 percent taught less than three-quarter time, but at least one-half time; 5 percent taught less than one-half time, but at least one-quarter time; and 3 percent taught less than one-quarter time (table 11).
The average pupil/teacher ratio in 2011–12 was 10.7 across all private schools. The average pupil/teacher ratio was lower in combined schools (9.4) than in elementary schools (11.5) or secondary schools (11.6) (table 12).
Ninety-eight percent of 12th-graders enrolled in private schools around October 1, 2010 graduated by the fall of 2011 (table 13).
Of the 305,842 private high school graduates in 2010–11, some 64 percent attended 4-year colleges by the fall of 2011 (table 13).
3
•
•
In 2011–12, there were 10,212 private schools that did not report membership in any private school association (table 14).
In 2011–12, there were 200,000 or more students enrolled in private schools in each of California, Florida, Illinois, New York, Pennsylvania, and Texas (table 15).

4
References Beller, N.D. (1984). Private Elementary and Secondary Education, 1983 Enrollment, Teachers, and
Schools (Bulletin). U.S. Department of Education. Washington, DC: National Center for Education Statistics.
Wolter, K.M. (1985). Introduction to Variance Estimation. New York: Springer-Verlag.

5
Tables

6
Table 1. Number and percentage distribution of private schools, students, and full-time Table 1. equivalent (FTE) teachers, by selected school characteristics: United States, 2011–12
School characteristic
Schools Students FTE teachers Number Percent Number Percent Number Percent
Total 30,861
100.0
4,494,845
100.0
420,880
100.0 Private school typology
Catholic 6,873
22.3
1,928,388
42.9
138,071
32.8 Parochial 2,910
9.4
728,669
16.2
49,364
11.7
Diocesan 2,922
9.5
830,813
18.5
57,958
13.8 Private 1,041
3.4
368,906
8.2
30,749
7.3
Other religious 14,214
46.1
1,676,649
37.3
163,139
38.8 Conservative Christian 4,574
14.8
630,557
14.0
59,545
14.1
Other affiliated 3,060
9.9
486,746
10.8
49,220
11.7 Unaffiliated 6,579
21.3
559,347
12.4
54,374
12.9
Nonsectarian 9,775
31.7
889,807
19.8
119,669
28.4 Regular 4,882
15.8
611,529
13.6
74,519
17.7
Special emphasis 3,280
10.6
173,773
3.9
25,624
6.1 Special education 1,613
5.2
104,505
2.3
19,526
4.6
School level Elementary 19,697
63.8
2,124,106
47.3
184,134
43.7
Secondary 2,677
8.7
757,448
16.9
65,178
15.5 Combined 8,488
27.5
1,613,291
35.9
171,568
40.8
Program emphasis Regular elementary/ secondary 21,486
69.6
4,103,932
91.3
358,928
85.3
Montessori 2,439
7.9
88,670
2.0
14,455
3.4 Special program emphasis 676
2.2
84,365
1.9
10,454
2.5
Special education 1,859
6.0
117,262
2.6
21,741
5.2 Vocational/technical ‡
‡
‡
‡
‡
‡
Alternative 813
2.6
44,419
1.0
6,537
1.6 Early childhood 3,583
11.6
55,093
1.2
8,670
2.1
Size (number of students) Less than 50 13,459
43.6
267,883
6.0
45,630
10.8
50–149 7,667
24.8
701,112
15.6
80,887
19.2 150–299 5,488
17.8
1,165,283
25.9
101,691
24.2
300–499 2,447
7.9
940,949
20.9
78,076
18.6 500–749 1,103
3.6
665,253
14.8
52,954
12.6
750 or more 698
2.3
754,365
16.8
61,642
14.6 Region
Northeast 7,447
24.1
1,078,014
24.0
109,631
26.0 Midwest 7,963
25.8
1,099,838
24.5
91,307
21.7
South 9,203
29.8
1,469,996
32.7
145,226
34.5 West 6,249
20.2
846,997
18.8
74,716
17.8
Urbanicity type City 10,005
32.4
1,900,639
42.3
173,395
41.2
Suburban 10,911
35.4
1,672,501
37.2
155,632
37.0 Town 2,900
9.4
300,842
6.7
28,265
6.7
Rural 7,045
22.8
620,862
13.8
63,587
15.1 ‡ Reporting standards not met. There are fewer than 15 sample cases.
NOTE: Detail may not sum to totals because of rounding or missing values in cells with too few sample cases. These estimates include private schools that provide instruction for one or more of grades kindergarten through 12 (or comparable ungraded levels). SOURCE: U.S. Department of Education, National Center for Education Statistics, Private School Universe Survey (PSS), 2011–2012.

7
Table 2. Number and percentage distribution of private schools, students, and full-time Table 2. Table 2.
equivalent (FTE) teachers, by religious or nonsectarian orientation of school: United States, 2011–12
Religious or nonsectarian orientation
Schools Students FTE teachers Number Percent Number Percent Number Percent
Total 30,861
100.0
4,494,845
100.0
420,880
100.0 Religious orientation 21,086
68.3
3,605,038
80.2
301,210
71.6
Roman Catholic 6,873
22.3
1,928,388
42.9
138,071
32.8 African Methodist Episcopal ‡
‡
‡
‡
‡
‡ Amish 1,260
4.1
33,419
0.7
1,782
0.4
Assembly of God 292
0.9
36,940
0.8
3,232
0.8 Baptist 1,970
6.4
203,984
4.5
20,327
4.8
Brethren 78
0.3
8,193
0.2
673
0.2 Calvinist 113
0.4
24,155
0.5
1,866
0.4
Christian (unspecified) 4,518
14.6
607,130
13.5
59,634
14.2 Church of Christ 141
0.5
28,811
0.6
2,581
0.6
Church of God 104
0.3
8,931
0.2
819
0.2 Church of God in Christ 23
0.1
1,539
#
148
#
Church of the Nazarene 63
0.2
5,198
0.1
480
0.1 Disciples of Christ ‡
‡
‡
‡
‡
‡ Episcopal 374
1.2
95,189
2.1
11,084
2.6
Friends 87
0.3
19,085
0.4
2,441
0.6 Greek Orthodox 36
0.1
4,253
0.1
535
0.1
Islamic 229
0.7
32,478
0.7
3,866
0.9 Jewish 954
3.1
245,425
5.5
25,689
6.1
Latter Day Saints ‡
‡
‡
‡
‡
‡ Lutheran Church—Missouri Synod 994
3.2
118,444
2.6
9,247
2.2
Evangelical Lutheran Church In America 120
0.4
8,941
0.2
763
0.2 Wisconsin Evangelical Lutheran Synod 336
1.1
29,349
0.7
2,236
0.5
Other Lutheran 82
0.3
6,563
0.1
524
0.1 Mennonite 736
2.4
32,834
0.7
3,167
0.8
Methodist 240
0.8
17,603
0.4
1,945
0.5 Pentecostal 295
1.0
13,937
0.3
1,564
0.4
Presbyterian 224
0.7
33,230
0.7
3,259
0.8 Seventh-Day Adventist 800
2.6
48,684
1.1
3,974
0.9
Other 118
0.4
9,773
0.2
1,043
0.2 Nonsectarian 9,775
31.7
889,807
19.8
119,669
28.4
# Rounds to zero.
‡ Reporting standards not met. There are fewer than 15 sample cases. NOTE: Detail may not sum to totals because of rounding or missing values in cells with too few sample cases. These estimates include private schools that provide instruction for one or more of grades kindergarten through 12 (or comparable ungraded levels).
SOURCE: U.S. Department of Education, National Center for Education Statistics, Private School Universe Survey (PSS), 2011–2012.

8
Table 3. Percentage distribution of private schools, by program emphasis and selected school Table 3. characteristics: United States, 2011–12
Regular elementary/
secondary
Special Vocational/
School
program
Special
technical
Early
characteristic Montessori emphasis education programs Alternative childhood Total 69.6
7.9
2.2
6.0
‡
2.6
11.6
Private school typology Catholic 96.2
0.7
0.4
1.1
‡
‡
1.5
Parochial 99.1
‡
0.0
‡
‡
0.0
‡ Diocesan 97.5
‡
‡
1.1
‡
‡
0.8
Private 84.1
3.4
‡
3.7
‡
‡
6.0 Other religious 86.8
1.0
1.3
1.2
‡
1.6
8.0
Conservative Christian 92.5
‡
1.1
0.6
‡
2.0
3.6
Other affiliated 87.7
0.7
2.2
1.4
‡
0.9
7.1 Unaffiliated 82.3
1.7
1.1
1.5
‡
1.7
11.6
Nonsectarian 26.0
23.0
4.7
16.5
‡
5.8
23.9 Regular 52.1
†
†
†
‡
†
47.9
Special emphasis †
68.4
14.1
†
‡
17.3
† Special education †
†
†
100.0
‡
†
†
School level Elementary 65.6
11.7
1.9
1.5
‡
1.3
18.1 Secondary 75.3
‡
3.1
11.3
‡
9.8
†
Combined 77.1
1.5
2.7
14.9
‡
3.5
0.3 Size (number of students)
Less than 50 46.4
13.9
1.9
7.7
‡
4.1
26.0 50–149 78.2
6.2
3.2
8.7
‡
2.8
0.9
150–299 93.3
1.5
2.0
2.4
‡
0.6
‡ 300–499 96.1
‡
2.3
0.8
‡
‡
‡
500–749 97.9
0.0
‡
‡
‡
‡
‡ 750 or more 98.7
0.0
‡
‡
‡
‡
‡
Region Northeast 62.6
6.1
2.2
10.1
‡
2.3
16.8
Midwest 81.3
6.5
1.1
3.0
‡
1.3
6.7 South 70.9
8.1
2.2
5.7
‡
3.1
10.0
West 61.2
11.6
3.5
5.5
‡
4.1
14.1 Urbanicity type
City 68.6
8.5
2.9
6.7
‡
2.4
10.8 Suburban 59.1
10.9
2.0
7.6
‡
2.4
18.0
Town 83.9
5.0
1.3
2.2
‡
1.9
5.7 Rural 81.5
3.6
1.9
4.2
‡
3.6
5.2
† Not applicable. ‡ Reporting standards not met. There are fewer than 15 sample cases.
NOTE: Detail may not sum to totals because of rounding or missing values in cells with too few sample cases. These estimates include private schools that provide instruction for one or more of grades kindergarten through 12 (or comparable ungraded levels).
SOURCE: U.S. Department of Education, National Center for Education Statistics, Private School Universe Survey (PSS), 2011–2012.

9
Table 4. Number and percentage distribution of private schools, by urbanicity type and selected school Table 4. characteristics: United States, 2011–12 School
characteristic Total City Suburban Town Rural
Number Percent Number Percent Number Percent Number Percent Number Percent
9519.9
32.83
8277
28.55
6202
21.39
Total 30,861
100.0
10,005
100.0
10,911
100.0
2,900
100.0
7,045
100.0 Private school typology
Catholic 6,873
22.3
2,833
28.3
2,492
22.8
933
32.2
614
8.7 Parochial 2,910
9.4
1,107
11.1
1,089
10.0
463
16.0
251
3.6
Diocesan 2,922
9.5
1,235
12.3
1,016
9.3
425
14.7
245
3.5 Private 1,041
3.4
491
4.9
387
3.5
45
1.6
118
1.7
Other religious 14,214
46.1
3,826
38.2
3,958
36.3
1,534
52.9
4,896
69.5 Conservative Christian 4,574
14.8
1,133
11.3
1,443
13.2
673
23.2
1,326
18.8
Other affiliated 3,060
9.9
1,120
11.2
1,060
9.7
277
9.6
603
8.6 Unaffiliated 6,579
21.3
1,573
15.7
1,455
13.3
584
20.1
2,967
42.1
Nonsectarian 9,775
31.7
3,346
33.4
4,461
40.9
433
14.9
1,535
21.8 Regular 4,882
15.8
1,620
16.2
2,300
21.1
187
6.4
775
11.0
Special emphasis 3,280
10.6
1,132
11.3
1,455
13.3
193
6.6
500
7.1 Special education 1,613
5.2
593
5.9
706
6.5
53
1.8
260
3.7
School level Elementary 19,697
63.8
6,583
65.8
7,470
68.5
1,735
59.8
3,908
55.5
Secondary 2,677
8.7
1,096
11.0
868
8.0
174
6.0
538
7.6 Combined 8,488
27.5
2,326
23.2
2,572
23.6
991
34.2
2,599
36.9
Program emphasis Regular elementary/ secondary 21,486
69.6
6,865
68.6
6,444
59.1
2,434
83.9
5,743
81.5
Montessori 2,439
7.9
846
8.5
1,194
10.9
145
5.0
254
3.6 Special program
emphasis 676
2.2
285
2.9
220
2.0
37
1.3
135
1.9 Special education 1,859
6.0
675
6.7
826
7.6
63
2.2
295
4.2
Vocational/technical ‡
‡
‡
‡
‡
‡
‡
‡
‡
‡ Alternative 813
2.6
244
2.4
259
2.4
56
1.9
254
3.6
Early childhood 3,583
11.6
1,085
10.8
1,968
18.0
165
5.7
364
5.2 Size (number of students)
Less than 50 13,459
43.6
3,399
34.0
4,736
43.4
1,147
39.5
4,177
59.3 50–149 7,667
24.8
2,419
24.2
2,414
22.1
1,110
38.3
1,724
24.5
150–299 5,488
17.8
2,260
22.6
2,037
18.7
464
16.0
727
10.3 300–499 2,447
7.9
1,041
10.4
1,015
9.3
138
4.7
253
3.6
500–749 1,103
3.6
511
5.1
458
4.2
34
1.2
100
1.4 750 or more 698
2.3
375
3.7
251
2.3
‡
‡
65
0.9 Region
Northeast 7,447
24.1
1,855
18.5
3,522
32.3
354
12.2
1,716
24.4 Midwest 7,963
25.8
2,084
20.8
2,196
20.1
1,184
40.8
2,498
35.5
South 9,203
29.8
3,257
32.6
3,022
27.7
839
28.9
2,085
29.6 West 6,249
20.2
2,809
28.1
2,170
19.9
523
18.0
747
10.6
‡ Reporting standards not met. There are fewer than 15 sample cases. NOTE: Detail may not sum to totals because of rounding or missing values in cells with too few sample cases. These estimates include
private schools that provide instruction for one or more of grades kindergarten through 12 (or comparable ungraded levels). SOURCE: U.S. Department of Education, National Center for Education Statistics, Private School Universe Survey (PSS), 2011–2012.

10
Table 5. Number and percentage distribution of private school students, by urbanicity type and Table 5. selected school characteristics: United States, 2011–12
School Total City Suburban Town Rural characteristic Number Percent Number Percent Number Percent Number Percent Number Percent
Total 4,494,845
100.0
1,900,639
100.0
1,672,501
100.0
300,842
100.0
620,862
100.0 Private school typology
Catholic 1,928,388
42.9
902,991
47.5
763,520
45.7
155,088
51.6
106,790
17.2 Parochial 728,669
16.2
306,755
16.1
308,215
18.4
74,708
24.8
38,991
6.3
Diocesan 830,813
18.5
394,447
20.8
315,826
18.9
73,740
24.5
46,800
7.5 Private 368,906
8.2
201,789
10.6
139,479
8.3
6,639
2.2
20,999
3.4
Other religious 1,676,649
37.3
620,859
32.7
581,312
34.8
113,854
37.8
360,625
58.1 Conservative Christian 630,557
14.0
195,115
10.3
238,667
14.3
49,897
16.6
146,877
23.7
Other affiliated 486,746
10.8
210,589
11.1
190,022
11.4
25,102
8.3
61,032
9.8 Unaffiliated 559,347
12.4
215,154
11.3
152,623
9.1
38,854
12.9
152,716
24.6
Nonsectarian 889,807
19.8
376,790
19.8
327,669
19.6
31,901
10.6
153,448
24.7 Regular 611,529
13.6
267,682
14.1
209,978
12.6
22,753
7.6
111,116
17.9
Special emphasis 173,773
3.9
67,403
3.5
71,294
4.3
7,182
2.4
27,894
4.5 Special education 104,505
2.3
41,706
2.2
46,396
2.8
1,965
0.7
14,438
2.3
School level Elementary 2,124,106
47.3
892,029
46.9
874,546
52.3
158,287
52.6
199,244
32.1
Secondary 757,448
16.9
389,023
20.5
264,184
15.8
27,282
9.1
76,958
12.4 Combined 1,613,291
35.9
619,587
32.6
533,771
31.9
115,273
38.3
344,661
55.5
Program emphasis Regular elementary/ secondary 4,103,932
91.3
1,751,852
92.2
1,502,206
89.8
287,502
95.6
562,372
90.6
Montessori 88,670
2.0
34,211
1.8
41,613
2.5
3,404
1.1
9,443
1.5 Special program
emphasis 84,365
1.9
36,089
1.9
30,542
1.8
3,237
1.1
14,497
2.3 Special education 117,262
2.6
47,014
2.5
52,690
3.2
2,301
0.8
15,258
2.5
Vocational/technical ‡
‡
‡
‡
‡
‡
‡
‡
‡
‡ Alternative 44,419
1.0
14,848
0.8
16,395
1.0
2,206
0.7
10,970
1.8
Early childhood 55,093
1.2
16,088
0.8
29,056
1.7
2,192
0.7
7,757
1.2 Size (number of students)
Less than 50 267,883
6.0
67,229
3.5
87,018
5.2
23,992
8.0
89,644
14.4 50–149 701,112
15.6
226,588
11.9
224,402
13.4
101,860
33.9
148,261
23.9
150–299 1,165,283
25.9
482,357
25.4
432,984
25.9
96,058
31.9
153,885
24.8 300–499 940,949
20.9
403,564
21.2
389,154
23.3
51,974
17.3
96,257
15.5
500–749 665,253
14.8
310,220
16.3
274,733
16.4
20,075
6.7
60,225
9.7 750 or more 754,365
16.8
410,681
21.6
264,210
15.8
‡
‡
72,590
11.7 Region
Northeast 1,078,014
24.0
396,813
20.9
513,328
30.7
32,304
10.7
135,569
21.8 Midwest 1,099,838
24.5
415,977
21.9
396,843
23.7
135,739
45.1
151,279
24.4
South 1,469,996
32.7
630,251
33.2
479,677
28.7
95,140
31.6
264,928
42.7 West 846,997
18.8
457,598
24.1
282,652
16.9
37,660
12.5
69,086
11.1
‡ Reporting standards not met. There are fewer than 15 sample cases. NOTE: Detail may not sum to totals because of rounding or missing values in cells with too few sample cases. These estimates include
private schools that provide instruction for one or more of grades kindergarten through 12 (or comparable ungraded levels). SOURCE: U.S. Department of Education, National Center for Education Statistics, Private School Universe Survey (PSS), 2011-2012.

11
Table 6. Number and percentage distribution of private school students, by grade and private school Table 6. typology: United States, 2011–12 Private school typology
Kindergarten1 First grade Second grade Third grade Fourth grade Number Percent Number Percent Number Percent Number Percent Number Percent
Total 449,819
100.0
348,731
100.0
340,234
100.0
336,148
100.0
328,950
100.0 Catholic 150,295
33.4
143,547
41.2
144,905
42.6
145,330
43.2
143,859
43.7
Parochial 75,788
16.8
72,980
20.9
74,190
21.8
74,278
22.1
73,479
22.3 Diocesan 64,433
14.3
61,853
17.7
62,038
18.2
62,172
18.5
61,613
18.7
Private 10,074
2.2
8,713
2.5
8,677
2.6
8,880
2.6
8,766
2.7 Other religious 182,306
40.5
146,368
42.0
139,696
41.1
136,513
40.6
132,819
40.4
Conservative Christian 65,399
14.5
53,203
15.3
51,203
15.0
50,382
15.0
48,626
14.8
Other affiliated 48,758
10.8
41,806
12.0
40,577
11.9
39,982
11.9
39,003
11.9 Unaffiliated 68,149
15.2
51,359
14.7
47,916
14.1
46,149
13.7
45,190
13.7
Nonsectarian 117,218
26.1
58,816
16.9
55,634
16.4
54,305
16.2
52,272
15.9 Regular 76,350
17.0
39,560
11.3
38,361
11.3
37,622
11.2
36,994
11.2
Special emphasis 39,271
8.7
17,521
5.0
14,855
4.4
13,379
4.0
11,077
3.4 Special education 1,597 0.4 1,735 0.5 2,418 0.7 3,304 1.0 4,201 1.3
Private school typology
Fifth grade Sixth grade Seventh grade Eighth grade Ninth grade Number Percent Number Percent Number Percent Number Percent Number Percent
Total 330,393
100.0
341,690
100.0
336,774
100.0
336,672
100.0
329,600
100.0 Catholic 145,608
44.1
150,067
43.9
147,092
43.7
147,694
43.9
156,419
47.5
Parochial 74,471
22.5
74,539
21.8
70,597
21.0
70,095
20.8
17,405
5.3 Diocesan 61,797
18.7
63,246
18.5
61,763
18.3
61,445
18.3
69,097
21.0
Private 9,340
2.8
12,282
3.6
14,732
4.4
16,154
4.8
69,917
21.2 Other religious 131,549
39.8
133,751
39.1
130,524
38.8
127,936
38.0
106,844
32.4
Conservative Christian 48,965
14.8
50,480
14.8
49,956
14.8
48,526
14.4
42,617
12.9
Other affiliated 38,413
11.6
39,069
11.4
37,666
11.2
37,683
11.2
31,019
9.4 Unaffiliated 44,171
13.4
44,202
12.9
42,902
12.7
41,727
12.4
33,208
10.1
Nonsectarian 53,236
16.1
57,872
16.9
59,158
17.6
61,042
18.1
66,338
20.1 Regular 37,573
11.4
42,449
12.4
44,292
13.2
45,083
13.4
50,250
15.2
Special emphasis 10,630
3.2
9,296
2.7
8,028
2.4
8,160
2.4
6,925
2.1 Special education 5,033 1.5 6,127 1.8 6,838 2.0 7,799 2.3 9,163 2.8
Private school typology
Tenth grade Eleventh grade Twelfth grade Ungraded Number Percent Number Percent Number Percent Number Percent Total 324,538
100.0
318,313
100.0
314,503
100.0
58,479
100.0
Catholic 152,561
47.0
148,381
46.6
148,592
47.2
4,040
6.9 Parochial 16,764
5.2
16,494
5.2
16,633
5.3
957
1.6
Diocesan 67,793
20.9
65,996
20.7
65,825
20.9
1,740
3.0 Private 68,004
21.0
65,891
20.7
66,134
21.0
1,343
2.3
Other religious 103,820
32.0
99,835
31.4
96,817
30.8
7,872
13.5 Conservative
Christian 41,505
12.8
39,900
12.5
38,062
12.1
1,732
3.0 Other affiliated 30,771
9.5
30,001
9.4
29,571
9.4
2,426
4.1
Unaffiliated 31,544
9.7
29,934
9.4
29,183
9.3
3,714
6.4 Nonsectarian 68,156
21.0
70,098
22.0
69,095
22.0
46,568
79.6
Regular 51,655
15.9
53,451
16.8
51,964
16.5
5,927
10.1 Special emphasis 7,289
2.2
7,691
2.4
7,485
2.4
12,165
20.8
Special education 9,212
2.8
8,956
2.8
9,646
3.1
28,475
48.7 1 The count for kindergarten students also includes transitional kindergarten and transitional first-grade students. NOTE: Detail may not sum to totals because of rounding or missing values in cells with too few sample cases. These estimates include
private schools that provide instruction for one or more of grades kindergarten through 12 (or comparable ungraded levels). SOURCE: U.S. Department of Education, National Center for Education Statistics, Private School Universe Survey (PSS), 2011–2012.
12
Table 7. Average private school size, by school level and selected school characteristics: Table 7. United States, 2011–12 School
characteristic Average number of students
Total Elementary Secondary Combined Total 145.6
107.8
283.0
190.1
Private school typology Catholic 280.6
227.2
535.5
336.2
Parochial 250.4
237.8
439.5
348.4 Diocesan 284.4
229.5
534.1
325.1
Private 354.4
146.9
568.9
338.4 Other religious 118.0
74.7
140.8
176.9
Conservative Christian 137.8
91.2
129.4
164.5 Other affiliated 159.1
106.7
164.5
272.3
Unaffiliated 85.0
54.9
126.8
150.5 Nonsectarian 91.0
47.3
103.7
195.4
Regular 125.3
51.1
185.4
361.1 Special emphasis 53.0
41.9
60.9
113.9
Special education 64.8
47.7
42.9
73.9 Program emphasis
Regular elementary/ secondary 191.0
149.6
357.5
221.5
Montessori 36.4
34.0
‡
77.4 Special program emphasis 124.8
88.9
140.5
176.4
Special education 63.1
46.7
42.8
71.7 Vocational/technical ‡
‡
‡
‡
Alternative 54.6
44.4
43.8
72.7 Early childhood 15.4
15.3
†
23.7
Size (number of students) Less than 50 19.9
18.6
21.4
24.0
50–149 91.4
93.3
88.9
88.6 150–299 212.3
210.6
218.0
214.8
300–499 384.6
383.6
387.0
385.1 500–749 603.1
589.0
607.4
610.8
750 or more 1080.8
942.4
1049.6
1120.4 Region
Northeast 144.8
101.4
285.1
196.8 Midwest 138.1
113.6
350.8
143.0
South 159.7
109.1
256.8
212.4 West 135.5
106.1
236.2
180.7
Urbanicity type City 190.0
135.5
354.9
266.4
Suburban 153.3
117.1
304.3
207.5 Town 103.7
91.2
156.8
116.4
Rural 88.1
51.0
142.9
132.6 † Not applicable.
‡ Reporting standards not met. There are fewer than 15 sample cases. NOTE: These estimates include private schools that provide instruction for one or more of grades kindergarten through 12 (or
comparable ungraded levels). SOURCE: U.S. Department of Education, National Center for Education Statistics, Private School Universe Survey (PSS), 2011–2012.

13
Table 8. Number and percentage distribution of private schools, by school size and selected school Table 8. characteristics: United States, 2011–12
School characteristic
Less than 50 students
50–149 students
150–299 students
300–499 students
500–749 students
750 or more students
Number Percent Number Percent Number Percent Number Percent Number Percent Number Percent Total 13,459
43.6
7,667
24.8
5,488
17.8
2,447
7.9
1,103
3.6
698
2.3
Private school typology Catholic 399
5.8
1,559
22.7
2,688
39.1
1,323
19.3
606
8.8
297
4.3
Parochial 104
3.6
686
23.6
1,310
45.0
589
20.2
178
6.1
44
1.5 Diocesan 106
3.6
684
23.4
1,170
40.0
559
19.1
283
9.7
120
4.1
Private 189
18.2
190
18.3
209
20.0
176
16.9
145
13.9
133
12.8 Other religious 6,977
49.1
3,954
27.8
1,982
13.9
730
5.1
326
2.3
245
1.7
Conservative Christian 1,751
38.3
1,511
33.0
796
17.4
290
6.3
135
2.9
92
2.0
Other affiliated 1,074
35.1
973
31.8
593
19.4
227
7.4
106
3.5
88
2.9 Unaffiliated 4,152
63.1
1,470
22.3
594
9.0
214
3.2
85
1.3
65
1.0
Nonsectarian 6,083
62.2
2,154
22.0
817
8.4
393
4.0
172
1.8
157
1.6 Regular 2,953
60.5
776
15.9
523
10.7
326
6.7
155
3.2
150
3.1
Special emphasis 2,256
68.8
781
23.8
174
5.3
48
1.5
‡
‡
‡
‡ Special education 873
54.1
597
37.0
121
7.5
19
1.2
‡
‡
‡
‡ School level
Elementary 9,829
49.9
4,592
23.3
3,544
18.0
1,333
6.8
340
1.7
58
0.3 Secondary 763
28.5
533
19.9
434
16.2
381
14.2
320
12.0
245
9.2
Combined 2,866
33.8
2,542
29.9
1,510
17.8
732
8.6
443
5.2
395
4.7 Program emphasis
Regular elementary/ secondary 6,249
29.1
5,995
27.9
5,123
23.8
2,350
10.9
1,080
5.0
689
3.2
Montessori 1,871
76.7
477
19.5
84
3.4
‡
‡
0
0.0
0
0.0 Special program
emphasis 251
37.2
242
35.7
110
16.2
55
8.2
‡
‡
‡
‡ Special education 1,032
55.5
671
36.1
133
7.1
21
1.1
‡
‡
‡
‡ Vocational/technical ‡
‡
‡
‡
‡
‡
‡
‡
‡
‡
‡
‡ Alternative 551
67.8
212
26.0
31
3.9
‡
‡
‡
‡
‡
‡ Early childhood 3,503
97.8
69
1.9
‡
‡
‡
‡
‡
‡
‡
‡ Region
Northeast 3,468
46.6
1,615
21.7
1,389
18.7
578
7.8
227
3.0
171
2.3 Midwest 3,341
42.0
2,223
27.9
1,345
16.9
619
7.8
304
3.8
131
1.6
South 3,761
40.9
2,378
25.8
1,602
17.4
795
8.6
387
4.2
280
3.0 West 2,888
46.2
1,452
23.2
1,152
18.4
455
7.3
185
3.0
117
1.9
Urbanicity type City 3,399
34.0
2,419
24.2
2,260
22.6
1,041
10.4
511
5.1
375
3.7
Suburban 4,736
43.4
2,414
22.1
2,037
18.7
1,015
9.3
458
4.2
251
2.3 Town 1,147
39.5
1,110
38.3
464
16.0
138
4.7
34
1.2
‡
‡ Rural 4,177
59.3
1,724
24.5
727
10.3
253
3.6
100
1.4
65
0.9
‡ Reporting standards not met. There are fewer than 15 sample cases. NOTE: Detail may not sum to totals because of rounding or missing values in cells with too few sample cases. These estimates include
private schools that provide instruction for one or more of grades kindergarten through 12 (or comparable ungraded levels). SOURCE: U.S. Department of Education, National Center for Education Statistics, Private School Universe Survey (PSS), 2011–2012.

14
Table 9. Percentage distribution of private school students, by racial/ethnic background and selected
Table 9. school characteristics: United States, 2011–12
School characteristic
Non-Hispanic
American
Indian Pacific
Islander Two or more
races Hispanic Asian Black White Total 10.0
0.5
5.5
8.9
0.6
71.2
3.4
Private school typology Catholic 14.0
0.5
4.7
7.4
0.6
69.3
3.5
Parochial 14.9
0.3
4.7
6.6
0.6
69.8
3.2 Diocesan 13.3
0.5
4.5
7.2
0.7
70.1
3.7
Private 13.7
0.9
5.0
9.4
0.7
66.9
3.6 Other religious 6.5
0.4
4.6
10.0
0.6
75.4
2.5
Conservative Christian 7.9
0.5
4.8
11.3
0.5
72.3
2.7 Other affiliated 6.4
0.4
5.1
8.6
0.7
75.9
2.9
Unaffiliated 5.1
0.3
3.9
9.7
0.6
78.4
1.9 Nonsectarian 7.7
0.6
8.9
10.3
0.5
67.1
4.8
Regular 7.0
0.6
9.2
8.8
0.6
68.9
5.0 Special emphasis 7.5
0.7
11.7
8.8
0.6
65.4
5.3
Special education 12.7
0.8
3.0
21.0
0.3
59.5
2.8 School level
Elementary 11.6
0.5
5.5
8.8
0.6
69.4
3.6 Secondary 11.9
0.3
5.5
9.1
0.4
69.8
3.0
Combined 7.0
0.5
5.4
9.1
0.7
74.1
3.2 Program emphasis
Regular elementary/ secondary 10.0
0.5
5.2
8.5
0.6
71.9
3.3
Montessori 8.1
0.5
14.5
6.9
0.7
63.6
5.7 Special program emphasis 5.9
0.5
11.8
6.7
0.4
69.7
4.9
Special education 12.4
0.7
2.8
21.1
0.3
59.8
2.9 Vocational/technical ‡
‡
‡
‡
‡
‡
‡ Alternative 10.5
1.3
3.6
19.3
0.4
61.5
3.4
Early childhood 10.1
0.5
7.2
11.4
1.0
66.2
3.5 Size (number of students)
Less than 50 9.4
0.8
4.9
12.9
0.5
68.6
2.9 50–149 9.8
0.8
5.1
13.2
0.5
67.7
2.9
150–299 12.7
0.4
5.8
10.7
0.6
66.2
3.6 300–499 9.4
0.4
5.9
7.0
0.5
73.4
3.4
500–749 8.5
0.4
5.0
5.9
0.6
76.3
3.3 750 or more 8.1
0.3
5.5
5.9
0.9
75.6
3.6
Region Northeast 7.8
0.2
5.2
9.8
0.2
74.1
2.6
Midwest 6.4
0.5
3.2
7.9
0.3
79.3
2.5 South 10.3
0.3
4.0
11.3
0.3
71.1
2.6
West 16.8
1.1
11.3
5.0
2.1
56.8
6.9 Urbanicity type
City 12.6
0.4
6.3
11.4
0.7
64.5
4.0 Suburban 9.7
0.3
5.9
8.6
0.6
71.7
3.3
Town 6.1
0.8
2.2
3.3
0.7
84.7
2.1 Rural 4.7
1.1
3.4
4.9
0.3
83.5
2.1
‡ Reporting standards not met. There are fewer than 15 sample cases. NOTE: Detail may not sum to totals because of rounding or missing values in cells with too few sample cases. These estimates include
private schools that provide instruction for one or more of grades kindergarten through 12 (or comparable ungraded levels). Hispanic includes Latino, American Indian includes Native American, Black includes African American, and Pacific Islander includes Native Hawaiian.
SOURCE: U.S. Department of Education, National Center for Education Statistics, Private School Universe Survey (PSS), 2011–2012.

15
Table 10. Percentage male enrollment in private schools and percentage distribution of private Table 10. Table 10.
schools, by coeducational category and selected school characteristics: United States, by coeducational category and selected school characteristics: United States, 2011–12
School
characteristic Percent
male enrollment Coeducational category
Coed schools All-girls schools All-boys schools Total 51.3
95.8
1.8
2.3
Private school typology Catholic 50.8
93.7
3.5
2.9
Parochial 50.4
98.8
0.9
‡ Diocesan 50.5
97.7
1.2
1.1
Private 52.3
68.0
17.0
15.0 Other religious 51.0
96.4
1.4
2.2
Conservative Christian 50.9
99.4
‡
0.4 Other affiliated 50.6
92.4
3.4
4.2
Unaffiliated 51.4
96.2
1.3
2.5 Nonsectarian 53.0
96.6
1.3
2.2
Regular 50.6
97.0
1.6
1.4 Special emphasis 52.5
97.0
0.7
2.3
Special education 68.2
94.2
1.5
4.3 School level
Elementary 50.8
98.9
0.4
0.6 Secondary 52.1
72.5
12.4
15.1
Combined 51.5
96.1
1.7
2.2 Program emphasis
Regular elementary/ secondary 50.9
95.3
2.3
2.4
Montessori 50.9
99.8
‡
‡ Special program emphasis 50.2
95.7
‡
2.8
Special education 67.6
93.6
1.6
4.8 Vocational/technical ‡
‡
‡
‡
Alternative 57.3
85.7
3.4
10.8 Early childhood 44.6
99.8
‡
0.0
Size (number of students) Less than 50 52.9
97.6
0.8
1.6
50–149 53.6
96.7
1.1
2.2 150–299 51.2
96.0
2.1
2.0
300–499 50.0
92.2
4.5
3.3 500–749 47.2
85.2
10.0
4.8
750 or more 53.9
80.9
5.4
13.7 Region
Northeast 51.4
91.2
3.7
5.1 Midwest 51.4
97.9
1.0
1.1
South 51.4
97.0
1.3
1.7 West 50.8
97.0
1.5
1.5
Urbanicity type City 51.0
93.6
3.2
3.2
Suburban 51.3
96.2
1.7
2.1 Town 51.8
99.1
‡
0.6
Rural 52.1
97.1
0.7
2.2 ‡ Reporting standards not met. There are fewer than 15 samples cases. NOTE: Detail may not sum to totals because of rounding or missing values in cells with too few sample cases. These
estimates include private schools that provide instruction for one or more of grades kindergarten through 12 (or comparable ungraded levels).
SOURCE: U.S. Department of Education, National Center for Education Statistics, Private School Universe Survey (PSS), 2011–2012.

16
Table 11. Number and percentage distribution of private school teachers (headcount), by work status Table 11. and selected characteristics: United States, 2011–12 Selected characteristic
Work status
3/4 time but
less than 100% 1/2 time but less than 3/4
1/4 time but less than 1/2
Less than 1/4 time Total
Full time
Number Percent Number Percent Number Percent Number Percent Number Percent Number Percent Total 466,467
100.0
365,566
78.4
21,379
4.6
42,260
9.1
21,187
4.5
16,075
3.4
Private school typology Catholic 148,754
100.0
124,032
83.4
5,580
3.8
10,654
7.2
5,450
3.7
3,038
2.0
Parochial 53,405
100.0
44,037
82.5
2,018
3.8
4,118
7.7
2,205
4.1
1,027
1.9 Diocesan 62,411
100.0
52,041
83.4
2,340
3.8
4,559
7.3
2,214
3.5
1,257
2.0
Private 32,938
100.0
27,954
84.9
1,221
3.7
1,977
6.0
1,031
3.1
754
2.3 Other religious 186,703
100.0
135,651
72.7
9,591
5.1
22,199
11.9
10,846
5.8
8,416
4.5
Conservative Christian 67,218
100.0
51,206
76.2
3,106
4.6
6,106
9.1
3,656
5.4
3,145
4.7
Other affiliated 57,492
100.0
39,373
68.5
3,063
5.3
8,639
15.0
3,746
6.5
2,672
4.6 Unaffiliated 61,992
100.0
45,072
72.7
3,422
5.5
7,454
12.0
3,444
5.6
2,600
4.2
Nonsectarian 131,010
100.0
105,883
80.8
6,209
4.7
9,407
7.2
4,891
3.7
4,620
3.5 Regular 80,979
100.0
66,249
81.8
3,755
4.6
5,751
7.1
2,829
3.5
2,395
3.0
Special emphasis 29,705
100.0
21,179
71.3
1,944
6.5
2,904
9.8
1,775
6.0
1,903
6.4 Special education 20,326
100.0
18,455
90.8
510
2.5
752
3.7
287
1.4
322
1.6
School level Elementary 205,486
100.0
157,362
76.6
10,735
5.2
20,206
9.8
9,829
4.8
7,354
3.6
Secondary 72,143
100.0
57,486
79.7
2,898
4.0
5,543
7.7
3,555
4.9
2,661
3.7 Combined 188,838
100.0
150,717
79.8
7,747
4.1
16,511
8.7
7,804
4.1
6,059
3.2
Program emphasis Regular elementary/ secondary 396,732
100.0
312,513
78.8
17,398
4.4
36,360
9.2
17,893
4.5
12,568
3.2
Montessori 16,697
100.0
11,939
71.5
1,210
7.2
1,570
9.4
839
5.0
1,139
6.8 Special program
emphasis 12,593
100.0
8,220
65.3
825
6.6
1,592
12.6
1,063
8.4
893
7.1 Special education 22,743
100.0
20,403
89.7
623
2.7
948
4.2
381
1.7
388
1.7
Vocational/technical ‡
‡
‡
‡
‡
‡
‡
‡
‡
‡
‡
‡ Alternative 7,441
100.0
5,533
74.4
436
5.9
648
8.7
438
5.9
387
5.2
Early childhood 10,161
100.0
6,870
67.6
883
8.7
1,139
11.2
573
5.6
696
6.9 Size (number of
students) Less than 50 53,936
100.0
37,281
69.1
3,443
6.4
5,510
10.2
3,478
6.4
4,224
7.8
50–149 92,880
100.0
67,799
73.0
4,754
5.1
9,686
10.4
5,895
6.3
4,747
5.1 150–299 113,066
100.0
87,021
77.0
5,766
5.1
11,077
9.8
5,956
5.3
3,246
2.9
300–499 84,292
100.0
69,292
82.2
3,572
4.2
7,061
8.4
2,693
3.2
1,675
2.0 500–749 56,365
100.0
48,090
85.3
2,091
3.7
3,801
6.7
1,394
2.5
989
1.8
750 or more 65,926
100.0
56,082
85.1
1,753
2.7
5,125
7.8
1,773
2.7
1,193
1.8 Region
Northeast 123,182
100.0
93,425
75.8
5,636
4.6
13,102
10.6
6,600
5.4
4,419
3.6 Midwest 101,551
100.0
79,271
78.1
4,108
4.0
9,851
9.7
4,753
4.7
3,567
3.5
South 158,248
100.0
128,943
81.5
6,758
4.3
12,020
7.6
5,869
3.7
4,660
2.9 West 83,485
100.0
63,927
76.6
4,877
5.8
7,288
8.7
3,965
4.7
3,428
4.1
Urbanicity type City 191,010
100.0
151,107
79.1
8,825
4.6
17,117
9.0
8,125
4.3
5,836
3.1
Suburban 172,589
100.0
134,621
78.0
8,281
4.8
16,002
9.3
7,851
4.5
5,835
3.4 Town 31,946
100.0
24,384
76.3
1,348
4.2
2,899
9.1
1,798
5.6
1,517
4.7
Rural 70,920
100.0
55,453
78.2
2,926
4.1
6,242
8.8
3,413
4.8
2,887
4.1 ‡ Reporting standards not met. There are fewer than 15 sample cases.
NOTE: Detail may not sum to totals because of rounding or missing values in cells with too few sample cases. The teacher estimates in this table are headcounts. These estimates include private schools that provide instruction for one or more of grades kindergarten through 12 (or comparable ungraded levels).
SOURCE: U.S. Department of Education, National Center for Education Statistics, Private School Universe Survey (PSS), 2011–2012.

17
Table 12. Pupil/teacher ratio of private schools, by school level and selected characteristics: United
Table 12. States, 2011–12 Selected characteristic
School level Total Elementary Secondary Combined
Total 10.7
11.5
11.6
9.4 Private school typology
Catholic 14.0
14.6
13.6
11.0 Parochial 14.8
15.0
13.4
12.7
Diocesan 14.3
14.7
14.3
11.2 Private 12.0
11.0
12.9
10.3
Other religious 10.3
10.3
9.8
10.3 Conservative Christian 10.6
10.2
11.8
10.7
Other affiliated 9.9
10.0
9.3
9.9 Unaffiliated 10.3
10.7
9.8
10.0
Nonsectarian 7.4
7.1
6.9
7.8 Regular 8.2
7.7
7.7
8.6
Special emphasis 6.8
6.4
6.2
8.0 Special education 5.4
5.2
5.1
5.4
Program emphasis Regular elementary/ secondary 11.4
12.6
12.2
9.9
Montessori 6.1
5.9
‡
8.4 Special program emphasis 8.1
7.7
6.8
9.0
Special education 5.4
5.3
5.2
5.4 Vocational/technical ‡
‡
‡
‡
Alternative 6.8
7.2
6.9
6.6 Early childhood 6.4
6.4
†
4.6
Size (number of students) Less than 50 5.9
6.2
4.8
5.4
50–149 8.7
9.5
7.5
7.7 150–299 11.5
13.0
9.8
9.4
300–499 12.1
14.1
11.0
9.9 500–749 12.6
16.3
13.4
10.3
750 or more 12.2
16.1
14.3
11.0 Region
Northeast 9.8
11.2
10.4
8.1 Midwest 12.0
12.8
13.0
9.9
South 10.1
10.4
11.6
9.7 West 11.3
12.0
12.0
10.1
Urbanicity type City 11.0
11.7
12.6
9.4
Suburban 10.7
11.7
11.6
9.1 Town 10.6
11.4
10.7
9.8
Rural 9.8
10.3
8.5
9.8 † Not applicable.
‡ Reporting standards not met. There are fewer than 15 sample cases. NOTE: These estimates include private schools that provide instruction for one or more of grades kindergarten through 12 (or
comparable ungraded levels). SOURCE: U.S. Department of Education, National Center for Education Statistics, Private School Universe Survey (PSS), 2011–2012.

18
Table 13. Percentage of private schools with 12th-graders, number of graduates, graduation rate, and Table 13. Table 13.
percentage of graduates who attended 4-year colleges, by selected characteristics: United States, 2010–11
Selected characteristic
Percent of schools
with 12th-graders in 2010–11
Number of 2010–11
graduates
2010–11 graduation
rate1
Percent of 2010–11 graduates
who attended 4-year colleges
by fall 2011
Total 27.7
305,842
97.8
64.2 Private school typology
Catholic 19.6
147,577
99.0
85.7 Parochial 6.7
16,763
99.3
85.1
Diocesan 20.0
66,002
98.7
84.5 Private 54.6
64,812
99.3
87.1
Other religious 33.1
95,324
97.8
62.1 Conservative Christian 53.3
37,770
98.2
60.3
Other affiliated 29.9
28,724
98.0
69.0 Unaffiliated 20.6
28,830
97.1
60.5
Nonsectarian 25.4
62,940
95.2
56.1 Regular 24.2
50,421
98.6
77.4
Special emphasis 13.2
6,466
91.3
55.0 Special education 54.0
6,053
76.2
22.5
School level Elementary † † † †
Secondary 92.7 178,309 98.3 71.1 Combined2 71.0 127,533 97.2 61.4
Program emphasis Regular elementary/ secondary 32.2
289,168
98.7
69.8
Montessori 1.2
237 ! 96.1
86.8 Special program emphasis 33.7
5,392
97.6
79.9
Special education 51.6
6,689
75.6
22.9 Vocational/technical ‡
‡
‡
‡ Alternative 49.9
4,122
87.1
39.3
Early childhood †
†
†
† Size (number of students)
Less than 50 15.2
9,042
85.3
39.2 50–149 30.4
23,519
91.5
52.6
150–299 31.6
44,641
97.9
74.6 300–499 43.1
57,630
99.1
83.8
500–749 67.7
69,617
98.8
88.2 750 or more 91.1
101,392
99.3
89.9
Region Northeast 24.9
84,020
97.4
63.8
Midwest 22.1
69,471
98.1
63.1 South 36.3
97,835
98.3
66.7
West 25.4
54,516
97.3
60.7 Urbanicity type
City 27.7
141,540
98.0
69.0 Suburban 24.6
106,793
97.8
66.1
Town 29.3
14,394
98.1
57.2 Rural 31.7
43,114
97.4
58.8
† Not applicable. ! Interpret data with caution. The coefficient of variation for this estimate is between 30 and 50 percent (i.e., the standard error is at least 30 percent and less than 50 percent of the estimate). ‡ Reporting standards not met. There are fewer than 15 samples cases. 1 The 2010–11 graduation rate is the percent of 12th-graders enrolled around October 1, 2010 who graduated in 2010–11. 2 Includes the schools that reported 12th-grade enrollment for 2010–11, but were elementary in 2011–12 (less than 1 percent). NOTE: Detail mail not sum to totals because of rounding or missing values in cells with too few sample cases. These estimates include private schools that provide instruction for one or more of grades kindergarten through 12 (or comparable ungraded levels). SOURCE: U.S. Department of Education, National Center for Education Statistics, Private School Universe Survey (PSS), 2011-2012.

19
Table 14. Number of private schools, students, and teachers (headcount), by school membership in Table 14. private school associations: United States, 2011–12
Association Schools Students Teachers Total 30,861
4,494,845
466,467
None 10,212
710,000
82,644 Religious
Accelerated Christian Education 1,073
43,026
6,060 American Association of Christian Schools 719
77,367
8,929
Association of Christian Schools International 2,948
524,299
53,757 Association of Christian Teachers and Schools 195
26,440
2,704
Association of Classical and Christian Schools 189
31,169
3,853 Christian Schools International 321
69,740
6,698
Evangelical Lutheran Education Association 163
15,217
1,477 Friends Council on Education 67
16,859
2,402
General Conference of the Seventh-Day Adventist Church 549
36,355
3,410 Islamic School League of America 78
11,510
1,452
Jesuit Secondary Education Association 50
44,268
3,411 National Association of Episcopal Schools 282
80,019
9,970
National Catholic Educational Association 5,740
1,682,048
128,513 National Christian School Association 141
33,637
3,181
National Society of Hebrew Day Schools 262
76,865
10,193 Oral Roberts University Educational Fellowship 53
10,403
1,053
The Jewish Community Day School Network 108
20,588
3,662 Solomon Schechter Day School Assocation 44
9,762
1,645
Southern Baptist Association of Christian Schools 119
25,112
2,555 Other religious school associations 1,945
340,521
33,626
Special emphasis American Montessori Society 1,334
61,729
11,567
Association Montessori International 587
25,151
3,340 Other Montessori associations 693
28,638
5,335
Association of Military Colleges and Schools 21
4,335
583 Association of Waldorf Schools of North America 112
16,491
2,536
National Association of Private Special Education Centers 247
27,435
4,036 Other associations for exceptional children 291
27,750
4,567
European Council for International Schools ‡
‡
‡ National Association for the Education of Young Children 1,378
106,953
13,158
National Association of Laboratory Schools 21
2,613
378 National Coalition of Girls' Schools 89
33,907
4,830
Other special emphasis school associations 796
108,296
12,632
Other school associations or organizations Alternative School Network 25
2,317
449
National Association of Independent Schools 1,472
601,970
79,874 State or regional independent school association 2,259
656,934
77,862
National Coalition of Alternative Community Schools 32
1,968
333 National Independent Private School Association 201
34,374
4,269
The Association of Boarding Schools 238
77,704
11,404 Other school associations 3,587
707,505
74,208
‡ Reporting standards not met. There are fewer than 15 sample cases. NOTE: Details do not sum to total because private schools may belong to more than one association. These estimates
include private schools that provide instruction for one or more of grades kindergarten through 12 (or comparable ungraded levels).
SOURCE: U.S. Department of Education, National Center for Education Statistics, Private School Universe Survey (PSS),
2011–2012.

20
Table 15. Number of private schools, students, full-time equivalent (FTE) teachers, and 2010-11 high
Table 15. school graduates, by state: United States, 2011–12 FTE High school
State Schools Students teachers graduates 2010–11 United States 30,861
4,494,845
420,880
305,842
Alabama 402
67,479
6,208
4,721 Alaska 51
4,087
420
218
Arizona 341
43,134
3,809
2,646 Arkansas 234 ! 25,164
2,642
1,495
California 3,479
523,088
44,268
34,381 Colorado 414
45,697
4,877
2,892
Connecticut 406
58,399
7,077
5,959 Delaware 124
21,667
2,056
1,774
District of Columbia 79
15,368
1,957
1,513 Florida 1,880
284,238
26,435
20,060
Georgia 710
120,488
13,005
7,761 Hawaii 134
33,994
3,013
2,760
Idaho 124
11,262
986
583 Illinois 1,572
226,265
19,149
14,502
Indiana 969
111,872
8,896
5,622 Iowa 300
58,180
4,702
‡ Kansas 404 ! 39,016
3,526
2,260
Kentucky 329
60,590
5,239
4,127 Louisiana 394
112,645
8,827
7,508
Maine 157
17,011
2,001
2,601 Maryland 736
117,657
12,429
8,834
Massachusetts 803
112,684
14,064
10,134 Michigan 791
116,461
9,290
7,287
Minnesota 504
76,693
6,420
4,705 Mississippi 221
45,419
4,122
3,250
Missouri 1,270 ! 115,553
10,508
7,527 Montana 111
8,561
976
433
Nebraska 222
36,163
2,839
2,304 Nevada 157
20,396
1,594
899
New Hampshire 278
21,264
2,667
2,522 New Jersey 1,289
166,508
16,847
12,979
New Mexico 174
19,360
1,944
1,275 New York 1,931
430,293
41,454
30,441
North Carolina 642
106,661
10,685
6,312 North Dakota 46
6,535
588
‡ Ohio 968
190,810
15,269
12,858
Oklahoma 181
30,063
3,002
1,764 Oregon 432
42,694
3,818
2,974
Pennsylvania 2,325
240,993
21,959
16,366 Rhode Island 144
22,539
2,362
2,019
South Carolina 378
47,259
5,001
2,957 South Dakota 74
10,266
965
653
Tennessee 512
81,499
8,150
5,857 Texas 1,502
223,469
23,360
12,838
Utah 160
15,498
1,620
1,213 Vermont 114
8,323
1,199
999
Virginia 755
98,439
10,981
6,402 Washington 633
77,279
7,127
4,208
West Virginia 124
11,890
1,126
660 Wisconsin 844
112,025
9,153
5,420
Wyoming 38
1,947
265
‡ ! Interpret data with caution. The coefficient of variation for this estimate is between 30 and 50 percent (i.e., the standard error is at least 30
percent and less than 50 percent of the estimate). ‡ Reporting standards not met. There are fewer than 15 samples cases or the coefficient of variation (CV) for this estimate is 50 percent or
greater (i.e., the standard error is 50 percent or more of the estimate). NOTE: Detail may not sum to totals because of rounding or missing values in cells with too few sample cases. These estimates include
private schools that provide instruction for one or more of grades kindergarten through 12 (or comparable ungraded levels). SOURCE: U.S. Department of Education, National Center for Education Statistics, Private School Universe Survey (PSS), 2011–2012.

A-1
Appendix A—Glossary
Full-time equivalent (FTE) Full-time equivalent (FTE) quantifies teachers in proportion to a full-time teacher. Private school teachers are assigned an FTE based on respondent-provided information on the number of teachers in each full-time and part-time work status category in item 11.
•
•
•
•
•
FTE = 1.000: A teacher works full time.
FTE = .875: A teacher works at least 3/4 time but less than full time.
FTE = .625: A teacher works at least 1/2 time but less than 3/4 time.
FTE = .375: A teacher works at least 1/4 time but less than 1/2 time.
FTE = .125: A teacher works less than 1/4 time. The number of FTE teachers is calculated by summing the number of FTEs in each work status category.
Graduation rate The graduation rate is the number of 2010–11 graduates divided by the number of 12th-grade students enrolled around October 1, 2010.
Kindergarten-terminal school A school is kindergarten-terminal (k-terminal) if kindergarten is the highest grade offered at the school.
Private school A private school is a school that is not supported primarily by public funds. It must provide classroom instruction for one or more of grades K–12 (or comparable ungraded levels), and have one or more teachers. Organizations or institutions that provide support for home schooling but do not offer classroom instruction for students are not included.
Program emphasis
•
•
Private schools are classified by respondents in item 12a according to one of seven types of program emphasis that best describes the school:
Regular: The PSS questionnaire does not provide a definition of this term. Regular schools do not specialize in special, vocational/technical, or alternative education; or in having a Montessori or special program emphasis, although they may offer these programs in addition to the regular curriculum.
Montessori: The PSS questionnaire does not provide a definition of this term. Montessori schools provide instruction using Montessori teaching methods.

A-2
•
•
•
•
•
Special program emphasis: A science/mathematics school, a performing arts high school, a foreign language immersion school, and a talented/gifted school are examples of schools that offer a special program emphasis.
Special education: Special education schools primarily serve students with disabilities.
Career/Technical/Vocational: Career/Technical/Vocational schools primarily serve students who are being trained for occupations.
Alternative: Alternative schools provide nontraditional education. They fall outside the categories of regular, special education, and vocational education.
Early childhood: Early childhood program schools serve students in prekindergarten, kindergarten, transitional (or readiness) kindergarten, and/or transitional first (or prefirst) grade.
Region Private schools are assigned to one of four geographic regions:
•
•
•
•
Northeast: Maine, New Hampshire, Vermont, Massachusetts, Rhode Island, Connecticut, New York, New Jersey, and Pennsylvania;
Midwest: Ohio, Indiana, Illinois, Michigan, Wisconsin, Minnesota, Iowa, Missouri, North Dakota, South Dakota, Nebraska, and Kansas;
South: Delaware, Maryland, District of Columbia, Virginia, West Virginia, North Carolina, South Carolina, Georgia, Florida, Kentucky, Tennessee, Alabama, Mississippi, Arkansas, Louisiana, Oklahoma, and Texas; and
West: Montana, Idaho, Wyoming, Colorado, New Mexico, Arizona, Utah, Nevada, Washington, Oregon, California, Alaska, and Hawaii.
School level Private schools are classified using respondent-provided highest and lowest grades in the school in item 5 according to one of three instructional levels:
•
•
•
Elementary: A school is elementary if it has one or more of grades K–6 and does not have any grade higher than grade 8; for example, schools with grades PK–K, K–6, 1–3, or 6–8 are classified as elementary schools.
Secondary: A school is secondary if it has one or more of grades 7–12 and does not have any grade lower than grade 7; for example, schools with grades 9–12, 7–8, 10–12, or 7–9 are classified as secondary schools.
Combined: A school is classified as combined if it has one or more of grades K–6 and one or more of grades 9–12; for example, schools with grades K–12, 6–12, 6–9, or 1–12 are classified as having combined grades. Schools in which all students are ungraded (i.e., not classified by standard grade levels) are also classified as combined.

A-3
Teacher Any full-time or part-time school staff member who teaches one or more regularly scheduled classes in any of grades K–12 (or comparable ungraded levels).
Transitional Kindergarten or Transitional First Extra year of school for either kindergarten-age children who are judged not ready for kindergarten, or for children who have attended kindergarten but have been judged not ready for the first grade.
Typology Private schools are assigned to one of three major categories (Catholic, other religious, or nonsectarian) and, within each major category, one of three subcategories based on the school’s religious affiliation provided by respondents in item 14.
•
•
•
Catholic: Catholic schools are categorized according to governance, provided by Catholic school respondents in item 14c, into parochial, diocesan, and private schools.
Other religious: Other religious schools have a religious orientation or purpose, but are not Roman Catholic. Other religious schools are categorized according to religious association membership, provided by respondents in item 15, into Conservative Christian, other affiliated and unaffiliated schools. Conservative Christian schools are those “Other religious” schools with membership in at least one of four associations: Accelerated Christian Education, American Association of Christian Schools, Association of Christian Schools International, or Oral Roberts University Education Fellowship. Other affiliated schools are those “Other religious” schools not classified as Conservative Christian with membership in at least 1 of 11 associations—Association of Christian Teachers and Schools, Christian Schools International, Evangelical Lutheran Education Association, Friends Council on Education, General Conference of the Seventh-Day Adventist Church, Islamic School League of America, National Association of Episcopal Schools, National Christian School Association, National Society for Hebrew Day Schools, Solomon Schechter Day Schools, Southern Baptist Association of Christian Schools—or indicating membership in “other religious school associations.” Unaffiliated schools are those “Other religious” schools that have a religious orientation or purpose, but are not classified as Conservative Christian or affiliated.
Nonsectarian: Nonsectarian schools do not have a religious orientation or purpose and are categorized according to program emphasis, provided by respondents in item 12a, into regular, special emphasis, and special education schools. Regular schools are those that have a regular elementary/secondary or early childhood program emphasis. Special emphasis schools are those that have a Montessori, career/technical/vocational, alternative, or special program emphasis. Special education schools are those that have a special education program emphasis.
Ungraded students Ungraded students are those who are not assigned to a particular grade level (kindergarten, first grade, second grade, etc.). For example, special education centers and alternative schools often

A-4
classify their students as ungraded. Students in Montessori schools are also considered ungraded if the school assigns them to “primary” and “intermediate” levels instead of specific grades.
Urbanicity type Urbanicity type is derived from the 12-category, urban-centric locale code (ULOCALE). The urban-centric locale code is based on the school’s physical address (or mailing address if the physical address is not reported) and is a measure of a school’s location relative to populous areas. For this report, the urban-centric locale codes were aggregated into four urbanicity types:
•
•
•
•
City: The territory inside an urbanized area and inside a principal city. (ULOCALE = 11, 12, or 13);
Suburb: The territory outside a principal city and inside an urbanized area. (ULOCALE = 21, 22, or 23);
Town: Territory inside an urban cluster. (ULOCALE = 31, 32, or 33); and
Rural: Census defined rural territory. (ULOCALE = 41, 42, or 43).

B-1
Appendix B—Technical Notes
Background
The Private School Universe Survey (PSS) is conducted by the National Center for Education Statistics (NCES) of the U.S. Department of Education in order to collect basic information on private elementary and secondary schools in the United States. The PSS grew out of a proposal in 1988 to develop a private school data collection that would improve on the sporadic collection of private school data dating back to 1890 and improve on commercially available private school sampling frames. The PSS is currently designed to generate biennial data on the total number of private schools, teachers, and students, and to build a universe of private schools to serve as a sampling frame for the NCES sample surveys. The PSS data were first collected by the U.S. Census Bureau in the 1989–90 school year, with data collections every 2 years since.
Target Population The target population for the PSS is all schools located in the 50 states and the District of Columbia that are not supported primarily by public funds, provide classroom instruction for one or more of grades kindergarten through 12 (or comparable ungraded levels), and have one or more teachers. Organizations or institutions that provide support for home schooling, but do not provide classroom instruction, are not included.
Content The 2011–12 PSS instrument consisted of a single school questionnaire designed to be filled out by school administrators and is available on the PSS website at http://nces.ed.gov/surveys/pss
Frame Creation
. Data collected included enrollment by grade, enrollment by race/ethnicity and sex, number of high school graduates from the previous year, number of teachers, program emphasis, school religious orientation or affiliation, association membership, existence and type of kindergarten program, number of days in the school year and length of the school day, and whether the school has a library media center.
Because the PSS attempts to include every private school in the United States, a universe list of private schools meeting the PSS definition had to be created for the 2011–12 PSS. Since 1983, NCES has used a dual-frame approach for building its private school universe (Beller 1984). The dual frame consists of a list frame and an area frame.
List Frame The list-building component was the primary means for improving coverage of private schools. The basis for the 2011–12 PSS list frame was the 29,448 private schools from both the 2009–10 PSS list frame and the certainty portion of the 2009–10 area frame. This became the base list against which all other submissions were compared. In order to provide coverage of private schools founded since 2009 and to improve coverage of private schools existing in 2009, NCES solicited membership lists from 31 private school associations and religious denominations. NCES received and processed 28 of these lists.

B-2
The departments of education from 50 states and the District of Columbia provided lists of private schools. All 51 department of education lists were processed. Additional private schools that contacted NCES to be included in the PSS were added as list frame cases.
Beginning in 1995, the PSS private school definition was expanded to include schools for which kindergarten is the highest grade. In 2011, a separate list-building operation (Early Childhood Operation) was conducted to identify schools for which kindergarten was the highest grade (kindergarten terminal or k-terminal schools). Requests for lists of programs that might include a kindergarten were made to sources, other than state departments of education, in all 50 states and the District of Columbia, including state departments of health or recreation; state child care licensing agencies; and child care referral agencies. In 2011, a total of 30 of these lists were received and 19 lists were processed. Due to resource constraints not all received early childhood lists were processed in 2011.
Schools on private school association membership lists, the state lists, and the early childhood lists were compared to the base list, and any school that did not match a school on the base list was added to the universe list. Additionally, programs identified in the 2009–10 PSS as prekindergarten only were included in the 2011–12 list frame. This was done in case any of these programs included at least a kindergarten in the 2011–12 school year. A total of 37,524 schools were included in the 2011–12 list frame (table B-1).
Table B-1. Number of responding and nonresponding schools, out-of-scope cases, and school Table B-1. response rate, by frame: 2011–12 Response status List frame Area frame Total frame
Total Base-weighted 37,524 6,418 43,942
Unweighted 37,524 1,801 39,325 Response Base-weighted 26,730 1,615 28,345
Unweighted 26,730 253 26,983 Nonresponse Base-weighted 2,201 326 2,527
Unweighted 2,201 111 2,312 Out-of-scope Base-weighted 8,593 4,478 13,071
Unweighted 8,593 1,437 10,030 Response rate Base-weighted 92.4 83.2 91.8
Unweighted 92.4 69.5 92.1 NOTE: Weighted using the inverse of the probability of selection. SOURCE: U.S. Department of Education, National Center for Education Statistics, Private School Universe Survey (PSS), 2011-12.
Area Frame To identify private schools that may have been overlooked in the list-building component, a group of geographic areas was selected to be searched for private schools. The United States is divided by the Census Bureau into 2,062 primary sampling units (PSUs), each PSU consisting of

B-3
block listing of all private schools in a sample of PSUs was not attempted. Rather, regional office field staff created the frame by using such sources as yellow pages, local Catholic dioceses, local education agencies, and local government offices. The Census Bureau also obtained, for the first time, a list of eligible private schools from the InfoUSA database.1
Data Collection
Once the area search lists were constructed, they were matched with the NCES private school universe list. Schools that did match the universe list were deleted from the area frame. A total of 1,801 schools were added to the universe from the area frame (table B-1).
The 2011–12 Private School Universe Survey (PSS) data collection began on September 30, 2011 with the mailout of a letter to most private schools describing how to respond to the 2011–12 PSS online, and including a userid and password for the online option (Amish and Mennonite schools were excluded from this mailout). The first mailout of the PSS questionnaires (to all private schools) occurred on October 14, 2011, and a second mailout of questionnaires (to nonresponding schools only) occurred on November 30, 2011. Each of these mailings also included the instructions, userid, and password for the online option. A reminder postcard was sent 1 week after each questionnaire mailout. Follow-up of nonresponding schools was conducted first by computer-assisted telephone interviewing, and then by Census Bureau field representatives. Data collection for the 2011–12 PSS ended on May 22, 2012.
Of the 39,325 schools included in the 2011–12 PSS, 10,030 cases were considered as out-of-scope (not eligible for the PSS). A total of 26,983 private schools completed a PSS interview (15.8 percent completed online), while 2,312 schools refused to participate resulting in an unweighted response rate of 92.1 percent.2
Quality Control and Editing
Data from the interviews went through several edits; the edits consisted of
•
•
•
•
range checks to eliminate out-of-range entries;
consistency checks to compare data in different fields for consistency;
edits to verify that skip patterns on the questionnaire had been followed;
logic edits where data were added to the questionnaire using information from the same PSS record or from the previous PSS record.
Logic Edits In the logic edits, data were added to questionnaire records when data were missing or incomplete. The sources for these added data were as follows:
• Other items on the 2011–12 PSS—Based on entries from related items on the questionnaire, assumptions were made about how the respondent should have answered items with missing values. For example, if the respondent did not answer item 10a (length of school day for kindergarten, transitional kindergarten, transitional first grade)
1 See http://www.infousa.com/. 2 The response rate is calculated as follows: number of responding schools divided by the number of responding schools plus the number of nonresponding schools.

B-4
and item 5 indicated that the school did not have students enrolled in any of those grades, zero (school does not offer kindergarten) was assigned to item 10a.
• Data from the 2009–10 PSS—Data from the 2009–10 PSS were used to fill the items with missing values whenever possible. For example, if the type of school was not reported in item 12 and it had been reported on the 2009–10 PSS, the 2009–10 response was copied to item 12.
In addition to filling items where values were missing, some inconsistencies between items were corrected by ratio adjustment. For records where the number of students in item 7 (students by race) did not equal the enrollment in item 6, excluding prekindergarten, the item 7 entries were adjusted to be consistent with item 6 (i.e., each entry in item 7 was multiplied by the ratio of the student count in item 7 to the enrollment in item 6, excluding prekindergarten).
Imputation
Item Response The weighted item response rates for the variables used in this report are all greater than 95 percent. Values were imputed to items with missing data to compensate for item nonresponse.
Imputation Items still blank after the logic edit were imputed using donor imputation. The imputation process used a hot-deck imputation methodology by extracting data from the record for a school (donor) similar to the nonrespondent. Variables that describe certain characteristics of the schools (e.g., religious affiliation, size, instructional level) were created and used to sort the records and to match incomplete records to those with complete data. Items 13b (whether or not the school was located in a private home that was used primarily as a family residence) and 15 (school association membership) did not go through the donor imputation program. If, after the first stage, the item was still incomplete, the assumption was made for item 13b that the school was not in a private home, and for item 15 that the school did not belong to any associations. Items 14a and 14c (religious orientation and affiliation) did not go through the donor imputation program. Rather, if values were still missing after the first-stage imputation, the records were reviewed and imputed by an analyst.
Analyst Imputation For a few items, there were cases where entries were imputed by analysts during data review. The data record, sample file record, and the questionnaire were reviewed and an entry consistent with the information from those sources was imputed. This procedure was used when (1) there was no suitable donor found, (2) the computer method produced an imputed entry that was unacceptable, and (3) the nature of the item required an actual review of the data rather than a computer-generated value.
Weighting The survey data from the area-frame component were weighted to reflect the sampling rates (probability of selection) of the PSUs. There were 26,983 interviews and 2,312 cases that were noninterviews. After applying the PSU weight, these became 28,345 interviews and 2,527 noninterviews—the weighted response rate was 91.8 percent (table B-1).

B-5
Sampling Error The standard error indicates how much variability there is in the population of possible estimates of a parameter for a given sample size. Standard errors are used as a measure of the precision expected from a particular sample. If all possible samples were surveyed under similar conditions, intervals of 1.96 standard errors below to 1.96 standard errors above a particular statistic would include the true population parameter being estimated in about 95 percent of the samples. This is a 95 percent confidence interval.
Estimates of standard errors were computed using a technique known as half-sample replication. As with any replication method, half-sample replication involves constructing a number of subsamples (replicates) from the full sample and computing the statistic of interest for each replicate. The mean squared error of the replicate estimates around the full sample provides an estimate of the variance of the statistic (Wolter 1985). A computer program (SUDAAN), developed by Research Triangle Institute, was used to calculate the estimates of standard errors. For PSS, only the area frame contributes to the standard error. Since all list-frame cases are included in the PSS, the list-frame component of the standard error is always zero (0). Standard errors for statistics in each table are presented in corresponding tables in appendix C.
Tests of Significance The tests of significance used in this analysis are based on Student’s t statistics. The t statistic between estimates from various independent subgroups presented in the tables can be computed by using the following formula:
22
21
21
SESExxt+
−=
where x1 and x2 are the estimates to be compared (e.g., the means of two groups) and SE1 and SE2 are their corresponding standard errors.
As the number of comparisons that are conducted at the same significance increases, it becomes more likely that at least one of the estimated differences becomes significant merely by chance, that is, will be erroneously identified as significantly different from zero. Even when there is no statistical difference between the estimates or percentages being compared, there is a 5 percent chance of getting a significant t value of 1.96 from sampling error alone. As the number of comparisons increases, the incidence of this type of error also increases.
Nonsampling Error Survey estimates are also subject to errors of reporting and errors made in the collection of the data. These errors, called nonsampling errors, can sometimes bias the data. Nonsampling errors may include such things as differences in the respondents’ interpretation of the meaning of the questions, differences related to the particular time the survey was conducted, or errors in data preparation. While sampling theory can be used to estimate the sampling variability of an estimate, nonsampling errors usually require either an experiment conducted as part of the data collection procedure or use of data external to the study.

B-6
Undercoverage in the list and area frames is another possible source of nonsampling error. To reduce the possible bias caused by undercoverage in the list frame, the area frame was used to complement the list frame through the identification of schools missing from the list frame.
Publication Criteria for PSS Estimates NCES criteria for the publication of an estimate are based on two category types: (1) surveys based on a sample from the frame or (2) surveys based on the entire frame (universe surveys). To publish an estimate for a sample survey, at least 30 cases must be used in developing the estimate; for a universe survey, at least three cases must be used in developing the estimate. PSS has pieces of both categories: (1) an area-frame sample of 124 PSUs, which collects data on schools not on the list frame, and (2) a complete census of schools belonging to the list frame. Since a significant component of a PSS estimate comes from the census of the list frame, the criterion of at least 30 cases seems unnecessarily high. However, since the area-frame component of an estimate can have a large sampling error, some indication of a large sampling error is appropriate. Based on these two concerns, the estimates reported in a PSS table must be based on at least 15 schools. Some of the estimates in this report are footnoted with “Interpret data with caution. The coefficient of variation is between 25 and 30 percent.” The coefficient of variation measures the precision of an estimate and is defined as the standard error of an estimate divided by the value of the estimate.

C-1
Appendix C—Standard Error Tables

C-2
Table C-1. Standard errors for number and percentage distribution of private schools, students, and Table C-1. full-time equivalent (FTE) teachers, by school characteristics: United States, 2011–12 School Schools Students FTE teachers characteristic Number Percent Number Percent Number Percent Total 542.4 †
25,138.6 †
1,836.0 †
Private school typology Catholic 31.1 0.4
14,630.3 0.3
1,069.0 0.2
Parochial 15.7 0.2
3,325.6 0.1
202.5 0.1 Diocesan 27.8 0.2
14,320.0 0.3
1,052.2 0.2
Private 17.5 0.1
217.6 0.0
65.4 0.0 Other religious 550.9 1.0
21,908.0 0.3
1,568.3 0.3
Conservative Christian 127.3 0.3
4,641.5 0.1
575.1 0.1 Other affiliated 17.1 0.2
2,397.8 0.1
402.9 0.1
Unaffiliated 458.3 1.1
20,414.6 0.4
1,247.3 0.3 Nonsectarian 87.1 0.6
4,512.6 0.2
567.0 0.2
Regular 71.1 0.4
4,303.4 0.1
496.7 0.1 Special emphasis 23.2 0.2
870.4 0.0
140.0 0.0
Special education 21.9 0.1
693.6 0.0
87.1 0.0 School level
Elementary 414.1 0.4
8,772.0 0.2
854.8 0.2 Secondary 30.1 0.2
14,401.0 0.3
1,055.3 0.2
Combined 188.3 0.4
17,100.8 0.3
917.9 0.1 Program emphasis
Regular elementary/ secondary 539.9 0.6
25,216.0 0.1
1,800.6 0.1
Montessori 19.6 0.1
781.7 0.0
130.3 0.0 Special program emphasis 7.5 0.0
240.2 0.0
29.1 0.0
Special education 28.0 0.1
943.4 0.0
158.3 0.0 Vocational/technical † †
† †
† †
Alternative 1.9 0.0
112.8 0.0
13.8 0.0 Early childhood 43.8 0.2
627.9 0.0
99.1 0.0
Size (number of students) Less than 50 521.2 1.0
7,510.8 0.2
1,107.5 0.2
50–149 114.1 0.5
7,353.2 0.2
782.7 0.2 150–299 14.7 0.3
2,944.8 0.2
323.2 0.1
300–499 7.0 0.1
2,848.3 0.1
269.2 0.1 500–749 27.0 0.1
14,312.1 0.3
1,051.2 0.2
750 or more 9.9 0.1
17,907.6 0.3
696.4 0.2 Region
Northeast 67.8 0.5
17,327.1 0.3
679.5 0.2 Midwest 532.7 1.3
18,087.1 0.3
1,667.9 0.3
South 76.4 0.5
2,335.7 0.2
363.2 0.2 West 6.7 0.4
302.9 0.1
30.5 0.1
Urbanicity type City 51.7 0.6
14,550.9 0.3
1,121.0 0.2
Suburban 69.7 0.6
5,325.6 0.2
591.4 0.2 Town 103.7 0.2
3,128.6 0.1
598.3 0.1
Rural 452.8 1.1
19,863.7 0.4 1,123.5 0.2
† Not applicable. SOURCE: U.S. Department of Education, National Center for Education Statistics, Private School Universe Survey (PSS), 2011–2012.

C-3
Table C-2. Standard errors for number and percentage distribution of private schools, students, and Table C-2. Table C-2.
full-time equivalent (FTE) teachers, by religious or nonsectarian orientation of school: United States, 2011–12
Religious or Schools Students FTE teachers nonsectarian orientation Number Percent Number Percent Number Percent Total 542.4 †
25,138.6 †
1,836.0 †
Religious orientation 551.6 0.63
25,845.9 0.15
1,874.4 0.17 Roman Catholic 31.1 0.41
14,630.3 0.28
1,069.0 0.22
African Methodist Episcopal † †
† †
† † Amish 303.0 0.92
5,947.2 0.13
359.1 0.08
Assembly of God 0.0 0.02
0.0 #
0.0 # Baptist 70.1 0.21
664.3 0.03
79.3 0.03
Brethren 0.0 #
0.0 #
0.0 # Calvinist 4.8 0.02
272.0 0.01
32.9 0.01
Christian (unspecified) 153.2 0.32
3,655.7 0.09
746.7 0.14 Church of Christ 1.1 0.01
17.2 #
2.2 #
Church of God 1.0 0.01
1.0 #
1.0 #
Church of God in Christ 0.0 #
0.0 #
0.0 # Church of the Nazarene 0.0 #
0.0 #
0.0 #
Disciples of Christ † †
† †
† † Episcopal 0.0 0.02
0.0 0.01
0.0 0.01
Friends 1.1 0.01
64.2 #
15.2 #
Greek Orthodox 1.8 0.01
131.9 #
18.1 # Islamic 1.5 0.01
14.5 #
2.9 #
Jewish 25.8 0.10
16,799.1 0.35
527.0 0.12 Latter Day Saints † †
† †
† †
Lutheran Church—Missouri Synod 3.8 0.06
832.0 0.02
49.1 0.01
Evangelical Lutheran Church In America 0.0 0.01
0.0 #
0.0 # Wisconsin Evangelical Lutheran Synod 0.0 0.02
0.0 #
0.0 #
Other Lutheran 1.0 0.01
16.0 #
1.9 # Mennonite 142.7 0.43
5,217.0 0.11
494.5 0.12
Methodist 0.0 0.01
0.0 #
0.0 #
Pentecostal 9.9 0.04
82.5 #
19.1 # Presbyterian 1.0 0.01
16.5 #
0.6 #
Seventh-Day Adventist 0.0 0.05
0.0 0.01
0.0 # Other 0.0 0.01
0.0 #
0.0 #
Nonsectarian 87.1 0.63
4,512.6 0.15 567.0 0.17
† Not applicable. # Rounds to zero. SOURCE: U.S. Department of Education, National Center for Education Statistics, Private School Universe Survey (PSS), 2011–2012.

C-4
Table C-3. Standard errors for percentage distribution of private schools, by program emphasis
Table C-3.
and selected school characteristics: United States, 2011–12
Regular Special Vocational/ School elementary/
program
Special
technical
Early
characteristic secondary
Montessori emphasis
education
programs
Alternative
childhood
0.31 0.23 0.17 0.15 0.04 0.14 0.04 Total 0.55
0.15
0.04
0.14
†
0.05
0.24
Private school typology Catholic 0.20
#
#
0.12
†
†
0.16 Parochial 0.17
†
0.00
†
†
0.00
† Diocesan 0.23
†
†
0.23
†
†
0.04 Private 1.00
0.06
†
0.06
†
†
1.01
Other religious 0.52
0.04
0.06
0.10
†
0.06
0.32 Conservative Christian 0.21
†
0.03
0.02
†
0.05
0.10 Other affiliated 0.23
#
0.01
0.24
†
#
0.14 Unaffiliated 1.25
0.12
0.10
0.14
†
0.12
0.84
Nonsectarian 0.48
0.18
0.06
0.23
†
0.05
0.29 Regular 0.70
†
†
†
†
†
0.70 Special emphasis †
0.19
0.16
†
†
0.12
†
Special education †
†
†
0.00
†
†
† School level
Elementary 0.74
0.25
0.05
0.11
†
0.03
0.41 Secondary 0.31
†
0.03
0.21
†
0.12
† Combined 0.53
0.03
0.06
0.37
†
0.08
0.01
Size (number of students) Less than 50 2.08
0.54
0.09
0.35
†
0.16
1.03
50–149 0.34
0.17
0.05
0.17
†
0.04
0.05 150–299 0.03
0.02
0.01
0.01
†
#
†
300–499 0.01
†
0.01
#
†
†
† 500–749 0.05
0.00
†
†
†
†
†
750 or more 0.02
0.00
†
†
†
†
† Region
Northeast 0.47
0.17
0.07
0.23
†
0.02
0.34 Midwest 1.36
0.46
0.09
0.34
†
0.09
0.61
South 0.26
0.07
0.03
0.05
†
0.03
0.11 West 0.05
0.02
0.03
0.02
†
0.02
0.04
Urbanicity type City 0.23
0.06
0.04
0.20
†
0.02
0.09
Suburban 0.28
0.12
0.05
0.16
†
0.02
0.30 Town 0.58
0.18
0.05
0.08
†
0.07
0.20
Rural 1.21
0.24
0.12
0.28
†
0.23
0.40 † Not applicable.
# Rounds to zero. SOURCE: U.S. Department of Education, National Center for Education Statistics, Private School Universe Survey
(PSS), 2011–2012.

C-5
Table C-4. Standard errors for number and percentage distribution of private schools, by urbanicity Table C-4.
type and selected school characteristics: United States, 2011–12 School Total City Suburban Town Rural
characteristic Number Percent Number Percent Number Percent Number Percent Number Percent
264.4 0.62
104.4 0.35
49.0 0.26
Total 542.4 †
51.7 †
69.7 †
103.7 †
452.8 † Private school typology
Catholic 31.1 0.41
27.1 0.23
27.4 0.24
1.0 1.16
0.0 0.56 Parochial 15.7 0.17
2.4 0.06
15.5 0.14
1.0 0.57
0.0 0.23
Diocesan 27.8 0.19
27.0 0.24
6.9 0.09
0.0 0.53
0.0 0.22 Private 17.5 0.08
1.3 0.03
17.4 0.15
0.0 0.06
0.0 0.11
Other religious 550.9 0.99
9.1 0.19
23.5 0.19
103.7 1.69
463.3 2.18 Conservative Christian 127.3 0.27
1.0 0.06
9.8 0.07
88.8 2.39
90.7 1.53
Other affiliated 17.1 0.18
6.6 0.08
15.3 0.13
0.0 0.34
4.0 0.55 Unaffiliated 458.3 1.12
4.8 0.08
10.8 0.11
53.6 1.60
444.1 3.70
Nonsectarian 87.1 0.63
41.2 0.28
56.4 0.34
1.0 0.54
45.7 1.66 Regular 71.1 0.37
32.7 0.28
44.2 0.32
0.0 0.23
45.3 1.05
Special emphasis 23.2 0.19
8.7 0.08
19.3 0.14
1.0 0.24
4.6 0.46 Special education 21.9 0.11
21.0 0.20
5.0 0.05
0.0 0.07
4.1 0.25
School level Elementary 414.1 0.43
40.6 0.24
60.9 0.31
1.8 2.15
406.7 2.68
Secondary 30.1 0.18
28.7 0.26
11.8 0.11
0.0 0.22
4.9 0.49 Combined 188.3 0.38
9.7 0.13
33.6 0.27
103.7 2.36
149.8 2.37
Program emphasis Regular elementary/ secondary 539.9 0.55
42.9 0.23
42.2 0.28
103.7 0.58
452.5 1.21
Montessori 19.6 0.15
6.0 0.06
17.0 0.12
1.0 0.18
4.6 0.24 Special program emphasis 7.5 0.04
4.7 0.04
5.8 0.05
0.0 0.05
1.1 0.12
Special education 28.0 0.14
21.0 0.20
18.1 0.16
0.0 0.08
4.1 0.28 Vocational/technical † †
† †
† †
† †
† †
Alternative 1.9 0.05
1.4 0.02
1.2 0.02
0.0 0.07
0.0 0.23 Early childhood 43.8 0.24
8.8 0.09
38.7 0.30
0.0 0.20
16.1 0.40
Size (number of students) Less than 50 521.2 0.95
40.1 0.28
47.0 0.23
88.9 1.99
443.8 2.57
50–149 114.1 0.48
5.7 0.12
32.9 0.23
53.5 1.63
58.0 1.61 150–299 14.7 0.32
11.6 0.14
9.1 0.12
0.0 0.57
0.0 0.66
300–499 7.0 0.14
1.0 0.05
6.9 0.07
0.0 0.17
0.0 0.23 500–749 27.0 0.11
27.0 0.26
0.0 0.03
0.0 0.04
0.0 0.09
750 or more 9.9 0.05
0.0 0.02
0.0 0.01
† †
9.9 0.15 Region
Northeast 67.8 0.45
11.9 0.13
39.4 0.30
3.8 0.45
42.7 1.64 Midwest 532.7 1.29
46.2 0.37
57.2 0.42
103.6 2.12
444.8 4.14
South 76.4 0.55
19.6 0.20
4.7 0.18
1.4 1.04
73.3 2.04 West 6.7 0.36
3.4 0.15 3.8 0.13 1.5 0.65 2.9 0.68
† Not applicable. SOURCE: U.S. Department of Education, National Center for Education Statistics, Private School Universe Survey (PSS), 2011–2012.

C-6
Table C-5. Standard errors for number and percentage distribution of private school students, by Table C-5. urbanicity type and selected school characteristics: United States, 2011–12
School Total City Suburban Town Rural characteristic Number Percent Number Percent Number Percent Number Percent Number Percent Total 25,138.6 †
14,550.9 †
5,325.6 †
3,128.6 †
19,863.7 †
Private school typology Catholic 14,630.3 0.28
14,317.6 0.40
3,476.2 0.13
103.7 0.54
0.0 0.55
Parochial 3,325.6 0.11
397.4 0.12
3,300.2 0.15
103.7 0.26
0.0 0.20 Diocesan 14,320.0 0.28
14,312.1 0.60
474.1 0.07
0.0 0.26
0.0 0.24
Private 217.6 0.05
29.0 0.08
215.6 0.02
0.0 0.02
0.0 0.11 Other religious 21,908.0 0.34
1,341.1 0.25
2,195.0 0.10
3,126.8 0.65
21,021.5 1.57
Conservative Christian 4,641.5 0.11
17.8 0.08
564.8 0.05
1,421.9 0.42
4,381.8 0.86 Other affiliated 2,397.8 0.09
1,290.1 0.10
1,982.7 0.10
0.0 0.09
392.6 0.32
Unaffiliated 20,414.6 0.40
180.4 0.09
417.1 0.04
2,784.8 0.81
19,524.4 2.36 Nonsectarian 4,512.6 0.15
2,051.0 0.17
2,430.9 0.13
12.0 0.11
3,211.8 1.07
Regular 4,303.4 0.13
1,894.5 0.14
2,194.5 0.12
0.0 0.08
3,186.5 0.88 Special emphasis 870.4 0.02
499.2 0.04
695.9 0.04
12.0 0.03
45.5 0.14
Special education 693.6 0.02
549.4 0.03
139.7 0.01
0.0 0.01
399.7 0.10 School level
Elementary 8,772.0 0.24
1,268.6 0.36
4,400.4 0.15
119.6 0.55
7,460.2 1.22 Secondary 14,401.0 0.28
14,428.3 0.60
326.8 0.05
0.0 0.09
272.0 0.40
Combined 17,100.8 0.26
1,336.2 0.25
2,726.1 0.14
3,126.3 0.64
18,082.7 1.43 Program emphasis
Regular elementary/ secondary 25,216.0 0.06
14,523.2 0.07
5,096.8 0.04
3,128.5 0.05
19,857.9 0.31
Montessori 781.7 0.02
450.2 0.03
633.9 0.04
12.0 0.01
45.5 0.05 Special program emphasis 240.2 0.01
71.9 0.01
228.7 0.01
0.0 0.01
16.2 0.07
Special education 943.4 0.03
553.1 0.03
651.4 0.04
0.0 0.01
399.7 0.10 Vocational/technical † †
† †
† †
† †
† †
Alternative 112.8 0.01
102.9 0.01
46.1 #
0.0 0.01
0.0 0.06 Early childhood 627.9 0.02
120.3 0.01
489.1 0.03
0.0 0.01
256.6 0.06
Size (number of students) Less than 50 7,510.8 0.16
789.3 0.05
786.3 0.04
1,431.7 0.44
6,282.3 0.94
50–149 7,353.2 0.16
512.8 0.09
2,240.3 0.12
2,781.8 0.63
4,337.8 0.86 150–299 2,944.8 0.17
2,306.3 0.21
1,831.1 0.06
0.0 0.33
0.0 0.79
300–499 2,848.3 0.12
395.2 0.16
2,820.7 0.11
0.0 0.18
0.0 0.50 500–749 14,312.1 0.28
14,312.1 0.63
0.0 0.05
0.0 0.07
0.0 0.31
750 or more 17,907.6 0.34
0.0 0.17
0.0 0.05
† †
17,907.6 2.56 Region
Northeast 17,327.1 0.31
1,551.4 0.17
2,347.8 0.13
176.4 0.12
18,017.7 2.29 Midwest 18,087.1 0.32
14,338.0 0.59
4,765.1 0.22
3,121.3 0.57
8,276.9 1.23
South 2,335.7 0.19
1,934.5 0.26
318.8 0.09
59.6 0.33
1,179.1 1.37 West 302.9 0.11
38.5 0.18 204.7 0.05 104.6 0.13 176.8 0.36 † Not applicable. # Rounds to zero. SOURCE: U.S. Department of Education, National Center for Education Statistics, Private School Universe Survey (PSS), 2011–2012.

C-7
Table C-6. Standard errors for number and percentage distribution of private school students, by Table C-6.
grade and private school typology: United States, 2011–12 Kindergarten First grade Second grade Third grade Fourth grade
Private school typology Number Percent Number Percent Number Percent Number Percent Number Percent Total 2,989.3 †
2,191.0 †
2,008.1 †
1,850.1 †
1,921.5 †
Catholic 451.0 0.22
429.0 0.26
427.9 0.25
349.7 0.24
360.6 0.25 Parochial 385.4 0.13
405.4 0.15
396.2 0.15
325.4 0.13
354.5 0.14
Diocesan 13.2 0.10
47.4 0.12
27.1 0.11
33.9 0.11
27.1 0.11 Private 122.9 0.03
27.3 0.02
31.0 0.02
72.8 0.03
5.2 0.02
Other religious 2,497.8 0.30
2,067.0 0.34
1,876.7 0.32
1,751.2 0.31
1,828.7 0.33 Conservative Christian 447.3 0.11
352.8 0.09
427.9 0.08
485.5 0.11
389.9 0.10
Other affiliated 370.5 0.12
246.8 0.10
267.5 0.10
228.7 0.09
271.2 0.10 Unaffiliated 2,519.2 0.47
1,932.5 0.47
1,577.5 0.39
1,497.3 0.38
1,672.6 0.44
Nonsectarian 737.4 0.14
191.0 0.10
191.5 0.09
202.0 0.09
241.6 0.11 Regular 570.4 0.11
134.4 0.08
142.2 0.08
171.1 0.08
230.5 0.09
Special emphasis 277.8 0.06
117.7 0.03
127.1 0.03
105.1 0.03
60.1 0.02 Special education 20.2 0.01 0.0 # 0.0 # 1.0 0.01 4.2 0.01 Fifth grade Sixth grade Seventh grade Eighth grade Ninth grade Private school typology Number Percent Number Percent Number Percent Number Percent Number Percent Total 1,832.1 †
1,766.4 †
1,684.1 †
1,950.9 †
3,875.3 †
Catholic 402.8 0.25
394.6 0.24
357.5 0.23
324.4 0.26
3,612.0 0.61 Parochial 395.6 0.15
381.5 0.14
349.7 0.13
322.8 0.14
5.2 0.06
Diocesan 20.3 0.11
47.4 0.11
74.5 0.11
27.1 0.11
3,612.0 0.87 Private 35.9 0.02
10.3 0.02
0.0 0.02
17.8 0.03
0.0 0.25
Other religious 1,832.0 0.34
1,742.7 0.32
1,680.9 0.32
2,047.9 0.40
1,464.9 0.49 Conservative Christian 385.7 0.08
291.1 0.07
518.4 0.13
401.8 0.11
414.6 0.19
Other affiliated 193.3 0.09
184.0 0.09
135.6 0.08
207.1 0.10
145.0 0.13 Unaffiliated 1,586.5 0.41
1,624.5 0.41
1,487.3 0.38
1,913.2 0.50
1,466.2 0.42
Nonsectarian 176.5 0.11
179.5 0.10
249.7 0.11
280.5 0.15
860.4 0.33 Regular 136.1 0.09
153.8 0.08
248.0 0.10
283.2 0.13
850.3 0.30
Special emphasis 81.3 0.03
66.0 0.02
39.0 0.01
18.8 0.02
115.1 0.04 Special education 13.1 0.01 36.4 0.01 16.6 0.01 44.1 0.02 64.0 0.04 Tenth grade Eleventh grade Twelfth grade Ungraded Private school typology Number Percent
Number Percent
Number Percent
Number Percent
Total 4,160.6 †
3,647.1 †
3,768.5 †
689.5 †
Catholic 3,908.7 0.68
3,288.6 0.60
3,503.9 0.62
0.0 0.08 Parochial 5.2 0.07
0.0 0.06
0.0 0.06
0.0 0.02
Diocesan 3,908.7 0.96
3,288.6 0.83
3,503.9 0.89
0.0 0.03 Private 0.0 0.27
0.0 0.24
0.0 0.25
0.0 0.03
Other religious 1,578.2 0.54
1,445.2 0.48
1,314.2 0.46
417.3 0.63 Conservative Christian 463.0 0.22
281.6 0.18
207.3 0.16
88.8 0.15
Other affiliated 112.4 0.13
129.0 0.12
134.6 0.13
322.6 0.53 Unaffiliated 1,489.9 0.44
1,482.6 0.44
1,389.0 0.42
216.6 0.35
Nonsectarian 929.8 0.38
1,130.2 0.39
696.6 0.32
548.9 0.60 Regular 920.5 0.34
1,122.0 0.36
688.5 0.27
0.0 0.12
Special emphasis 97.3 0.04
106.5 0.04
92.1 0.04
49.7 0.25 Special education 87.9 0.04
84.0 0.04 52.0 0.04 546.7 0.59
† Not applicable. # Rounds to zero. SOURCE: U.S. Department of Education, National Center for Education Statistics, Private School Universe Survey (PSS), 2011–2012.

C-8
Table C-7. Standard errors for average private school size, by school level and selected school Table C-7. characteristics: United States, 2011–12
School Average number of students characteristic Total Elementary Secondary Combined Total 2.38 1.94 2.77 4.32 Private school typology
Catholic 1.52 0.67 0.12 6.12 Parochial 0.22 0.31 0.00 22.61 Diocesan 2.33 0.10 0.17 13.70 Private 5.77 5.69 0.00 0.00 Other religious 4.04 3.06 1.87 6.39 Conservative Christian 3.14 3.48 0.00 4.94 Other affiliated 0.62 0.33 0.00 2.26 Unaffiliated 5.59 3.68 3.69 15.00 Nonsectarian 0.52 0.30 1.05 2.56 Regular 1.22 0.50 0.82 14.80 Special emphasis 0.21 0.18 0.50 0.33 Special education 0.53 1.75 0.00 0.40 Program emphasis
Regular elementary/ secondary 4.46 4.24 2.52 6.36
Montessori 0.21 0.19 † 0.00 Special program emphasis 1.07 1.19 0.00 1.06 Special education 0.55 1.39 0.54 0.55 Vocational/technical † † † † Alternative 0.07 0.23 0.02 0.00 Early childhood 0.08 0.08 † 0.00 Size (number of students)
Less than 50 0.28 0.24 0.08 0.85 50–149 0.41 0.25 0.31 0.79 150–299 0.05 0.06 0.14 0.10 300–499 0.12 0.22 0.00 0.14 500–749 1.76 0.00 6.51 0.00 750 or more 10.25 0.00 0.00 17.13 Region
Northeast 2.16 0.77 3.56 10.14 Midwest 8.60 7.17 8.45 14.57 South 1.17 1.40 0.84 0.21 West 0.11 0.09 0.43 0.29 Urbanicity type
City 1.16 0.70 4.63 0.72 Suburban 0.72 0.83 3.78 1.91 Town 2.86 0.05 0.00 9.91 Rural 5.38 3.83 0.81 9.52 † Not applicable.
SOURCE: U.S. Department of Education, National Center for Education Statistics, Private School Universe Survey (PSS), 2011–2012.

C-9
Table C-8. Standard errors for number and percentage distribution of private schools, by school size and Table C-8.
selected school characteristics: United States, 2011–12
School characteristic
Less than 50 students
50–149 students
150–299 students
300–499 students
500–749 students
750 or more students
Number Percent Number Percent Number Percent Number Percent Number Percent Number Percent Total 521.2 0.95
114.1 0.48
14.7 0.32
7.0 0.14
27.0 0.11
9.9 0.05
Private school typology Catholic 19.7 0.28
6.8 0.13
5.7 0.14
5.2 0.07
27.0 0.37
0.0 0.02
Parochial 5.2 0.16
1.0 0.13
5.7 0.08
5.2 0.07
0.0 0.03
0.0 0.01 Diocesan 1.1 0.05
6.8 0.28
0.0 0.38
0.0 0.18
27.0 0.83
0.0 0.04
Private 17.5 1.38
0.0 0.31
0.0 0.34
0.0 0.28
0.0 0.23
0.0 0.21 Other religious 517.2 1.88
151.2 1.22
7.5 0.54
4.7 0.20
0.0 0.09
9.9 0.10
Conservative Christian 115.1 1.62
54.3 1.16
0.0 0.48
0.0 0.18
0.0 0.08
0.0 0.06
Other affiliated 8.7 0.17
7.2 0.15
7.5 0.22
4.7 0.15
0.0 0.02
0.0 0.02 Unaffiliated 438.4 2.56
98.2 1.79
0.0 0.64
0.0 0.23
0.0 0.09
9.9 0.17
Nonsectarian 63.0 0.40
53.6 0.44
8.8 0.11
0.0 0.04
0.0 0.02
0.0 0.01 Regular 46.4 0.75
52.3 0.91
8.7 0.22
0.0 0.10
0.0 0.05
0.0 0.04
Special emphasis 20.0 0.30
11.1 0.29
1.0 0.05
0.0 0.01
† †
† † Special education 21.6 0.63
4.0 0.52
0.0 0.10
0.0 0.02
† †
† †
School level Elementary 405.8 1.03
45.3 0.49
10.2 0.38
5.2 0.14
0.0 0.04
0.0 0.01
Secondary 11.9 0.43
6.8 0.34
8.4 0.34
0.0 0.16
27.0 0.89
0.0 0.10 Combined 172.6 1.38
75.0 0.87
6.4 0.40
4.7 0.20
0.0 0.12
9.9 0.16
Program emphasis Regular elementary/ secondary 518.3 1.70
113.7 0.75
14.7 0.60
7.0 0.28
27.0 0.18
9.9 0.09
Montessori 16.0 0.38
11.1 0.38
1.0 0.05
† †
0.0 0.00
0.0 0.00 Special program
emphasis 7.4 0.69
1.0 0.40
0.0 0.18
0.0 0.09
† †
† † Special education 26.9 0.68
7.9 0.59
0.0 0.11
0.0 0.02
† †
† †
Vocational/technical † †
† †
† †
† †
† †
† † Alternative 1.5 0.11
1.0 0.11
0.0 0.01
† †
† †
† †
Early childhood 42.7 0.09
3.6 0.09
† †
† †
† †
† † Region
Northeast 49.0 0.39
38.5 0.41
8.0 0.22
0.0 0.07
0.0 0.03
9.9 0.13 Midwest 513.5 3.80
107.3 1.97
9.0 1.15
6.9 0.53
27.0 0.45
0.0 0.11
South 74.9 0.48
4.8 0.21
8.5 0.16
1.0 0.07
0.0 0.03
0.0 0.03 West 5.0 0.05
3.7 0.05
0.0 0.02
0.0 0.01
0.0 #
0.0 #
Urbanicity type City 40.1 0.28
5.7 0.12
11.6 0.14
1.0 0.05
27.0 0.26
0.0 0.02
Suburban 47.0 0.23
32.9 0.23
9.1 0.12
6.9 0.07
0.0 0.03
0.0 0.01 Town 88.9 1.99
53.5 1.63
0.0 0.57
0.0 0.17
0.0 0.04
† †
Rural 443.8 2.57
58.0 1.61 0.0 0.66 0.0 0.23 0.0 0.09 9.9 0.15
† Not applicable. # Rounds to zero. SOURCE: U.S. Department of Education, National Center for Education Statistics, Private School Universe Survey (PSS), 2011–2012.

C-10
Table C-9. Standard errors for percentage distribution of private school students, by racial/ethnic Table C-9. background and selected school characteristics: United States, 2011–12 School characteristic
Hispanic
Non-Hispanic
American
Indian Pacific
Islander Two or more
races Asian Black White Total 0.05
#
0.03
0.06
#
0.15
0.01
Private school typology Catholic 0.02
#
0.02
0.04
#
0.10
0.01
Parochial 0.06
#
0.02
0.02
#
0.10
0.01 Diocesan 0.02
0.01
0.04
0.10
#
0.20
0.04
Private 0.01
#
#
0.01
#
0.02
0.03 Other religious 0.10
0.01
0.06
0.13
0.01
0.32
0.03
Conservative Christian 0.14
0.01
0.03
0.08
0.01
0.22
0.02 Other affiliated 0.04
#
0.03
0.08
#
0.13
0.01
Unaffiliated 0.19
0.01
0.14
0.36
0.02
0.79
0.07 Nonsectarian 0.02
#
0.04
0.15
0.01
0.15
0.03
Regular 0.03
#
0.05
0.22
0.01
0.21
0.04 Special emphasis 0.02
#
0.06
0.06
0.02
0.09
0.02
Special education 0.06
0.01
0.01
0.08
#
0.14
0.03 School level
Elementary 0.06
#
0.02
0.04
#
0.12
0.01 Secondary 0.01
0.01
0.06
0.23
0.01
0.27
0.03
Combined 0.09
0.01
0.06
0.10
0.01
0.29
0.04 Program emphasis
Regular elementary/ secondary 0.06
#
0.03
0.06
#
0.15
0.02
Montessori 0.04
#
0.11
0.03
0.02
0.15
0.04 Special program emphasis 0.02
0.02
0.04
0.02
#
0.05
0.01
Special education 0.08
0.01
0.01
0.12
#
0.19
0.03 Vocational/technical †
†
†
†
†
†
†
Alternative 0.02
#
0.01
0.18
0.06
0.14
0.01 Early childhood 0.14
0.01
0.11
0.49
0.03
0.39
0.07
Size (number of students) Less than 50 0.38
0.02
0.14
0.38
0.02
0.85
0.11
50–149 0.14
0.01
0.07
0.15
0.02
0.42
0.03 150–299 0.02
#
0.02
0.11
#
0.10
0.01
300–499 0.03
#
0.02
0.04
#
0.09
0.01 500–749 0.09
0.01
0.06
0.09
#
0.11
0.03
750 or more 0.19
0.01
0.13
0.14
0.02
0.58
0.09 Region
Northeast 0.13
#
0.08
0.16
#
0.40
0.03 Midwest 0.12
0.01
0.05
0.13
0.01
0.26
0.03
South 0.05
#
0.01
0.09
#
0.09
# West 0.01
#
0.01
#
#
0.01
#
Urbanicity type City 0.02
#
0.03
0.10
#
0.14
0.02
Suburban 0.02
#
0.02
0.03
#
0.07
0.01 Town 0.06
0.03
0.02
0.03
0.01
0.15
0.02
Rural 0.22
0.04 0.12 0.16 0.02 0.58 0.07 † Not applicable. # Rounds to zero. SOURCE: U.S. Department of Education, National Center for Education Statistics, Private School Universe Survey (PSS), 2011–2012.

C-11
Table C-10. Standard errors for percentage male enrollment in private schools and percentage Table C-10. Table C-10.
distribution of private schools, by coeducational category and selected school characteristics: United States, 2011–12
School characteristic
Percent male enrollment
Coeducational category Coed schools All-girls schools All-boys schools
Total #
0.08
0.04
0.04 Private school typology
Catholic #
0.03
0.02
0.01 Parochial #
0.01
#
† Diocesan #
0.02
0.01
0.01
Private #
0.54
0.29
0.25 Other religious #
0.15
0.07
0.09
Conservative Christian #
0.02
†
0.01 Other affiliated #
0.20
0.20
0.02
Unaffiliated #
0.28
0.09
0.20 Nonsectarian #
0.03
0.01
0.02
Regular #
0.04
0.02
0.02 Special emphasis #
0.02
#
0.02 Special education #
0.10
0.02
0.09
School level Elementary #
0.02
0.01
0.01
Secondary #
0.30
0.14
0.22 Combined #
0.11
0.08
0.05
Program emphasis Regular elementary/ secondary #
0.12
0.06
0.07
Montessori #
#
†
† Special program emphasis #
0.05
†
0.03 Special education #
0.11
0.02
0.09
Vocational/technical †
†
†
† Alternative #
0.03
0.01
0.02
Early childhood #
#
†
0.00 Size (number of students)
Less than 50 #
0.10
0.03
0.08 50–149 #
0.05
0.02
0.03
150–299 #
0.11
0.11
0.01 300–499 #
0.02
0.01
0.01
500–749 #
0.36
0.24
0.12 750 or more #
0.27
0.08
0.20
Region Northeast #
0.15
0.10
0.09
Midwest #
0.14
0.07
0.08 South #
0.02
0.01
0.01
West #
0.02
#
0.02 Urbanicity type
City #
0.07
0.06
0.02 Suburban #
0.06
0.01
0.05
Town #
0.03
†
0.02 Rural #
0.19 0.05 0.14 † Not applicable # Rounds to zero. SOURCE: U.S. Department of Education, National Center for Education Statistics, Private School Universe Survey (PSS), 2011–2012.

C-12
Table C-11. Standard errors for number and percentage distribution of private school teachers Table C-11.
(headcount), by work status and selected characteristics: United States, 2011–12
Selected characteristic
Total
Work status
Full time 3/4 time but
less than 100% 1/2 time but less than 3/4
1/4 time but less than 1/2
Less than 1/4 time
Number Percent Number Percent Number Percent Number Percent Number Percent Number Percent Total 1,922.3 †
1,794.5 0.12
36.5 0.02
471.4 0.10
159.3 0.03
59.1 0.02
Private school typology Catholic 1,105.2 †
1,034.2 0.09
33.9 0.01
35.8 0.05
18.3 0.03
45.8 0.02
Parochial 224.8 †
172.3 0.03
10.3 #
31.0 0.03
9.8 0.02
10.3 0.01 Diocesan 1,079.2 †
1,025.3 0.20
27.0 0.02
0.0 0.13
0.0 0.06
27.0 0.01
Private 105.1 †
35.4 0.17
17.8 0.04
17.8 0.04
15.5 0.04
35.5 0.10 Other religious 1,693.5 †
1,416.1 0.16
14.3 0.05
337.2 0.13
89.2 0.05
56.7 0.05
Conservative Christian 661.5 †
478.7 0.12
1.1 0.05
127.3 0.10
88.8 0.10
19.5 0.05
Other affiliated 467.3 †
327.0 0.27
13.7 0.04
231.0 0.33
6.4 0.05
7.1 0.03 Unaffiliated 1,288.3 †
1,196.3 0.47
3.8 0.11
176.2 0.26
5.0 0.12
52.8 0.11
Nonsectarian 700.6 †
470.0 0.25
20.1 0.02
383.1 0.27
132.3 0.09
35.3 0.02 Regular 618.1 †
400.1 0.40
18.1 0.03
382.8 0.44
122.4 0.14
10.7 0.02
Special emphasis 187.1 †
118.6 0.11
7.2 0.04
6.0 0.06
48.9 0.13
30.0 0.07 Special education 87.6 †
86.0 0.06
4.9 0.02
4.9 0.03
0.0 0.01
0.0 0.01
School level Elementary 941.0 †
776.0 0.07
16.1 0.02
127.8 0.04
133.9 0.06
63.1 0.03
Secondary 1,083.2 †
1,027.4 0.23
28.2 0.02
30.0 0.12
1.2 0.07
27.6 0.02 Combined 931.1 †
982.4 0.25
12.9 0.02
428.2 0.23
89.1 0.04
6.6 0.02
Program emphasis Regular elementary/ secondary 1,866.2 †
1,778.0 0.14
33.0 0.02
469.4 0.12
152.8 0.04
62.3 0.02
Montessori 171.4 †
110.9 0.19
7.1 0.07
0.0 0.10
48.6 0.25
20.6 0.07 Special program
emphasis 51.5 †
22.0 0.13
1.1 0.03
5.6 0.02
5.5 0.02
21.7 0.15 Special education 164.7 †
152.5 0.09
10.1 0.04
11.7 0.04
0.0 0.01
5.9 0.02
Vocational/technical † †
† †
† †
† †
† †
† † Alternative 14.9 †
12.5 0.02
0.0 0.01
2.1 0.01
0.0 0.01
1.2 0.02
Early childhood 101.6 †
96.0 0.29
4.9 0.09
10.9 0.12
0.0 0.06
8.6 0.10 Size (number of students)
Less than 50 1,254.0 †
945.2 0.26
15.2 0.15
238.5 0.26
154.3 0.23
54.2 0.20 50–149 690.9 †
958.8 0.52
14.8 0.04
329.6 0.42
41.3 0.06
28.5 0.04
150–299 344.7 †
304.2 0.05
10.9 0.01
37.1 0.03
15.7 0.01
12.2 0.01 300–499 348.8 †
152.0 0.20
0.0 0.02
230.0 0.24
0.0 0.01
0.0 0.01
500–749 1,078.1 †
1,024.2 0.19
27.0 0.02
0.0 0.13
0.0 0.05
27.0 0.01 750 or more 696.4 †
696.4 0.16
0.0 0.03
0.0 0.08
0.0 0.03
0.0 0.02
Region Northeast 712.1 †
656.0 0.10
13.2 0.03
43.5 0.06
39.8 0.02
16.9 0.02
Midwest 1,743.2 †
1,640.6 0.53
31.7 0.06
463.8 0.46
154.1 0.14
56.0 0.07 South 393.1 †
317.4 0.01
11.8 0.01
73.9 0.03
2.0 0.01
8.2 0.01
West 33.8 †
29.0 0.01
2.6 #
3.6 #
4.6 #
1.7 # Urbanicity type
City 1,166.4 †
1,084.5 0.10
29.9 0.02
17.0 0.05
122.9 0.06
28.3 0.01 Suburban 677.5 †
493.7 0.10
20.7 0.02
241.3 0.12
53.8 0.03
35.3 0.02
Town 654.9 †
550.2 0.42
0.0 0.09
88.8 0.20
88.8 0.22
0.0 0.10 Rural 1,154.7 †
1,125.1 0.57
3.2 0.07
379.0 0.52
2.3 0.08
52.4 0.09
† Not applicable. # Rounds to zero. SOURCE: U.S. Department of Education, National Center for Education Statistics, Private School Universe Survey (PSS), 2011–2012.

C-13
Table C-12. Standard errors for pupil/teacher ratio of private schools, by school level and Table C-12.
selected characteristics: United States, 2011–12 Selected
characteristic
Total School level
Elementary Secondary Combined Total 0.03 0.03 0.04 0.08 Private school typology
Catholic 0.01 0.01 # 0.01 Parochial 0.01 0.01 0.00 0.06 Diocesan 0.01 # 0.04 0.02 Private 0.02 0.10 0.00 0.00 Other religious 0.08 0.07 0.03 0.13 Conservative Christian 0.06 0.16 0.00 0.06 Other affiliated 0.04 0.02 0.00 0.07 Unaffiliated 0.21 0.14 0.07 0.41 Nonsectarian 0.02 0.03 0.09 0.02 Regular 0.03 0.07 0.14 0.03 Special emphasis 0.01 0.01 0.04 0.01 Special education 0.02 0.10 0.00 0.02 Program emphasis
Regular elementary/ secondary 0.04 0.03 0.03 0.09
Montessori 0.01 0.01 † 0.00 Special program emphasis # 0.01 0.00 0.01 Special education 0.02 0.09 0.01 0.03 Vocational/technical † † † † Alternative # 0.01 0.01 0.00 Early childhood 0.04 0.04 † 0.00 Size (number of students)
Less than 50 0.06 0.10 0.01 0.05 50–149 0.02 0.05 0.01 0.03 150–299 0.02 0.01 0.10 0.04 300–499 0.02 0.01 0.00 0.02 500–749 0.02 0.00 0.02 0.00 750 or more 0.15 0.00 0.00 0.25 Region
Northeast 0.11 0.04 0.01 0.31 Midwest 0.07 0.08 0.04 0.13 South 0.02 0.04 0.06 # West # # # # Urbanicity type
City 0.02 0.02 0.04 0.02 Suburban 0.02 0.03 0.02 0.02 Town 0.12 # 0.00 0.24 Rural 0.19 0.20 # 0.32 † Not applicable. # Rounds to zero. SOURCE: U.S. Department of Education, National Center for Education Statistics, Private School Universe Survey (PSS), 2011–2012.

C-14
Table C-13. Standard errors for percentage of private schools with 12th-graders, number of graduates, Table C-13. Table C-13.
graduation rate, and percentage of graduates who attended 4-year colleges, by selected selected characteristics: United States, 2010–11
Selected characteristic
Percent of schools with 12th-graders
in 2010–11
Number of
2010–11 graduates
2010–11
graduation rate
Percent of 2010–11 graduates
who attended 4-year colleges
by fall 2011 Total 0.33
3,479.2
0.09
0.74
Private school typology Catholic 0.36
3,153.5
0.21
0.43
Parochial 0.04
0.0
0.00
0.00 Diocesan 0.76
3,153.5
0.46
0.99
Private 0.92
0.0
0.00
0.00 Other religious 0.78
1,441.9
0.02
1.39
Conservative Christian 1.37
384.5
0.02
2.48 Other affiliated 0.23
90.0
0.01
0.51
Unaffiliated 1.58
1,465.3
0.11
1.50 Nonsectarian 0.38
577.8
0.04
1.06
Regular 0.73
572.5
0.02
2.86 Special emphasis 0.16
78.0
0.11
0.56
Special education 0.73
1.0
0.02
0.03 School level
Elementary †
†
†
† Secondary 0.21
3,193.1
0.16
0.30
Combined 1.31
1,379.1
0.02
1.01 Program emphasis
Regular elementary/ secondary 0.54
3,482.4
0.10
0.94
Montessori 0.19
78.0
1.45
2.22 Special program emphasis 0.37
0.0
0.00
0.00
Special education 0.68
22.3
0.07
0.26 Vocational/technical †
†
†
†
Alternative 0.11
1.2
0.08
0.13 Early childhood †
†
†
†
Size (number of students) Less than 50 0.48
124.0
0.18
2.48
50–149 0.34
115.4
0.04
0.19 150–299 0.14
495.2
0.02
0.40
300–499 0.14
45.9
#
0.04 500–749 0.79
3,153.5
0.44
0.04
750 or more 0.13
1,462.5
#
# Region
Northeast 0.27
1,374.1
0.03
0.63 Midwest 1.03
3,158.5
0.40
3.44
South 0.30
489.6
0.01
0.14 West 0.03
29.1
0.01
0.10
Urbanicity type City 0.24
3,193.2
0.19
0.31
Suburban 0.19
90.1
0.01
0.20 Town 2.23
88.8
0.01
6.27
Rural 2.06
1,465.3
0.07
0.95 † Not applicable.
# Rounds to zero. SOURCE: U.S. Department of Education, National Center for Education Statistics, Private School Universe Survey (PSS), 2011–2012.

C-15
Table C-14. Standard errors for number of private schools, students, and teachers (headcount), Table C-14. by school membership in private school associations: United States, 2011–12 Association Schools Students Teachers Total 542.4 25,138.6 1,922.3 None 452.2 19,837.2 1,287.1 Religious
Accelerated Christian Education 126.9 4,606.5 658.8 American Association of Christian Schools 9.7 564.7 58.4 Association of Christian Schools International 1.0 58.4 9.2 Association of Christian Teachers and Schools 0.0 0.0 0.0 Association of Classical and Christian Schools 1.5 400.5 43.4 Christian Schools International 0.0 0.0 0.0 Evangelical Lutheran Education Association 1.0 16.0 3.0 Friends Council on Education 0.0 0.0 0.0 General Conference of the Seventh-Day Adventist Church 0.0 0.0 0.0 Islamic School League of America 0.0 0.0 0.0 Jesuit Secondary Education Association 0.0 0.0 0.0 National Association of Episcopal Schools 0.0 0.0 0.0 National Catholic Educational Association 29.0 14,503.5 1,088.3 National Christian School Association 0.0 0.0 0.0 National Society of Hebrew Day Schools 4.6 1,666.2 321.3 Oral Roberts University Educational Fellowship 0.0 0.0 0.0 The Jewish Community Day School Network 6.4 1,220.2 287.5 Solomon Schechter Day School Association 0.0 0.0 0.0 Southern Baptist Association of Christian Schools 0.0 0.0 0.0 Other religious school associations 75.9 1,642.0 418.5 Special emphasis
American Montessori Society 11.3 152.0 29.6 Association Montessori International 4.1 69.0 12.0 Other Montessori associations 4.7 408.5 50.5 Association of Military Colleges and Schools 0.0 0.0 0.0 Association of Waldorf Schools of North America 0.0 0.0 0.0 National Association of Private Special Education Centers 0.0 0.0 0.0 Other associations for exceptional children 1.2 46.1 5.9 European Council for International Schools † † † National Association for the Education of Young Children 15.5 190.7 15.5 National Association of Laboratory Schools 0.0 0.0 0.0 National Coalition of Girls' Schools 0.0 0.0 0.0 Other special emphasis school associations 0.0 0.0 0.0
Other school associations or organizations Alternative School Network 0.0 0.0 0.0
National Association of Independent Schools 0.0 0.0 0.0 State or regional independent school association 5.5 116.4 25.6
National Coalition of Alternative Community Schools 0.0 0.0 0.0 National Independent Private School Association 0.0 0.0 0.0 The Association of Boarding Schools 0.0 0.0 0.0 Other school associations 33.1 3,357.9 333.3 † Not applicable.
SOURCE: U.S. Department of Education, National Center for Education Statistics, Private School Universe Survey (PSS), 2011–2012.

C-16
Table C-15. Standard error for number of private schools, students, full-time equivalent (FTE) Table C-15. teachers, and 2010-11 high school graduates, by state: United States, 2011–12 State
Schools
Students
FTE teachers
High school graduates 2010–11
United States 542.4 25,138.6 1,836.0 3,479.2 Alabama 1.3 29.0 0.8 0.0 Alaska 0.0 0.0 0.0 0.0 Arizona 4.7 132.1 16.2 0.0 Arkansas 73.2 1,171.7 336.9 0.0 California 1.8 83.7 12.1 1.0 Colorado 2.0 55.7 4.1 0.0 Connecticut 17.8 142.2 67.5 0.0 Delaware 0.0 0.0 0.0 0.0 District of Columbia 0.0 0.0 0.0 0.0 Florida 2.3 140.4 36.5 0.0 Georgia 0.0 0.0 0.0 0.0 Hawaii 0.0 0.0 0.0 0.0 Idaho 4.2 186.5 17.3 3.8 Illinois 53.4 1,261.2 221.0 49.4 Indiana 198.2 11,871.0 994.9 374.1 Iowa 50.5 14,664.7 1,078.2 † Kansas 193.2 1,639.8 445.9 0.0 Kentucky 1.0 12.0 1.0 0.0 Louisiana 2.0 38.7 4.6 0.0 Maine 0.0 0.0 0.0 0.0 Maryland 8.2 389.7 42.2 0.0 Massachusetts 43.6 985.3 322.8 0.0 Michigan 7.0 216.4 51.7 0.0 Minnesota 0.0 0.0 0.0 0.0 Mississippi 0.0 0.0 0.0 0.0 Missouri 467.7 8,052.4 950.7 88.8 Montana 0.0 0.0 0.0 0.0 Nebraska 0.0 0.0 0.0 0.0 Nevada 0.0 0.0 0.0 0.0 New Hampshire 0.0 0.0 0.0 0.0 New Jersey 18.3 688.0 208.3 70.7 New Mexico 1.0 10.3 1.9 0.0 New York 31.0 18,737.9 821.2 1,462.5 North Carolina 0.0 0.0 0.0 0.0 North Dakota 0.0 0.0 0.0 † Ohio 59.2 2,620.0 395.7 123.9 Oklahoma 9.6 698.2 71.6 17.1 Oregon 0.0 0.0 0.0 0.0 Pennsylvania 60.1 3,510.8 467.5 90.2 Rhode Island 0.0 0.0 0.0 0.0 South Carolina 0.0 0.0 0.0 0.0 South Dakota 0.0 0.0 0.0 0.0 Tennessee 1.1 13.0 2.2 0.0 Texas 17.9 1,852.5 101.3 489.3 Utah 2.2 55.4 5.9 1.2 Vermont 0.0 0.0 0.0 0.0 Virginia 2.1 81.9 11.0 1.1 Washington 5.4 232.5 21.5 30.0 West Virginia 1.0 1.0 1.0 1.0 Wisconsin 0.0 0.0 0.0 0.0 Wyoming 0.0 0.0 0.0 † † Not applicable.
SOURCE: U.S. Department of Education, National Center for Education Statistics, Private School Universe Survey (PSS), 2011–2012.


