
CHARACTERIZING LANDSCAPE DYNAMICS BY GENERAL AND SPECIFIC
GEOMORPHOMETRIC TECHNIQUES
George Ch. MILIARESIS
Department of Topography, Technological Educational Institute of Athens,
38 TRIPOLEOS Str., ATHENS 104-42, GREECE,
tel.: 0977-047.123, 010-512.87.13, email: [email protected]
ABSTRACT
The paper focus on the characterization and modeling of the regional (scale)
GLOBE digital elevation model (DEM) representation of the earth’s relief in Minor
Asia with particular emphasis on the implementation of geomorphometric
techniques. At first general geomorphometric parameters defined per pixel of the
DEM are computed and the resulting statistics are studied in an attempt to
characterize the landscape. Mountain terrain class statistics are different than the
overal statistics of the study area, while the comparison with Zagros Ranges
indicated signaficant differences to mean values and to frequency distributions,
indicating a more dissected and eroded landscape in Minor Asia. Then an object
partitioning framework (pattern) of the landscape was defined (specific
geomorphometry approach) on the basis of the DEM to mountain transformation
which revealed 702 distinct mountain features. The individual mountain features
were parametrically represented on the basis of mean gradient, mean elevation,
and massiveness. The density slicing of the domain of each geomorphometric
parameter to four classes and its mapping indicated a stair step topography in
East to West direction (while in Zagros the stair step topography is developed
from SW to NE) and clusters of mountain features that are spatially arranged in
specific zones on the basis of massiveness and gradient, providing a framework
for subdividing the landscape of Minor Asia in sub-regions with different
geomorphometric behavior.
1
1. INTRODUCTION AND AIM
New concepts, data, and methods, emergent in geographic information science
in recent years have presented scientists with new opportunities to gain fresh
insights into the study of landscape (Pike 1995, Saura and Martinez 2001).
Landscape dynamics is considered to involve scale, pattern and process that
extend across various geographical domains through their spatial interactions. In
the current approach, a) scale is regional or physiographic (Miliaresis and
Argialas 1999), b) pattern expresses the partition of landscape to elementary
units and their representation on the basis of their spatial 3-dimensional
arrangement (Miliaresis 2001a) and c) process expresses the relationship
between tectonics and topography (Merits and Ellis 1995, Summerfield 2000).
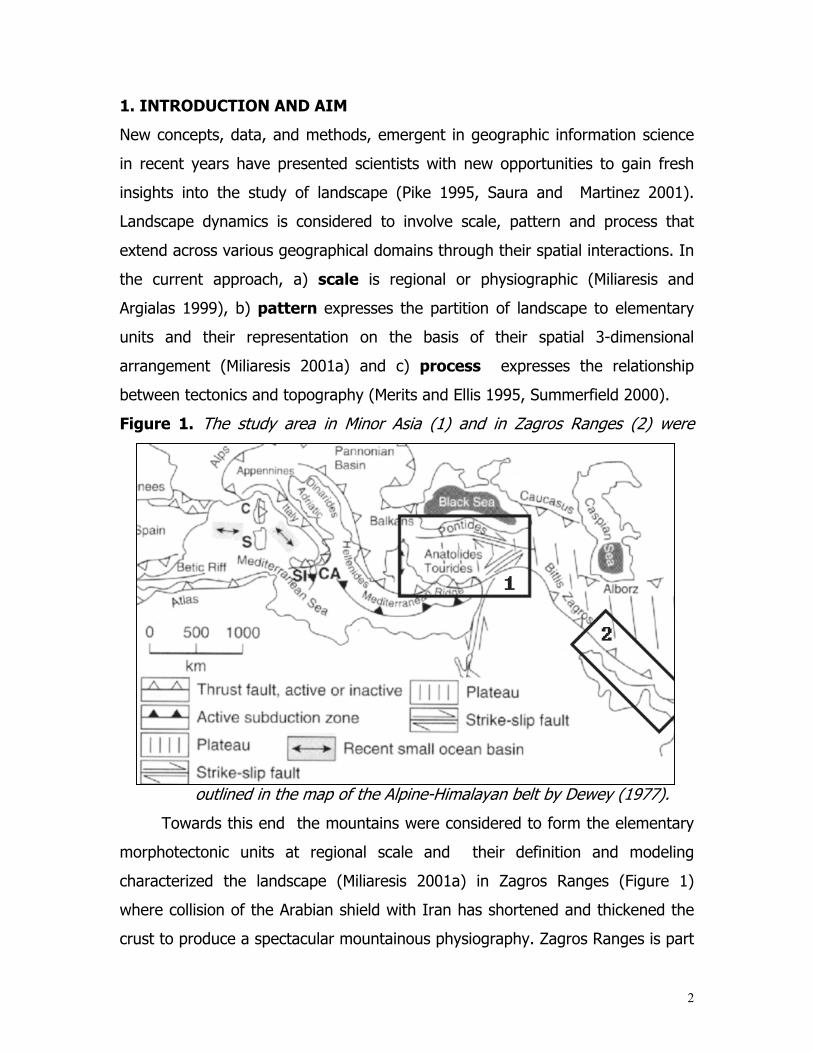
Figure 1. The study area in Minor Asia (1) and in Zagros Ranges (2) were
outlined in the map of the Alpine-Himalayan belt by Dewey (1977).
Towards this end the mountains were considered to form the elementary
morphotectonic units at regional scale and their definition and modeling
characterized the landscape (Miliaresis 2001a) in Zagros Ranges (Figure 1)
where collision of the Arabian shield with Iran has shortened and thickened the
crust to produce a spectacular mountainous physiography. Zagros Ranges is part
2
of Alpine-Himalayan belt that is extended through Turkey to eastern Greece.
Additionally, the mountain features in Minor Asia were extracted and labeled
(702 distinct objects were identified) from a moderate resolution DEM (Miliaresis
and Paraschou 2002). It would be of great scientific interest if the landscape
from Iran to Greece was parameterized and quantitatively compared.
The paper focus on the characterization and modeling of the regional
scale digital elevation model (DEM) representation of the earth’s relief in Minor
Asia (Figure 1) with particular emphasis on the implementation of
geomorphometric techniques (Goudie 1981, Pike 2000). This is the first research
stage in which a rather unsupervised classification-characterization methodology
was implemented. This means that no training data were selected in certain
tectonic regimes in order to capture the geometric signature of landscape that it
is related to certain tectonic processes.
2. METHODOLOGY
First the study area and the digital relief representation selected are introduced.
Then general geomorphometric parameters (Evans 1981) defined for every pixel
of the DEM are computed and the resulting statistics are used in an attempt to
characterize the landscape. Finally, the specific geomorphometric approach is
implemented that requires the definition of an object partitioning framework of
the landscape (Jarvis 1981). The statistics are calculated for every object and
the objects parametric (quantitative) representation is used for landscape
subdivision and interpretation.
2.1 Study Area and DEM
The study area is bounded by four points expressed as latitude, longitude pairs:
(42oN, 26oE), (42oN, 45oE), (36oN, 44o15’E), (36oN, 26oE) and it coincides to the
physiographic zone of Minor Asia where horizontal expulsion is taking place. Most
of the area is extruding westward away from the Arabian-Eurasian collision and
toward the small remnant of oceanic crust underlying the eastern Mediterranean
3
Sea (Yeats, Sieh and Allen, 1997). Within the study area (Figure 1) are a) the
North Anatolian Fault (NAF, with total length of 1500 km) and b) the East
Anatolia Fault (EAF, with size of 580 km). EAF marks the Anatolian-Arabian plate
boundary while Zagros Ranges fold zone is the outcome of the collision between
Eurasian and Arabian plate.
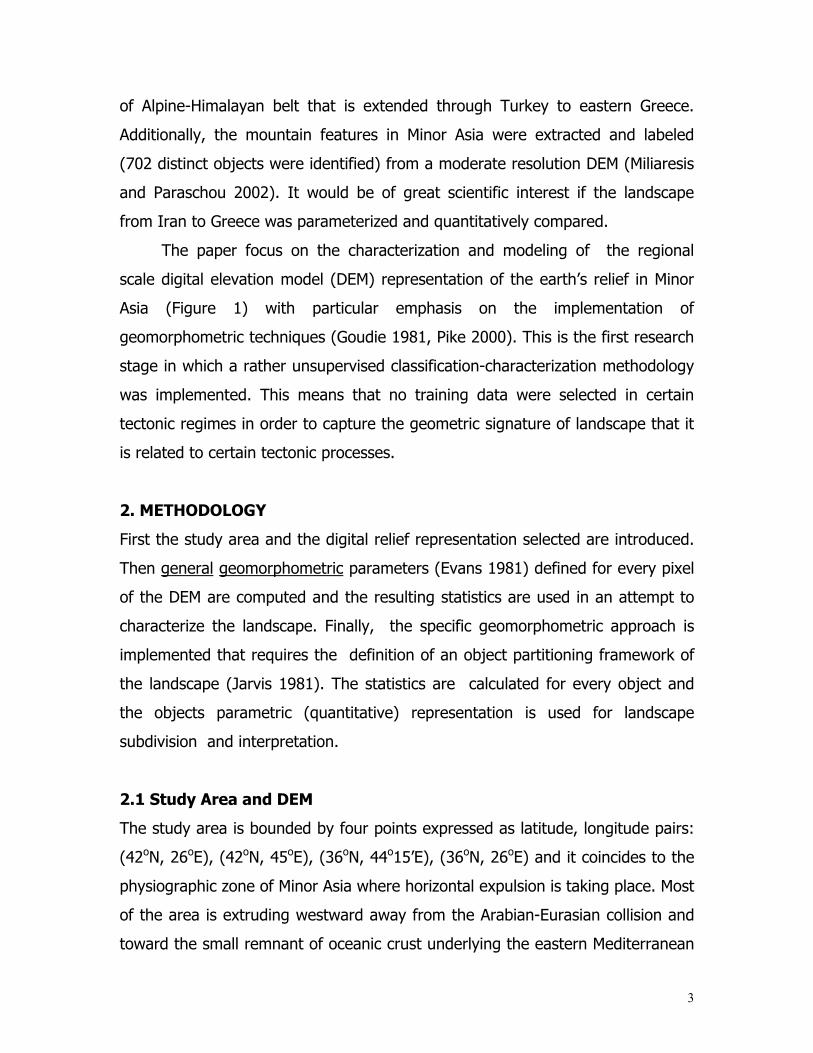
The Global Land One-kilometer Base Elevation (GLOBE) DEM is used
(Globe 2001). Globe, the most thoroughly designed, reviewed, and documented
global DEM today (Hastings and Dunbar 1998) comprises a 30" latitude-
longitude array (referenced to World Geodetic System 84) with land areas
populated with integer elevation data. The Globe DEM of the study area was
reprojected to a rectangular grid for the spacing to be 1000 m in both N-S and E-
W directions and resampled (by nearest neighbor). Finally, the DEM of the study
area consists of 665 rows and 1,600 columns (Figure 2).
Figure 2. Globe DEM of the study area. The elevation values (1 to 4,916 m)
were rescaled to the interval 255 to 0 (the brightest pixels have lowest
elevation). The study area (land) occupies 885,260 pixels (1 pixel=1
km2) out of 1,064,000 image pixels.
4
2.2 General Geomorphometric Signature
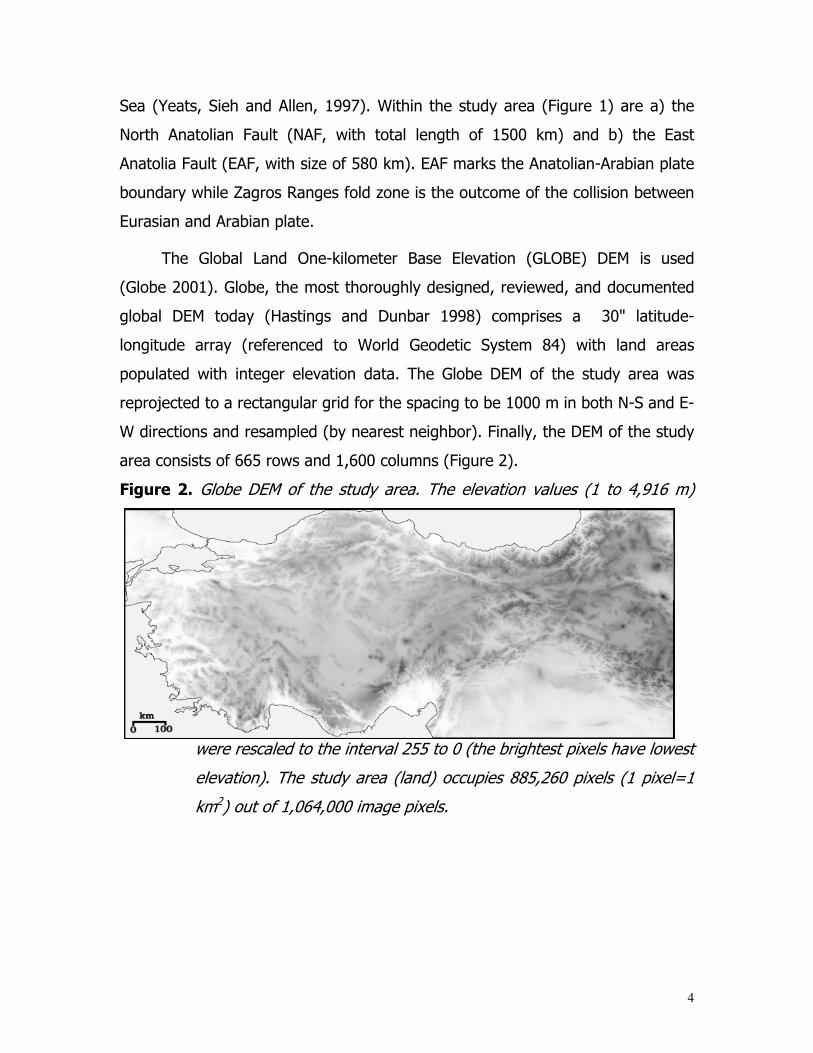
The general geomorphometry attributes used are elevation, gradient, aspect,
profile and planar curvature (Evans 1980). Note that profile and planar
curvatures were proved to be indicators of lineaments and fault morphology
(Florinsky 1996). These attributes are calculated for every node of the DEM and
their statistics including the hypsometric integral (massiveness) and hypsometric
curve (Pike and Wilson 1971) are used to characterize the landscape either at
local (Mark 1975) or even at planet scale (Cogley 1985). In another attempt
these attributes were used in a pixel based unsupervised classification procedure
aiming to capture the geometric signature of landforms (Pike 1987).
Figure 3. Color composite map of gradient (blue), profile curvature (green) and
planar concavity (red) superimposed over the shaded relief map
derived from the Globe DEM representation of Minor Asia.
The easiest way to visualize the geomorphometric signature and the
landscape pattern is by creating a color composite image of gradient, profile and
planar concavity and elevation (the last participating as the shaded relief
component). As we see in Figure 3, we are capable of delineating the major fault
and ring structures and characterizing the density-roughness of the landscape by
visual interpretation. The major disadvantage is that we can not establish a
metric system that could compare the landscape of this area to another one in a
quantitative and less subjective manner.
5

That is why the geomorphometric signature of Minor Asia will be summarized by
computing statistics for the general geomorphometric variables. Note that
statistics will computed not only for the DEM of the study area. The underlying
idea is that mountain and the non-mountain terrain class are usually under a
different (kind or intensity) physical process than the surrounding basins
(Miliaresis 2001a). These differences should be decomposed if statistics are
computed for the mountain terrain class (Figure 4) of Minor Asia that was
segmented by Miliaresis and Paraschou (2002).
Figure 4. The mountain terrain class (319,523 pixels labeled black).
Table 1. Statistics for the study area (885,817 pixels) and the mountain terrain
class (319,523 pixels) in the form of mean value ± standard deviation.
Attribute Study area Mountain Terrain Class
1. Elevation 1,100.3 ± 664.9 m 1430.3 ± 671.5 m
2. Gradient 6.14o ± 8.4o 10.85o ± 11.6o
3. Massiveness 0.224 0.291
The statistics are summarized in table 1 and in figures 5, 6, 7 and 8. Note that
the figures were derived and the method was implemented in a revised version
of the computer program GeoLogic Shell (Miliaresis 2001b), distributed from the
web site of the International Society for Mathematical Geology (IAMG 2002).
6

Figure 5. Elevation: frequency and cummulitative distribution for the DEM
(above) and the mountain terrain class (below).
Figure 6. Hypsometric curve (percentage or relative) for the DEM (right) and
the mountain terrain class (left). Rose diagram of aspect pointing
downslope (left).
7
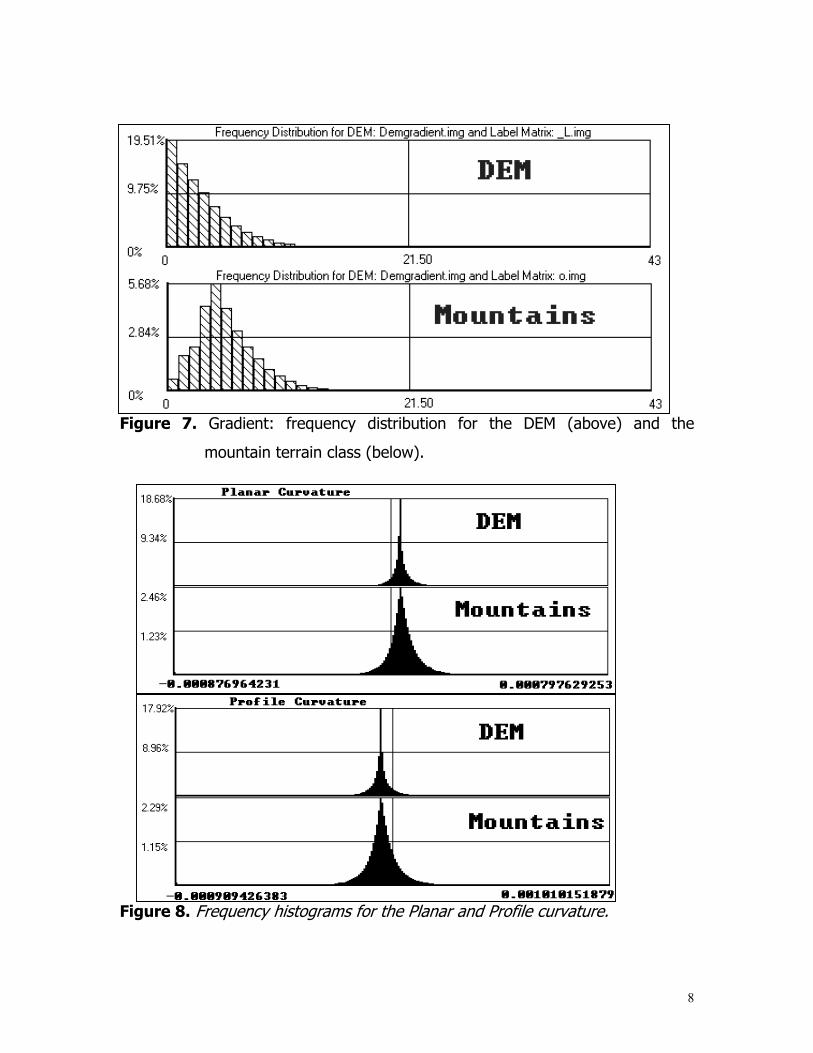
Figure 7. Gradient: frequency distribution for the DEM (above) and the
mountain terrain class (below).
Figure 8. Frequency histograms for the Planar and Profile curvature.
8
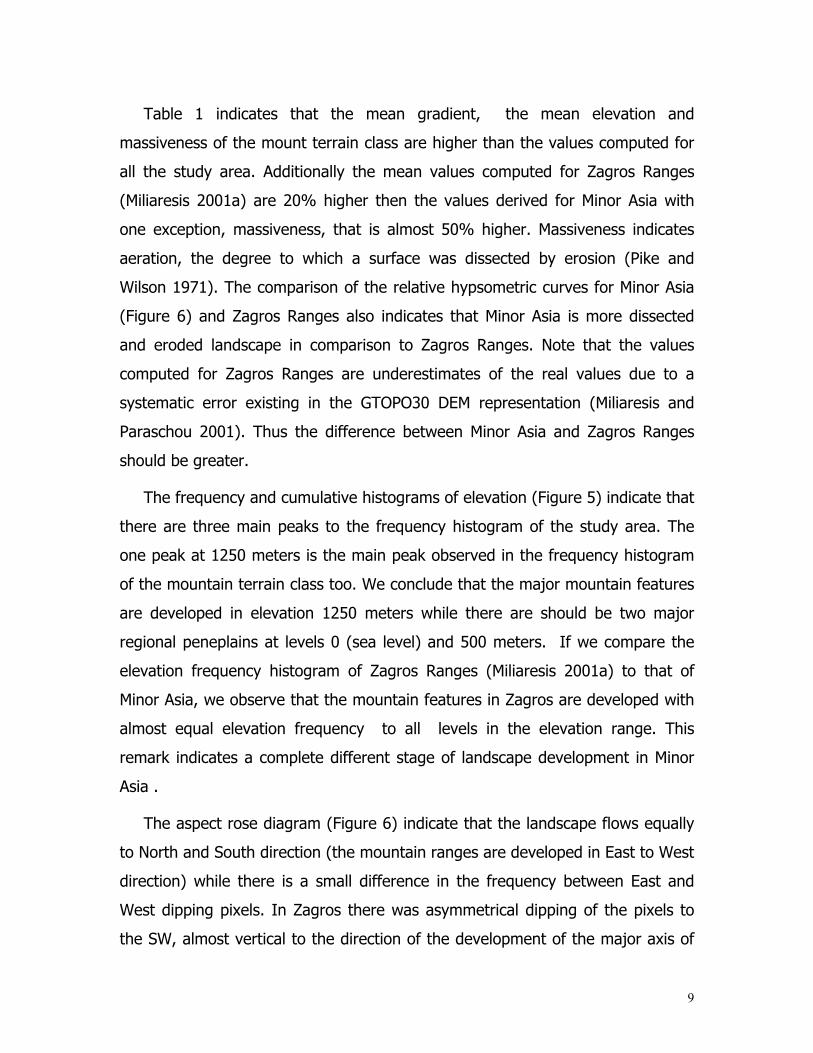
Table 1 indicates that the mean gradient, the mean elevation and
massiveness of the mount terrain class are higher than the values computed for
all the study area. Additionally the mean values computed for Zagros Ranges
(Miliaresis 2001a) are 20% higher then the values derived for Minor Asia with
one exception, massiveness, that is almost 50% higher. Massiveness indicates
aeration, the degree to which a surface was dissected by erosion (Pike and
Wilson 1971). The comparison of the relative hypsometric curves for Minor Asia
(Figure 6) and Zagros Ranges also indicates that Minor Asia is more dissected
and eroded landscape in comparison to Zagros Ranges. Note that the values
computed for Zagros Ranges are underestimates of the real values due to a
systematic error existing in the GTOPO30 DEM representation (Miliaresis and
Paraschou 2001). Thus the difference between Minor Asia and Zagros Ranges
should be greater.
The frequency and cumulative histograms of elevation (Figure 5) indicate that
there are three main peaks to the frequency histogram of the study area. The
one peak at 1250 meters is the main peak observed in the frequency histogram
of the mountain terrain class too. We conclude that the major mountain features
are developed in elevation 1250 meters while there are should be two major
regional peneplains at levels 0 (sea level) and 500 meters. If we compare the
elevation frequency histogram of Zagros Ranges (Miliaresis 2001a) to that of
Minor Asia, we observe that the mountain features in Zagros are developed with
almost equal elevation frequency to all levels in the elevation range. This
remark indicates a complete different stage of landscape development in Minor
Asia .
The aspect rose diagram (Figure 6) indicate that the landscape flows equally
to North and South direction (the mountain ranges are developed in East to West
direction) while there is a small difference in the frequency between East and
West dipping pixels. In Zagros there was asymmetrical dipping of the pixels to
the SW, almost vertical to the direction of the development of the major axis of
9
mountain ranges (Miliaresis 2001a). The difference between the frequency
histogram of gradient of the study area and the mountain terrain class (Figure 7)
was expected since steep mountain sides are included in the mountain terrain
class while flat peneplains are excluded. Profile and planar curvature histograms
(Figure 8) indicate that the mean values are the same, but there is a difference
in standard deviation. The histogram of the mountain terrain class having greater
standard deviation than that of the overall histogram of the study area. This
remark is acceptable since change of curvature is more often over the mountain
ranges due to the most frequent evident of ridges, valleys, faults and folds
(zones of high curvature). Curvatures were not computed in Zagros Ranges for
a comparison to be made.
2.3 Specific Geomorphometric Signature
Then an object partitioning framework (pattern) of the landscape was defined
(specific geomorphometry approach) on the basis the mountain terrain class.
The image (Figure 4) was scanned by connencted component algorithm and 702
distinct mountain features were revealed. The individual mountain features were
parametrically represented on the basis of mean gradient, mean elevation (an
indicator of the mean volume above sea level per unit area) and massiveness.
The domain of each attribute was sliced into four intervals (Table 2) by taking
into account the spatial occurrence. Each interval was mapped by a different
shade of gray (Figure 9).
Table 2. The intervals to which the domain of each attribute was sliced.
Interval 1 2 3 4
Hmean (m) 160,1279 1280, 1679 1680, 1914 1915, 2763
Grad (o) 1.48, 8.14 8.15, 9.99 10, 12.4 12.5, 21.83
Attr
ibut
e
Massiveness .180, .349 .350, .448 .449, .598 .599, .833
Shading
10
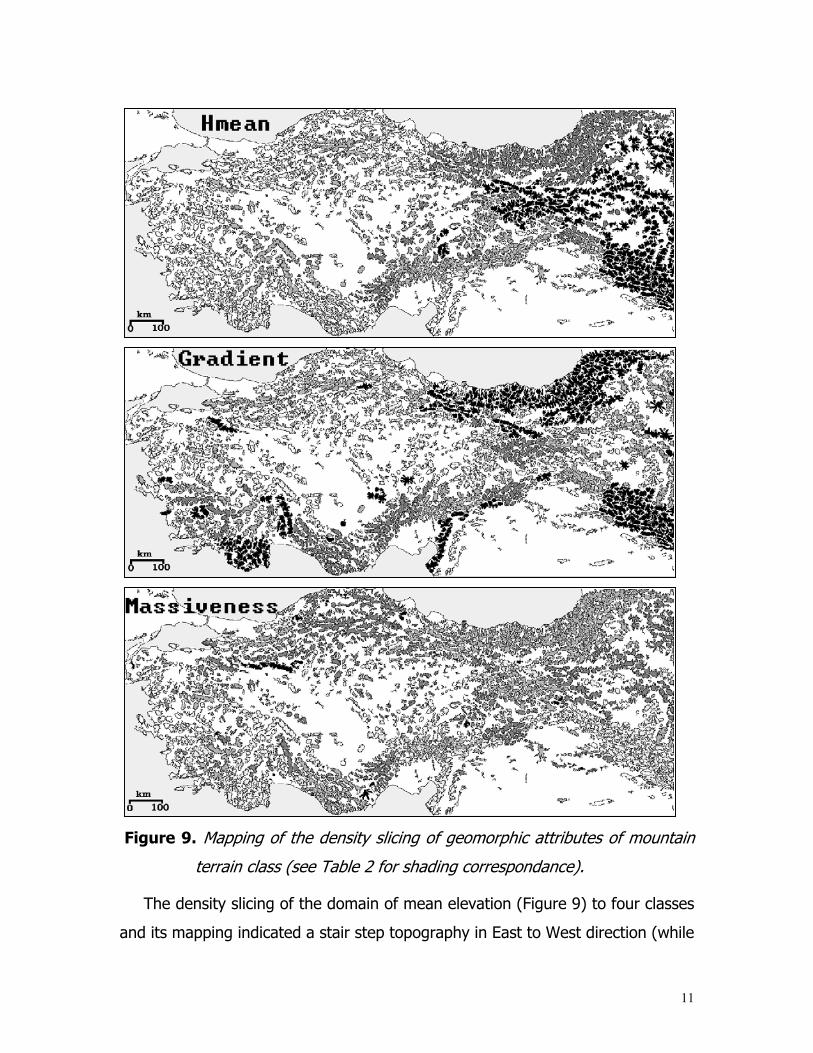
Figure 9. Mapping of the density slicing of geomorphic attributes of mountain
terrain class (see Table 2 for shading correspondance).
The density slicing of the domain of mean elevation (Figure 9) to four classes
and its mapping indicated a stair step topography in East to West direction (while
11

in Zagros the stair step topography is developed from SW to NE). The slicing of
the domain of massiveness and gradient (Figure 9) indicated clusters of
mountain features that are spatially arranged in specific zones, providing a
framework for subdividing the landscape in sub-regions with different
geomorphometric behavior. More specifically. two clusters of mountains NE and
SE have the greatest gradient while North mountain features are more massive
in general than the South ones.
3. CONCLUSION AND PROSPECTS
The numerical and graphical (histograms and hypsometric curves) representation of the
study area and it’s subset mountain terrain class are different. The comparison of Minor Asia to
Zagros Ranges indicated a different kind of landscape development supporting the idea that the
landscape of Minor Asia is more eroded and dissected. The numeric representation of isolated
mountains identified within the mountain terrain class revealed spatial patterns, expressing the
regional and possibly the residual tectonic process evident in the study area.
In the future Zagros Ranges will be analysed again from the more accurate GLOBE relief
representation in comparison to the GTOPO30 DEM used. Curvatures statistics will be computed
for Zagros Ranges too. The mountain features of the both mountain terrain classes (Minor Asia
and Zagros Ranges) will be classiffied at the same time in an attempt to detect mountain features
with the same or extremely different parametric representation in both regions. The last step will
allow the definition of sub-regions within a major physiographic zone. An initial analysis
(Miliaresis and Argialas 2002) in Basin and Range (SW USA) using the simplest clustering
algorithm (K-Means) gave promising results.
4. REFERENCES
Cogley G., 1985. Hypsometry of Continents. Zeitshcrift f. Geomorphologie N.F.
suppl. Bd. 53, 1-48.
Dewey J., 1977. Suture zone complexities, a review. Tectonophysics, Vol. 40, 69-
100.
Evans, I., 1980. An integrated system for terrain analysis and slope mapping.
Zeitschrift fuer Geomorphologie N.F. Suppl.-Bd., 36, 274-290.
Evans I., 1981. General Geomorphometry. In: Geomorphologic Techniques, A.
Goudie (Ed.) London, George Allen & Unwin, pp. 31-37.
12
Florinski I., 1996. Quantitative Topographic Method of Fault Morphology
Recognition. Geomorphology, Vol. 16, 103-119.
Globe, 2001. Global Land One-km Base Elevation digital elevation model,
(version 1.1). http://www.ngdc.noaa.gov/seg/topo/globe.shtml.
Goudie A. (Ed.), 1981. Geomorphologic Techniques (British Geomorphological
Research Group). London, George Allen & Unwin, 394 p.
IAMG, 2002. International Society for Mathematical Geology.
http://www.iamg.org/ , ( ftp.iamg.org , file v27-10-05.zip ).
Hastings D. and P. Dunbar 1998. Development & assessment of the Global Land
One-km Base Elevation digital elevation model (GLOBE). ISPRS Archives,
32(4): 218-221
Jarvis R., 1981. Specific Geomorphometry. In: Geomorphologic Techniques, A.
Goudie (Ed.) London, George Allen & Unwin, pp. 42-46
Merritts D. and Ellis M., 1994. Introduction to special section on tectonics and
topography. Journal of Geophysical Research 99 (B6), 12135-12141.
Mark D., 1975. Geomorphometric parameters, a review and evaluation.
Geographiska Annaler 57A (10), 1461-1467.
Miliaresis G., 2001 (a). Geomorphometric Mapping of Zagros Ranges at
Regional Scale. Computers & Geosciences, Vol. 27, no 7, 775-786.
Miliaresis G., 2001 (b). Extraction of Bajadas from Digital Elevation Models and
Satellite Imagery. Computers & Geosciences, Vol. 27, no 10, 1157-1167
Miliaresis G. and Argialas D., 1999. Segmentation of physiographic features
from the global digital elevation model/GTOPO30. Computers & Geosciences,
Vol. 25, no 7, 715-728.
Miliaresis, G. Ch. and D.P. Argialas, 2002. Quantitative Representation of
Mountain Objects Extracted from the Global Digital Elevation Model. International
Journal of Remote Sensing, Vol. 23, 949-964.
13
14
Miliaresis G., Paraschou Ch., 2001. A feature based accuracy evaluation of
GTOPO30 DEM. Proceedings, of the Remote Sensing and Photogrammetry
Society, session in Terrain Modeling. 12th-14th September, London, 203-213 p.
Miliaresis G. and Paraschou Ch., 2002. The Globe DEM Parameterization of the
mountain features of Minor Asia. ASPRS Annual Conference, Session: "GIS
& CARTOGRAPHY, Spatial Decision Making", April 19 - 26, Washington DC,
8 pp.
Pike R. and Wilson S., 1971. Elevation-Relief Ratio, Hypsometrical Integral, and
Geomorphic Area-Altitude Analysis. Geological Society of America Bulletin,
vol. 82, 1079-1084.
Pike R., 1988. The geometric signature: quantifying landslide-terrain types from
digital elevation models. Mathematical Geology, vol. 20, 491-511.
Pike R., 1995. Geomorphometry-process, practice and prospects. Zeitshcrift f.
Geomorphologie N.F. suppl. Bd. 101, 221-238.
Pike R., 2000. Geomorphometry - diversity in quantitative surface analysis.
Progress in Physical Geography, 24 (1): 1-21.
Saura S., Martinez J., 2001. Sensitivity of Landscape Pattern Metrics to Map
Spatial Extent. Photogrammetric Engineering and Remote Sensing, Vol. 67,
no (9) 1027-1036.
Summerfield M. (Ed.), 2000. Geomorphology and Global Tectonics. John Wiley &
Sons, New York, 386 p.
Yeats, R., Sieh K. and Allen C., 1997. The geology of earthquakes. Oxford
University Press, New York, 569 p.


