Download - Chart Tools Consumer Online

Consumer Online Chart Tools
Group 2 - Chris, Lisa, Markus & Romy

Reviewed Visualization Tools
1. Flourish flourish.studio (Markus)
2. 23degrees app.23degrees.io (Markus)
3. Datawrapper datawrapper.de (Chris)
4. ECharts echarts.apache.org (Chris)
5. Infogram infogram.com (Romy)
6. plotly chart-studio.plotly.com (Romy)
7. Everviz everviz.com (Lisa)
8. RAW rawgraphs.io (Lisa)
1. Chartblocks chartblocks.com 2. Amcharts live.amcharts.com 3. OnlineChartTool onlinecharttool.com 4. Canva canva.com 5. Tableau tableau.com 6. Visme visme.co/graph-maker 7. Livegap livegap.com 8. Google-App app.diagrams.net
2
Mode of Operation
3
4 data sets
● Inhabitants of 3 districts in Graz divided by age (Grouped Column Chart)
● COVID-19 Active cases in 4 countries over 2 months (Line Chart)● 30 movies including 6 dimensions of data (Scatter Plot)● Nuclear power plants in Europe (Miscellaneous Plot)
Tried to visualize in the same way on every platformIf not possible -> try to represent data as clearly as you can
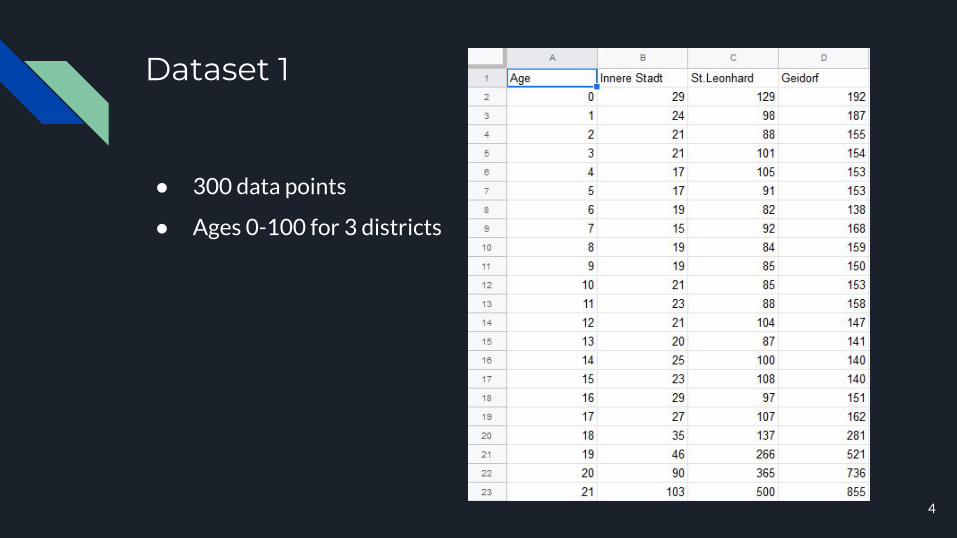
Dataset 1
● 300 data points
● Ages 0-100 for 3 districts
4

Dataset 2
● 232 data points
● 58 days for 4 countries
● 25. February - 22. April
5
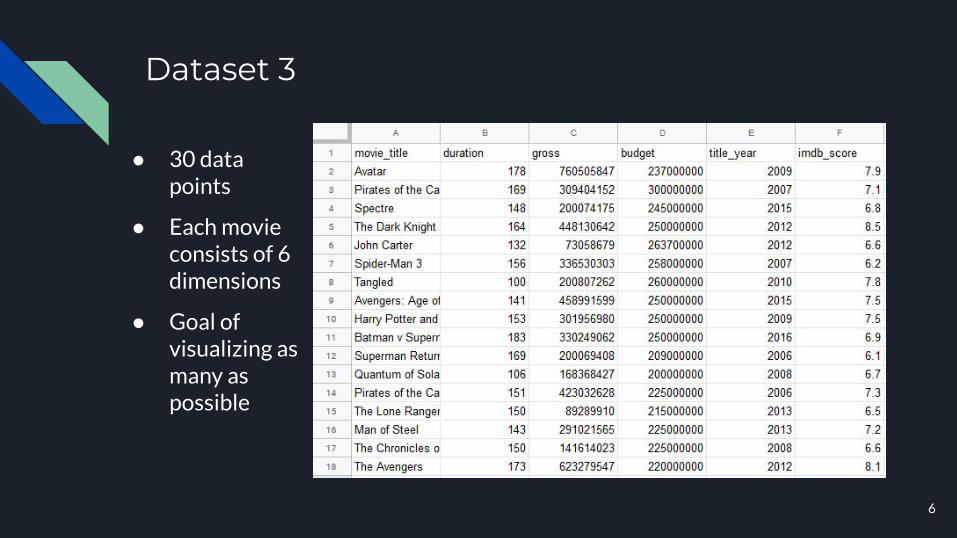
Dataset 3
● 30 data points
● Each movie consists of 6 dimensions
● Goal of visualizing as many as possible
6

Dataset 4
7
● 150 data points
● Each nuclear power plant with 6 dimensions
● Goal of visualizing the data to the best capabilities of the application

Grading System
5 Categories:
1. Simplicity2. Documentation3. Customizability4. Privacy5. Components
- Each scored from 0-4 to give quick overview - Grades were decided in group to keep them objective- Final Grade is average of the 5 categories
8
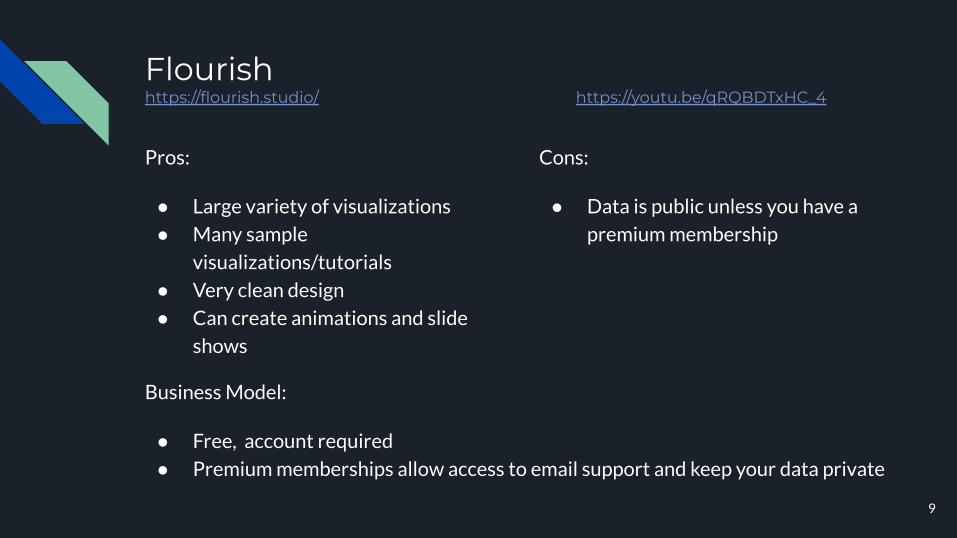
Flourishhttps://flourish.studio/ https://youtu.be/qRQBDTxHC_4
Pros:
● Large variety of visualizations
● Many sample
visualizations/tutorials
● Very clean design
● Can create animations and slide
shows
Cons:
● Data is public unless you have a
premium membership
Business Model:
● Free, account required
● Premium memberships allow access to email support and keep your data private
9

Flourish - Visualizations
Column Chart:
Line Chart:
10
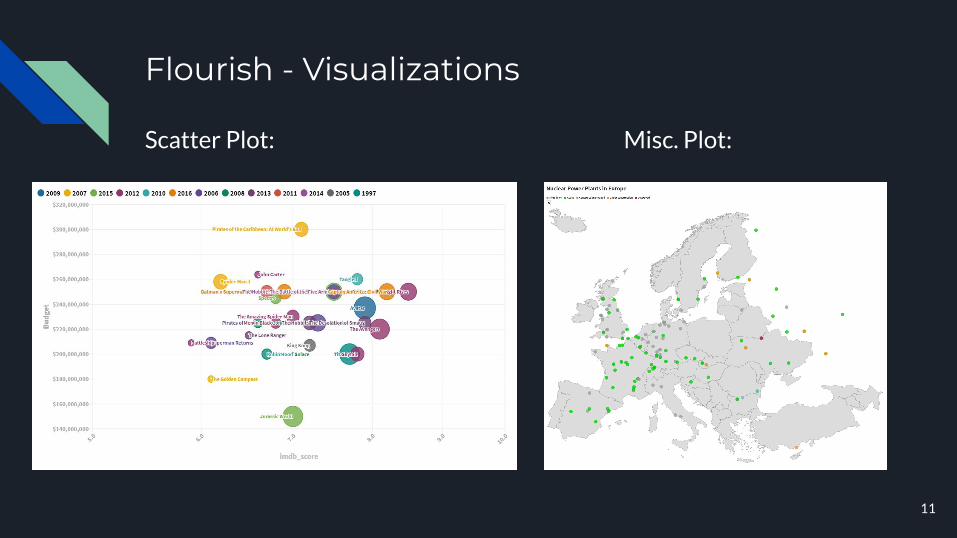
Flourish - Visualizations
Scatter Plot: Misc. Plot:
11
23degreeshttps://app.23degrees.io/ https://youtu.be/C07CnVNsPgg
Pros:
● Good number of customization
options
Cons:
● Data is public unless you have a
premium membership
● No option to download
visualization
● No tutorials
● Types of visualizations limited
● Very hard to modify dataset
after importing
Business Model:
● Free, account required
● Premium memberships allow
downloading and more customizability
12
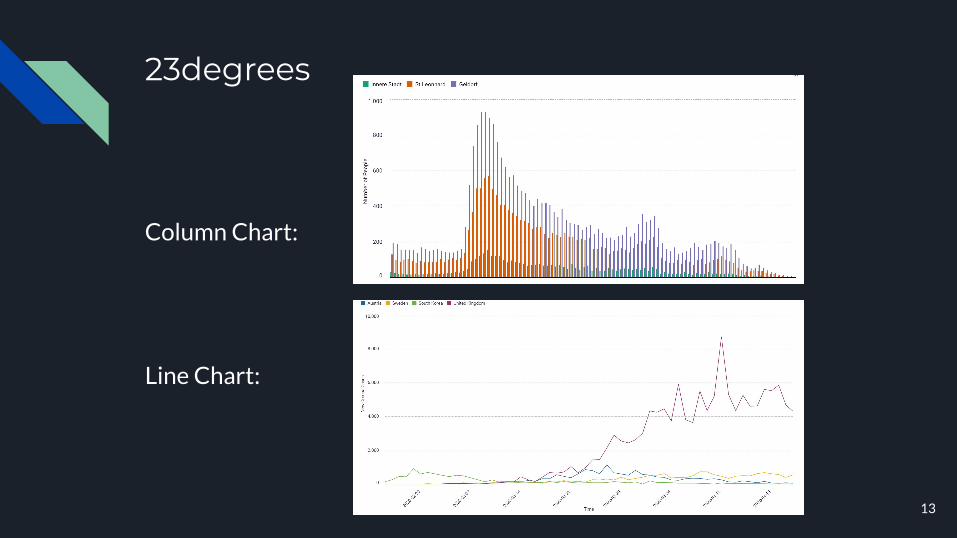
23degrees
Column Chart:
Line Chart:
13
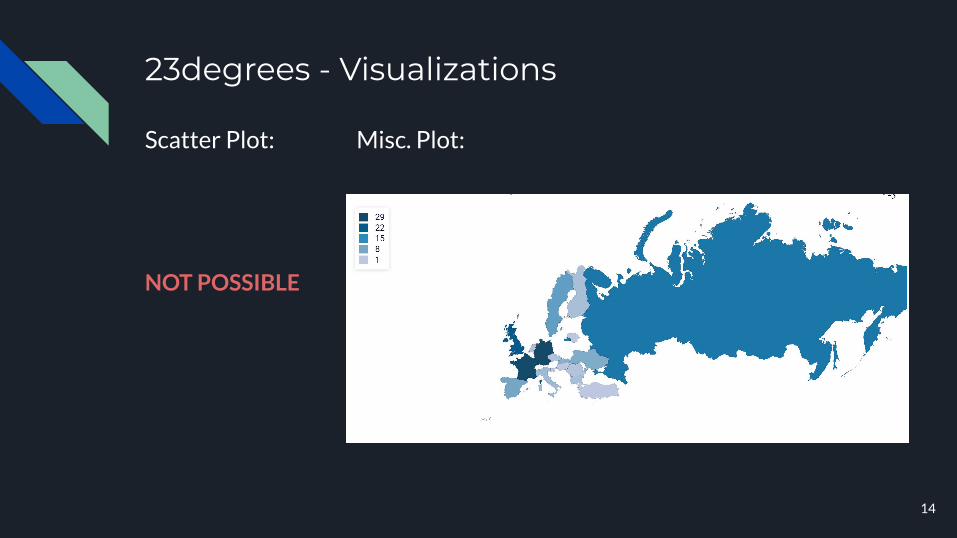
23degrees - Visualizations
Scatter Plot: Misc. Plot:
NOT POSSIBLE
14
Datawrapperhttps://www.datawrapper.de/ https://youtu.be/-Ex-P4yI3rs
Pros:
● Documentation + Tutorials
● Ease of Use
● Design
● No Account needed
Cons:
● Limited customization options
● Visualization depends on dataset
formatting -> this can get very
tedious at times
Business Model:
Generally free - offers 2 paid tiers for small businesses and enterprise use
15
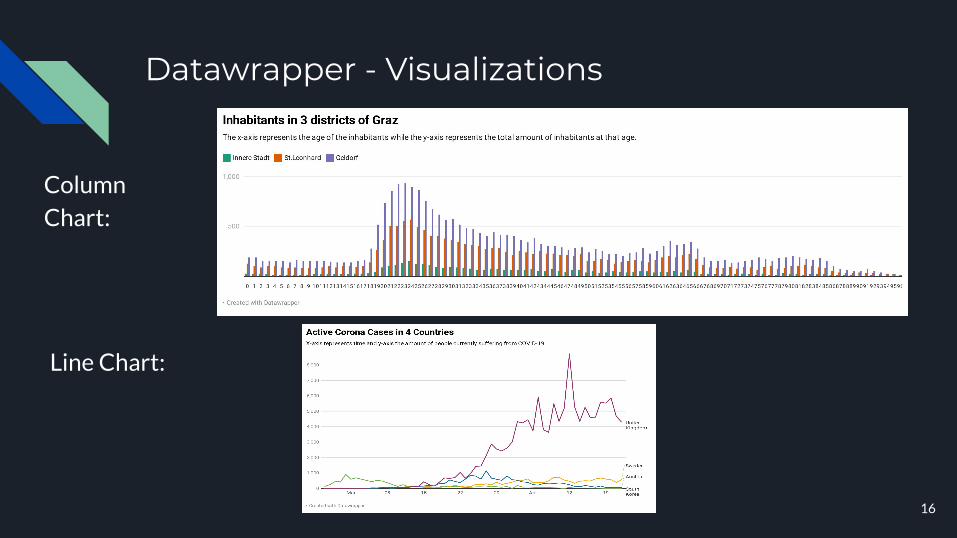
Datawrapper - Visualizations
Column Chart:
Line Chart:
16
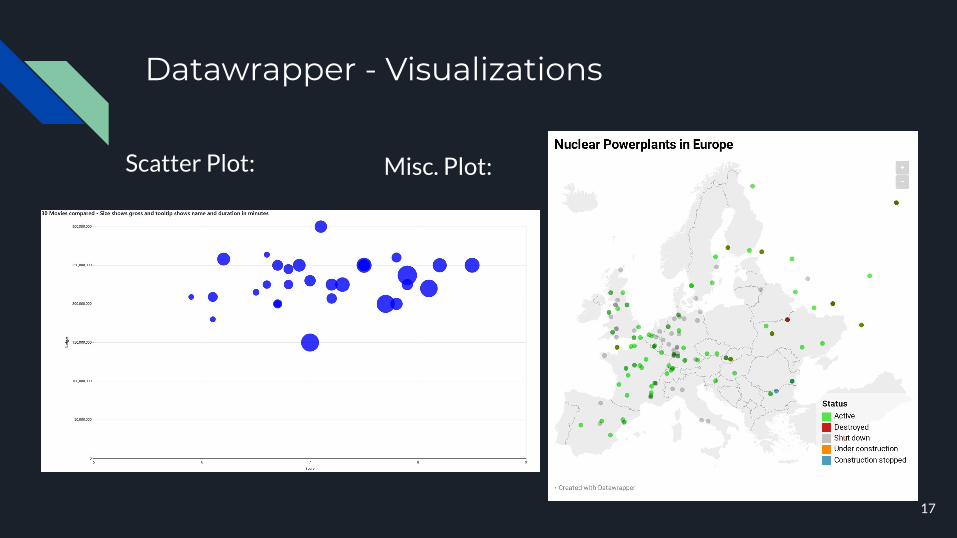
Datawrapper - Visualizations
Scatter Plot: Misc. Plot:
17
Infogramhttps://infogram.com/ https://youtu.be/Sa2C1TekKOI
Pros:
● Easy to create simple charts
● Can create reports, slides,
dashboards and social media
posts
● Tutorial videos
Cons:
● Chart depends on dataset
● Customization of charts limited
● No download of charts for basic
account possible
● Number of projects limited
● Data is public for basic account
Business Model:
Generally free - offers 4 variants of paid accounts
18

Infogram - Visualizations
Column Chart: Line Chart:
19
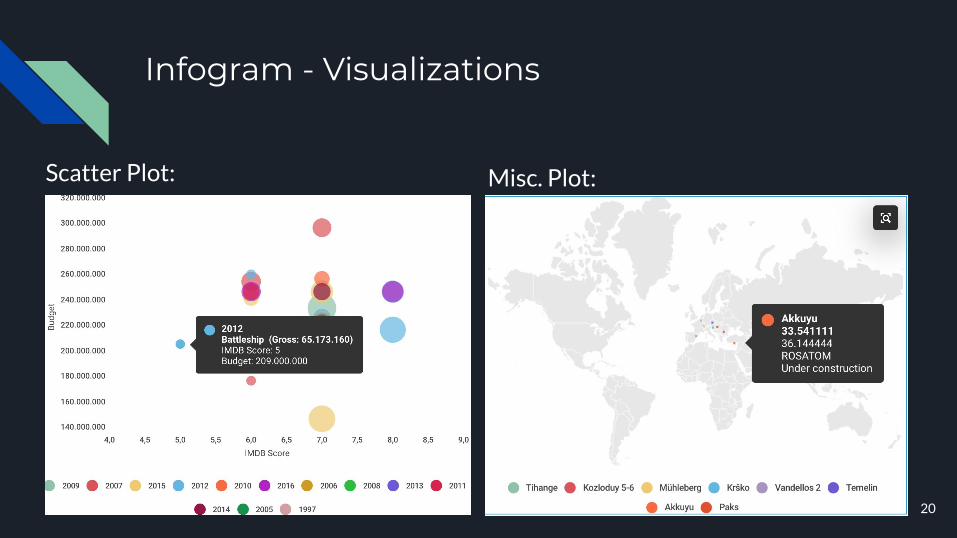
Infogram - Visualizations
Scatter Plot: Misc. Plot:
20

plotlyhttps://chart-studio.plotly.com/ https://youtu.be/GcPFPe6qHdI
Pros:
● Ease of use
● Good structure/design
● Good documentation
● Open Source
Cons:
● Not all export possibilities for
basic account
● Charts are all public for basic
account
Business Model:
Generally free - offers a paid account for enterprise
21

plotly - Visualizations
Column Chart: Line Chart:
22

plotly - Visualizations
23
Scatter Plot: Misc. Plot:
Evervizhttps://everviz.com/ https://youtu.be/Abn4WWo1P9g
Pros:
● Team/Group management
● Interactive charts
● Chart variety
● Powerful
Cons:
● Insufficient documentation
● High learning effort necessary
Business Model:
Not free - 3 variants of paid accounts
24

Everviz - Visualizations
Column Chart: Line Chart:
25
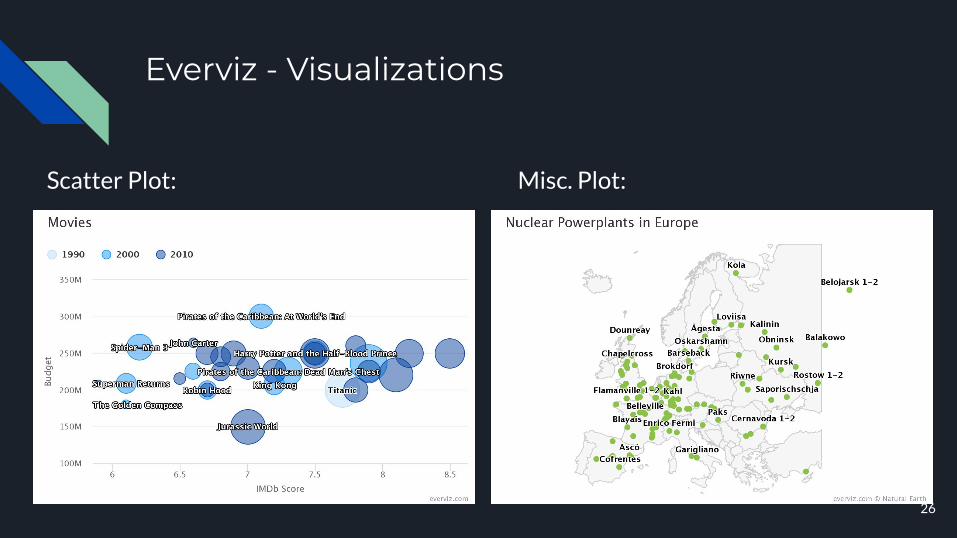
Everviz - Visualizations
Scatter Plot: Misc. Plot:
26

RAWGraphshttps://rawgraphs.io/ https://youtu.be/7RVg4zk71o4
Pros:
● Simple
● Good documentation
● Open Source
Cons:
● Few customization options
available
● No interactive charts
Business Model:
Free, no account required
27

RAWGraphs - Visualizations
Column Chart:
Line Chart: NOT POSSIBLE
28
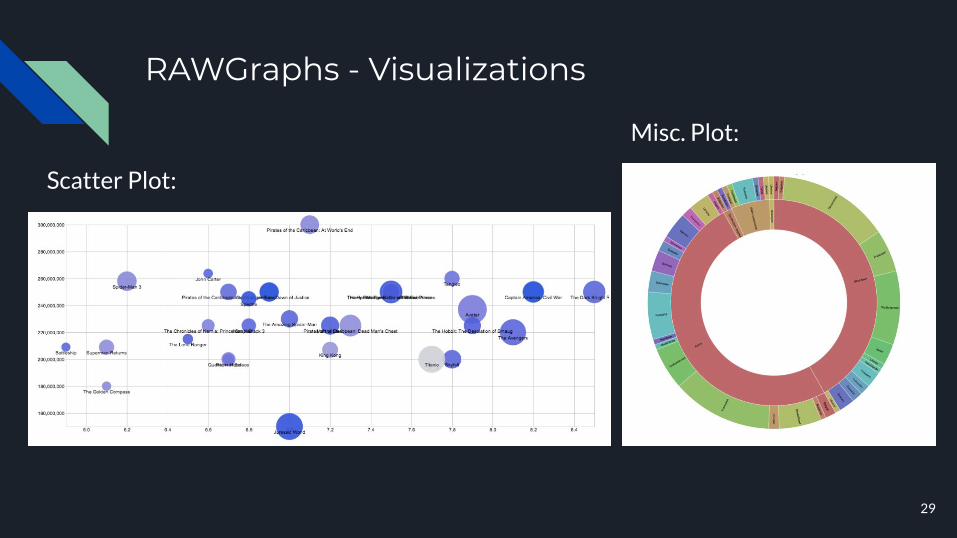
RAWGraphs - Visualizations
Scatter Plot:
Misc. Plot:
29
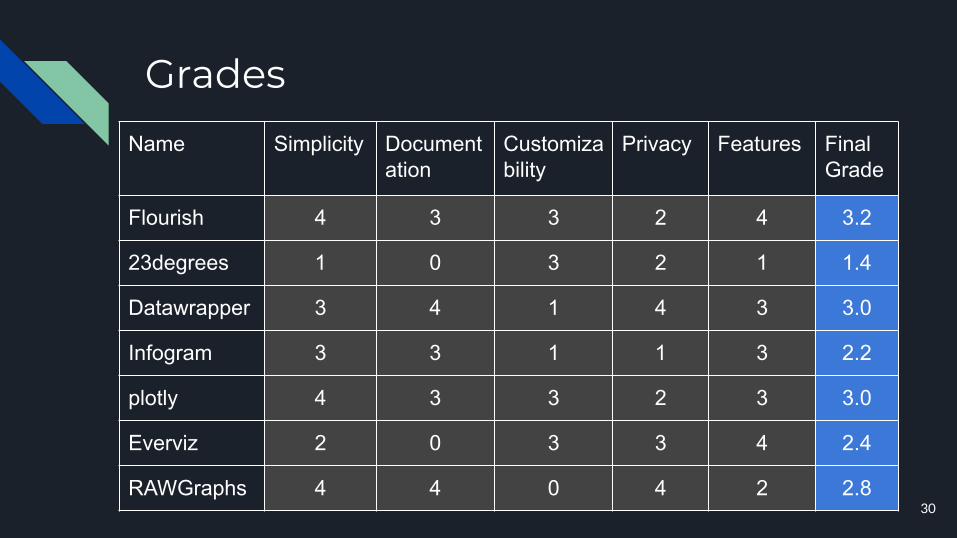
Grades
30
Name Simplicity Documentation
Customizability
Privacy Features Final Grade
Flourish 4 3 3 2 4 3.2
23degrees 1 0 3 2 1 1.4
Datawrapper 3 4 1 4 3 3.0
Infogram 3 3 1 1 3 2.2
plotly 4 3 3 2 3 3.0
Everviz 2 0 3 3 4 2.4
RAWGraphs 4 4 0 4 2 2.8
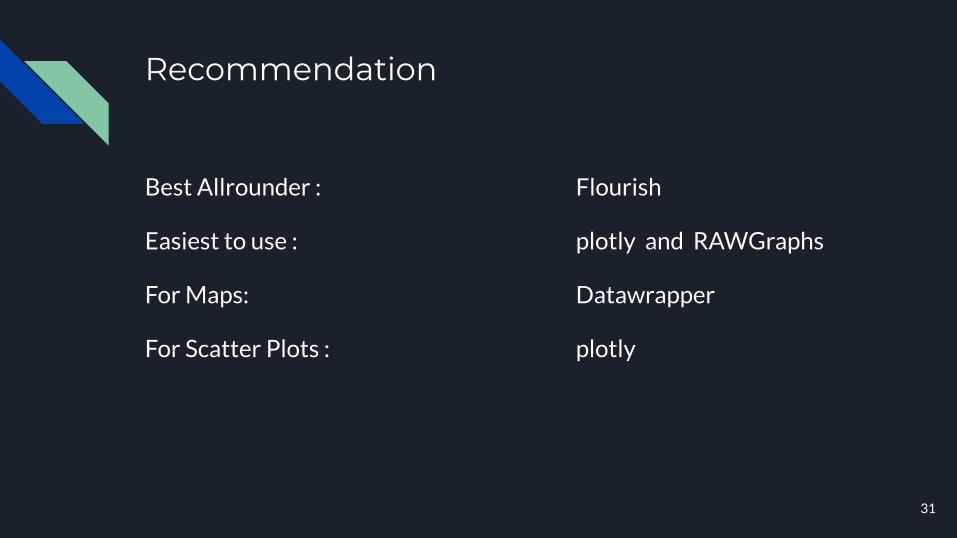
Recommendation
Best Allrounder : Flourish
Easiest to use : plotly and RAWGraphs
For Maps: Datawrapper
For Scatter Plots : plotly
31


