
Chatzipanagiotou, K., Veloutsou, C. and Christodoulides, G. (2016)
Decoding the complexity of the consumer-based brand equity process.
Journal of Business Research, 69(11), pp. 5479-5486.
(doi:10.1016/j.jbusres.2016.04.159)
This is the author’s final accepted version.
There may be differences between this version and the published version.
You are advised to consult the publisher’s version if you wish to cite from
it.
http://eprints.gla.ac.uk/118983/
Deposited on: 10 May 2016
Enlighten – Research publications by members of the University of Glasgow
http://eprints.gla.ac.uk
Decoding the complexity of the consumer-based brand equity process
Kalliopi Chatzipanagiotou, University of Glasgow
Cleopatra Veloutsou, University of Glasgow
George Christodoulides, Birkbeck, University of London
Submission: November 2015
Resubmission: February 2016
Resubmission: March 2016
The authors thank Spyros Gounaris, University of Strathclyde, and Nina Michaelidou,
Loughborough University, for their careful reading and suggestions. This work was supported
by the Economic and Social Research Council [RES-000-22-3431]. Send correspondence to
Kalliopi Chatzipanagiotou, University of Glasgow, Adam Smith Business School, The Gilbert
Scott Building, Glasgow, G12 8QQ, Scotland, UK
([email protected]); Cleopatra Veloutsou, University of Glasgow,
Adam Smith Business School, The Gilbert Scott Building, Glasgow, G12 8QQ, Scotland, UK
(email: [email protected]); George Christodoulides, Department of
Management, Birkbeck, University of London, Malet Street, Bloomsbury, London WC1E
7HX, UK ([email protected]).

2
Abstract
Brand equity is a valuable (intangible) asset for firms. Research examines brand
equity from the side of consumers, firms, or other stakeholders. Consumer-based brand equity
focuses on consumers and represents positive business outcomes. Despite its importance,
most extant literature focuses on brand equity as a construct, thus failing to recognize the
complexity of the phenomenon. This study uses complexity theory and fuzzy set qualitative
comparative analysis to put forth an empirically validated framework that shows consumer-
based brand equity as a dynamic and sequential process consisting of three blocks: Brand
building, brand understanding, and brand relationships. This study provides insights into the
creation process of brand equity, and helps progress the discussion from a focus on brand
equity as a construct to a focus on brand equity as a process.
Keywords: Brand equity; consumers; fuzzy set qualitative comparative analysis; brand
management
3
1. Introduction
Researchers widely acknowledge brand equity as a key marketing performance
indicator, a source of competitive advantage, and a vital component of business success
(Christodoulides et al., 2015). Although brand equity may derive from various stakeholders,
consumer-based brand equity (CBBE) dominates marketing research. Despite the merits of
existing research, failure to simultaneously capture the complex, dynamic, and idiosyncratic
nature of CBBE highlights the need for more holistic, advanced, and actionable CBBE
models that yield additional insights into the creation of brand equity (Davcik et al., 2015).
The literature on CBBE almost exclusively focuses on brand equity as a construct.
Several studies (see Buil et al., 2013) suggest CBBE is an outcome of its dimensions and
linearly associate numerous dimensions with overall CBBE. However, treating this
undoubtedly complex phenomenon as linear might lead to simplistic or distorted
interpretations. Building on previous research (e.g. Woodside, 2014), this study adopts
complexity and configural theory to examine CBBE as a dynamic and evolving process that
moves away from the logic that CBBE is a static and monolithic construct by shedding more
light on the brand equity creation process. Academics rarely, and usually without empirical
support, indicate that the development of CBBE is neither linear nor single pathway (Keller,
1993). However, the nature of the CBBE phenomenon suggests that many closely related
brand concepts co-exist at different stages in the process (e.g., consumers’ perceptions,
feelings, relationships, and dynamic interactions) and that interrelationships among these
concepts may occur (Henderson et al., 1998; Krishnan, 1996). Thus, the present study
identifies CBBE as a complex system that includes separate development stages under which
a sub-system of closely interrelated concepts lies, and empirically demonstrates the building
blocks and various combinations that result in high CBBE.
4
The contribution of this study to the literature is threefold. First, the study captures the
multi-dimensionality and dynamic nature of CBBE and introduces a new approach (i.e.,
fs/QCA) to examine brand equity. Second, by accounting for the complexity of relationships
among CBBE components, the study empirically explains how these components contribute
to the development of CBBE, offering a list of managerially actionable steps for the formation
and management of CBBE. Third, the study considers the co-creation of brand value between
consumers and the brand and incorporates consumers’ relationship with the brand as a
separate CBBE building block (Christodoulides & de Chernatony, 2010; Ding & Tseng,
2015).
2. Conceptual development
CBBE is “a set of perceptions, attitudes, knowledge, and behaviors on the part of
consumers that results in increased utility and allows a brand to earn greater volume or greater
margins than it could without the brand name” (Christodoulides & de Chernatony, 2010, p.
48). The majority of researchers examine CBBE as a memory-associative network, including
brand information as “nodes.” Consumers’ brand nodes may reflect various consumer benefits
or attributes, and relationships with the brand. The links between the nodes tend to be heavily
idiosyncratic because of the plethora of brand sources over time and brand episodes and
multiple pathways explaining how consumers link a specific node to another may occur
(Krishnan, 1996). Thus, a CBBE conceptualization as a memory-associative network reveals
causal complexity, asymmetry, and equifinality (more than one pathway to explain the subject
under study) as major characteristics of CBBE. CBBE is a process with discrete evolutionary
stages that include closely interrelated brand concepts and contribute through a “branding
ladder” to creating a strong brand (Keller, 1993; Lehmann et al., 2008).
5
This research builds on the above to provide a more holistic, advanced, and
parsimonious model of CBBE by using complexity and configural theory, both suitable to
uncover and decode the complexity, asymmetry, and equifinality that characterize CBBE
(e.g., Ragin, 2008; Woodside, 2013, 2014). Specifically, this study identifies CBBE as an
overall system with three major blocks or sub-systems: Brand building, brand understanding,
and brand relationship. Explaining the relationships among these blocks can help elucidate
the CBBE creation process. The CBBE process starts with brand building (input) activities to
position the brand in the mind of the consumers. Consumers then respond in a cognitive-
affective-conative sequence (Lavidge & Steiner, 1961) as brand understanding exemplifies,
brand relationships and ultimately overall brand equity. Each sub-system includes closely
interrelated brand concepts as shortcuts of information or nodes about consumers’ brand
perceptions, evaluations, and feelings (Henderson et al., 1998; Keller, 1993). The model
recognizes 15 nodes in the CBBE process that consumers should attain in each of the different
development stages of CBBE. What follows is an explanation of each block.
2.1. The brand building block (BBB)
Brand equity describes the intangible asset that derives from a company’s brand-
building efforts (Ambler et al., 2002). Brands contribute to product differentiation (Davcik &
Sharma, 2015) by being unique and distinctive (Netemeyer et al., 2004). Companies want
consumers to be able to think and describe the brand in real, material, and abstract terms;
thus, they usually invest in brand positioning and create functional and non-functional
attributes (Chen, 2001) or brand symbolic and functional utility (Koçak et al., 2007) to
differentiate their offer. This brand-building approach is consistent with the two aspects of
CBBE: The experiential (the brand’s imagery) and functional (perceptions of brand
performance and quality; Broyles et al., 2010; Keller, 1993). These aspects are outcomes of
6
the company’s brand-positioning efforts, which BBB encapsulates. A heritage brand, a
nostalgic brand, and brand personality capture the experiential aspects of the BBB. Prior
research identifies brand history (heritage and nostalgia) as one of the dimensions of brand
value (Lehmann et al., 2008). A heritage brand contains “a dimension of … identity found in
its track record, longevity, core values, use of symbols and particularly in an organizational
belief that its history is important” (Urde et al., 2007, p. 4). Nostalgic brands are “part of the
consumer’s history and related to particular memories” (Smit et al., 2007, p. 628), reminding
consumers of parts of their lives. A strong brand personality is a dimension of brand equity
(Veloutsou et al., 2013), whereas dimensions of brand personality can predict brand equity
and make up brand associations (Buil et al, 2008). Rather than focusing on specific brand
personality traits, this study assesses the brand personality appeal (Freling et al., 2011), which
this study conceptualizes as the extent to which a brand has a strong, favorable, and distinct
personality.
Perceived quality, brand leadership, and the brand’s competitive advantage capture the
functional aspect of the BBB. Perceived quality is “the consumer’s judgment about a
product’s overall excellence or superiority” (Zeithaml, 1988, p. 3). As one of Aaker’s (1991)
brand equity dimensions, perceived quality appears as a dimension of CBBE in scale
development studies for a long time (e.g., Yoo & Donthu, 2001), is a key component of
CBBE (Veloutsou et al., 2013), and is arguably one of the functional aspects of BBB. Brand
leadership, which the literature rarely acknowledges (e.g., Veloutsou et al, 2013), is the extent
to which a brand dominates a respective category. Brand competitive advantage is consumers’
perceptions of a brand’s advantage over other brands in its category and results in higher
financial performance (Hunt & Morgan, 1995).
2.2. The brand understanding block (BUB)
7
Brand knowledge is a core component of brand equity not only because of the specific
characteristics of the brand but also because of the uniqueness, strength, and favorability of
associations (Keller, 1993). Consumers know, understand, and appreciate the features of
strong brands (Lehmann et al., 2008).
BUB consists of awareness, associations, reputation, and self-connection. Brand
awareness and brand associations are key features of Aaker’s (1991) model and widely appear
in scale development research (e.g. Christodoulides et al, 2015; Yoo & Donthu, 2001). Brand
awareness is “the ability of a potential buyer to recognize or recall that a brand is a member of
a certain product category” (Aaker, 1991, p. 61). Brand associations refer to “anything linked
in memory to a brand” (Aaker, 1991, p. 109). This study examines the strength and clarity of
brand associations. Self-connection “reflects the extent to which the brand is part of the self,
part of the self-image, and refers to the question whether the consumer and his or her brand
have lots in common” (Smit et al., 2007, p. 628). Self-connection here is the consumers’
understanding and internalization of the brand positioning and characteristics, subsequently
leading to the formation of consumer–brand relationships. Reputation is “the overall value,
esteem and character of a brand as seen or judged by people in general” (Chaudhuri, 2002, p.
34), involves consumers’ assessment of the components of the brand and is a key part of
brand understanding.
2.3. The brand relationship block (BRB)
Consumers and the brand co-create brand value (Christodoulides & de Chernatony,
2010; Ding & Tseng, 2015), and therefore the relationship between consumers and the brand
is a key asset to strong brands (Strandvik & Heinonen, 2013). Despite relevant literature
stressing the role of consumer–brand relationships in strengthening a brand, little empirical
research incorporates relationships as such as a dimension of brand equity (Christodoulides et
8
al., 2006; Lehmann et al., 2008). All previous attempts include only one brand relationship
dimension (e.g. Lehmann et al., 2008) and do not capture consumers’ emotional reactions to
and personal feelings about the brand.
Partner quality, intimacy, trust, and relevance are the components of BRB. Partner
quality refers to “the qualities of the partner in the relationship, and whether the brand takes
good care of the consumer, shows interest and is reliable” (Smit et al., 2007, p. 628). Intimacy
is the “psychological closeness between the relationship partners and the knowledge about the
brand” (Smit et al., 2007, p. 628) and captures the emotional connection with the brand
(Christodoulides et al., 2006) and the depth of the psychological consumer–brand bond (e.g.,
brand resonance; Broyles et al., 2010). Previous research treats both partner quality and
intimacy as part of the consumer–brand relationship quality (Aaker et al., 2004; Smit et al.,
2007). Trust is the “confident expectations of the brand's reliability and intentions” (Delgado-
Ballester & Munuera-Alemán, 2005, p. 188) and some scale development attempts report
trust, trustworthiness, or reliability of the brand as part of CBBE (e.g., Lassar et al., 1995).
Relevance is the degree to which a brand is personally relevant to a consumer, at both a
personal and a social level (Veloutsou et al., 2013).
2.4. Overall brand equity (OBE)
OBE is the strength of the brand, which overall preference and purchase intention
primarily indicates (Buil et al., 2013; Yoo & Donthu, 2001). This construct captures brand
preference, attachment, and loyalty, all concepts that research highlights as indicators of
CBBE (e.g. Christodoulides et al., 2015; Yoo & Donthu, 2001).
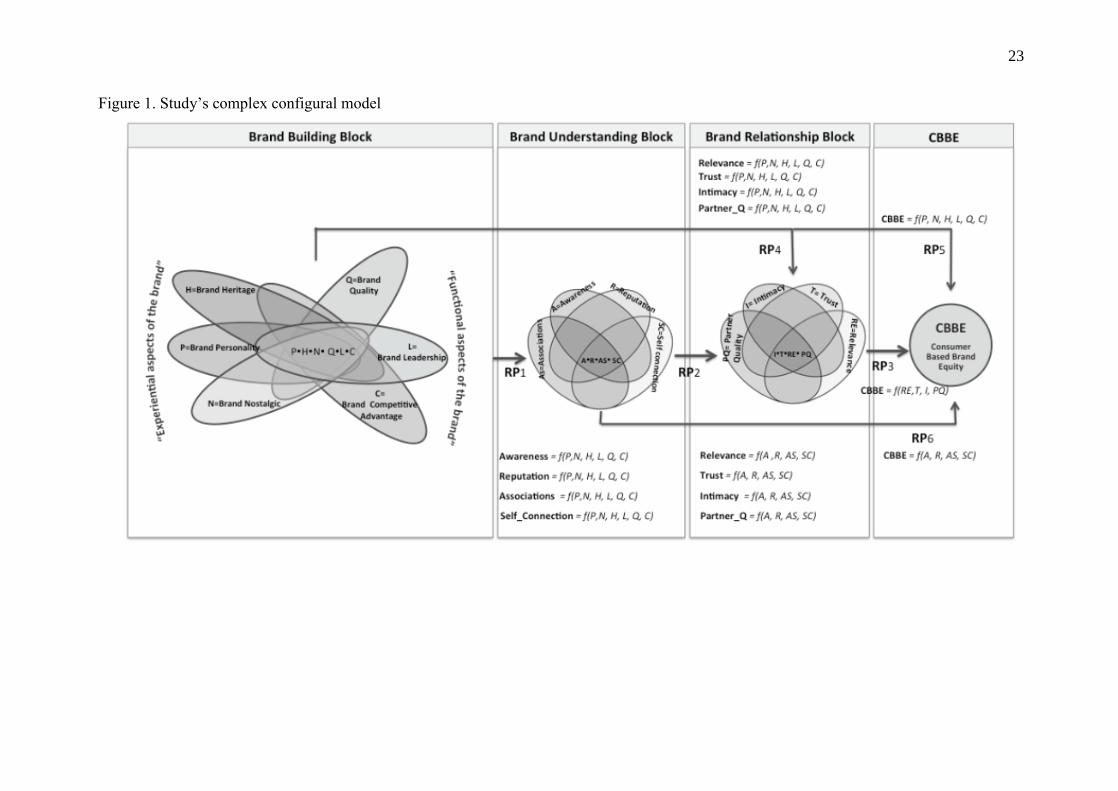
The Venn diagrams in Figure 1 show the configural nature of the antecedent conditions
within the different blocks, and the arrows indicate the major flows of configural relationships
among them. Thus:

9
RP1. Sufficient configurations of the elements constituting BBB lead to high scores in the
individual components of BUB.
RP2. Sufficient configurations of the elements constituting BUB lead to high scores in the
individual components of BRB.
RP3. Sufficient configurations of the elements constituting BRB lead to high scores in CBBE.
Because of the dynamic nature of CBBE and because major components of the brand
building and understanding blocks relate to consumers’ relationship with the brand and, thus,
CBBE, this study proposes:
RP4. Sufficient configurations of the elements constituting BBB directly contribute to
produce high scores in BRB.
RP5. Sufficient configurations of the elements constituting BBB directly contribute to
produce high scores in CBBE.
RP6. Sufficient configurations of the elements constituting BUB directly contribute to
produce high scores in CBBE.
Figure 1 here.
3. Method
3.1. Data collection
To better understand the dimensionality of CBBE and to make measurement choices,
the study carried out an extensive analysis of the literature and 15 semi-structured interviews
with senior brand managers and consultants. Potential items that could capture the dimensions
under investigation came from multiple studies. Additional items came from the interviews.
These items were part of a pilot questionnaire that a panel of experts received (Hardesty &
Bearden, 2004). Eight experts (senior academics with significant knowledge in the area of
brand equity) rated the items on clarity and representativeness of the content domain. Of the

10
69 items in the initial item pool, 41 items survived, and formed the survey questionnaire. Four
items come from Yoo and Donthu (2001) and measured OBE. The study measured all items
on 7-point scales. The reliability analysis scores for each of the study’s scales (available on
request) ranged from 0.74 to 0.99, well above the acceptable value of 0.70.
The data for the main study came from face-to-face interviews primarily in urban
centers in the United Kingdom. The study set quotas for age and gender to ensure the sample
was representative of UK residents. To increase the response rate, respondents could enter a
drawing for one of two gift cards worth £100. This procedure produced 304 full
questionnaires. All respondents selected a category from a list of categories spanning goods
(e.g., shampoo), services (e.g., coffee shop, bank), and the Internet (e.g., retailer) and
identified their favorite brand from that category. They then responded to subsequent
questions about that brand.
3.2. Data analysis
Preliminary symmetrical statistical tests identified the correlations among the study’s
major concepts and the potential for contrarian cases to occur. Although positive and high,
inter-correlations are below 0.80, suggesting that symmetrical relationships do not occur and
the variables are apt for subsequent analysis (Woodside, 2013).
Quintile analysis then obtained a fine-grained examination of the relationships among
the different pairs of constructs. The results indicate that negative and positive contrarian
cases do occur. Thus, any attempt to focus only on the main effect between these variables
would lead to a distorted picture of their relationship. In contrast, fs/QCA allows the inclusion
of contrarian cases, with the goal of identifying the configurations of the antecedent
conditions that can produce the outcome of interest (Ragin, 2008; Woodside, 2013).
11
The first step in fs/QCA is data calibration, where the transformation of the variable
raw scores into set measures occurs (Woodside & Zhang, 2013). Following the direct method
of calibration (Ragin, 2008), the study used three qualitative anchors (1.0 = full membership,
0 = full non-membership, and 0.5 = the crossover point of maximum ambiguity regarding
membership). For instance, for CBBE, the study set cases in the highest quintile equal to .95
membership (197 = 0.95), cases in the middle quintile at 0.50 (148 = 0.50), and calibrated
cases in the lowest quintile at 0.05 (74 = 0.05). In a similar fashion, the study calibrated all
the conditions of the conceptual framework. The study employs 0.80 as the minimum
consistency threshold for consideration and only the configurations with a minimum of two
cases in a “truth table” for further analysis.
To identify the elements of each block that are more relevant to the outcomes of
interest, this study adopts Ragin and Fiss’s (2008) and Fiss’s (2011) rationale and notation of
core and peripheral causal conditions. Core causal conditions are the conditions with strong
evidence of a causal relationship to the outcome of interest, whereas peripheral conditions are
those that contribute to the outcome but their role is weaker.
4. Results
4.1. Models of BBB predicting high scores in BUB outcomes (RP1)
The results of intermediate solutions demonstrate that sufficient configurations of
antecedent conditions from BBB lead to high scores in each of the components of BUB. Table
1 summarizes the derived core-periphery models, which indicate that both experiential and
functional conditions contribute to the prediction of high scores in BUB outputs providing
support to RP1.
Table 1 here.
12
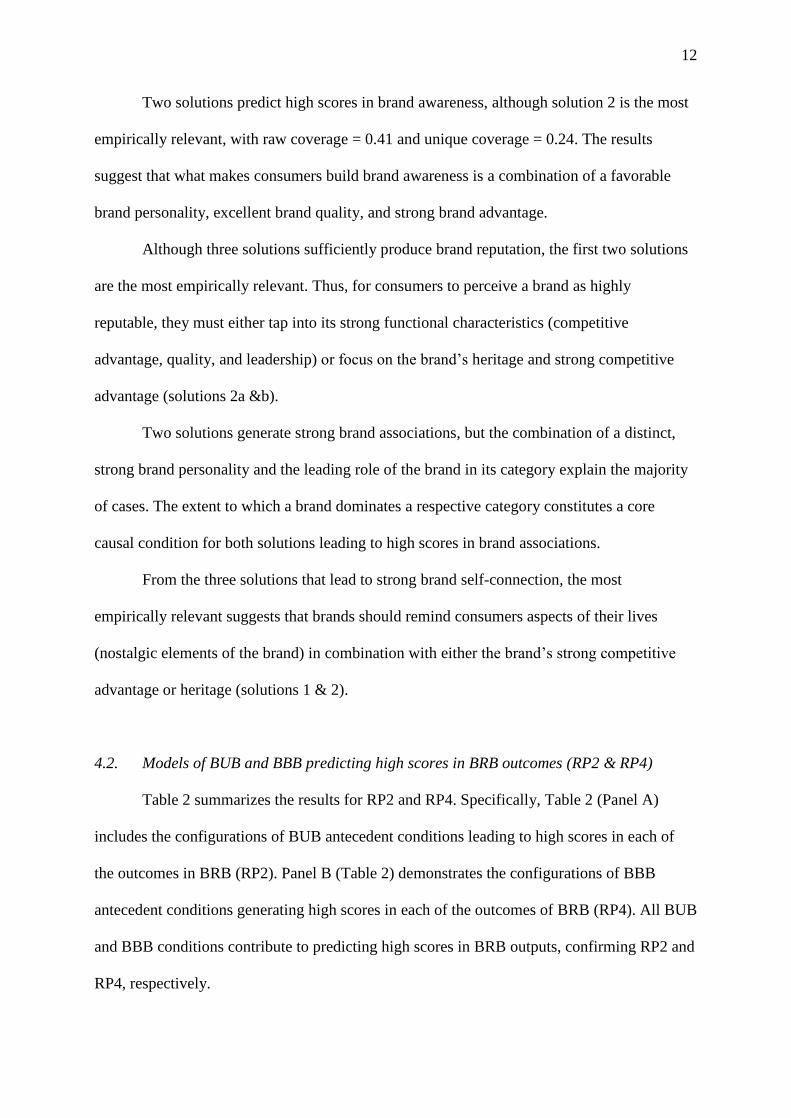
Two solutions predict high scores in brand awareness, although solution 2 is the most
empirically relevant, with raw coverage = 0.41 and unique coverage = 0.24. The results
suggest that what makes consumers build brand awareness is a combination of a favorable
brand personality, excellent brand quality, and strong brand advantage.
Although three solutions sufficiently produce brand reputation, the first two solutions
are the most empirically relevant. Thus, for consumers to perceive a brand as highly
reputable, they must either tap into its strong functional characteristics (competitive
advantage, quality, and leadership) or focus on the brand’s heritage and strong competitive
advantage (solutions 2a &b).
Two solutions generate strong brand associations, but the combination of a distinct,
strong brand personality and the leading role of the brand in its category explain the majority
of cases. The extent to which a brand dominates a respective category constitutes a core
causal condition for both solutions leading to high scores in brand associations.
From the three solutions that lead to strong brand self-connection, the most
empirically relevant suggests that brands should remind consumers aspects of their lives
(nostalgic elements of the brand) in combination with either the brand’s strong competitive
advantage or heritage (solutions 1 & 2).
4.2. Models of BUB and BBB predicting high scores in BRB outcomes (RP2 & RP4)
Table 2 summarizes the results for RP2 and RP4. Specifically, Table 2 (Panel A)
includes the configurations of BUB antecedent conditions leading to high scores in each of
the outcomes in BRB (RP2). Panel B (Table 2) demonstrates the configurations of BBB
antecedent conditions generating high scores in each of the outcomes of BRB (RP4). All BUB
and BBB conditions contribute to predicting high scores in BRB outputs, confirming RP2 and
RP4, respectively.

13
Table 2 here.
To generate consumers’ relational components with the brand, such as intimacy,
relevance, and partner quality, personal connection is a core causal condition. Conversely, for
consumers to build trust in the brand, they largely depend on brand reputation and
associations. Specifically, consumers sense a brand’s trustworthiness only for brands with
which they have previously developed strong and favorable associations. Consumers’
awareness of and self-connection with the brand contribute peripherally to facilitate this trust-
building process.
All BUB conditions play a core role through three causal pathways for intimacy
building. Consumers begin with their self-connection with the brand, which is a necessary
condition, combining alternatively: Brand association (solution 1), or brand reputation
(solution 2), or awareness (solution 3) to produce high scores in brand intimacy.
The results highlight brand associations and brand self-connection as core conditions
generate high scores in consumers’ brand relevance when combined peripherally with either
brand reputation (solution 1a) or brand awareness (solution 1b). For brand partnership, the
results show the core combinatorial role of brand reputation, associations, and consumers’
brand connection. Awareness does not lead to high scores in consumers’ brand partnership.
The solutions for RP4 highlight brand quality as a necessary condition for high scores
in brand trust. The results also indicate the different pathways of BBB components in
predicting each of the brand relationship outcomes. The study does not discuss all possible
combinations because of space limitations; however, Table 4 presents the most empirically
relevant combinations and synthesizes the study’s main results.
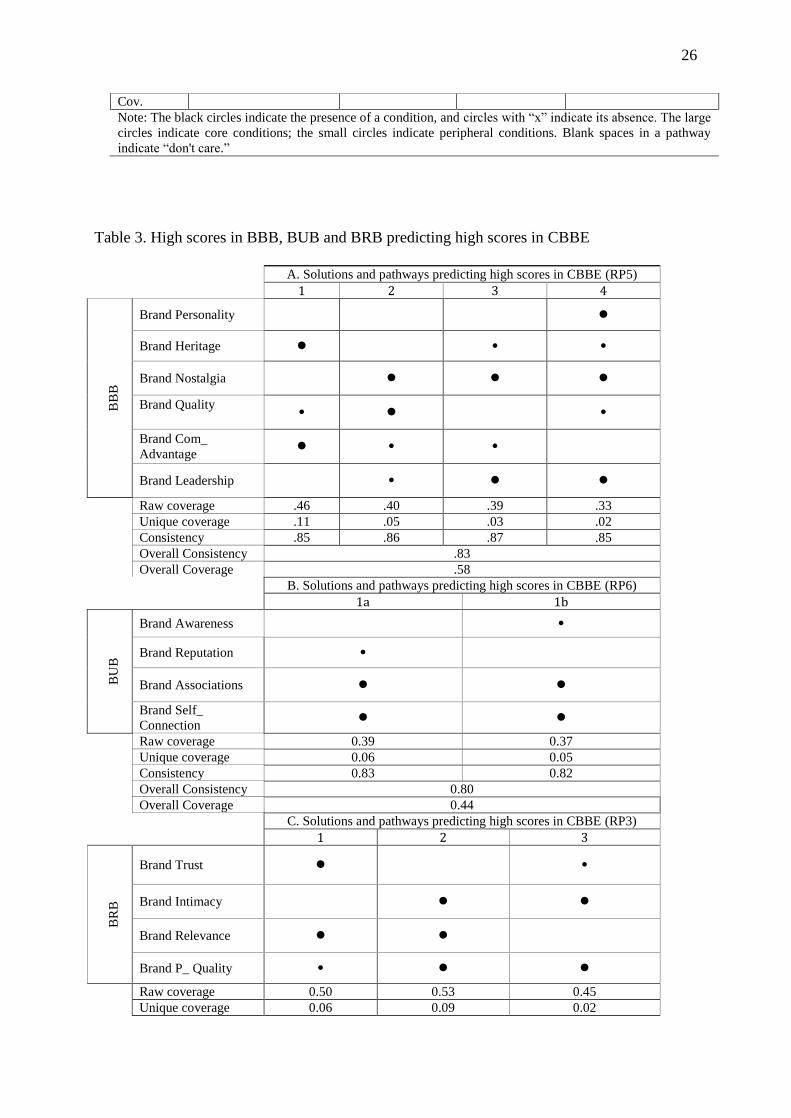
4.3. Models of BBB, BUB, and BRB predicting high scores in CBBE (RP5, RP6, & RP3)

14
Table 3 summarizes the results of the models predicting high scores in CBBE.
Consumers clearly take different paths to high CBBE. Table 3 (Panel A) presents four models
of BBB conditions that lead to high CBBE. The results show that all causal conditions of
BBB contribute in separate configurations to high scores in CBBE, providing support for
RP5.
Table 3 here.
Consumers follow four alternative pathways in which the brand building components
play a core causal role, albeit in different combinations. Both experiential- and performance-
related characteristics contribute to the creation of CBBE. Consumers’ perceptions of brand
heritage and competitive advantage (solution 1) or consumers’ focus on their personal history
with the brand (brand nostalgia) and brand quality (solution 2), or brand nostalgia, in
combination with the core role of brand leadership (solution 3) constitute core pathways for
CBBE. Brand nostalgia, clear perceptions of the brand personality, and consideration of the
brand as leading in its category is another combination likely to result in high CBBE (solution
4).
The results highlight one solution of BUB conditions sufficiently predicts high scores
in CBBE (Table 3, Panel B), providing support for RP6. Consumers’ favorable brand
associations and strong self-connection with the brand are core causal conditions for
predicting high CBBE when combined peripherally with either brand reputation (1a) or brand
awareness (1b).
Three models support the core role of BRB conditions, which sufficiently predict high
scores in CBBE (Table 3, Panel C) and provide support for RP3. All brand relationship
components constitute core causes in predicting high CBBE, albeit in different combinations.
4.4. Additional tests on the results
15
Additional tests further confirm complexity theory’s major tenets including the recipe
principle, equifinality principle and asymmetry principle (Woodside, 2014). To ensure the
solidarity of solutions, the study employs two alternative checks (Fiss, 2011): (1) The
different frequencies of cases (one, three, and four cases) and (2) the different levels of
consistency in solutions (0.81 to 0.90) and a series of robustness tests. The number of
solutions is slightly different, but the overall interpretation of results remains substantively
similar to the original solutions.
5. Discussion
The study contributes to branding theory and practice by proposing and empirically
examining an advanced, holistic, and actionable CBBE model that moves away from the logic
that CBBE is a static and monolithic construct. The study leverages the advantages of
complexity theory and fs/QCA to capture and synthesize the major tangible and intangible
aspects of CBBE and decode the CBBE building process to provide directions and
implications for both academics and brand managers.
The proposed conceptual framework includes three “constellations” of conceptually
close and interrelated concepts, which form three recognizable and concise blocks or sub-
systems: BBB, BUB, and BRB. The results confirm the study’s research propositions,
indicating that CBBE is the final outcome in a sequential, evolutionary causal chain that
includes the above blocks and further suggests that each of them directly influences CBBE.
The results show that with complex and dynamic phenomena such as CBBE, one solution
does not fit all. The conceptual framework that this study proposes not only adds to the
branding literature by shifting the discussion from brand equity as a construct to brand equity
as a dynamic and complex process but also provides unique advantages for brand managers
by offering a realistic “mapping” of the chain reactions and anticipated results of any brand
16
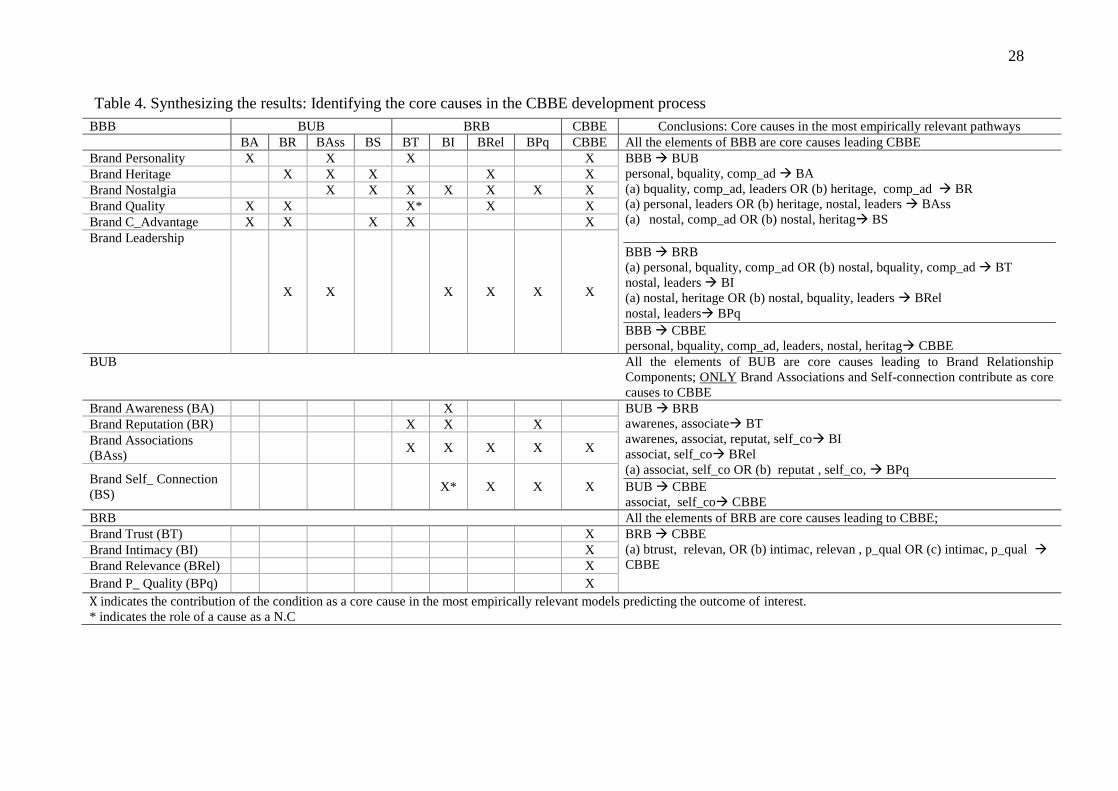
manager’s effort or strategy. Table 4 summarizes the study’s results providing a managerial
roadmap for brand managers.
Specifically, BBB concepts pervade, through separate pathways, consumers’
understanding of and relationship with the brand, and also constitute core causes capable of
predicting high levels of CBBE. Regarding BUB, all the constructs contribute to enhancing
consumers’ relationship with the brand, though consumers’ self-connection and brand
association constitute core for achieving high scores in CBBE. Brand awareness and
reputation, even when buttressing consumers’ trust in the brand, contribute not directly but
rather peripherally to the creation of strong CBBE. Finally, enhancing consumers’
relationship with the brand seems to be a great challenge (and opportunity) for brand
managers because of the connection of BRB components as core causes to sustainable and
strong CBBE.
In addition, managers can use the conceptual framework in multiple ways. For
example, they could focus on the major blocks of this conceptualization to nourish the brand
experiential and performance-related characteristics and enhance consumers’ relationship
with the brand or they could focus on specific outputs such as brand reputation. To enhance
brand reputation, the results highlight the importance of investing in a brand’s performance-
related characteristics (brand quality, competitive advantage, and leadership). However,
focusing on the combination of brand competitive advantage and brand heritage could be an
alternative pathway to the creation of a highly reputable brand. Thus, the study sets the
foundation for a more advanced and complex examination and perspective of CBBE,
highlighting the usefulness of complexity theory and fs/QCA in data analysis and branding
theory development and practice.
6. Limitations and suggestions for further research
17
The replication of this study in different contexts (e.g., country, industry, period)
would be particularly helpful for the conceptual framework's further testing and
establishment. Additionally, the detection of potential differences in the study’s CBBE
configural model among groups of consumers with different demographic/psychographic
characteristics would significantly extend knowledge of the brand equity process. Research
that extends the findings by examining consumers’ unfavorable brands, rather than favorable
brands that this study focuses on, would prove fruitful. Because CBBE is a dynamic and
evolving process, future work examining the initial building stage of CBBE for new brands in
the market and the longitudinal assessment of their CBBE development would shed new light
on the whole process and its outcomes.
18
References
Aaker, D. A. (1991). Managing brand equity. Capitalizing on the value of brand name. New
York, NY: Free Press.
Aaker, J., Fournier, S., & Brasel, A. (2004). When good brands do bad. Journal of Consumer
Research, 31(1), 1–16.
Ambler, T., Bhattacharya, C.B., Edell, J., Keller, K., Lemon, K., & Mittal, V. (2002).
Relating brand and customer perspectives on marketing management. Journal of
Service Research, 5(1), 13–25.
Broyles, A., Leingpibul, T., Ross R., & Foster, B. (2010). Brand equity’s
antecedent/consequence relationships in cross-cultural settings. Journal of Product &
Brand Management, 19(3), 159–169.
Buil, I., de Chernatony, L., & Martinez E. (2008). A cross-national validation of the
consumer-based brand equity scale. Journal of Product and Brand Management,
17(6), 384–392.
Buil, I., Martinez E., & de Chernatony, L. (2013). The influence of brand equity on consumer
responses. Journal of Consumer Marketing, 30(1), 62–74.
Chaudhuri, A. (2002). How brand reputation affects the advertising-brand equity link. Journal
of Advertising Research, 42(2), 33–43.
Chen, A. C.-H. (2001). Using free association to examine the relationship between
characteristics of brand associations and brand equity. Journal of Product and Brand
Management, 10(7), 439–451.
Christodoulides, G., Cadogan, J., & Veloutsou, V. (2015). Consumer-based brand equity
measurement: lessons learned from an international study. International Marketing
Review, 32(3/4), 307–328.
19
Christodoulides, G., & de Chernatony, L., (2010). Consumer-based brand equity
conceptualisation and measurement. International Journal of Market Research, 52(1),
43–66.
Christodoulides, G., de Chernatony, L., Furrer, O., & Abimbola, T. (2006). Conceptualising
and measuring the equity of online brands. Journal of Marketing Management,
22(7/8), 799–825.
Davcik, N., & Sharma, P., (2015). Impact of product differentiation, marketing investments
and brand equity on pricing strategies. European Journal of Marketing, 49(5/6), 760–
781.
Davcik, N., Vinhas da Silva, R., & Hair, J. (2015). Towards a unified theory of brand equity:
conceptualizations, taxonomy and avenues for future research. Journal of Product &
Brand Management, 24(1), 3–17.
Delgado-Ballester, E., & Munuera-Alemán, J. L. (2005). Does brand trust matter to brand
equity? Journal of Product & Brand Management, 14(3), 187–196.
Ding, C., & Tseng, T. (2015). On the relationships among brand experience, hedonic
emotions, and brand equity. European Journal of Marketing, 49(7/8), 994–1015.
Fiss, P. C. (2011). Building better casual theories: A fuzzy set approach to typologies in
organizational research. Academy of Management Journal, 54(2), 393–420.
Freling, T., Crosno, J., & Henard, D. (2011). Brand personality appeal: conceptualization and
empirical validation. Journal of the Academy Marketing Science, 39(3), 392–406.
Hardesty, D. M., & Bearden, W. O. (2004). The use of expert judges in scale development:
Implications for improving face validity of measures of unobservable constructs.
Journal of Business Research, 57(2), 98–107.

20
Henderson, G. R., Iacobucci, D., & Calder, B. J. (1998). Brand diagnostics: Mapping
branding effect using consumer associative networks. European Journal of
Operational Research, 111(2), 306–327.
Hunt, S. D., & Morgan, R. M. (1995). The comparative advantage theory of competition.
Journal of Marketing, 59(2), 1–15.
Keller, K.L. (1993). Conceptualizing, measuring, and managing customer-based brand equity.
Journal of Marketing, 57(1), 1–22.
Koçak, A., Abimbola, T., & Özer, A. (2007). Consumer brand equity in a cross-cultural
replication: An evaluation of a scale. Journal of Marketing Management, 23(1/2),
157–173.
Krishnan, H. S. (1996). Characteristics of memory associations: A consumer-based brand
equity perspective. International Journal of Research in Marketing, 13(4), 389–405
Lassar, W., Mittal, B., & Sharma A. (1995). Measuring customer-based brand equity. Journal
of Consumer Marketing, 12(4), 11–19.
Lavidge, R.J. & Steiner, G.A. (1961). A model for predictive measurements of advertising
effectiveness. Journal of Marketing, 25(October), 59–62.
Lehmann, D. R., Keller, K. L., & Farley, J. U. (2008). The structure of survey-based brand
metrics. Journal of International Marketing, 16(4), 29–56.
Netemeyer, R.G., Krishnan, B., Pullig, C., Wang, G., Yagci, M., Dean, D., Ricks, J. & Wirth,
F. (2004). Developing and validating measures of facets of customer-based brand
equity. Journal of Business Research, 57(2), 209–224.
Ragin, C. C. (2008). Redesigning social inquiry: Fuzzy sets and beyond. Chicago, IL:
Chicago University Press.
21
Ragin, C. C., & Fiss, P. C. (2008). Net effects analysis versus configurational analysis: An
empirical demonstration. In C. C. Ragin (Ed.), Redesigning social inquiry: Fuzzy sets
and beyond (pp. 190–212). Chicago, IL: University of Chicago Press.
Smit, E., Bronner, F., & Tolboom, M. 2007. Brand relationship quality and its value for
personal contact. Journal of Business Research, 60(6), 627–633.
Strandvik, T. M., & Heinonen, K. (2013). Diagnosing service brand strength: Customer-
dominant brand relationship mapping. Journal of Service Management, 24(5), 502–
519.
Urde, M., Greyser, S., & Balmer, J. (2007). Corporate brands with a heritage. Journal of
Brand Management, 15(1), 4–19.
Veloutsou, C., Christodoulides, G., & de Chernatony, L. (2013). A taxonomy of measures for
consumer-based brand equity: Drawing on the views of managers in Europe. Journal
of Product and Brand Management, 22(13), 238–248.
Wagemann, C., & Schneider, C. Q. (2010). Qualitative comparative analysis (QCA) and
fuzzy-sets: agenda for a research approach and a data analysis technique. Comparative
Sociology, 9(3), 376–396.
Woodside, A. G. (2013). Moving beyond multiple regression analysis to algorithms: Calling
for a paradigm shift from symmetric to asymmetric thinking in data analysis, and
crafting theory. Journal of Business Research, 66(4), 463–472.
Woodside, A. G., & Zhang, M. (2013). Cultural diversity and marketing transactions: Are
market integration, large community size, and world religions necessary for fairness in
ephemeral exchanges. Psychology & Marketing, 30(3), 263–276.
Woodside, A. G. (2014). Embrace perform model: Complexity theory, contrarian case
analysis, and multiple realities. Journal of Business Research, 67(12), 2495–2503.

22
Yoo, B., & Donthu, N. (2001). Developing and validating a multidimensional consumer-
based brand equity scale. Journal of Business Research, 52(1), 1–14.
Zeithaml, V.A. (1988). Consumer perceptions of price, quality, and value: A means-end
model and synthesis of evidence. Journal of Marketing, 52(July), 2–22
23
Figure 1. Study’s complex configural model

24
Table 1. Core–periphery models of BBB predicting high scores in BUB (RP1)
Solutions and pathways predicting high scores in BUB
Brand
Awarene
ss
Brand Reputation Brand
Associati
ons
Brand Self_
Concept
1 2 1 2a 2b 3 1 2 1 2 3
BB
B
Brand
Personality
Brand
Heritage
Brand
Nostalgia
Brand
Quality
Brand Com_ Advantage
Brand
Leadership
Raw
Coverage
0.2
50.410.59 0.52
0.4
30.170.620.410.61 0.63 0.16
Unique
Coverage
0.0
8 0.24 0.12 0.05
0.0
1 0.03 0.24 0.02 0.11 0.08 0.02
Consistency 0.8
4 0.83 0.85 0.84
0.8
4 0.82 0.86 0.84 0.90 0.90 0.80
Overall
Consistency 0.83 0.80 0.82 0.85
Overall
Coverage 0.50 0.71 0.65 0.77
Note: The black circles indicate the presence of a condition, and circles with “x” indicate its
absence. The large circles indicate core conditions; the small circles indicate peripheral
conditions. Blank spaces in a pathway indicate “don't care.”

25
Table 2. Core–periphery models of BBB and BUB predicting high scores in BRB
A. Solutions and pathways predicting high scores in BRB (RP2)
Brand Trust Brand Intimacy Brand Relevance Brand Partner Quality
1a 1b 1 2 3 1a 1b 1 2
BU
B
Brand
Awareness
Brand
Reputation Brand
Association
s
Brand
Self_
Connection
Raw
coverage 0.40 0.43 0.550.55 0.50 0.43 0.41 0.53 0.55
Unique
coverage 0.07 0.10 0.04 0.06 0.04 0.08 0.05 0.09 0.10
Consistenc
y 0.88 0.87 0.85 0.85 0.84 0.90 0.87 0.86 0.89
Overall
Cons. 0.86 0.83 0.87 0.85
Overall
Cov. 0.50 0.69 0.49 0.64
B. Solutions and pathways predicting high scores in
BRB (RP4)
Brand Trust Brand Intimacy Brand Relevance Brand Partner Quality
1a 1b 2 3 1 2a 2b 1 2 3 1a 1b 2 1c
BB
B
Brand
Personality
Brand
Heritage
Brand
Nostalgia
Brand
Quality
Brand
Com_
Advantage
Brand
Leadership
Raw
coverage 0.19 0.18 0.430.410.170.44 0.43 0.59
0.4
4
0.1
6
0.4
50.43 0.16 0.37
Unique
coverage 0.04 0.03 0.050.030.070.040.030.20 0.0
50.0
10.0
50.030.010.03
Consistenc
y 0.87 0.88 0.91 0.91 0.80 0.87 0.88 0.84
0.9
1
0.8
6
0.9
3 0.91 0.87 0.91
Overall
Cons. 0.89 0.84 .83 0.88
Overall 0.59 0.56 .66 0.54
26
Cov.
Note: The black circles indicate the presence of a condition, and circles with “x” indicate its absence. The large
circles indicate core conditions; the small circles indicate peripheral conditions. Blank spaces in a pathway
indicate “don't care.”
Table 3. High scores in BBB, BUB and BRB predicting high scores in CBBE
A. Solutions and pathways predicting high scores in CBBE (RP5)
1 2 3 4
BB
B
Brand Personality
Brand Heritage
Brand Nostalgia Brand Quality
Brand Com_
Advantage
Brand Leadership
Raw coverage .46 .40 .39 .33
Unique coverage .11 .05 .03 .02
Consistency .85 .86 .87 .85
Overall Consistency .83
Overall Coverage .58
B. Solutions and pathways predicting high scores in CBBE (RP6)
1a 1b
BU
B
Brand Awareness
Brand Reputation
Brand Associations Brand Self_
Connection
Raw coverage 0.39 0.37
Unique coverage 0.06 0.05
Consistency 0.83 0.82
Overall Consistency 0.80
Overall Coverage 0.44
C. Solutions and pathways predicting high scores in CBBE (RP3)
1 2 3
BR
B
Brand Trust
Brand Intimacy Brand Relevance Brand P_ Quality
Raw coverage 0.50 0.53 0.45
Unique coverage 0.06 0.09 0.02

27
Consistency 0.83 0.82 0.82
Overall Consistency 0.80
Overall Coverage 0.62
Note: The black circles indicate the presence of a condition, and circles with “x” indicate its
absence. The large circles indicate core conditions; the small circles indicate peripheral
conditions. Blank spaces in a pathway indicate “don't care.”
28
Table 4. Synthesizing the results: Identifying the core causes in the CBBE development process
BBB BUB BRB CBBE Conclusions: Core causes in the most empirically relevant pathways
BA BR BAss BS BT BI BRel BPq CBBE All the elements of BBB are core causes leading CBBE
Brand Personality X X X X BBB BUB
personal, bquality, comp_ad BA
(a) bquality, comp_ad, leaders OR (b) heritage, comp_ad BR
(a) personal, leaders OR (b) heritage, nostal, leaders BAss
(a) nostal, comp_ad OR (b) nostal, heritag BS
BBB BRB
(a) personal, bquality, comp_ad OR (b) nostal, bquality, comp_ad BT
nostal, leaders BI
(a) nostal, heritage OR (b) nostal, bquality, leaders BRel
nostal, leaders BPq
BBB CBBE
personal, bquality, comp_ad, leaders, nostal, heritag CBBE
Brand Heritage X X X X X
Brand Nostalgia X X X X X X X
Brand Quality X X X* X X
Brand C_Advantage X X X X X
Brand Leadership
X X X X X X
BUB
All the elements of BUB are core causes leading to Brand Relationship
Components; ONLY Brand Associations and Self-connection contribute as core
causes to CBBE
Brand Awareness (BA) X BUB BRB
awarenes, associate BT
awarenes, associat, reputat, self_co BI
associat, self_co BRel
(a) associat, self_co OR (b) reputat , self_co, BPq
BUB CBBE
associat, self_co CBBE
Brand Reputation (BR) X X X
Brand Associations
(BAss) X X X X X
Brand Self_ Connection
(BS) X* X X X
BRB All the elements of BRB are core causes leading to CBBE;
Brand Trust (BT) X BRB CBBE
(a) btrust, relevan, OR (b) intimac, relevan , p_qual OR (c) intimac, p_qual
CBBE Brand Intimacy (BI) X
Brand Relevance (BRel) X
Brand P_ Quality (BPq) X
X indicates the contribution of the condition as a core cause in the most empirically relevant models predicting the outcome of interest.
* indicates the role of a cause as a N.C


