
China’s Future Oil Demand for Road Transportation
James CoanResearch Associate
Energy ForumBaker Institute for Public
PolicyRice University
October 11, 2011
Co-authors:
Ronald SoligoProfessor of Economics
Rice University
Kenneth B. Medlock III
James A. Baker, III, and Susan G. Baker Fellow in
Energy and Resource Economics
Rice University
• Projection of How Much an Average Light-duty Vehicle Will be Driven in China
• Projection of Road Freight (usually Medium/Heavy Truck) Oil Use in China
• Next steps Toward Projecting Total Road Transportation Oil Use
Overview of Presentation

Light Duty Vehicles: Vehicle Use Often Matters More than Light-Duty Vehicle
Stocks
Light-Duty Vehicle Stocks Per Capita
Light-Duty Vehicle Use Per Capita
Source: Millard-Ball, Adam and Lee Schipper. 2010. “Are We Reaching Peak Travel? Trends in Passenger Transport in Eight Industrialized Countries.” http://www.geog.mcgill.ca/faculty/millard-ball/Millard-Ball_Schipper_Peak_Travel_preprint.pdf.
50%200%
• Vehicle stocks only account for 1/3 of the difference in vehicle use between U.S. and Japan.

Light Duty Vehicles: Vehicle Use Very Different in
Japan, Western Europe and North America
Light-Duty Vehicle Stocks Per Capita
Light-Duty Vehicle Use Per Capita
Canada
• Canada, Western Europe, and Japan have roughly the same number of light-duty vehicles/capita, but each vehicle is driven about twice as much in Canada and 50-75% more in Europe than in Japan.
Canada,Western Europe,Japan
Japan
~100%
Source: Millard-Ball, Adam and Lee Schipper. 2010. “Are We Reaching Peak Travel? Trends in Passenger Transport in Eight Industrialized Countries.” http://www.geog.mcgill.ca/faculty/millard-ball/Millard-Ball_Schipper_Peak_Travel_preprint.pdf.
Western Europe
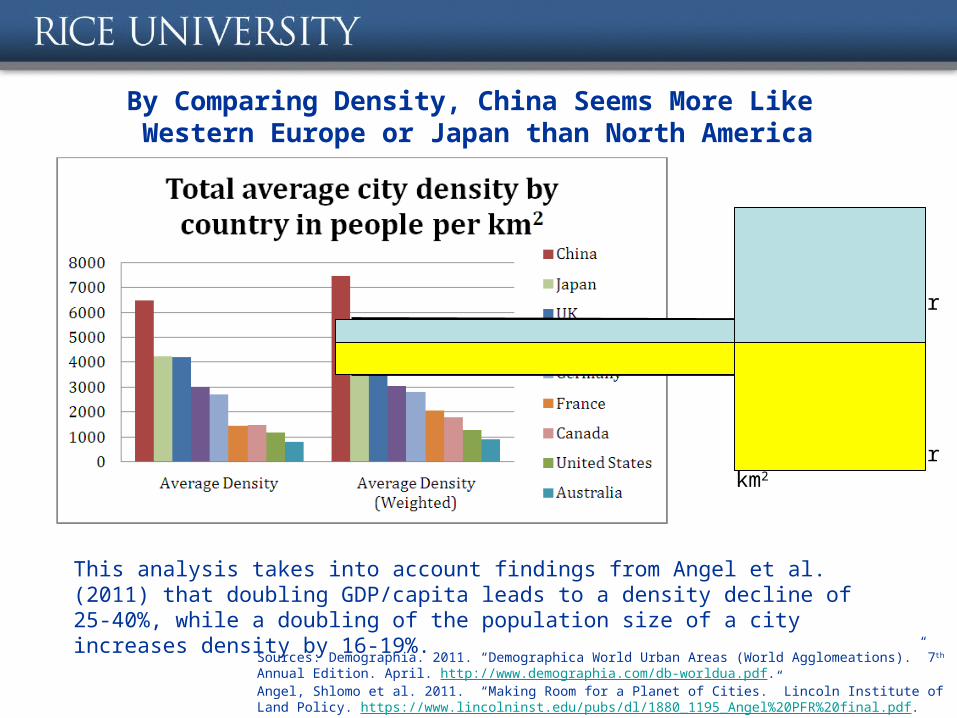
By Comparing Density, China Seems More Like Western Europe or Japan than North America
Sources: Demographia. 2011. “Demographica World Urban Areas (World Agglomeations).” 7th Annual Edition. April. http://www.demographia.com/db-worldua.pdf. Angel, Shlomo et al. 2011. “Making Room for a Planet of Cities.” Lincoln Institute of Land Policy. https://www.lincolninst.edu/pubs/dl/1880_1195_Angel%20PFR%20final.pdf.
China in 2020: Density of between 4,770-5,850 people per km2
China in 2035: Density of between 3,420-4,870 people per km2
This analysis takes into account findings from Angel et al. (2011) that doubling GDP/capita leads to a density decline of 25-40%, while a doubling of the population size of a city increases density by 16-19%.

Comparing Rail Modal Share China Appears to be Headed on a Path More Like Western Europe than Japan
Sources: UK Department of Transport, Energy Data Modelling Center (Japan), China Statistical Yearbook, Penn World Tables

If Extensive Rail Investment Continues/Accelerates, China May be More Like Japan
Source: International Transport Forum. http://www.internationaltransportforum.org/statistics/index.html.
United Kingdom
Korea Germany China France Australia United States Canada Japan0
0.1
0.2
0.3
0.4
0.5
0.6
Average Rail Infrastructure Investment as Proportion of Land Transportation (Rail and Road) Investment,
+/- One SD, 1992-2009

Projecting How Much an Average Light-Duty Vehicle Will be Driven in China
Sources :UK Department of Transport, Energy Data Modelling Center (Japan)Note: This assumes GDP/capita of in 2005$ PPP, using Penn World Tables as baseline and growth projections from IEA
2020 (GDP ~$15,000 /
capita)
2035 (GDP ~$26,500 /
capita)
If like Japan: <11,000 km/vehicle
If like the UK: <14,000 km/vehicle
If like Japan: <9,500 km/vehicle
If like the UK: <15,500 km/vehicle (est.)
2020
2035
At $15,000 GDP/capita, each vehicle was driven about 25-30 percent more in the UK than Japan, and this increased to 50-60 percent at $26,500/capita.

Moving Freight in China Could be a Significant Consumer of Oil
Source: Schipper, L., Scholl, L., Price, L.,1997 ENERGY USE AND CARBON EMISSIONS FROM FREIGHT IN 10 INDUSTRIALIZED COUNTRIES: AN ANALYSIS OF TRENDS FROM 1973 TO 1992; Kamakaté and Schipper 2009.
Trucking
Freight Oil
Intensity
Oil Use
in 2020
(millio
n b/d)
Oil Use
in 2035
(millio
n b/d)
Lowest
(110,000 bbl/
trillion 2005$)
2.3 4.1
Middle
(170,000 bbl/
trillion 2005$)
3.6 6.4
Highest
(310,000 bbl/
trillion 2005$)
6.5 11.7

Relationship Between Freight Ton-Kms and Oil Use
Sources: L. Schipper, L. Scholl, and L. Price, “Energy Use and Carbon Emissions From Freight in 10 Industrialized Countries: An Analysis of Trends from 1973 TO 1992,” Transportation Research Part D: Transport and Environment 2, no. 1 (1997): 57-76. F. Kamakaté and L. Schipper, “Trends in Truck Freight Energy Use and Carbon Emissions in Selected OECD Countries from 1973 to 2005,” Energy Policy 37 (2009): 3743-51.

China Is Very Intensive in Terms of Freight Ton-Kms per Unit GDP, and Intensity May Increase Further
Sources: Eurostat, China Statistical Yearbook
China’s ton-kms per unit GDP is higher than any other country we’ve found, twice as high as the U.S. and four times higher than Western Europe.
Given the relationship between ton-kms and oil use, China should be using about 340,000 b/d per trillion GDP, twice the average .
Yet China’s oil use seems fairly average at this point close to 170,000 b/d. Chin
a 2009
Freight Ton-Kms per Dollar of GDP in Eastern European
Countries High but Still Lower than China
China2008

Factors Influencing Future Chinese Trucking Freight Ton-Kms
Factors That May Increase Freight Oil Use in the Future:
• Current overloading of trucks may be controlled• Initiatives to move production toward western China • No clear push to regulate fuel efficiency in
medium/heavy trucks
Factors That May Restrict Freight Oil Use in the Future:
• Chinese government has a very significant commitment to rail (120,000 kms by 2015, up from about 86,000 kms in 2009)
• Possibly better logistics and reduced “empty miles”
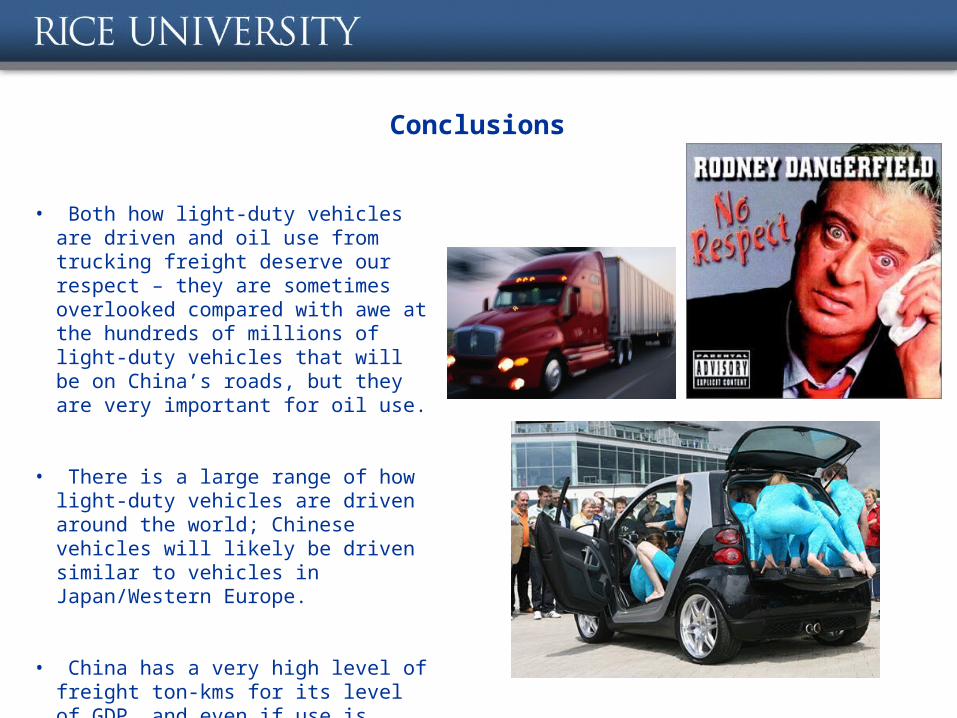
Conclusions
• Both how light-duty vehicles are driven and oil use from trucking freight deserve our respect – they are sometimes overlooked compared with awe at the hundreds of millions of light-duty vehicles that will be on China’s roads, but they are very important for oil use.
• There is a large range of how light-duty vehicles are driven around the world; Chinese vehicles will likely be driven similar to vehicles in Japan/Western Europe.
• China has a very high level of freight ton-kms for its level of GDP, and even if use is average, oil use will still be 3.6 million b/d in 2020 and 6.4 million b/d in 2035.
Next Steps
In order to fully project oil use from road transportation, we will
• Estimate future vehicle stocks for China (using International Road Federation data with >100 countries)
• Conduct interviews on the future of freight in China
If you would like a copy of the presentation or have questions: [email protected]

Light Duty Vehicles: Vehicle Use Per Vehicle Different in Japan, Western
Europe, and U.S./Canada
Source: International Energy Agency, Transport, Energy and CO2: Moving Toward Sustainability (Paris: International Energy Agency, 2009).
U.S., Canada
Japan
Major Western European Countries


