
Clarity on September 2014
14On the way up or on the way out?RoE improvements still needed at most banks.
18Consolidation kick-started in 2014A significant uptick since May is the result of greater clarity over risks.
25Performance and trends Assessment of the 2013 annual reports of banks in Switzerland.
Success and failure in the ’new normal‘
Performance of Swiss Private Banks

of the 94 banks in our sample
34 … or have completed their turnaround
59 … or have stabilized their decline
34 …
are strong performers
posted losses
are in continuing decline
300
400
500
600
700
800
2006 2007 2008 2009 2010 2011 2012 2013
200
Strong Performer
Turnaround Completed
Decline Stabilized
Continuing Decline

E d ito R i A l
5 Reinforcing the case for transformation
c h A p t E R i
overview of performance
6 Key findings
12 Management summary
14 on the way up or on the way out?
c h A p t E R i i
Macro-developments
18 Gathering pace: consolidation kick-started in 2014
22 Significant regulatory developments
Success and failure in the ’new normal‘
c o n t E n t
c h A p t E R i i i
Analysis of performance and trends
26 Methodology and basis
28 profitability
30 Assets under Management
33 Revenue development
35 cost development
38 Balance sheet and regulatory capital
41 provisioning for the US tax program
43 c o n tAc t S / i M p R i n t
A study by KPMG AG Switzerland in cooperation with the institute of Management
at the University of St. Gallen. -
Core team:KpMG Switzerland
dr. christian hintermann, partnerAlain christe, Manager
-University of St. Gallen (hSG)prof. dr. dr. tomi laamanen
3
Clarity on Performance of Swiss Private Banks

4

5
Reinforcing the case for transformation
Philipp Rickert and Christian Hintermann, KpMG Switzerland
characterized by relatively flat net new money
(nnM), low performance on assets under management
(AuM), and increasing competitive and regulatory
pressures, the ‘new normal’ of Swiss private banking
is an extremely challenging environment.
Against this backdrop, it is interesting to see
which banks are thriving and which are struggling.
A clear polarization is emerging between strong
performers and those that are unable to reverse their
decline. For some, costs relating to the US tax program
may be the final push to re-assess their ongoing
participation in the Swiss market.
this study casts light on the varying performances
of Switzerland’s private banks by analyzing the
annual results of 94 of them over the past eight years.
identifying trends across the sector and by size of bank,
the study reflects on banking executives’ efforts to
transform their organizations in line with evolving
opportunities and challenges.
the results are often striking. not only do we
observe the biggest pick-up in consolidation activity
since the 2007-2008 financial crisis, but also the extent
to which banks have (or have not) provided for their
exposures relating to the ongoing US tax program. We
also note the growing proportion of banks that are
incurring losses, as well as impacts on market share.
We hope you find the study interesting, and
would invite you to discuss with us the issues raised
and implications for your organi zation.
5
Clarity on Performance of Swiss Private Banks
E d ito R i A l

6
continuing decline at one-third of banks.two out of three of these 'declining' banks posted negative returns in 2013.

7
large banks are winning
market share.While half of small and medium
banks lost AuM, large banks grew their market share by one-third.
continuing decline at one-third of banks.

8
34 banks recorded losses in 2013, up from 23 in the prior year.
loss-making banks are stacking up.
8

9
With the automatic exchange of information (AEoi) and other
initiatives coming up, costs are bound to rise.
chf0.9 billion for the us tax program
is only the start.
9

January to July 2014 saw M&A involving almost 10% of the AuM of banks in this report.
consolidation is gathering speed.
10

despite cost-cutting efforts, costs per employee are largely
unchanged since 2006.
personnel costsremain
stubbornlyhigh.
11

The new normal of Swiss private banking is relatively low net new money (NNM), persistently high costs per employee and falling revenue margins and profitability. Who will succeed in this new normal will depend on their ability to manage down personnel costs while attracting new business in an environment of stagnating AuM. Large banks appear to be winning the battle, gaining market share and enjoying highest returns on equity (RoE). This will help drive consolidation in the market, which is already gathering pace due to market pressures and resolution of the US tax program. Also fuelling consolidation are banks that are in decline. The signs point to a more dramatic fall in the number of market participants over the coming years and an even greater concentration of business at larger banks.
ManageMent suMMary
characteristics of Swiss private banking in 2013
of the 94 banks in our sample
34 … or have completed their turnaround
59 … or have stabilized their decline
34 …
are strong performers
posted losses
are in continuing decline
c h A p t E R i · Ov e Rv i e w O f P e R f O R M A n C e
12

adding to the challenges is a¼ fall in roe due to provisions and expenses for the us tax program of
chf 0.9 billion. together with an increasing frequency in one-off costs and persistently high personnel costs at
chf 213,000 per fterepresenting
2 ⁄3…many banks must urgently assess their swiss operations amid declining performances.
of the average bank’s cost base
despite nnm of
chf 19 billion in the swiss market aum outflows were observed at
54% 50%
of small banksof medium banks
not least foreign-owned banks, whose
roe is 59% swiss-owned banks. this is likely to accelerate the uptick in consolidation that has already started as acquisitions represented
10% with m&a helping large banks expand their market share by 1⁄3.
of that earned by
of the aum of banksin this report
13
Clarity on Performance of Swiss Private Banks
13

on the way up or
on the way out?-
RoE improvements still needed at most Swiss private banks
Based on their financial performance over 2006-2013, we categorized private banks into four clusters to highlight their divergent paths. the results were striking. Four distinct groups emerge – Strong performers maintained relatively strong financial performances over the period, turnaround completed have almost finished recovery plans and are potentially well-positioned for the future, those for which decline Stabilized still face considerable challenges, while those in continuing decline urgently need to reverse their deterioration.
Key findinGS
1. Four distinct groups of private banks emerged based on their performance: Strong Performer, Decline Stabilized, Continuing Decline, and Turnaround Completed.
2. Greater profitability at Strong Performers appears strongly associated with higher revenue per FTE rather than lower costs.
3. AuM among Strong Performers declined while it increased among Continuing Decline and Decline Stabilized banks. This could indicate that the two declining groups are more aggressive in attracting new business, at the expense of profitability.
4. In the last three years Strong Performers and Decline Stabilized banks were most active in expanding internationally. Market exit statistics are dominated by the Turnaround Completed and Continuing Decline groups.
5. Decline Stabilized banks cut their operating costs per employee by 20% over 2006-2013. This compares to only a 4% cut at Continuing Decline banks, suggesting there remains considerable work to be done before their decline is stabilized.
p Ro F. d R . d R . to M i l A A M A n E n
14
c h A p t E R i · Ov e Rv i e w O f P e R f O R M A n C e

continuingdecline
36%
declinestabilized
28%
turnaroundcompleted
20%strongperformer
16%
• Engaged in turnaround and already mostly completed it.
• 2006-2013 average RoE: 3.0%, but already showing clear signs of recovery.
11.1%14.3%
0.5%-0.1%
-6.7%-4.8%
3.9%5.8%
-10.0%
-5.0%
0.0%
5.0%
10.0%
15.0%
20.0%
2006 2007 2008 2009 2010 2011 2012 2013
• Average RoE has declined over most of the period observed. Main challenge is how to stabilize operations and return to profitability.
• 2006-2013 average RoE: 4.5% (21 banks in this cluster had negative RoE in 2013).
2006 2007 2008 2009 2010 2011 2012 2013
13.0%13.3%
8.7%
3.1%1.4% 1.4%
2.4%
-7.8%-10.0%
-5.0%
0.0%
5.0%
10.0%
15.0%
• Able to sustain relatively healthy and stable profitability and RoE.
• 2006-2013 average RoE: 14.9%.
18.2%
22.4%
13.1%
7.7%
12.8%
16.1%
11.2%
17.8%
0.0%
5.0%
10.0%
15.0%
20.0%
25.0%
2006 2007 2008 2009 2010 2011 2012 2013
• Experienced a decline in RoE but have stabilized it at a lower level.
• 2006-2013 average RoE: 8.8% (but only around 4% over the past four years).
2006 2007 2008 2009 2010 2011 2012 2013
15.7%
18.7%
9.8%
7.1%5.4%
3.8%
6.1%
4.1%
0.0%
4.0%
8.0%
12.0%
16.0%
20.0%
15
Clarity on Performance of Swiss Private Banks

fOuR diSTinCT CluSTeRSThe 15 banks categorized as strong Performers were able to maintain relatively stable RoE levels despite changes in the external environment. Average RoE of this group over 2006-2013 was 14.9%. Consistent with the notion of the ‘new normal’, a large group of 26 private banks experienced a decline in RoE though they have now stabilized it at a lower level. These Decline Stabilized banks had an average RoE over 2006-2013 of 8.8%.
In the largest performance cluster are the 33 banks categorized as being in Continuing Decline. With their average RoE falling for most of the seven years observed, they now face the challenge of stabilizing their operations and returning to profitability. 21 of these 33 banks had a negative RoE in 2013. Finally, a cluster of 19 banks that are named Turnaround Completed had an average RoE of 3.0% due mainly to weaker years in 2010 and 2011, though RoE in 2013 is showing clear signs of recovery.
HiGHeR AuM AT STROnG PeRfORMeRS, THOuGH THe GAP iS ClOSinGStrong Performers were generally the largest banks in terms of AuM. Scale appears to have helped their performance. The average gross AuM of these banks fell over the period observed, however. Interestingly, AuM at Decline Stabilized and Continuing Decline rose over the period. By the end of 2013, average AuM in these clusters was actually close to the Strong Performers. While this may at first seem surprising, it may indicate that Decline Stabilized and Continuing Decline banks have adopted more aggressive strategies to attract new clients at the expense of profitability. How these banks therefore perform in the coming years will be interesting to watch.
THe MORe SuCCeSSful BAnKS ACHieved BiGGeST COST ReduCTiOnS A clear gap exists between Strong Performers and other clusters in terms of net revenue per FTE. Indeed, it appears to be through higher revenue – rather than cost reduction – that Strong Performers sustained relatively high profitability. They posted an average of CHF554,000 net revenue per FTE in 2013 (although as for most banks, this is down on 2007). The cut-off for profitability appears to be around CHF400,000, which contributes to the challenges facing those in Continuing Decline for which net revenue per FTE was CHF363,000 in 2013.
net revenue per fTe (CHf000)
300
400
500
600
700
800
2006 2007 2008 2009 2010 2011 2012 2013
200
Strong Performer
Turnaround Completed
Decline Stabilized
Continuing Decline
16
c h A p t E R i · Ov e Rv i e w O f P e R f O R M A n C e

Change in international footprint
the success of strong performers
seems to be based on higher revenue per fte rather than
lower costs.
It is striking that Decline Stabilized banks cut their operating costs most aggressively (by 20%) out of all clusters. By contrast, operating costs at Continuing Decline banks fell by only 4%. In terms of numbers of FTEs, Continuing Decline banks expanded their headcount by 25% over the period and Decline Stabilized by 13%. This contrasts sharply with a 15% reduction in headcount at Turnaround Completed and an even greater reduction at Strong Performers of 24%.
neT Revenue MARGinS On neT AuM lOweST AT STROnG PeRfORMeRS On the whole, the success of Strong Performers seems to be based on higher revenue per FTE rather than lower costs. However, net revenue margin on net AuM at Strong Performers is at around 95 basis points – much lower than all other clusters. Strong Performers’ net revenue margins have also remained relatively stable with a decline of only nine basis points over the past seven years. This is in stark contrast to the Continuing Decline and Turnaround Stabilized groups, which have seen falls of more than 20 basis points.
STROnG PeRfORMeRS And deCline STABilized ARe MOST inTeRnATiOnAlly ACTive More than half of Strong Performers and Decline Stabilized have international branch offices or subsidiaries. By contrast, the clear majority of banks in other clusters operate predominantly out of Switzerland. The number of international entries and exits undertaken in recent years bears this out. Strong Performers and Decline Stabilized have been the most active in international expansion in the last three years. Turnaround Completed and Continuing Decline meanwhile dominate exit statistics in this year.
This could indicate a continuing retrenchment of the declining banks while the stronger groups continue to expand. Whether a lack of international expansion helps or hinders the chances of struggling banks remains to be seen.
5
10
15
20
25
30
2007 2008 2009 2010 2011 2012
0
International exits International entries
35
n OT e :
international entries and exits refer
to subsidiaries, branches
and representative offices.
17
Clarity on Performance of Swiss Private Banks

18
As 2014 progresses, consolidation is gathering pace. A significant uptick since May 2014 is the result of greater clarity over risks, including the outcomes of the US tax program and less management time being absorbed by the matter.
GatherinG pace: consoli dation kick-started in 2014
c h A p t E R i i · M AC R O - d e v e lO P M e n T S
n OT e :
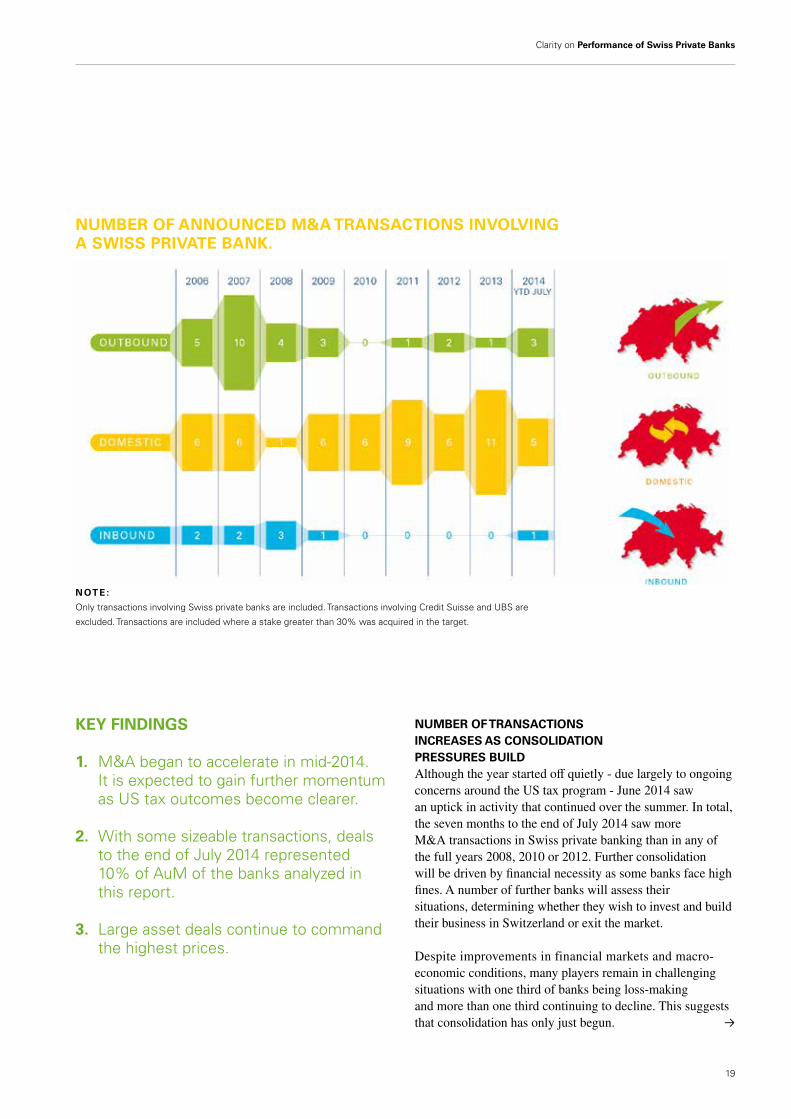
only transactions involving Swiss private banks are included. transactions involving credit Suisse and UBS are
excluded. transactions are included where a stake greater than 30% was acquired in the target.
nuMBeR Of TRAnSACTiOnS inCReASeS AS COnSOlidATiOn PReSSuReS BuildAlthough the year started off quietly - due largely to ongoing concerns around the US tax program - June 2014 saw an uptick in activity that continued over the summer. In total, the seven months to the end of July 2014 saw more M&A transactions in Swiss private banking than in any of the full years 2008, 2010 or 2012. Further consolidation will be driven by financial necessity as some banks face high fines. A number of further banks will assess their situations, determining whether they wish to invest and build their business in Switzerland or exit the market.
Despite improvements in financial markets and macro-economic conditions, many players remain in challenging situations with one third of banks being loss-making and more than one third continuing to decline. This suggests that consolidation has only just begun. ≥
Key findinGS
1. M&A began to accelerate in mid-2014. it is expected to gain further momentum as US tax outcomes become clearer.
2. With some sizeable transactions, deals to the end of July 2014 represented 10% of AuM of the banks analyzed in this report.
3. large asset deals continue to command the highest prices.
nuMBeR Of AnnOunCed M&A TRAnSACTiOnS invOlvinG A SwiSS PRivATe BAnK.
19
Clarity on Performance of Swiss Private Banks

SizeABle deAlS, inCludinG A fiRST MAjOR new enTRAnT inTO SwiTzeRlAnd Transactions included some sizeable deals, with acquisitions in the seven months to the end of July 2014 involving around CHF125 billion of AuM. This amounts to almost 10% of AuM of the banks analyzed in this report, and is even higher when considering that AuM is not disclosed for all transactions. These deals included BTG Pactual’s acquisition of Switzerland’s BSI (AuM of around CHF90 billion), being the first major new entrant into the Swiss private banking sector since 2008 (acquisition of AIG Private Bank by Aabar Investments). Further deals involving HSBC and LGT, and Morgan Stanley and Safra Sarasin, confirm there is a group of banks that can take advantage of market conditions to grow.
lARGe ASSeT deAlS COMMAnd THe HiGHeST PRiCeS Significant potential synergies for larger players are helping fuel higher prices for large asset deals, due also to the increased competition such deals attract. By contrast, lowest multiples tend to be paid for share deals with smaller banks. Bidders differentiate more clearly within deals as to the prices they are prepared to pay for
individual parts of a portfolio, varying the goodwill offered for different quality of AuM such as size of clients, declared/undeclared, revenue margin or domicile of clients. Asset deals tend to be more straight-forward for acquirers that already have a bank in Switzerland as they can integrate relationship managers and clients into an existing platform, limiting additional costs. Share deals should not be ruled out where sellers are well prepared and provide full transparency to acquirers. Some failed deals in recent years have been due to a lack of preparation on the part of the vendor. This also increases the perceived risk for the buyer, leading to lower purchase prices.
BAnKS will Be fORCed inTO deCidinG On A COuRSe Of ACTiOn Vendors of well-performing banks and client portfolios have been able to push offers upwards as there remains strong interest for good client assets. Many banks have not yet decided the best way forward as they assess significant strategic and financial situations. With the automatic exchange of information (AEoI) becoming a reality in the near future and the regulatory environment becoming increasingly tougher, however, a ‘wait and see’ approach is no longer an option.
2005
182
2006
176
2007
174
2008
171
2009
171
2010
166
2011
161
2012
148
2013
139
nuMBeRS Of PRivATe BAnKS in SwiTzeRlAnd
2005 2013
20
c h A p t E R i i · M AC R O - d e v e lO P M e n T S

PRivATe BAnKinG TRAnSACTiOnS 2013 And fiRST Seven MOnTHS Of 2014
Announced
Jul 2014
Jul 2014
Jul 2014
Jul 2014
Jun 2014
May 2014
Apr 2014
Mar 2014
Jan 2014
nov 2013
nov 2013
Sep 2013
Aug 2013
Aug 2013
Jul 2013
Jun 2013
Jun 2013
Jun 2013
May 2013
Feb 2013
Feb 2013
Target
Banque privée Espirito Santo (portfolio of iberian and latin American client assets)
leumi private Bank (Swiss-based private banking business)
Bank leumi luxembourg
BSi
hSBc Switzerland (asset portfolio of international private clients and external asset managers)
Valartis Bank and Valartis Wealth Management
Bank Morgan Stanley (Switzerland)
GpS investimentos Financeiros e participações (increased existing 30% stake to 80%)
Falcon private Bank (hong Kong branch)
AKB privatbank
WM partners
liechtensteinische landesbank (lugano branch)
Banque de dépôts et de Gestion
trinova invest
degroof Banque privée
hyposwiss privatbank (portfolio of central and Eastern European client assets)
hyposwiss privatbank (portfolio of latin American client assets)
hyposwiss private Bank Genève
lloyds Banking Group (international private banking business)
coges corratiere Gestion
tFM Asset Management (60% stake)
Bidder
cBh compagnie Bancaire helvétique
Julius Baer Group
Julius Baer Group
Banco BtG pactual
lGt Group
Banque cramer & cie
Bank J. Safra Sarasin
Julius Baer Group
EFG international
ihAG privatbank
Julius Baer Group
pKB privatbank
Banque cramer & cie
Sallfort privatbank
Banque landolt & cie
Falcon private Bank
Banque privée Espirito Santo
Mirelis invest trust
UBp
Banque Baring Brothers Sturdza
Julius Baer Group
AuM (CHfbn)
n/a
5.9
1.3
90.0
10.0
2.0
10.0
5.6
0.8
1.3
2.0
n/a
n/a
n/a
n/a
2.2
0.5
2.0
10.0
n/a
n/a
direction
domestic
domestic
outbound
inbound
domestic
domestic
domestic
outbound
outbound
domestic
domestic
domestic
domestic
domestic
domestic
domestic
domestic
domestic
outbound
domestic
domestic
i n B O u n d d O M e S T i C O u T B O u n d
21
Clarity on Performance of Swiss Private Banks

2012 20 13
22
Significant regulatory developments
within the last two years
JU
L
AU
g
SE
p
Oc
T
NO
v
DE
c
JAN
13
FE
b
MA
R
Ap
R
MA
y
JU
N
c h A p t E R i i · M AC R O - d e v e lO P M e n T S
JUly 2012
france criticizes its tax treaty with switzerland and pushes
through an inheritance tax treaty with switzerland.
30 octoBER 2012
the swiss federal court decides that banks must disclose and repay
retrocessions upon client request.
19 JUnE 2013
the swiss parliament rejects the ”us deal” and
prefers to wait for ”plan b”.
17 JUly 2012
the swiss federal council approves a clause corresponding to art. 26 of
the oecd model convention on administrative assistance in tax matters. group enquiries will be
possible.
12 dEcEMBER 2012
after the swiss federal council, the joint mediation committee of the
german bundestag and bundesrat rejects a tax treaty with switzerland.
4 dEcEMBER 2012
switzerland and the us agree on the fatca agreement to enter into
force as of 2014.
20 dEcEMBER 2012
swiss federal councillor eveline widmer-schlumpf declares a
necessity to discuss the automatic exchange of information.
1 JAnUARy 2013
witholding tax agreements between switzerland and the
uk and austria take effect.
JAnUARy 2013
bank wegelin pleads guilty at a us court of having aided and abetted
us citizens to evade taxes. the bank pays a fine of usd74 million.
FEBRUARy 2013
the finma implements the sectoral counter-cyclical capital buffer.
21 MARch 2013
the us requests administrative assistance by means of group
request from credit suisse.
ApRil 2013
the united states attorney-general sues an employee of a
swiss private bank and a lawyer of a swiss law firm for
active assistance in tax evasion for u.s. clients.
29 MAy 2013
eveline widmer schlumpf presents the ”us deal”. 14 JUnE 2013
the swiss federal council expresses its willingness to actively participate
in the development of a global standard for the aeoi by the oecd.
7 JUnE 2013
switzerland and the us sign a bilateral agreement on the
fatca agreement.

201420 13
23
Clarity on Performance of Swiss Private Banks
JU
L
AU
g
SE
p
Oc
T
NO
v
DE
c
JAN
14
FE
b
MA
R
Ap
R
MA
y
JU
N
2 0 1 2 2 0 1 3 2 0 1 4
3 JUly 2013
the swiss federal council defines the main points for the settlement of
the tax dispute between swiss banks and the us authorities.
29 AUGUSt 2013
switzerland and the us sign a joint statement for the settlement of the tax
dispute relating to swiss banks.
1 octoBER 2013
finma circular on market conduct rules in securities trading enters
into force.
13 dEcEMBER 2013
the swiss federal council approved its report to parliament on the new
federal law on implementing the revised recommendations of the fatf: tax offences regarding direct
and indirect taxation will be considered predicate offences to money laundering.
MAy 2014
the swiss federal council publishes draft mandates for the
implementation of a global aeoi standard.
20 MAy 2014
finma publishes a summary report on the lawsuit regarding credit suisse’s business with
us clients.
MAy 2014
the international monetary fund publishes results of its financial sector review for switzerland. JUnE 2014
france terminates the inheritance tax agreement with switzerland
effective end 2014.
2 JUnE 2014
fatca agreement between switzerland and the us enters
into force.
27 JUnE 2014
the swiss federal council initiates a consultation on the new federal
financial services act (ffsa or fidleg) and on the financial institutions act
(finia or finig) to run until 17 october 2014.
30 JUnE 2014
implemention act for fatca becomes effective.
7 JUly 2014
finma publishes a completely revised circular on liquidity
risks for banks, taking effect from 1 January 2015.

C h a p t e r · T e x T
24

Clarity on Performance of Swiss Private Banks
26 Methodology and basis
28 Profitability
30 Assets under Management
33 Revenue development
35 Cost development
38 Balance sheet and regulatory capital
41 Provisioning for the uS tax program
43 C O n TAC T S / i M P R i n T
Analysis of performance and trends
clarity on Performance of Swiss Private Banks
25

26
c h A p t E R i i i · A n A lyS i S O f P e R f O R M A n C e A n d T R e n d S
the study assessed the 2013 annual reports of 94 private banks (2012: 103) totalling chF1,417.9 billion AuM and 31,625 full time employees. Excluded from the dataset were:
• CreditSuisseGroup(AuMofCHF790.7billion)and UBS (AuM of chF886.0 billion)1. • Branchofficesofforeignbanks. • “Banquiersprivés”. • Privatebankingunitsofcantonalbanksand regional banks (separate private banking subsidiaries of cantonal banks were included in the sample).
in this fragmented market, 61.7% of the 94 banks managed less than chF5 billion in AuM in 2013.conversely, a mere 16.0% of banks managed 76.5% of AuM. this distribution gap would be even widerif credit Suisse Group and UBS were included.
7.8%
61.7%
15.7%
22.3%
76.5%
16.0%
0%
20%
40%
60%
80%
100%
AuM # of banks
Small Medium Large
Methodology and basis
d e f i n i T i O n O f B A n K S i z e S
Small banks managing assets of less than chF5 billionMedium banks managing assets between chF5 and chF25 billionlarge banks managing assets in excess of chF25 billion
G l O S S A R y
AEoi Automatic Exchange of informationAuM Assets under Managementbps Basis pointschF Swiss francsFtE Full time EquivalentsM&A Mergers & AcquisitionsnnM net new MoneyRoE Return on Equity
1 Figures used for credit Suisse Group pertain specifically to its Wealth Management clients; UBS figures relate to its Wealth Management clients (excluding Wealth Management Americas)
The dataset

27
Clarity on Performance of Swiss Private Banks
Methodology usedthe study mainly uses two types of chart: Median charts show the median value for the entire sample. in addition, they note the value for each of the 25th and 75th percentiles.
Standardized charts are based on a constant sample, whereby a base year is selected that represents 100%. Further years in the chart are shown as proportionately greater or lower than the base year.
due to differing sample sizes and basis of analysis, results might vary between the two chart types.
2006
8%10%
2013
0%
5%
10%
15%
20%
4%5%
15%16%
Median
25th percentile
75th percentile
example: median chart
2006 2013
50%
0%
100%
150%
Income type 1
40%
30%
30%
50%
40%
30%100%
120%
Income type 2
Income type 3
example: constant sample chart (2006 base year)
therefore, in 2013:
• One-quarterofbankshaveavalueofmorethan16%.
• One-halfofbankshaveavalueofmorethan10%, with the other half being below 10%.
• Three-quartersofbankshaveavalueofmorethan5%.
in 2013, the total income amounted to 120% of that of 2006.

28
c h A p t E R i i i · A n A lyS i S O f P e R f O R M A n C e A n d T R e n d S
Return on Equity (RoE) fell substantially in 2013, largely hit by provisions relating to the US tax program. there was a slight improvement in underlying operating performance, however this masks increasingly polarized positions with the number of loss-making banks (before extraordinary items) rising from 23 to 34.
13.9% 13.0%
8.4%
6.0%
4.1% 3.8% 4.0% 3.3%
5.0%
10.0%
15.0%
20.0%
2006 2007 2008 2009 2010 2011 2012 2013
Median 25th percentile 75th percentile
Roe development
Profitability
• provisions relating to the US tax program caused RoE to fall by one quarter. Removing these impacts, underlying RoE rose from 4.0% to 4.5%.
• large banks reported higher RoEs (4.3%) than their smaller counterparts (1.7%).
• 34 banks posted losses before extraordinary items, up from 23 in 2012. 9 of the 34 incurred losses for the first time over the past four years due to the US tax program.
• Foreign-owned banks’ RoE is on average 59% that of Swiss-owned banks.
2013 kEy FiNDiNgS:

29
Clarity on Performance of Swiss Private Banks
Reduction in Roe – profitability is lower than reasonably expectedAverage reported RoE fell from 4.0% to 3.3% over the course of 2013. this was driven primarily by the impact of an increase in value adjustments, provisions and losses – mainly as a result of the US tax program. Excluding these effects, RoE would have been 4.5%.
nine out of ten banks posted RoE of less than 8% in 2013. this is lower than the 8% to 10% we would expect, depending on the business model. taking into account a small cap premium, the RoE for small banks should be even higher at 10% to 12%. this represents a significant gap between achieved RoE and compensation shareholders should expect to earn for the risk they bear.
uS tax program provisions amount to one-quarter of Roethe greatest increases in provisions were driven by settlement programs with the US tax authorities and to a lesser extent the UK tax authorities. this caused RoE to fall by more than one-quarter.
As many banks provided for professional costs but not potential fines, results in future years might continue to be hit hard and may be substantially worse. For those banks that did provide for fines, the impact on RoE was negative 8.2 percentage points.
34 loss-making banks in 2013, up 11 on the prior yearindeed, driven by the tax programs a further 11 banks posted losses in 2013. For nine of these banks, it was the first losses posted in at least four years.
the proportion of loss-making banks increased over all three size categories. Most notably, large banks were among the loss-makers for the first time since 2010.
12.8% 13.4%
7.0% 4.8%
3.2% 2.4% 3.3% 2.4%
1.1%
1.3%
1.3%
0.9% 1.4%
0.7% 0.9% 1.2%
13.9% 13.0%
8.4%
6.0%
4.1% 3.8% 4.0% 4.5% 4.0%
8.0%
12.0%
16.0%
2006 2007 2008 2009 2010 2011 2012 2013
Estimated U.S. tax impact
Influence of extraordinary income
Adjusted RoE
influence of extraordinary items on Roe
loss-making banks as percentage of all banks (before extraordinary income)
5.0% 2.6%
22.6% 22.7%
30.2%
25.0% 22.8%
36.2%
10%
20%
30%
40%
2006 2007 2008 2009 2010 2011 2012 2013
Small banks
Medium banks
Large banks

30
c h A p t E R i i i · A n A lyS i S O f P e R f O R M A n C e A n d T R e n d S
despite the various pressures impacting Swiss private banking, 2013 saw overall positive nnM of chF18.6 billion. this inflow was mainly to large banks, helping them expand their market share substantially. By contrast, half of small and medium banks experienced net AuM outflows.
9% 12% 9% 8% 8% 7% 7% 8%
17% 19%
16% 16% 17% 18% 19% 20%
74%
83%
66% 73% 70% 69% 78% 78%
100%
114%
91% 97% 95% 93%
104% 106%
0%
20%
40%
60%
80%
100%
120%
2006 2007 2008 2009 2010 2011 2012 2013
AuM in own funds Discretionary AuM Other AuM
development of assets under management (base: AuM 2006, constant sample)
Assets under Management
• total AuM remained relatively stable over the past six years at around chF1.4 trillion.
• chF18.6 billion positive nnM, mostly to large banks.
• 54% of small banks and 50% of medium banks suffered net AuM outflow.
2013 kEy FiNDiNgS:
• 2.2% median AuM performance is surprisingly low given the positive market environment.
• Market share of large banks grew by one third from 59% in 2008 to 78% in 2013.

31
Clarity on Performance of Swiss Private Banks
development of AuMPositive - though low - nnM growthAuM for our entire sample remained stable in 2013 at chF1,418 billion compared to chF1,425 billion in the prior year. Each of the past three years saw positive nnM, although at low levels, chF18.6 billion in 2013 and chF33.7 billion in 2012. Banks that reported positive nnM saw an average nnM of 9.0%. highlighting how overall growth can be impacted by substantial transactions at individual banks, restructuring at one group caused chF84.5 billion to be transferred out of Switzerland.
25 banks were able to grow their AuM by more than 10% while 35 banks lost AuM. Based on our constant sample of 73 banks for which data is available over the entire period, we see a slight increase in AuM in 2013 to 106% of 2006 levels.
larger banks grew market share; nnM outflows at half of small and medium banks the majority of 2013’s nnM inflow was to large banks, being chF16 billion out of the total chF18.6 billion. in 2013, 79% of large banks posted positive nnM. By contrast, 54% of small banks and 50% of medium banks suffered net AuM outflows. At the end of 2013, small banks represented 61.7% of our sample yet only 7.8% of total AuM.
in a further sign of their dominance of the Swiss private banking scene, larger banks expanded their market share considerably as consolidation gathered pace. Most was taken from medium banks as many were either acquired by large banks or grew into the large category. Some further medium banks shrank into the small category.
5% 4%
2%
(3)%
2% 0%
(1)%
0%
(15)%
(10)%
(5)%
5%
10%
15%
2006 2007 2008 2009 2010 2011 2012 2013
Median
25th percentile
75th percentile
nnM contribution to AuM
Performance contribution to AuM
7%
4%
(23)%
8%
(6)% (6)%
5% 2%
(30)%
(25)%
(20)%
(15)%
(10)%
(5)%
5%
10%
15%
2006 2007 2008 2009 2010 2011 2012 2013
Median
25th percentile
75th percentile

32
c h A p t E R i i i · A n A lyS i S O f P e R f O R M A n C e A n d T R e n d S
68.1% 67.4% 59.4%
67.4% 68.8% 69.1% 71.8% 76.5%
23.7% 23.7% 30.5%
23.3% 20.4% 20.8% 18.9% 15.7%
8.2% 8.9% 10.1% 9.3% 10.8% 10.1% 8.8% 7.8%
0%
10%
20%
30%
40%
50%
60%
70%
80%
90%
100%
2006 2007 2008 2009 2010 2011 2012 2013
Small banks
Medium banks
Large banks
AuM by bank size (as percentage of total)fewer client assets in cash = almost four times better performancepositive financial market developments helped banks that have a greater proportion of client assets invested in non-cash assets. the difference was striking. Banks with less than 15% of client assets in cash posted a +4.5% performance in AuM. those with cash assets greater than 15% posted a +1.0% performance in AuM. considering the strong performance of the financial markets in 2013 the median performance of 2% seems to be low.
efforts to grow discretionary mandates are not convincing clientsthe proportion of discretionary AuM remained stable at around one-fifth, demonstrating banks’ difficulties in growing profitability through this service offering. While many banks assert an ambition to grow discretionary mandates, clients appear unconvinced.

33
Clarity on Performance of Swiss Private Banks
Small banks earn substantially higher net revenue margins than other sized banks. the erosion of margins has continued almost across the board, impacted by lower commission rates generated on declared assets.
113 116
111 112
104 102 102 99
0
20
40
60
80
100
120
2006 2007 2008 2009 2010 2011 2012 2013
Bas
is p
oint
s of
ass
ets
unde
r m
anag
emen
t
Net revenue margin Gross profit margin Net profit margin
Margin development
Revenue development
2013 kEy FiNDiNgS:
• net revenue margins fell by three basis points.
• Small banks have a higher net revenue margin (103.7bps) than medium (89.2bps) and large (88.7bps) banks. however, the threat to high margin banks is the risk that earnings will continue to fall to a larger extent than for others.
• despite positive market conditions, commission margins declined.

c h A p t E R i i i · A n A lyS i S O f P e R f O R M A n C e A n d T R e n d S
34
lower commission margins drive a fall in net revenue marginsBehind 2013’s fall in net revenue margins is a decline in median commission margins from 65.4 to 62.4 bps. this reflects increased competition and lower margins earned on declared client assets. despite this general decline, one third of banks managed to increase their net revenue margins in 2013.
Smaller banks posted higher net revenue margins than medium or large banks. this is, however, in the context of falling revenue margins at both small and large banks. despite their higher net revenue margins, many small banks’ bottom-line profitability continues to struggle. indeed, higher revenue margins are not necessarily a sign of strong profits. As set out on page 15, Strong performers have lower but stable revenue margins.
lugano-based banks are the highest revenue earners, but the gap is narrowinglugano-based banks continue to generate higher margins than Geneva or Zurich-based banks, at 117.7bps, 102.6bps and 92.8bps respectively. A driver of this greater margin is a higher proportion of discretionary mandates. not all is good news, however, as lugano banks have seen their margins fall significantly over the prior year, when they stood at 126.9bps.
AuM growth fuels increase in net revenues… large banks fared bettertotal net revenues for the constant sample nonetheless grew in 2013 by four percentage points, driven by an expansion in AuM. this hides a great disparity in performance between bank sizes. While total revenues for large banks grew by three percentage points, there was a fall of four percentage points at small banks. overall, large banks posted revenue figures that were 12% higher than 2006 levels. conversely, small banks’ revenues fell by 25 percentage points since 2006.
composition of revenues at small banks remained stable over the same period, with commission income constitution about 67% of total revenue. Across all banks, the share of commission income fell from 65% in 2006 to 61% in 2013.
Revenue per employee meanwhile has climbed at both small and large banks in the last three years after hitting their lowest levels in 2011.
65% 78%
69%58% 59% 55% 57% 63%
19%
24% 31%
28% 24% 25% 25% 23%
12%
14% 12%
15% 15%12% 13% 12%
4%
6%1%
2% 3% 3%
4% 5% 100%
122% 113%
103% 101% 95%
99% 103%
0%
20%
40%
60%
80%
100%
120%
140%
2006 2007 2008 2009 2010 2011 2012 2013
Commission income
Interest income
Trading income
Other income
net revenue development (base: net revenues 2006, constant sample)
net revenue per average fTe (median)
387.5 406.6 424.3 387.3
429.1 463.4
400.3 421.3 479.4
0.0
100.0
200.0
300.0
400.0
500.0
600.0
Small banks Medium banks Large banks
CH
F'00
0
2011
2012
2013

35
Clarity on Performance of Swiss Private Banks
personnel expenses represent the lion’s share of banks’ costs. despite this, the industry has not succeeded in managing down average personnel costs in recent years. cost-income ratios overall remain high at more than 80%.
63.3% 59.8%
68.1%
75.3% 77.4%
81.4% 80.0% 80.7%
10.0%
20.0%
30.0%
40.0%
50.0%
60.0%
70.0%
80.0%
90.0%
100.0%
2006 2007 2008 2009 2010 2011 2012 2013
Median 75th percentile 25th percentile
Cost-income ratio
Cost development
Note: cost income ratio is calculated excluding depreciation
• cost-income ratio rose slightly to 80.7%.
• total FtEs in our sample was stable at around 31,000, though half of banks (mainly small and medium) saw staff levels fall.
• At chF213,000, personnel costs per employee remained flat over the past three years.
2013 kEy FiNDiNgS:

36
c h A p t E R i i i · A n A lyS i S O f P e R f O R M A n C e A n d T R e n d S
Regulation and uS tax programs outweigh cost savingsthe median cost-income ratio rose by almost one percentage point in 2013. Among the key drivers are increased costs relating to regulatory compliance. Such measures appear to offset the benefits of banks’ cost reduction activities in recent years.
22 banks had a cost-income ratio below 70% in 2013 – most of these banks had low ratios over the entire period under review. larger banks enjoy lower cost-income ratios than smaller banks, at 74.5% and 83.8% respectively. this gap has narrowed, however. overall, one quarter of banks have consistently improved their cost-income ratios and RoE since 2011, though there remains considerable work to be done if profitability is to be enhanced.
Average employee costs climb at large banksSurprisingly given the relatively weak financial performance at many banks, personnel costs per employee remained stable over the past three years at chF213,000. this again masks differing developments across bank sizes: average employee costs rose by 4.6% at large banks in 2013 while falling slightly at small and medium banks. however, overall, personnel costs per FtE have remained high over the past eight years at a time when worsening bank performance and any cost-cutting efforts should have seen them fall.
this is against a backdrop of more than half of banks increasing their headcount in 2013. only one quarter of banks reduced their headcount by 5% or more in 2013.
224 227 221 215 210 213 213 213
50
100
150
200
250
300
350
400
450
2006 2007 2008 2009 2010 2011 2012 2013
CH
F'00
0
Median
5th percentile
95th percentile
employee costs per average fTe
Change in fTe
5%
7% 7%
0% 0% 0%
(0%)
0%
(10)%
(5)%
5%
10%
15%
2006 2007 2008 2009 2010 2011 2012 2013
Median
25th percentile
75th percentile

37
Clarity on Performance of Swiss Private Banks
20,329 21,146 20,662 21,887 22,121 21,936 22,693 24,150
6,400 6,623 8,273 6,386 5,544 5,317 5,509 4,757
3,008 3,346 4,062 3,687 4,173 3,638 3,430 2,718 29,737
31,115 32,997
31,960 31,838 30,891 31,632 31,625
5,000
10,000
15,000
20,000
25,000
30,000
35,000
2006 2007 2008 2009 2010 2011 2012 2013
Small banks
Medium banks
Large banks
fTe by bank size
Total tax expenses (constant sample)
699.4
905.6
698.9
574.2
439.6 396.5 398.9
312.5
0%
5%
10%
15%
20%
25%
100
200
300
400
500
600
700
800
900
1,000
2006 2007 2008 2009 2010 2011 2012 2013
% o
f pr
ofit
befo
re t
ax
CH
Fm
Total tax expenses
Implied "tax rate"
Total number of employees is staticthe total number of employees at banks in our sample remained stable at around 31,000. Small and medium banks in particular cut headcount, while the number of FtEs at large banks rose in parallel with a growing client base (AuM).
When looking at AuM per FtE, large banks continue to have the upper hand at chF53.7 million of AuM per FtE compared to chF38.0 million at small banks. this in turn drives employee productivity statistics, with larger banks able to improve productivity in recent years, posting greater productivity than small or medium banks.
Taxes paid in 2013 are almost two-thirds lower than in 2007tax expenses for our constant sample (73 banks where we have data across all the years observed) amounted to chF313 million in 2013, down from chF906 million in 2007. the median implied tax rate fell from 22% in 2007 to 14% in 2013.

38
c h A p t E R i i i · A n A lyS i S O f P e R f O R M A n C e A n d T R e n d S
38
cautious investor behavior has led to high customer deposits, growing balance sheet totals since 2006. this represents cheap funding for banks, though they are not able to earn an interest margin on it. Meanwhile, despite healthy capital coverage ratios at many banks, potentially substantial fines arising from the US tax program could pose severe difficulties – causing genuine going concern threats at some banks.
11% 11% 12% 13% 13% 13% 13% 13%
26% 30% 32% 27% 27% 27% 23% 24%
63% 77% 84% 92% 85% 98% 103% 100%
100%
118% 128% 132%
125%
138% 139% 137%
0%
50%
100%
150%
2006 2007 2008 2009 2010 2011 2012 2013
Equity Other liabilities Due to customers
Balance sheet development (base: assets 2006, constant sample)
Balance sheet and regulatory capital
• Some banks will struggle to absorb potential US tax fines given their existing equity levels. this could pose a threat to their going concern.
• Adjusted for excess regulatory capital, the median normalized RoE amounted to 5.0% (1.5 percentage points above reported RoE of 3.5%).
• increasing customer deposits have led to balance sheet totals higher than in 2006 despite recent more positive market conditions.
• At a median value of 345%, banks’ capital coverage ratios are generally healthy.
2013 kEy FiNDiNgS:

39
Clarity on Performance of Swiss Private Banks
166% 149%
234%
350% 295% 284%
317% 305%
100%
200%
300%
400%
500%
600%
700%
2006 2007 2008 2009 2010 2011 2012 2013
Median
25th percentile
75th percentile
Customers deposits / loans
eligible / required capital by bank size
321% 372%
334% 338%
273% 280%
0%
100%
200%
300%
400%
500%
600%
2012 2013 2012 2013 2012 2013
Small Medium Large
Median
Client’s ongoing risk aversion = lower earning potential for banksAmounts due to customers have grown by an overall 59.7% since 2006. When compared to AuM, average customer deposits increased from 7% in 2006 to 18% in 2013. ongoing risk aversion among clients is resulting in such a high portion of AuM being held in bank accounts rather than being invested elsewhere. For banks, this leads to lower earning potential. in 2013, approximately one third of deposits were lent to clients mainly in the form of lombard loans, and to a limited extent mortgages.
Capital coverage ratios increase by the threat of uS tax dominatesEligible to required capital ratio rose from 320% in 2012 to 345% in 2013 due to an increase in eligible capital while required capital fell. Small and medium banks generally enjoyed higher capital coverage ratios, at medians of 372% and 338% respectively. this compared to 280% at larger banks. Some banks improved ratios by prudent dividend policies and optimizing lending capabilities.
loss-making banks posted a more comfortable ratio of 437%. however, for banks that make persistent losses, serious questions arise around what actions are being taken to remedy the situation, such as changes to business models. A significant challenge exists for banks with greater historical exposure to US risks to absorb prospective fines in their existing equity.
the implementation of Basel iii in early 2013 meanwhile had a limited impact on private banks due to their limited credit activity.

40
c h A p t E R i i i · A n A lyS i S O f P e R f O R M A n C e A n d T R e n d S
40
Normalized RoE
Reported RoE
5.5%
7.6%
5.0%
3.4%
4.6%
3.5%
0.0%
2.0%
4.0%
6.0%
8.0%
10.0%
12.0%
2011 2012 2013
Roe on target required capital (including extraordinary items)
Roe improves when adjusted for regulatory excess capitalto quantify the impact of excess capital on RoE, a normalized RoE was calculated for the 74 banks where regulatory capital information was available. this applies a target common Equity tier 1 ratio of 15% across all banks. Also taken into consideration was a minimum capital requirement of chF20 million.
it is striking how low the normalized RoE is for almost all banks. Even with the adjusted regulatory capital, RoE stands at only 5.0%. this is considerably lower than the 8% to 10% (or even 8% to 12% for small banks) that might reasonably be expected.
Note: includes only the 74 banks that published regulatory capital data

41
Clarity on Performance of Swiss Private Banks
the impact of the US tax program is making its mark on financial statements. Banks that provided for both potential fines and related costs saw their RoE hit by a negative 8.2 percentage points in 2013. that these banks account for only one-fifth of Swiss private banks suggests this may only be the beginning, with many more potentially exposed.
1.7% 1.5%
4.1% 3.6% 2.7% 2.8%
5.3%
13.5%
0.0%
10.0%
20.0%
30.0%
40.0%
50.0%
2006 2007 2008 2009 2010 2011 2012 2013
Median 25th percentile 75th percentile
valuation adjustments, provisions and losses as a proportion of gross profit
Provisioning for the uS tax program
• provisions totaling approximately chF0.9 billion were created in relation to the US tax program.
• 21 banks recorded provisions totaling chF0.5 billion for potential fines and related costs after announcing they will cooperate with the US tax program. the impact on RoE of these banks was a negative 8.2 percentage points.
• 41 banks neither confirmed nor denied their cooperation with the US tax program. these banks appear to have made only low-level provisions, totaling approximately chF0.05 billion.
• 11 banks provided for only professional fees, not potential fines, totaling approximately chF0.07 billion.
2013 kEy FiNDiNgS:

42
c h A p t E R i i i · A n A lyS i S O f P e R f O R M A n C e A n d T R e n d S
42
Provisioning increase due to foreign tax programsValuation adjustments, provisions and losses rose from 4.7% to 13.6% of gross profit in 2013. For one quarter of banks, this represented almost half of their gross profit. this level of provisioning is attributable primarily to participation in the US and UK tax programs, in particular that of the US department of Justice.
36 banks disclosed that they will cooperate with the US tax program in category 2. however, only 21 of these banks have provided for a potential fine as well as costs. these banks saw their 2013 RoE negatively impacted by 8.2 percentage points.
Approximately CHf0.9 billion is likely to be just the startit is estimated that at the end of 2013 the total provisions in relation to the US tax program stood at approximately chF 0.9 billion. the majority of this related to category 2 banks.
A further number of category 2 banks and other categories have provided only for professional fees, not potential fines. this suggests that the charges so far might be relatively low, with more impacts expected on profitability in 2014 and beyond.
A further 41 banks have neither confirmed nor denied their cooperation with the program and 6 banks disclosed they will not participate to the US tax program.
(1.1)% (8.2)% (2.1)% (4.8)% (0.6)% (0.2)%
(2.0)%
(4.0)%
(6.0)%
(8.0)%
(10.0)%
(12.0)%
Category 1 (5 banks)
Category 2 - costs and fine (21 banks)
Category 2 - costs only (11 banks)
Category 2 - nature of provision not disclosed (4 banks)
Category 3 (6 banks)
Participation not disclosed (41 banks)
25th percentile
75th percentile
estimated impact of uS tax program on 2013 Roe
estimated uS tax provisions per uS tax category(Total CHf0.93 billion)
Category 1 27% = CHF0.25 billion
Category 2 57% = CHF0.53 billion
Category 2 8% = CHF0.07 billion
Category 2 1% = CHF0.01 billion
Category 3 1% = CHF0.01 billion
Participation not disclosed 6% = CHF0.05 billion
(1.1)% (8.2)% (2.1)% (4.8)% (0.6)% (0.2)%
(2.0)%
(4.0)%
(6.0)%
(8.0)%
(10.0)%
(12.0)%
Category 1 (5 banks)
Category 2 - costs and fine (21 banks)
Category 2 - costs only (11 banks)
Category 2 - nature of provision not disclosed (4 banks)
Category 3 (6 banks)
Participation not disclosed (41 banks)
25th percentile
75th percentile

c o n tAc t S
Philipp Rickertpartner, Member of the Executive committeehead of Financial Services+41 58 249 42 [email protected] Christian Hintermannpartnerhead transactions & RestructuringFinancial Services+41 58 249 29 [email protected] Alain ChristeManagertransactions & RestructuringFinancial Services+41 58 249 28 [email protected]
Articlesmayonlyberepublishedbywrittenpermissionofthepublisherandquotingthesource“KPMG’sClarityonPerformanceofSwissPrivateBanks”. the information contained herein is of a general nature and is not intended to address the circumstances of any particular individual or entity. Although we endeavor to provide accurate and timely information, there can be no guarantee that such information is accurate as of the date it is received or that it will continue to be accurate in the future. no one should act on such information without appropriate professional advice after a thorough examination of the particular situation. © 2014 KpMG holding AG/SA, a Swiss corporation, is a member of the KpMG network of independent firmsaffiliatedwithKPMGInternationalCooperative(“KPMGInternational”),aSwisslegal entity. All rights reserved. printed in Switzerland. the KpMG name and logo are registered trademarks.
neutralprinted matter
No. 01-14-569853 – www.myclimate.org© myclimate – The Climate Protection Partnership
PERFORMANCE
PublisherKpMG AGBadenerstrasse 172p.o. Boxch-8026 Zurich
phone +41 58 249 31 [email protected]
Concept & editingManuela Zwald, KpMG Financial Servicesouthouse communications, london
visual Concept & designdesignport Gmbh, Zurich
PrintGfK, hergiswil
Pictures[cover] denis linine, Zurich[Editorial] daniel hager, Zurich
estimated uS tax provisions per uS tax category(Total CHf0.93 billion)

kpmg.ch


