University of Bern Social Sciences Working Paper No. 31 Color palettes for Stata graphics Ben Jann April 12, 2018 http://ideas.repec.org/p/bss/wpaper/31.html http://econpapers.repec.org/paper/bsswpaper/31.htm
Faculty of Business, Economics and Social Sciences Department of Social Sciences
University of Bern Department of Social Sciences Fabrikstrasse 8 CH-3012 Bern
Tel. +41 (0)31 631 48 11 Fax +41 (0)31 631 48 17 [email protected] www.sowi.unibe.ch
source: https://doi.org/10.7892/boris.116571 | downloaded: 23.4.2020
Color palettes for Stata graphics
Ben JannUniversity of Bern
Abstract. This paper introduces a command called colorpalette that providesa wide variety of color palettes and color generators for use in Stata graphics. Sup-ported are color palettes from o�cial Stata’s graph schemes, a selection of palettesthat have been proposed by users, standard collections such as the ColorBreweror D3.js palettes, as well as HSV and HCL color generators. As a byproduct, thepaper also introduces commands for marker symbol and line pattern palettes.
Keywords: st0001, palettes, colorpalette, symbolpalette, linepalette, graph,graphics, color, color spaces
1 Introduction
Stata features a set of about 50 named colors that can be used in graphs (see [G] col-orstyle). Given the diverse needs of users, a set of 50 predefined colors is rather limited.Alternative colors are supported, but have to be specified by their RGB, CMYK, orHSV values. To increase the number of easily accessible colors, the new colorpalette
command provides a wide variety of predefined palettes and also features HSV (Hue-Saturation-Value) and HCL (Hue-Chroma-Luminance) color generators. Furthermore,it supports additional input formats for custom colors, such as hex triplets, and allowsgenerating colors over a range if intensity or opacity levels.
A byproduct of colorpalette are two additional commands, symbolpalette andlinepalette, that provide palettes of marker symbols and line pattern. These com-mands are briefly presented in the Appendix.
To install the new commands and view the documentation, type:
. scc install palettes, replace
. help palettes
2 Syntax and basic usage
The colorpalette command has two syntax variants. Syntax 1 is used to retrievecolors from one or multiple palettes. The colors are returned in r() and, by default,displayed in a graph. The syntax is
colorpalette
⇥argument
⇤ ⇥, palette options graph options
⇤
where argument is
1
2 Color palettes for Stata graphics
palette
⇥ ⇥, palette options
⇤/
⇥palette
⇥, palette options
⇤/ ...
⇤ ⇤
and palette is a named palette as described below, or a space-separated list of namedcolors, RGB values, CMYK values, or HSV values according to [G] colorstyle, HCLvalues specified as "hcl h c l", where h specifies the hue (dominant wavelength indegrees of the 360 degree color wheel), c specifies the chroma (colorfulness; c � 0), and l
specifies the luminance (brightness, amount of gray; l 2 [0, 100]), or hex triplets specifiedas #rrggbb, where rr , gg , and bb are the two digit hex codes (or one digit abbreviations)for red, green, and blue. The specified colors can include intensity adjustment and, sinceStata 15, an opacity level specified as "color
⇥*int
⇤⇥%op
⇤" , where int 2 [0, 1) makes the
color lighter, int > 1 makes the color darker, and op is a number between 0 (fullytransparent) and 100 (fully opaque).
Syntax 2 is used to display an overview of multiple palettes in a single graph, withoutreturning the colors in r(). The syntax is
colorpalette
⇥, palette options graph options
⇤: pspec
⇥/ pspec / ...
⇤
where pspec is
palette
⇥, palette options
⇤
or . to insert a gap.
Palette options
n(#) specifies the size of the palette (the number of colors). In many cases this justselects the first # colors from the palette and is thus equivalent to select(1/#).However, some color schemes return colors that adjust to the size of the palette.
select(numlist) selects and orders the colors retrieved from the palette.
reverse returns the palette in reverse order.
intensity(numlist) applies color intensity adjustment. Values between 0 and 1 makethe colors lighter; values larger than one make the colors darker. Specify multiplevalues to use di↵erent adjustments across the selected colors. The list of adjustmentswill be recycled if it is shorter than the list of selected colors. Likewise, colors willbe recycled if the list of adjustments is longer than the palette.
opacity(numlist) sets the opacity level(s) (requires Stata 15). Values must be between0 (fully transparent) and 100 (fully opaque). Specify multiple values to use di↵erentopacity levels across the selected colors. The list of opacity levels will be recycled ifit is shorter than the list of selected colors. Likewise, colors will be recycled if thelist of opacity levels is longer than the palette.
The above options are supported by all palettes, but some palettes also have additionaloptions; see the descriptions of the palettes below.
Ben Jann 3
Common graph options
title(string) specifies a custom title for the graph.
gropts(twoway options) provides options to be passed through to the graph command;see [G] twoway options.
Additional graph options for syntax 1
nograph suppresses the graph.
rows(#) specifies the minimum number of rows in the graph. The default is 5.
Additional graph options for syntax 2
horizontal displays the palettes horizontally. This is the default.
vertical displays the palettes vertically.
plabels(strlist) provides custom labels for the palettes. Enclose labels with spaces indouble quotes.
lcolor(colorstyle) specifies a custom outline color. The default is to use the same coloras for the fill.
lwidth(linewidthstyle) specifies a custom outline thickness. The default is lwidth(vthin).
Stored results
Under syntax 1, colorpalette stores the following in r():
Scalars:r(n) number of colors
Macros:r(ptype) color r(pname) name of palette or customr(pnote) palette note (if available) r(p) space-separated list of colorsr(p#) #th color r(p#info) info on #th color (if available)
2.1 Viewing a palette (syntax 1)
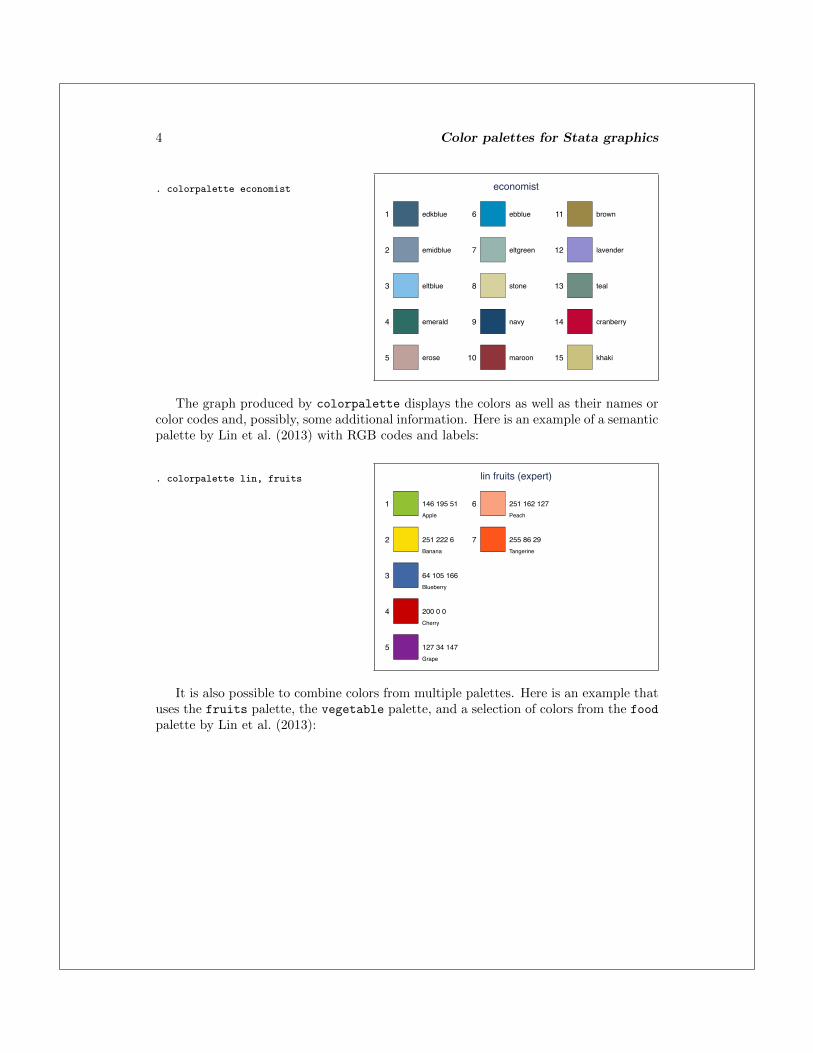
To display a single palette, type colorpalette followed by the name of the palette. Forexample, to view the economist palette, type:
4 Color palettes for Stata graphics
. colorpalette economist
1
2
3
4
5
6
7
8
9
10
11
12
13
14
15
edkblue
emidblue
eltblue
emerald
erose
ebblue
eltgreen
stone
navy
maroon
brown
lavender
teal
cranberry
khaki
economist
The graph produced by colorpalette displays the colors as well as their names orcolor codes and, possibly, some additional information. Here is an example of a semanticpalette by Lin et al. (2013) with RGB codes and labels:
. colorpalette lin, fruits
1
2
3
4
5
6
7
146 195 51
251 222 6
64 105 166
200 0 0
127 34 147
251 162 127
255 86 29
Apple
Banana
Blueberry
Cherry
Grape
Peach
Tangerine
lin fruits (expert)
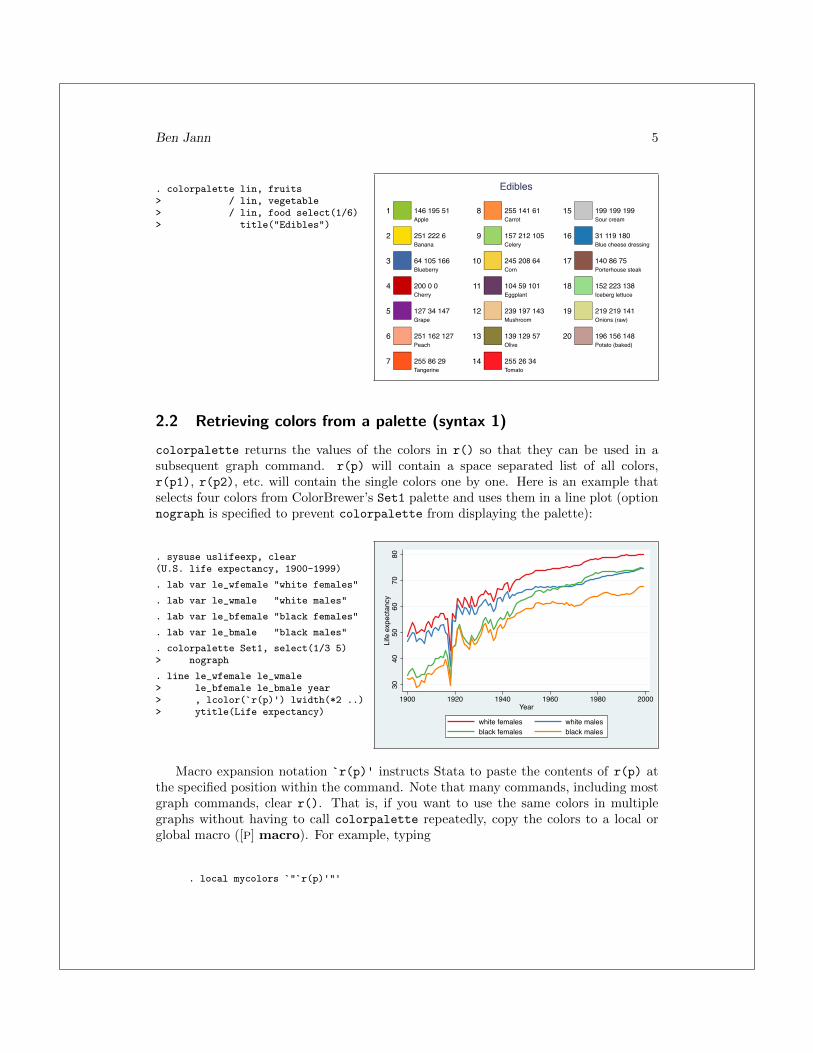
It is also possible to combine colors from multiple palettes. Here is an example thatuses the fruits palette, the vegetable palette, and a selection of colors from the foodpalette by Lin et al. (2013):
Ben Jann 5
. colorpalette lin, fruits> / lin, vegetable> / lin, food select(1/6)> title("Edibles")
1
2
3
4
5
6
7
8
9
10
11
12
13
14
15
16
17
18
19
20
146 195 51
251 222 6
64 105 166
200 0 0
127 34 147
251 162 127
255 86 29
255 141 61
157 212 105
245 208 64
104 59 101
239 197 143
139 129 57
255 26 34
199 199 199
31 119 180
140 86 75
152 223 138
219 219 141
196 156 148
Apple
Banana
Blueberry
Cherry
Grape
Peach
Tangerine
Carrot
Celery
Corn
Eggplant
Mushroom
Olive
Tomato
Sour cream
Blue cheese dressing
Porterhouse steak
Iceberg lettuce
Onions (raw)
Potato (baked)
Edibles
2.2 Retrieving colors from a palette (syntax 1)
colorpalette returns the values of the colors in r() so that they can be used in asubsequent graph command. r(p) will contain a space separated list of all colors,r(p1), r(p2), etc. will contain the single colors one by one. Here is an example thatselects four colors from ColorBrewer’s Set1 palette and uses them in a line plot (optionnograph is specified to prevent colorpalette from displaying the palette):
. sysuse uslifeexp, clear(U.S. life expectancy, 1900-1999)
. lab var le_wfemale "white females"
. lab var le_wmale "white males"
. lab var le_bfemale "black females"
. lab var le_bmale "black males"
. colorpalette Set1, select(1/3 5)> nograph
. line le_wfemale le_wmale> le_bfemale le_bmale year> , lcolor(`r(p)') lwidth(*2 ..)> ytitle(Life expectancy)
3040
5060
7080
Life
exp
ecta
ncy
1900 1920 1940 1960 1980 2000Year
white females white malesblack females black males
Macro expansion notation �r(p)' instructs Stata to paste the contents of r(p) atthe specified position within the command. Note that many commands, including mostgraph commands, clear r(). That is, if you want to use the same colors in multiplegraphs without having to call colorpalette repeatedly, copy the colors to a local orglobal macro ([P] macro). For example, typing
. local mycolors `"`r(p)'"'

6 Color palettes for Stata graphics
would copy the list of colors to local macro mycolor. You could then use the colors insubsequent graph commands by typing �mycolors'.
An alternative is to use the grstyle command to change the default colors used inStata graphs; grstyle calls colorpalette internally (see Jann 2018).
2.3 Viewing multiple palettes (syntax 2)
To display an overview of multiple palettes in a single graph, type colorpalette, acolon, and a list of palettes separated by forward slashes. The following example displayssome of the categorical palettes from ColorBrewer (Brewer 2016; Brewer et al. 2003):
. colorpalette, lcolor(black):> Accent / Dark2 / Set1 / Set3 Accent
Dark2
Set1
Set3
1 2 3 4 5 6 7 8 9 10 11 12
Option lcolor(black) has been specified to draw black lines around the color fields.Separate options can be specified for each palette. Here is an example that displaysseveral default schemes of the HCL color generator. The example also illustrates thee↵ect of the vertical option and the use of n() to determine the number of colors:
. colorpalette, vertical n(40):> hcl, blues / hcl, greens /> hcl, oranges / hcl, purples /> hcl, heat / hcl, plasma
13579
111315171921232527293133353739
hcl blues hcl greens hcl oranges hcl purples hcl heat hcl plasma
Ben Jann 7
2.4 Specifying a custom list of colors
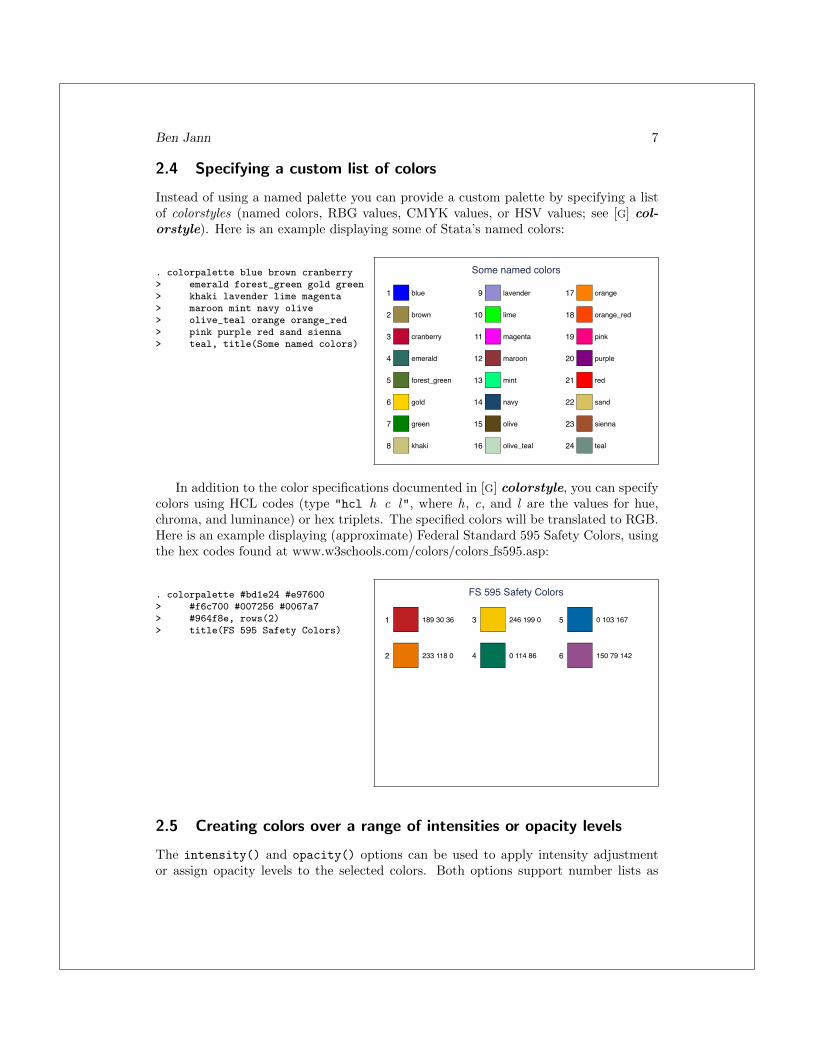
Instead of using a named palette you can provide a custom palette by specifying a listof colorstyles (named colors, RBG values, CMYK values, or HSV values; see [G] col-orstyle). Here is an example displaying some of Stata’s named colors:
. colorpalette blue brown cranberry> emerald forest_green gold green> khaki lavender lime magenta> maroon mint navy olive> olive_teal orange orange_red> pink purple red sand sienna> teal, title(Some named colors)
1
2
3
4
5
6
7
8
9
10
11
12
13
14
15
16
17
18
19
20
21
22
23
24
blue
brown
cranberry
emerald
forest_green
gold
green
khaki
lavender
lime
magenta
maroon
mint
navy
olive
olive_teal
orange
orange_red
pink
purple
red
sand
sienna
teal
Some named colors
In addition to the color specifications documented in [G] colorstyle, you can specifycolors using HCL codes (type "hcl h c l", where h, c, and l are the values for hue,chroma, and luminance) or hex triplets. The specified colors will be translated to RGB.Here is an example displaying (approximate) Federal Standard 595 Safety Colors, usingthe hex codes found at www.w3schools.com/colors/colors fs595.asp:
. colorpalette #bd1e24 #e97600> #f6c700 #007256 #0067a7> #964f8e, rows(2)> title(FS 595 Safety Colors)
1
2
3
4
5
6
189 30 36
233 118 0
246 199 0
0 114 86
0 103 167
150 79 142
FS 595 Safety Colors
2.5 Creating colors over a range of intensities or opacity levels
The intensity() and opacity() options can be used to apply intensity adjustmentor assign opacity levels to the selected colors. Both options support number lists as
8 Color palettes for Stata graphics
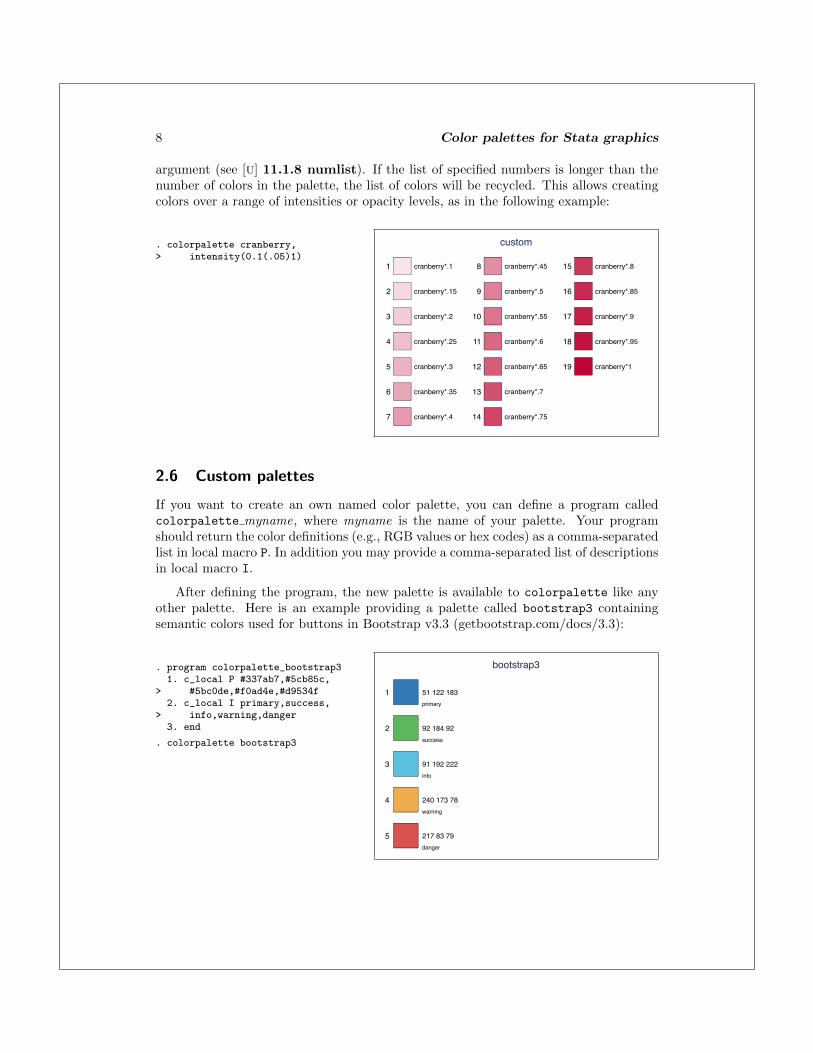
argument (see [U] 11.1.8 numlist). If the list of specified numbers is longer than thenumber of colors in the palette, the list of colors will be recycled. This allows creatingcolors over a range of intensities or opacity levels, as in the following example:
. colorpalette cranberry,> intensity(0.1(.05)1)
1
2
3
4
5
6
7
8
9
10
11
12
13
14
15
16
17
18
19
cranberry*.1
cranberry*.15
cranberry*.2
cranberry*.25
cranberry*.3
cranberry*.35
cranberry*.4
cranberry*.45
cranberry*.5
cranberry*.55
cranberry*.6
cranberry*.65
cranberry*.7
cranberry*.75
cranberry*.8
cranberry*.85
cranberry*.9
cranberry*.95
cranberry*1
custom
2.6 Custom palettes
If you want to create an own named color palette, you can define a program calledcolorpalette myname, where myname is the name of your palette. Your programshould return the color definitions (e.g., RGB values or hex codes) as a comma-separatedlist in local macro P. In addition you may provide a comma-separated list of descriptionsin local macro I.
After defining the program, the new palette is available to colorpalette like anyother palette. Here is an example providing a palette called bootstrap3 containingsemantic colors used for buttons in Bootstrap v3.3 (getbootstrap.com/docs/3.3):
. program colorpalette_bootstrap31. c_local P #337ab7,#5cb85c,
> #5bc0de,#f0ad4e,#d9534f2. c_local I primary,success,
> info,warning,danger3. end
. colorpalette bootstrap3
1
2
3
4
5
51 122 183
92 184 92
91 192 222
240 173 78
217 83 79
primary
success
info
warning
danger
bootstrap3

Ben Jann 9
More complicated definitions of palettes that take account of specific options arealso possible. See the palette definitions in colorpalette.ado for examples.
If you intend to use the new palette in di↵erent analyses, you can store the programin an ado-file instead of including it in each of the do-files. If myname is the name ofyour palette, the program should be stored in file colorpalette myname.ado in theworking directory or somewhere along Stata’s ado path (see [P] sysdir).
3 Predefined color palettes
This section provides an overview of the named palettes implemented in colorpalette.There are three types of palettes: Palettes providing the colors used for plots 1 to 15in o�cial Stata’s graph schemes, palettes providing colors found in user-contributedschemes, and collections containing sets of palettes found in the literature.
3.1 Stata palettes
The Stata palettes are named after the schemes in which the colors are used. Thepalettes are:
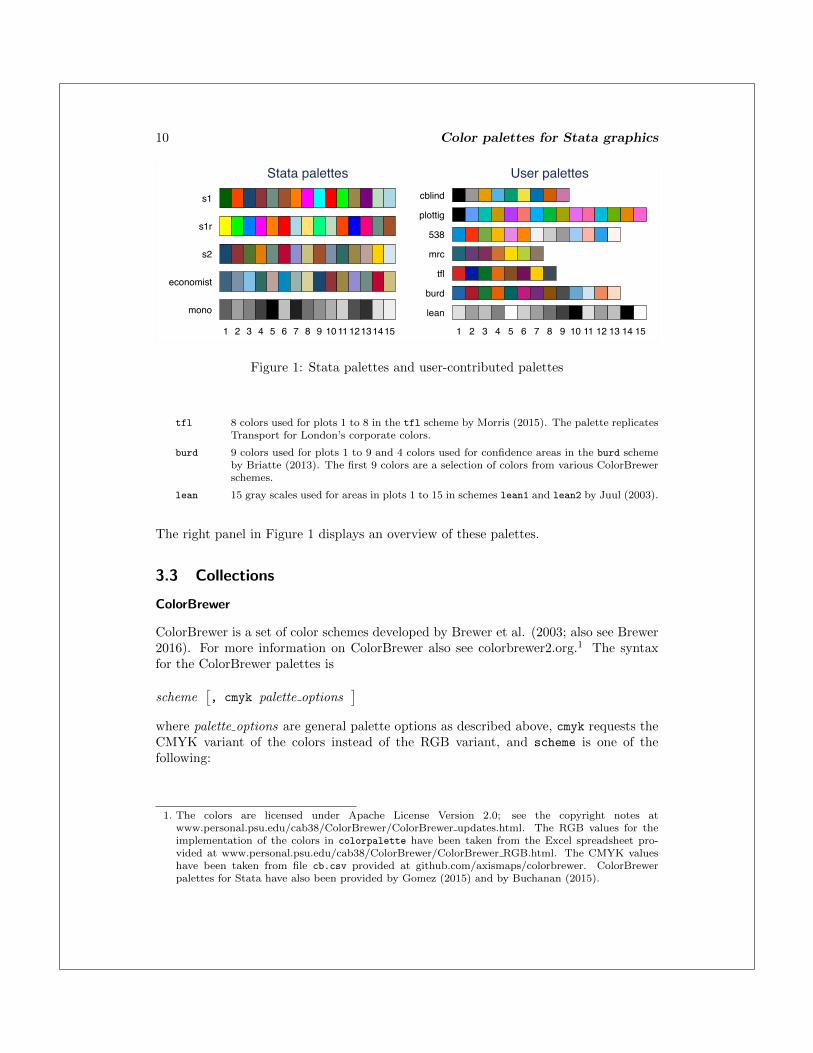
s1 15 colors as in Stata’s s1color schemes1r 15 colors as in Stata’s s1rcolor schemes2 15 colors as in Stata’s s2color scheme (the default palette)economist 15 colors as in Stata’s economist schememono 15 gray scales as in Stata’s monochrome schemes
Palette s2 is the default used by colorpalette if no palette is specified. The left panelin Figure 1 displays an overview of the palettes.
3.2 User-contributed palettes
Stata users have contributed various scheme files in which alternative sets of colors areused, typically available from the Stata Journal site or from the SSC Archive. Thefollowing palettes have been constructed after some of these contributions.
cblind 9 colorblind-friendly colors suggested by Okabe and Ito (2002), including an additionalgray as suggested at www.cookbook-r.com. The same colors are also used (in di↵erentorder and using gs10 for gray) in the plotplainblind and plottigblind schemes byBischof (2017b).
plottig 15 colors used for plots 1 to 15 in the plottig scheme by Bischof (2017b). Most ofthese colors are the same as the colors produced by the hue color generator with defaultoptions (see below), although in di↵erent order.
538 6 colors used for plots 1 to 6 and 7 colors used for background, labels, axes, and confi-dence areas in the 538 scheme by Bischof (2017a). The palette replicates colors used atfivethirtyeight.com.
mrc 7 colors used for plots 1 to 7 in the mrc scheme by Morris (2013). These are colorsaccording to guidelines by the UK Medical Research Council.
10 Color palettes for Stata graphics
s1
s1r
s2
economist
mono
1 2 3 4 5 6 7 8 9 10 11 12131415
Stata palettescblind
plottig
538
mrc
tfl
burd
lean
1 2 3 4 5 6 7 8 9 10 11 12 13 14 15
User palettes
Figure 1: Stata palettes and user-contributed palettes
tfl 8 colors used for plots 1 to 8 in the tfl scheme by Morris (2015). The palette replicatesTransport for London’s corporate colors.
burd 9 colors used for plots 1 to 9 and 4 colors used for confidence areas in the burd schemeby Briatte (2013). The first 9 colors are a selection of colors from various ColorBrewerschemes.
lean 15 gray scales used for areas in plots 1 to 15 in schemes lean1 and lean2 by Juul (2003).
The right panel in Figure 1 displays an overview of these palettes.
3.3 Collections
ColorBrewer
ColorBrewer is a set of color schemes developed by Brewer et al. (2003; also see Brewer2016). For more information on ColorBrewer also see colorbrewer2.org.1 The syntaxfor the ColorBrewer palettes is
scheme
⇥, cmyk palette options
⇤
where palette options are general palette options as described above, cmyk requests theCMYK variant of the colors instead of the RGB variant, and scheme is one of thefollowing:
1. The colors are licensed under Apache License Version 2.0; see the copyright notes atwww.personal.psu.edu/cab38/ColorBrewer/ColorBrewer updates.html. The RGB values for theimplementation of the colors in colorpalette have been taken from the Excel spreadsheet pro-vided at www.personal.psu.edu/cab38/ColorBrewer/ColorBrewer RGB.html. The CMYK valueshave been taken from file cb.csv provided at github.com/axismaps/colorbrewer. ColorBrewerpalettes for Stata have also been provided by Gomez (2015) and by Buchanan (2015).
Ben Jann 11
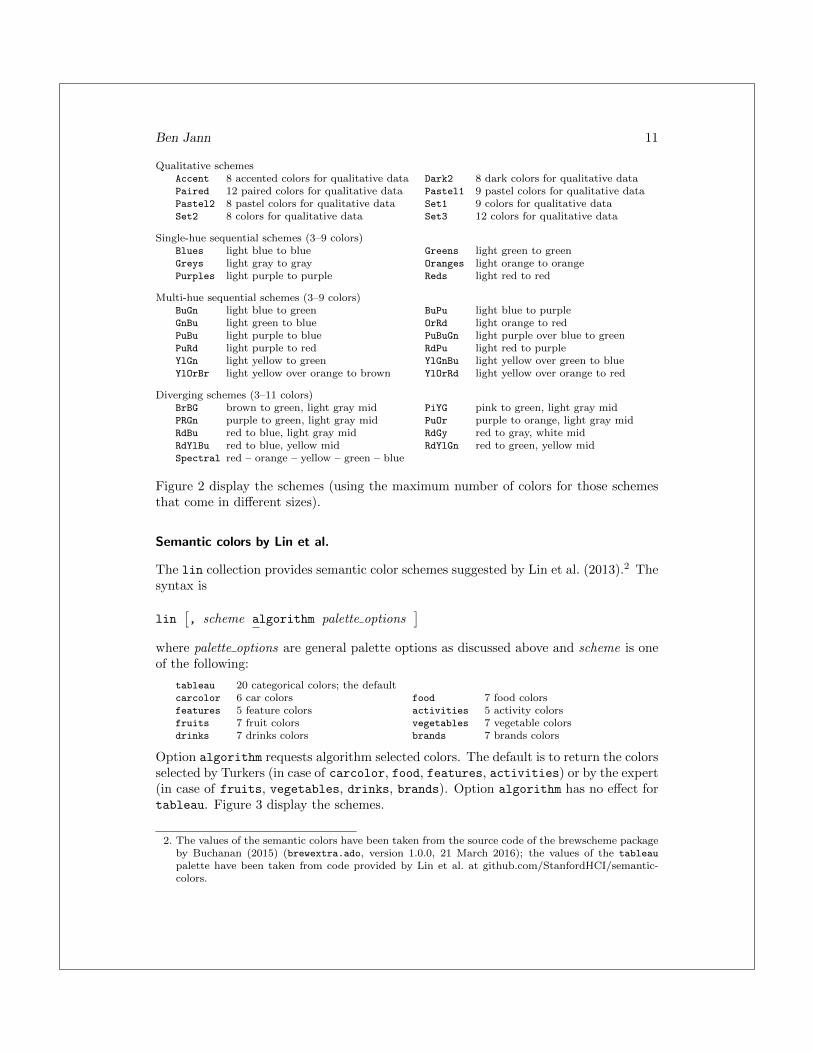
Qualitative schemesAccent 8 accented colors for qualitative data Dark2 8 dark colors for qualitative dataPaired 12 paired colors for qualitative data Pastel1 9 pastel colors for qualitative dataPastel2 8 pastel colors for qualitative data Set1 9 colors for qualitative dataSet2 8 colors for qualitative data Set3 12 colors for qualitative data
Single-hue sequential schemes (3–9 colors)Blues light blue to blue Greens light green to greenGreys light gray to gray Oranges light orange to orangePurples light purple to purple Reds light red to red
Multi-hue sequential schemes (3–9 colors)BuGn light blue to green BuPu light blue to purpleGnBu light green to blue OrRd light orange to redPuBu light purple to blue PuBuGn light purple over blue to greenPuRd light purple to red RdPu light red to purpleYlGn light yellow to green YlGnBu light yellow over green to blueYlOrBr light yellow over orange to brown YlOrRd light yellow over orange to red
Diverging schemes (3–11 colors)BrBG brown to green, light gray mid PiYG pink to green, light gray midPRGn purple to green, light gray mid PuOr purple to orange, light gray midRdBu red to blue, light gray mid RdGy red to gray, white midRdYlBu red to blue, yellow mid RdYlGn red to green, yellow midSpectral red – orange – yellow – green – blue
Figure 2 display the schemes (using the maximum number of colors for those schemesthat come in di↵erent sizes).
Semantic colors by Lin et al.
The lin collection provides semantic color schemes suggested by Lin et al. (2013).2 Thesyntax is
lin
⇥, scheme algorithm palette options
⇤
where palette options are general palette options as discussed above and scheme is oneof the following:
tableau 20 categorical colors; the defaultcarcolor 6 car colors food 7 food colorsfeatures 5 feature colors activities 5 activity colorsfruits 7 fruit colors vegetables 7 vegetable colorsdrinks 7 drinks colors brands 7 brands colors
Option algorithm requests algorithm selected colors. The default is to return the colorsselected by Turkers (in case of carcolor, food, features, activities) or by the expert(in case of fruits, vegetables, drinks, brands). Option algorithm has no e↵ect fortableau. Figure 3 display the schemes.
2. The values of the semantic colors have been taken from the source code of the brewscheme packageby Buchanan (2015) (brewextra.ado, version 1.0.0, 21 March 2016); the values of the tableau
palette have been taken from code provided by Lin et al. at github.com/StanfordHCI/semantic-colors.

12 Color palettes for Stata graphics
AccentDark2Paired
Pastel1Pastel2
Set1Set2Set3
1 2 3 4 5 6 7 8 9 10 11 12
QualitativeBlues
Greens
Greys
Oranges
Purples
Reds
1 2 3 4 5 6 7 8 9
Sequential (single hue)
BrBGPRGnPiYGPuOrRdBuRdGy
RdYlBuRdYlGnSpectral
1 2 3 4 5 6 7 8 9 10 11
DivergingBuGnBuPuGnBuOrRdPuBu
PuBuGnPuRdRdPuYlGn
YlGnBuYlOrBr
YlOrRd1 2 3 4 5 6 7 8 9
Sequential (multi-hue)
Figure 2: ColorBrewer schemes
Red
Silver
Black
Green
Brown
Blue
Turkers Alg.carcolor
Sour creamBlue cheese
dressingPorterhouse
steakIceberglettuceOnions
(raw)Potato
(baked)Tomato
Turkers Alg.food
Speed
Reliability
Comfort
Safety
Efficiency
Turkers Alg.features
Sleeping
Working
Leisure
Eating
Driving
Turkers Alg.activities
Apple
Banana
Blueberry
Cherry
Grape
Peach
Tangerine
Expert Alg.fruits
Carrot
Celery
Corn
Eggplant
Mushroom
Olive
Tomato
Expert Alg.vegetables
A&W RootBeer
Coca-Cola
Dr. Pepper
Pepsi
Sprite
SunkistWelch's
Grape
Expert Alg.drinks
Apple
AT&T
Home Depot
Kodak
Starbucks
Target
Yahoo!
Expert Alg.brands
Figure 3: Semantic color schemes by Lin et al. (2013)
Ben Jann 13
Color schemes by Paul Tol
The ptol collection provides color schemes as suggested by Tol (2012). The syntax is
ptol
⇥, scheme palette options
⇤
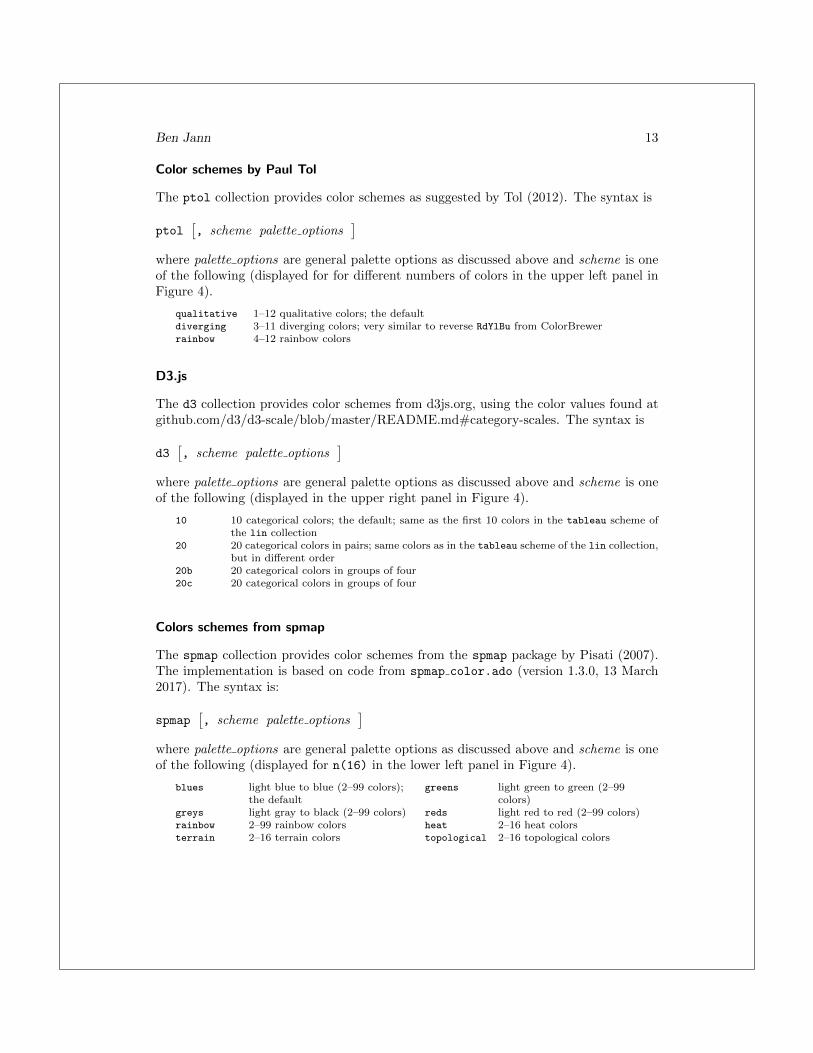
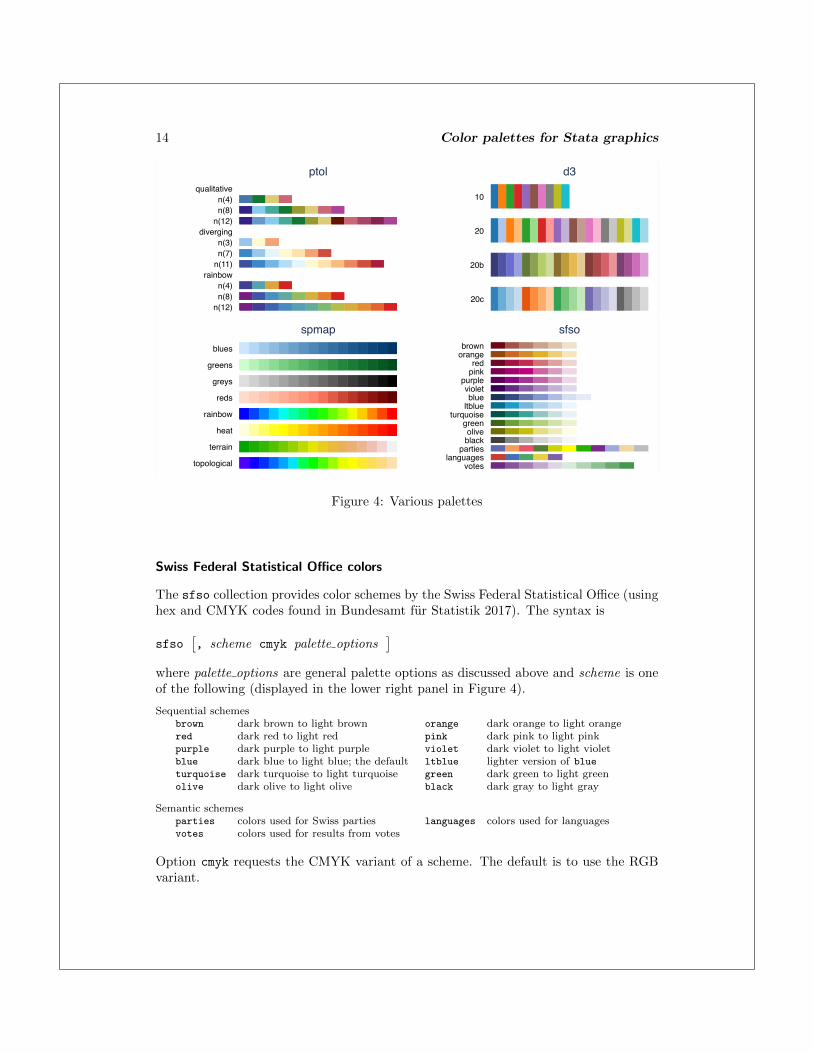
where palette options are general palette options as discussed above and scheme is oneof the following (displayed for for di↵erent numbers of colors in the upper left panel inFigure 4).
qualitative 1–12 qualitative colors; the defaultdiverging 3–11 diverging colors; very similar to reverse RdYlBu from ColorBrewerrainbow 4–12 rainbow colors
D3.js
The d3 collection provides color schemes from d3js.org, using the color values found atgithub.com/d3/d3-scale/blob/master/README.md#category-scales. The syntax is
d3
⇥, scheme palette options
⇤
where palette options are general palette options as discussed above and scheme is oneof the following (displayed in the upper right panel in Figure 4).
10 10 categorical colors; the default; same as the first 10 colors in the tableau scheme ofthe lin collection
20 20 categorical colors in pairs; same colors as in the tableau scheme of the lin collection,but in di↵erent order
20b 20 categorical colors in groups of four20c 20 categorical colors in groups of four
Colors schemes from spmap
The spmap collection provides color schemes from the spmap package by Pisati (2007).The implementation is based on code from spmap color.ado (version 1.3.0, 13 March2017). The syntax is:
spmap
⇥, scheme palette options
⇤
where palette options are general palette options as discussed above and scheme is oneof the following (displayed for n(16) in the lower left panel in Figure 4).
blues light blue to blue (2–99 colors);the default
greens light green to green (2–99colors)
greys light gray to black (2–99 colors) reds light red to red (2–99 colors)rainbow 2–99 rainbow colors heat 2–16 heat colorsterrain 2–16 terrain colors topological 2–16 topological colors
14 Color palettes for Stata graphics
n(4)n(8)n(12)
n(3)n(7)n(11)
n(4)n(8)n(12)
qualitative
diverging
rainbow
ptol
10
20
20b
20c
d3
blues
greens
greys
reds
rainbow
heat
terrain
topological
spmapbrownorange
redpink
purplevioletblueltblue
turquoisegreenoliveblack
partieslanguages
votes
sfso
Figure 4: Various palettes
Swiss Federal Statistical O�ce colors
The sfso collection provides color schemes by the Swiss Federal Statistical O�ce (usinghex and CMYK codes found in Bundesamt fur Statistik 2017). The syntax is
sfso
⇥, scheme cmyk palette options
⇤
where palette options are general palette options as discussed above and scheme is oneof the following (displayed in the lower right panel in Figure 4).
Sequential schemesbrown dark brown to light brown orange dark orange to light orangered dark red to light red pink dark pink to light pinkpurple dark purple to light purple violet dark violet to light violetblue dark blue to light blue; the default ltblue lighter version of blueturquoise dark turquoise to light turquoise green dark green to light greenolive dark olive to light olive black dark gray to light gray
Semantic schemesparties colors used for Swiss parties languages colors used for languagesvotes colors used for results from votes
Option cmyk requests the CMYK variant of a scheme. The default is to use the RGBvariant.
Ben Jann 15
4 Color generators
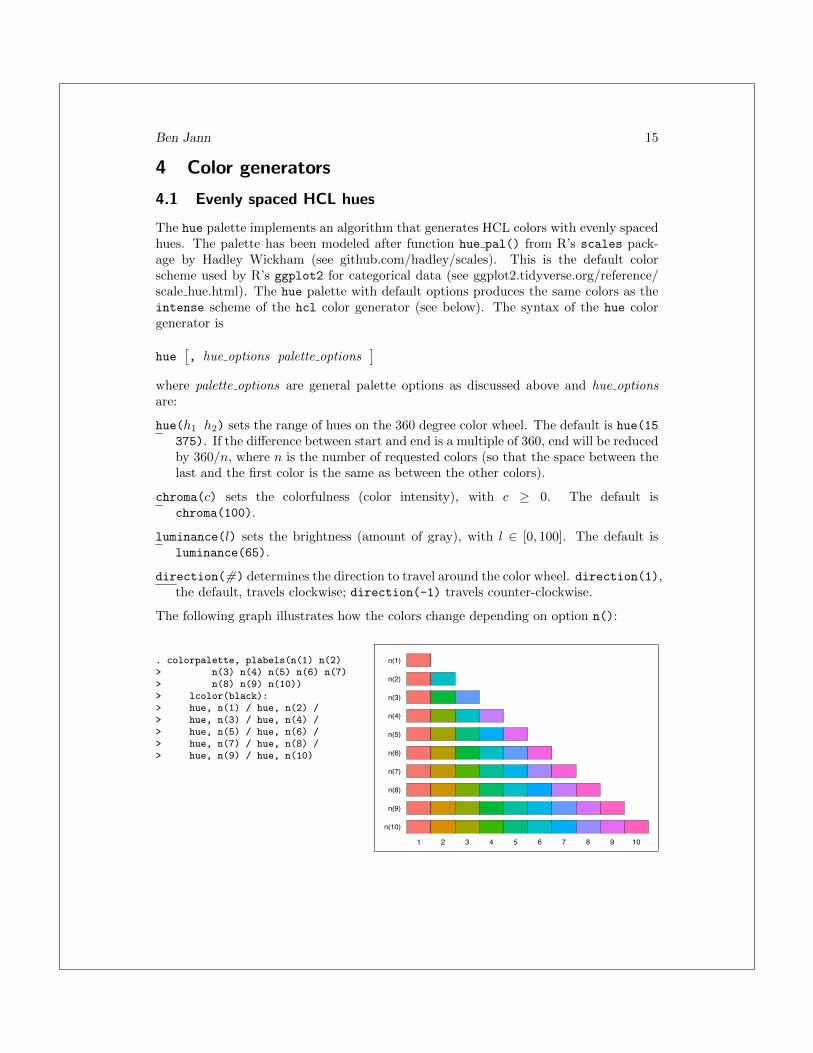
4.1 Evenly spaced HCL hues
The hue palette implements an algorithm that generates HCL colors with evenly spacedhues. The palette has been modeled after function hue pal() from R’s scales pack-age by Hadley Wickham (see github.com/hadley/scales). This is the default colorscheme used by R’s ggplot2 for categorical data (see ggplot2.tidyverse.org/reference/scale hue.html). The hue palette with default options produces the same colors as theintense scheme of the hcl color generator (see below). The syntax of the hue colorgenerator is
hue
⇥, hue options palette options
⇤
where palette options are general palette options as discussed above and hue options
are:
hue(h1 h2) sets the range of hues on the 360 degree color wheel. The default is hue(15375). If the di↵erence between start and end is a multiple of 360, end will be reducedby 360/n, where n is the number of requested colors (so that the space between thelast and the first color is the same as between the other colors).
chroma(c) sets the colorfulness (color intensity), with c � 0. The default ischroma(100).
luminance(l) sets the brightness (amount of gray), with l 2 [0, 100]. The default isluminance(65).
direction(#) determines the direction to travel around the color wheel. direction(1),the default, travels clockwise; direction(-1) travels counter-clockwise.
The following graph illustrates how the colors change depending on option n():
. colorpalette, plabels(n(1) n(2)> n(3) n(4) n(5) n(6) n(7)> n(8) n(9) n(10))> lcolor(black):> hue, n(1) / hue, n(2) /> hue, n(3) / hue, n(4) /> hue, n(5) / hue, n(6) /> hue, n(7) / hue, n(8) /> hue, n(9) / hue, n(10)
n(1)
n(2)
n(3)
n(4)
n(5)
n(6)
n(7)
n(8)
n(9)
n(10)
1 2 3 4 5 6 7 8 9 10

16 Color palettes for Stata graphics
4.2 HCL color generator
The hcl palette is a HCL color generator (Hue-Chroma-Luminance). The implementa-tion is based on R’s colorspace package by Ihaka et al. (2016); also see Zeileis et al.(2009) and hclwizard.org.
Let h1 and h2 be two hues on the 360 degree color wheel, c1 and c2 two chroma levels,l1 and l2 two luminance levels, p1 and p2 two power parameters, and i an index from1 to n, where n is the number of requested colors. The HCL colors are then generatedaccording to the following formulas.
Qualitative schemes:
H = h1 + j(h2 � h1), C = c1, L = l1, j =i� 1
n� 1
Sequential schemes:
H = h2 � j(h2 � h1), C = c2 � jp1(c2 � c1), L = l2 � jp2(l2 � l1), j =n� i
n� 1
Diverging schemes:
H =
(h1 if j > 0
h2 else, C = |j|p1c1, L = l2 � |j|p2(l2 � l1), j =
n� 2j + 1
n� 1
The syntax of the hcl color generator is
hcl
⇥, scheme hcl options palette options
⇤
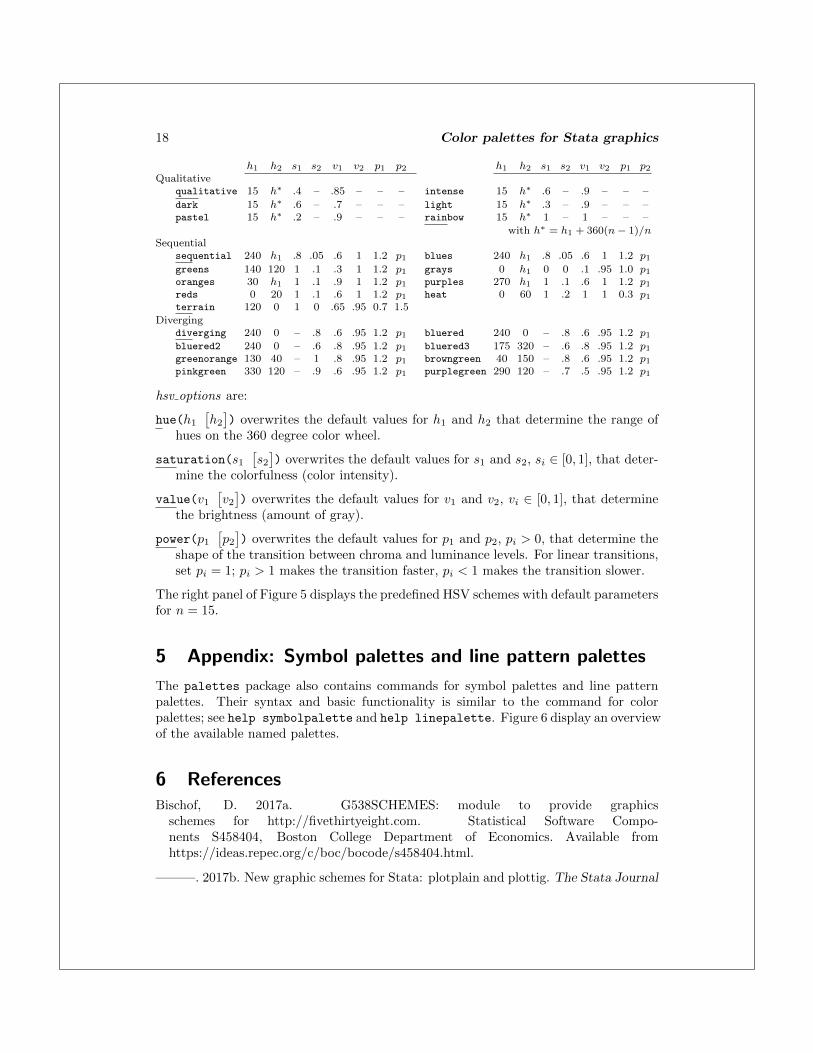
where palette options are general palette options as discussed above and scheme selectsthe type of scheme and the default parameters according to the following overview:
h1 h2 c1 c2 l1 l2 p1 p2 h1 h2 c1 c2 l1 l2 p1 p2Qualitative
qualitative 15 h⇤ 60 – 70 – – – intense 15 h⇤ 100 – 65 – – –dark 15 h⇤ 80 – 60 – – – light 15 h⇤ 50 – 80 – – –pastel 15 h⇤ 35 – 85 – – – with h⇤ = h1 + 360(n� 1)/n
Sequentialsequential 260 h1 80 10 25 95 1 p1 blues 260 h1 80 10 25 95 1 p1greens 145 125 80 10 25 95 1 p1 grays 0 h1 0 0 15 95 1 p1oranges 40 h1 100 10 50 95 1 p1 purples 280 h1 70 10 20 95 1 p1reds 10 20 80 10 25 95 1 p1 heat 0 90 100 30 50 90 .2 1heat2 0 90 80 30 30 90 .2 2 terrain 130 0 80 0 60 95 .1 1terrain2 130 30 65 0 45 90 .5 1.5 viridis 300 75 35 95 15 90 .8 1.2plasma 100 h1 60 100 15 95 2 .9 redblue 0 -100 80 40 40 75 1 1
Divergingdiverging 260 0 80 – 30 95 1 p1 bluered 260 0 80 – 30 95 1 p1bluered2 260 0 100 – 50 95 1 p1 bluered3 180 330 60 – 75 95 1 p1greenorange 130 45 100 – 70 95 1 p1 browngreen 55 160 60 – 35 95 1 p1pinkgreen 340 128 90 – 35 95 1 p1 purplegreen 300 128 60 – 30 95 1 p1
Ben Jann 17
hcl options are:
hue(h1
⇥h2
⇤) overwrites the default values for h1 and h2 that determine the range of
hues on the 360 degree color wheel.
chroma(c1⇥c2⇤) overwrites the default values for c1 and c2, ci � 0, that determine the
colorfulness (color intensity).
luminance(l1⇥l2⇤) overwrites the default values for l1 and l2, li 2 [0, 100], that deter-
mine the brightness (amount of gray).
power(p1⇥p2⇤) overwrites the default values for p1 and p2, pi > 0, that determine the
shape of the transition between chroma and luminance levels. For linear transitions,set pi = 1; pi > 1 makes the transition faster, pi < 1 makes the transition slower.
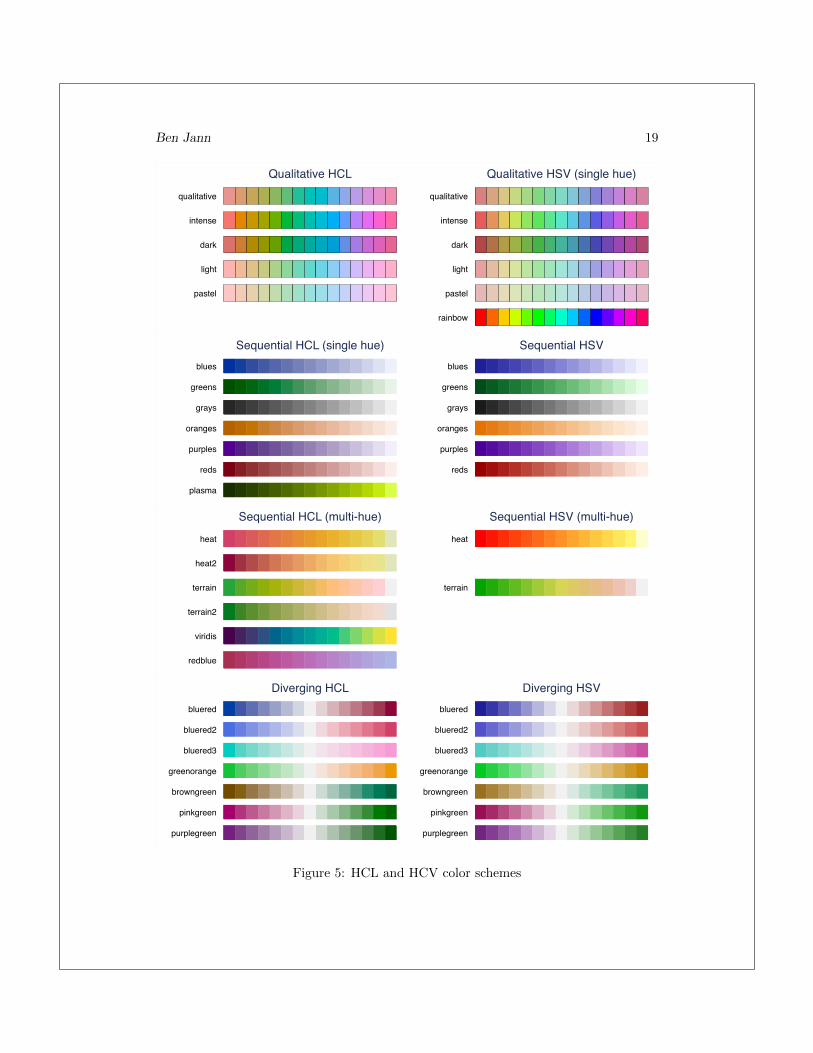
The left panel of Figure 5 displays the predefined HCL schemes with default parametersfor n = 15.
4.3 HSV color generator
The hsv palette is a HSV color generator (Hue-Saturation-Value). The implementationis partially based on R’s grDevices package (which is part of the R core) and partiallyon colorspace by Ihaka et al. (2016).
Let h1 and h2 be two hues on the 360 degree color wheel, s1 and s2 two saturationlevels, v1 and v2 two value levels, p1 and p2 two power parameters, and i an index from1 to n, where n is the number of requested colors. The HSV colors are then generatedaccording to the following formulas.
Qualitative schemes:
H = h1 + j(h2 � h1), S = s1, V = v1, j =i� 1
n� 1
Sequential schemes:
H = h2 � j(h2 � h1), S = s2 � jp1(s2 � s1), V = v2 � jp2(v2 � v1), j =n� i
n� 1
Diverging schemes:
H =
(h1 if j > 0
h2 else, S = |j|p1s1, V = v2 � |j|p2(v2 � v1), j =
n� 2j + 1
n� 1
The syntax of the hsv color generator is
hsv
⇥, scheme hsv options palette options
⇤
where palette options are general palette options as discussed above and scheme selectsthe type of scheme and the default parameters according to the following overview:
18 Color palettes for Stata graphics
h1 h2 s1 s2 v1 v2 p1 p2 h1 h2 s1 s2 v1 v2 p1 p2Qualitative
qualitative 15 h⇤ .4 – .85 – – – intense 15 h⇤ .6 – .9 – – –dark 15 h⇤ .6 – .7 – – – light 15 h⇤ .3 – .9 – – –pastel 15 h⇤ .2 – .9 – – – rainbow 15 h⇤ 1 – 1 – – –
with h⇤ = h1 + 360(n� 1)/nSequential
sequential 240 h1 .8 .05 .6 1 1.2 p1 blues 240 h1 .8 .05 .6 1 1.2 p1greens 140 120 1 .1 .3 1 1.2 p1 grays 0 h1 0 0 .1 .95 1.0 p1oranges 30 h1 1 .1 .9 1 1.2 p1 purples 270 h1 1 .1 .6 1 1.2 p1reds 0 20 1 .1 .6 1 1.2 p1 heat 0 60 1 .2 1 1 0.3 p1terrain 120 0 1 0 .65 .95 0.7 1.5
Divergingdiverging 240 0 – .8 .6 .95 1.2 p1 bluered 240 0 – .8 .6 .95 1.2 p1bluered2 240 0 – .6 .8 .95 1.2 p1 bluered3 175 320 – .6 .8 .95 1.2 p1greenorange 130 40 – 1 .8 .95 1.2 p1 browngreen 40 150 – .8 .6 .95 1.2 p1pinkgreen 330 120 – .9 .6 .95 1.2 p1 purplegreen 290 120 – .7 .5 .95 1.2 p1
hsv options are:
hue(h1
⇥h2
⇤) overwrites the default values for h1 and h2 that determine the range of
hues on the 360 degree color wheel.
saturation(s1⇥s2⇤) overwrites the default values for s1 and s2, si 2 [0, 1], that deter-
mine the colorfulness (color intensity).
value(v1⇥v2⇤) overwrites the default values for v1 and v2, vi 2 [0, 1], that determine
the brightness (amount of gray).
power(p1⇥p2⇤) overwrites the default values for p1 and p2, pi > 0, that determine the
shape of the transition between chroma and luminance levels. For linear transitions,set pi = 1; pi > 1 makes the transition faster, pi < 1 makes the transition slower.
The right panel of Figure 5 displays the predefined HSV schemes with default parametersfor n = 15.
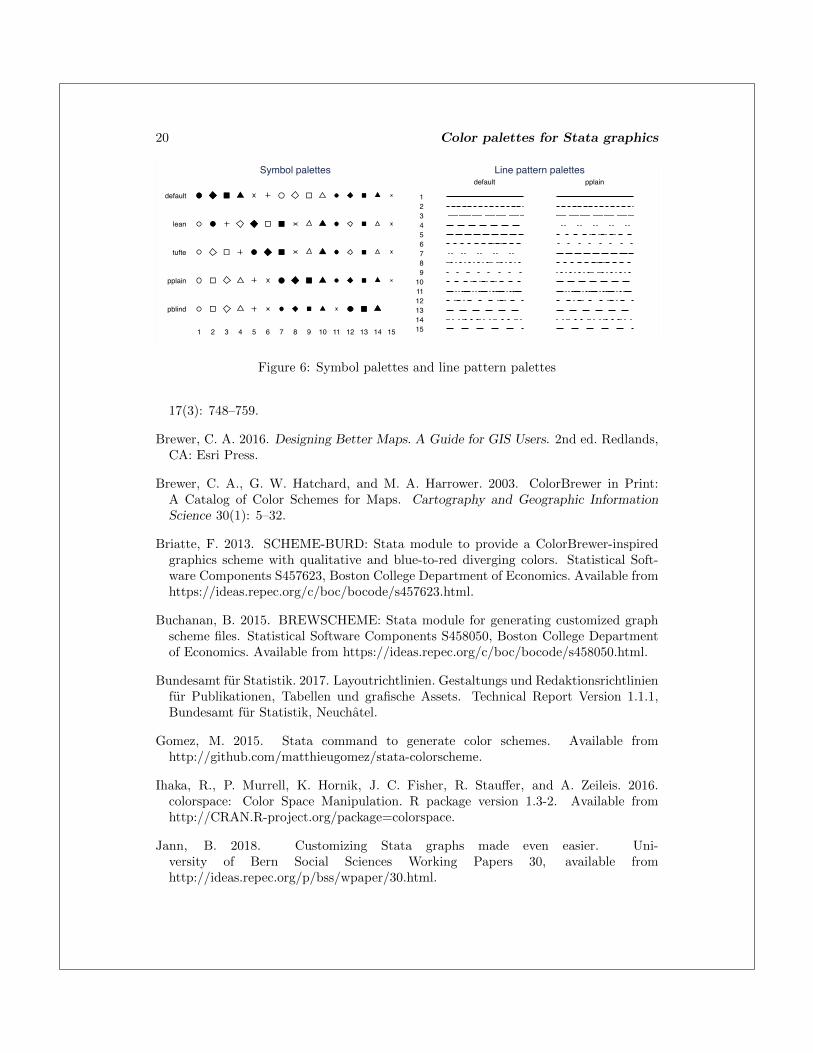
5 Appendix: Symbol palettes and line pattern palettes
The palettes package also contains commands for symbol palettes and line patternpalettes. Their syntax and basic functionality is similar to the command for colorpalettes; see help symbolpalette and help linepalette. Figure 6 display an overviewof the available named palettes.
6 ReferencesBischof, D. 2017a. G538SCHEMES: module to provide graphicsschemes for http://fivethirtyeight.com. Statistical Software Compo-nents S458404, Boston College Department of Economics. Available fromhttps://ideas.repec.org/c/boc/bocode/s458404.html.
———. 2017b. New graphic schemes for Stata: plotplain and plottig. The Stata Journal
Ben Jann 19
qualitative
intense
dark
light
pastel
Qualitative HCL
qualitative
intense
dark
light
pastel
rainbow
Qualitative HSV (single hue)
blues
greens
grays
oranges
purples
reds
plasma
Sequential HCL (single hue)blues
greens
grays
oranges
purples
reds
Sequential HSV
heat
heat2
terrain
terrain2
viridis
redblue
Sequential HCL (multi-hue)
heat
terrain
Sequential HSV (multi-hue)
bluered
bluered2
bluered3
greenorange
browngreen
pinkgreen
purplegreen
Diverging HCLbluered
bluered2
bluered3
greenorange
browngreen
pinkgreen
purplegreen
Diverging HSV
Figure 5: HCL and HCV color schemes
20 Color palettes for Stata graphics
default
lean
tufte
pplain
pblind
1 2 3 4 5 6 7 8 9 10 11 12 13 14 15
Symbol palettes
123456789
101112131415
default pplainLine pattern palettes
Figure 6: Symbol palettes and line pattern palettes
17(3): 748–759.
Brewer, C. A. 2016. Designing Better Maps. A Guide for GIS Users. 2nd ed. Redlands,CA: Esri Press.
Brewer, C. A., G. W. Hatchard, and M. A. Harrower. 2003. ColorBrewer in Print:A Catalog of Color Schemes for Maps. Cartography and Geographic Information
Science 30(1): 5–32.
Briatte, F. 2013. SCHEME-BURD: Stata module to provide a ColorBrewer-inspiredgraphics scheme with qualitative and blue-to-red diverging colors. Statistical Soft-ware Components S457623, Boston College Department of Economics. Available fromhttps://ideas.repec.org/c/boc/bocode/s457623.html.
Buchanan, B. 2015. BREWSCHEME: Stata module for generating customized graphscheme files. Statistical Software Components S458050, Boston College Departmentof Economics. Available from https://ideas.repec.org/c/boc/bocode/s458050.html.
Bundesamt fur Statistik. 2017. Layoutrichtlinien. Gestaltungs und Redaktionsrichtlinienfur Publikationen, Tabellen und grafische Assets. Technical Report Version 1.1.1,Bundesamt fur Statistik, Neuchatel.
Gomez, M. 2015. Stata command to generate color schemes. Available fromhttp://github.com/matthieugomez/stata-colorscheme.
Ihaka, R., P. Murrell, K. Hornik, J. C. Fisher, R. Stau↵er, and A. Zeileis. 2016.colorspace: Color Space Manipulation. R package version 1.3-2. Available fromhttp://CRAN.R-project.org/package=colorspace.
Jann, B. 2018. Customizing Stata graphs made even easier. Uni-versity of Bern Social Sciences Working Papers 30, available fromhttp://ideas.repec.org/p/bss/wpaper/30.html.
Ben Jann 21
Juul, S. 2003. Lean mainstream schemes for Stata 8 graphics. The Stata Journal 3(3):295–301.
Lin, S., J. Fortuna, C. Kulkarni, M. Stone, and J. Heer. 2013. Selecting Semantically-Resonant Colors for Data Visualization. Computer Graphics Forum 32(3pt4): 401–410.
Morris, T. 2013. SCHEME-MRC: Stata module to provide graphicsscheme for UK Medical Research Council. Statistical Software Compo-nents S457703, Boston College Department of Economics. Available fromhttps://ideas.repec.org/c/boc/bocode/s457703.html.
———. 2015. SCHEME-TFL: Stata module to provide graph scheme, based onTransport for London’s corporate colour pallette. Statistical Software Com-ponents S458103, Boston College Department of Economics. Available fromhttps://ideas.repec.org/c/boc/bocode/s458103.html.
Okabe, M., and K. Ito. 2002. Color Universal Design (CUD). How to make figures andpresentations that are friendly to Colorblind people. Available from http://jfly.iam.u-tokyo.ac.jp/color/.
Pisati, M. 2007. SPMAP: Stata module to visualize spatial data. Available fromhttp://ideas.repec.org/c/boc/bocode/s456812.html.
Tol, P. 2012. Colour Schemes. SRON Technical Note, Doc. no. SRON/EPS/TN/09-002.Available from https://personal.sron.nl/˜pault/colourschemes.pdf.
Zeileis, A., K. Hornik, and P. Murrell. 2009. Escaping RGBland: Selecting Colors forStatistical Graphics. Computational Statistics & Data Analysis 53: 3259–3270.
About the author
Ben Jann is Professor of Sociology at the University of Bern, Switzerland. His research interests
include social-science methodology, statistics, social stratification, and labor market sociology.
He is principle investigator of TREE, a large-scale multi-cohort panel study in Switzerland on
transitions from education to employment (www.tree.unibe.ch).


