Amir Lopatin Fellowship
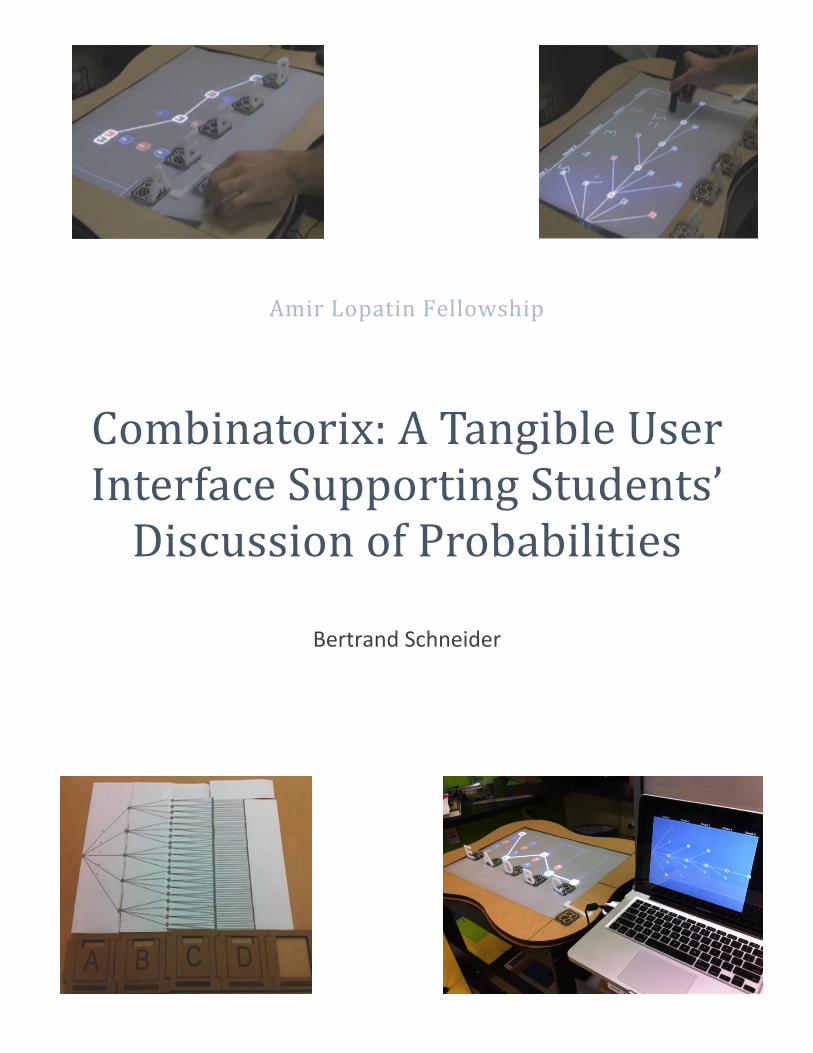
Combinatorix: A Tangible User Interface Supporting Students’ Discussion of Probabilities
Bertrand Schneider

ABSTRACT Combinatorix is a tangible user interface (TUI) that enables small groups of students to collaboratively discover concepts in probability. My system supports students’ exploration of key principles in combinatorics i.e. permutations and combinations that serve as foundations for learning about probability. I describe the participatory design of the system and the design of Combinatorix. I also conducted an experiment that examined the interaction between focused lectures and free exploration. I found that students who first explored the topic on a tangible interface and then watched a lecture significantly outperformed students who watched a lecture first and then completed a hands-‐on activity. I discuss how the “functional fixedness” induced by the video lecture limited students’ learning of probability, and conclude with guidelines for implementing tabletops in classrooms.
INTRODUCTION Mathematical concepts are notoriously difficult to learn; their abstractness and intangible nature make them hard to grasp, even for college-‐level students [9]. Probability, in particular, is a domain filled with counter-‐intuitive notions and seemingly impossible problems. Students usually find it difficult to use their prior knowledge to make sense of probability theories. More often than not, their intuitions lead them in the wrong direction, e.g., the Monthy Hall problem 1 . I am interested in how to create carefully scaffolded learning environments in which students can explore a problem space as they develop their own understanding of a phenomenon. Unfortunately, the vast majority of classrooms use pen and paper exercises, which may impede students in need of a more interactive form of support.
1 http://en.wikipedia.org/wiki/Monty_Hall_problem
Figure 1. Two students using Combinatorix to explore a probability tree.
Prior research in teaching STEM disciplines (Science, Technology, Engineering and Mathematics) suggests that open-‐ended learning environments can support students’ deep learning [10] and thus reduce the development of misconceptions. I am interested in how to help students discover the laws of probability in such environments. I designed a tabletop with a TUI (tangible user interface [11]) to scaffold the collaborative learning process that takes place in today’s classrooms. My first goal is to introduce students to concepts in combinatorics by offering an open-‐ended learning environment where they can activate or create their prior knowledge by manipulating physical objects and discussing hypotheses with their peers. My second goal is more ecological. I acknowledge that testing this kind of system in isolation does not advance current classroom instruction. It is not realistic to assume that students will learn all of probability using an open-‐ended learning environment. It is more likely that this kind of technological platform will be integrated to standard teaching practices. Thus, there is an urgent need to explore the complex interactions between classroom instruction and innovative learning environments before I can make more general claims about their efficiency as a learning tool. This second goal is reflected in my experimental design described in the methods section. I begin by reviewing related research in the use of tangible user interfaces to teach mathematical concepts. I then discuss the participatory design process used to create

Combinatorix, which combines tabletop and physical interaction to teach concepts in probability. I next describe an experiment that examines the appropriate timing for focused lectures and free exploration. I discuss the results and conclude with suggestions for designing tangible interfaces for classroom settings.
RELATED WORK
Misconceptions in Probability Probability is one of the most difficult domains to teach. People usually rely on a small set of heuristics to make predictions about future events and neglect other available sources of information. Tversky and Kahneman [24] describe some of these heuristics and demonstrate how they affect decision-making: as a simple illustration, given that “Steve is a very shy and withdrawn person”, how likely is it that Steve is a farmer, salesman, librarian or physician? Typically, answers include propositions that take personality traits into account and neglect prior probabilities (i.e. how likely is it, for anyone from the general population, to be a librarian or a salesman?). That is, people have trouble thinking in terms of Bayesian probabilities and favor simple heuristics instead. There are many more examples given by Tversky and Kahneman that illustrate the idea that probability is a complex and counter-intuitive domain, and not only for Bayesian probabilities. It should not be surprising that students hold multiple misconceptions about probability theory. In high school, Batanero [3] found that teenagers have trouble understanding and applying combinatorial formulas; common mistakes include double-counting events, confusing the type of events (i.e. undistinguishable versus distinguishable), using non-systematic listing (i.e. solving a problem by trial and errors), and faulty interpretation of a tree diagram (e.g. in particular when students produce an incomplete or incorrect diagram). What is surprising is that even future teachers in mathematics still hold a variety of misconceptions about probabilities [12]. Thus, there is a need for teaching probability theory in a more integrated and more in-depth way at every level.
It should be noted that misconceptions are usually durable and difficult to correct, because they are deeply rooted in exiting cognitive structures. In the last decades, researchers
have tried to document and correct misconceptions in a variety of ways; unfortunately, it does not seem that one method has proven to be the panacea of this issue. Indeed, most instructional methods try to expose students to the “truth” with the hope that it will erase their previous knowledge and replace it with appropriate concepts; numerous studies showed that this approach does not work and that misconceptions are “deep seated and resistant to change” [5]. As a consequence, replacement “directly conflicts with the constructivist premise that learning is the process of adapting prior knowledge” [22]. Smith, diSessa and Roschelle do not provide a unique method to remove all misconceptions from students, but suggest a few ways to correct them in a constructivist fashion. First of all, they propose to leave abstract representations and return to familiar situations when the students hold a misconception; indeed, “novices can exhibit expert like behavior in explaining how a complex but familiar physical system works” and are more likely to revisit their understanding of concept based on everyday objects and experience. Secondly, they emphasize the importance of using constructive discussions (or collaborative learning, in other terms) as a way to reformulate and re-conceptualize students’ ideas; it is crucial to remove confrontation from the debate and validate students pre-conception as an evolving structure that can be refined. In my project, I paid special attention to prompt prior knowledge from students and support discussion with their peers.
Teaching Probability Various attempts at teaching probability in a constructivist fashion have been made. For instance, Abrahamson advocates an “embodied” approach, where students exploit the interaction between their bodies and the physical world to discover mathematical relationships [2]. For instance he designed various ways of physically collecting samples to illustrate concepts in probability (e.g. law of large numbers, normal distributions). One example is the “marble scooper” that he designed and thoroughly tested with different age groups. He also showed how coupling those tangible environments with computer simulations allow students to develop more complex theories about chance [1]. His approach is related to Fast’s [8] attempt at using analogies to demystify concepts in probability. By providing familiar or anchoring situations, Fast’s findings suggest that

analogies can prevent the activation of some misconceptions. In sum, constructivist approaches seem to be a relevant framework for reducing the number of misconceptions hold by students in probability. I was inspired by this previous work and put a special emphasis on hands-on activities. More specifically, I chose to build my system as an interactive tabletop to support students’ exploration of a domain. The next section describes how this kind of learning environment supports constructivist activities in small groups.
Interactive Tabletops in Education Interactive tabletops are currently viewed as an ideal platform for designing constructivist activities. Dillenbourg and Evans [6] mention that “tabletops convey a socio-‐constructivist flavor: they support small teams that solve problems by exploring multiple solutions. The development of tabletop applications also witnesses the growing importance of face-‐to-‐face collaboration in CSCL and acknowledges the physicality of learning.” They describe 33 points that educational designers should take into consideration when developing new systems. They also emphasize that tabletops impact learning on different levels: cognitively (individual learners), socially (small group), at the classroom level, and institutionally. They emphasize that design decisions should be made to have an impact on a specific level. Also, despite their potential for college-‐level education, there is a paucity of interactive tabletops for teaching complex domains. Previous work in designing educational tabletops informed the design of my system. The Tinker Table [13] is an interactive tabletop where students in logistic can build small-scale warehouses. The educational researchers who designed the system found that a tangible version of the system benefited students’ learning compared to the same system implemented on a touch table [18]. Their work highlighted the importance of shaping technology to support teachers, demonstrating the crucial role of communication between researchers and teachers in creating useful and relevant educational technologies [26]. Piper and Hollan [17] conducted a study with undergraduate students, comparing the affordance of tabletop displays and paper handouts for studying college-
level neuro-anatomy. Their study indicated that the tabletop interface provided benefits for learning, for example by encouraging users to repeat an activity prior to consulting the solutions. Valdes et al. developed and evaluated GreenTouch [25], a collaborative environment for engaging novice students in phylogeny research, which consists of a mobile application for data collection and a tabletop interface for exploratory analysis. While their findings illustrate that tabletop interactions support high-level reasoning and hypothesis testing, they did not measure learning gains directly. Finally, Shaer et al. [21] evaluated G-nome Surfer, a tabletop interface for collaborative exploration of genomic information and deployed it in a college-level neuroscience course. Their work highlights how students collaborate around a tabletop to conduct an open-ended inquiry that involves large amount of heterogeneous information. Those previous attempts at implementing tabletop environments in the classroom show promises in terms of supporting collaborative exploration of a complex domain. I was inspired by this line of work and decided to create a similar learning environment for supporting students’ discovery of combinatorics and probability.
Design process Due to the difficulty of teaching probability theory, my first goal was to support students’ exploration and discussion of concepts in combinatorics. I followed a user-‐centered design (UCD) approach to gather insights about students’ difficulties. More specifically, I observed students during several TA (Teaching Assistant) office hours, interviewed undergraduates in computer science and conducted participatory design sessions to guide my design process. All interviewees were taking a probability class at the time of the interview.
Interviews and Participatory Design Sessions I conducted 10 one-‐hour long semi-‐structured interviews with students currently enrolled in a probability class. I asked them to participate to a research project after they were leaving the TA’s office hours; I covered the following dimensions when conducting the interview:
• Facts: “Why did you come to the TA today? What was hard about this problem set? How did he help you? Do you feel like you have understood the solution? Did he use any kind of drawing?”
• Artifacts: “Can you show me the notebook that you are using for this class? Could you show me the drawings that you have created for solving those problems?”
• Critical incident: “What was your most memorable insight for the first problem set? How did you reach it?”
• User in action: “Could you solve this problem for me? I’m interested in your thought process, not the answer; Think of me as someone who has never done any probability problem”
• Generalization: “Do you usually draw things when you solve a problem? Or does everything happen in your head? What process do you usually follow when trying to solve a challenging problem?”
• Opinion: “What do you think is the most challenging component of this class?”
• Design: “How would you make those problems easier to solve (but keep the same learning benefits)? What kind of tools would be useful?”
Based on students’ answers, I found that they had three main sources of misunderstanding or complain: 1. The uni-‐modality of the instruction: most of the
classroom instruction was done in a traditional way (e.g. PowerPoint lectures, individual pen and paper assignments), which involved mostly static diagrams.
2. A premature jump to abstract representations: a significant amount of students expressed that they were not fully comfortable with mathematical notations, and that the constant flow of formulas was an important barrier to conceptual understanding.
3. Stereotype threat [23]: following point 2, students reported feelings of anxiety and cognitive overload when facing some heavy mathematical formulas.
4. A lack of training in creating their own representations: students reported that they tried to create drawings to help them reason about a problem, but that they were most of the time unsuccessful at reaching an insight this way. TAs, on the other hand, were most helpful when drawing visual explanations on the white board.
5. A feeling of disorientation when facing a new problem: students felt like they did not know where to start when facing a problem, and often resolved to ask the teaching assistants to provide some kind of scaffolding to them.
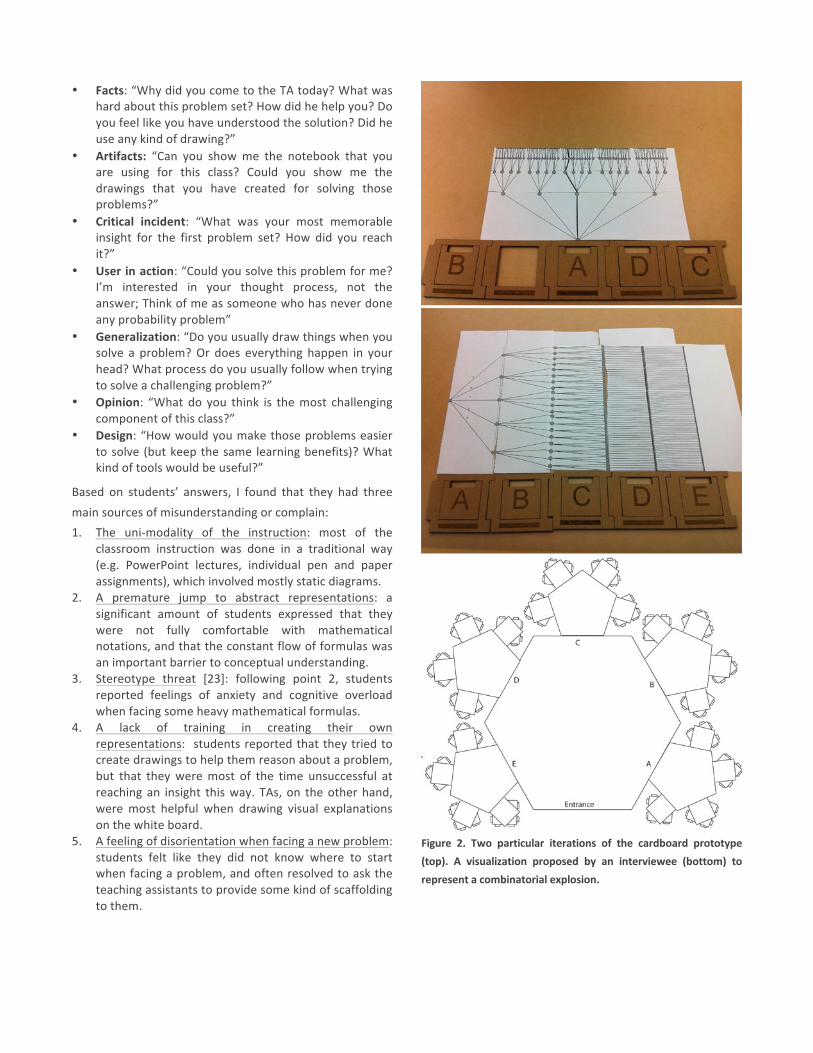
Figure 2. Two particular iterations of the cardboard prototype (top). A visualization proposed by an interviewee (bottom) to represent a combinatorial explosion.

Based on those insights, I designed several cardboard prototypes. I tested various iterations of those design with students from this class. The next section describes my design process.
Cardboard Prototypes and Wizard of Oz Techniques Following my interviews, I explored several designs by creating a series of cardboard mockups (e.g. Fig. 2). In one of those prototypes, I provided 5 cardboard placeholders and 5 letters to users. As participants manipulated the material, a researcher arranged paper visualizations around the different combinations. For instance, in Fig. 2 (top) I can see that the user created the sequence “BADC” with an empty placeholder between “B” and “A”. A probability tree complemented this series by highlighting the path chosen by the user. Branching illustrated the combinatorial explosion that follows a large combination of items. Having users interact with early prototypes allowed me to make quick adjustments to my design: for instance, participants quickly noticed that the horizontal layout of the tree made more sense (Fig. 2, middle), since each column corresponded to adding a new letter to the sequence (thus, adding a new branching from each tip of the tree). Additionally, users proposed ingenious alternatives to a tree visualization: one participant suggested to use a spatial metaphor, where one large room represented the starting point of the combination, and each subsequent door a choice for a particular position. Crossing doors leads to sequentially fill the placeholders (Fig. 2, bottom). I found that testing my prototypes early and using participatory design sessions allowed me to quickly generate multiple solutions to my design problem. This
methodology helped me avoid heavy redesigns of my interface when implementing it as a tangible interface.
Final Design My final design is implemented as a tangible user interface [11], where a camera and a projector are positioned under the table. Tangibles are tagged with fiducials, and the camera detects their location using the Reactivision framework [14]. A projector displays additional visualizations around the tangibles to scaffold the learning process. More specifically, three kinds of augmentations are projected: 1) A welcome screen, where users are provided with a challenge to solve (Fig.3, left). The challenge is accompanied with multiple answers and a hint. 2) A probability tree, which adds and removes branches based on users’ actions (Fig 3., middle). The tree displays the number of possible combinations as well as the results of various constraints (e.g. how many combinations can you form, if letters “A” and “B” have to be next to each other?). 3) A Venn diagram, illustrating symmetrical relationships (Fig. 3, right). The diagram displays all possible combinations and separates them based on specific arrangements (e.g. how many combinations are possible if the letter “A” has to be before the letter “B”?). The answer is 5! / 2, since “A” will precede “B” in half the combinations, and “B” will precede “A” in the remaining 5! / 2 combinations. Users can switch between representations by turning a cube on the table. Each face of the cube represents a different screen; e.g. a question mark, a tree or a Venn diagram. The cube can been seen on each image of Fig. 3 (on the left, the user is rotating it to select an answer; on
Figure 3: The Combinatorix system. On the left, the welcome screen display challenges to students. In the middle, the probability tree augmenting users’ combinations. On the right, a venn diagram illustrating relationship of symmetry.
the middle and right picture, it is laying on the table in front of the letters). In its current state, my system supports students’ exploration of combinatorics. However it does not teach, per se, concepts in probability. I acknowledge the fact that probability theory is an extremely difficult domain to teach, and I do not make any claims about the efficiency of my system as a learning tool in this paper. However I do believe that Combinatorix supports students’ exploration of this problem space and knowledge negotiation in small collaborative learning groups [18]. Previous studies showed that collaboration [21] and conceptual reflections [19] are a central component of educational TUIs. I built on those previous results to test my system. More specifically, I am interested in unpacking the complementarity of standard classroom instructions and hands-‐on activities on TUIs. I contrast two educational positions in my user study [20]. The first one, a “tell-‐and-‐practice” approach, advocates direct instructions followed by practice exercises. The idea is expose students to the “truth”, and then reinforce this first exposition with drilling exercises. The second approach (labeled “inventing”) suggests to provide carefully designed activities to activate prior knowledge in students, which can be then confronted with experts’ explanation of a domain. The idea here is to have students formulate their own theory of a phenomenon, and then have them realize the many subtleties that differentiate their basic understanding of a concept with expert theories. The first approach is widely used in classrooms, while many researchers in the learning sciences advocate the second one (see the “Preparing for Future Learning” framework [4]).
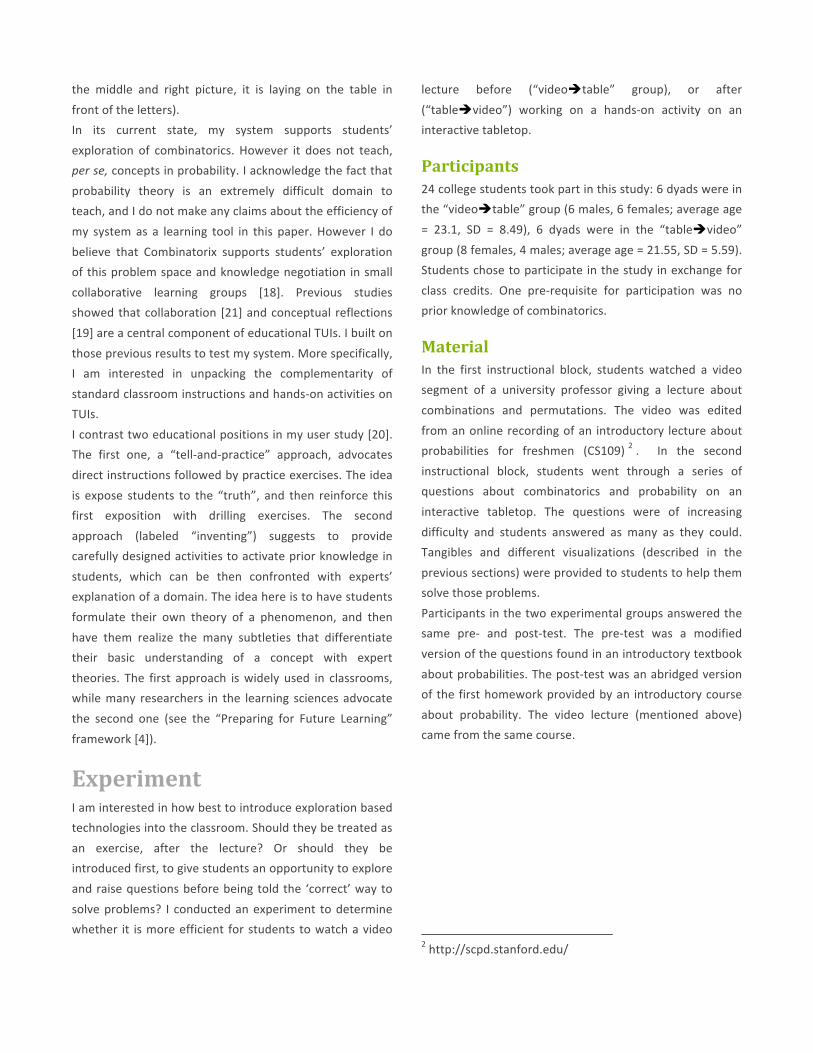
Experiment I am interested in how best to introduce exploration based technologies into the classroom. Should they be treated as an exercise, after the lecture? Or should they be introduced first, to give students an opportunity to explore and raise questions before being told the ‘correct’ way to solve problems? I conducted an experiment to determine whether it is more efficient for students to watch a video
lecture before (“videoètable” group), or after (“tableèvideo”) working on a hands-‐on activity on an interactive tabletop.
Participants 24 college students took part in this study: 6 dyads were in the “videoètable” group (6 males, 6 females; average age = 23.1, SD = 8.49), 6 dyads were in the “tableèvideo” group (8 females, 4 males; average age = 21.55, SD = 5.59). Students chose to participate in the study in exchange for class credits. One pre-‐requisite for participation was no prior knowledge of combinatorics.
Material In the first instructional block, students watched a video segment of a university professor giving a lecture about combinations and permutations. The video was edited from an online recording of an introductory lecture about probabilities for freshmen (CS109) 2 . In the second instructional block, students went through a series of questions about combinatorics and probability on an interactive tabletop. The questions were of increasing difficulty and students answered as many as they could. Tangibles and different visualizations (described in the previous sections) were provided to students to help them solve those problems. Participants in the two experimental groups answered the same pre-‐ and post-‐test. The pre-‐test was a modified version of the questions found in an introductory textbook about probabilities. The post-‐test was an abridged version of the first homework provided by an introductory course about probability. The video lecture (mentioned above) came from the same course.
2 http://scpd.stanford.edu/
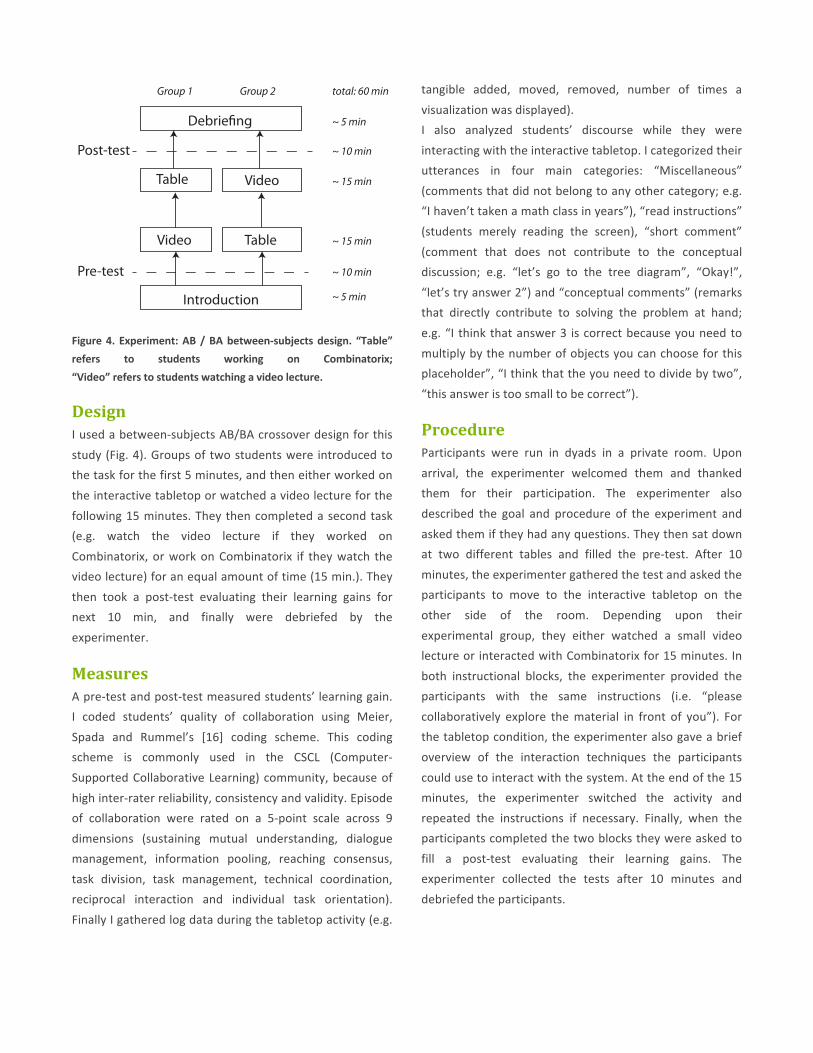
Figure 4. Experiment: AB / BA between-‐subjects design. “Table” refers to students working on Combinatorix; “Video” refers to students watching a video lecture.
Design I used a between-‐subjects AB/BA crossover design for this study (Fig. 4). Groups of two students were introduced to the task for the first 5 minutes, and then either worked on the interactive tabletop or watched a video lecture for the following 15 minutes. They then completed a second task (e.g. watch the video lecture if they worked on Combinatorix, or work on Combinatorix if they watch the video lecture) for an equal amount of time (15 min.). They then took a post-‐test evaluating their learning gains for next 10 min, and finally were debriefed by the experimenter.
Measures A pre-‐test and post-‐test measured students’ learning gain. I coded students’ quality of collaboration using Meier, Spada and Rummel’s [16] coding scheme. This coding scheme is commonly used in the CSCL (Computer-‐Supported Collaborative Learning) community, because of high inter-‐rater reliability, consistency and validity. Episode of collaboration were rated on a 5-‐point scale across 9 dimensions (sustaining mutual understanding, dialogue management, information pooling, reaching consensus, task division, task management, technical coordination, reciprocal interaction and individual task orientation). Finally I gathered log data during the tabletop activity (e.g.
tangible added, moved, removed, number of times a visualization was displayed). I also analyzed students’ discourse while they were interacting with the interactive tabletop. I categorized their utterances in four main categories: “Miscellaneous” (comments that did not belong to any other category; e.g. “I haven’t taken a math class in years”), “read instructions” (students merely reading the screen), “short comment” (comment that does not contribute to the conceptual discussion; e.g. “let’s go to the tree diagram”, “Okay!”, “let’s try answer 2”) and “conceptual comments” (remarks that directly contribute to solving the problem at hand; e.g. “I think that answer 3 is correct because you need to multiply by the number of objects you can choose for this placeholder”, “I think that the you need to divide by two”, “this answer is too small to be correct”).
Procedure Participants were run in dyads in a private room. Upon arrival, the experimenter welcomed them and thanked them for their participation. The experimenter also described the goal and procedure of the experiment and asked them if they had any questions. They then sat down at two different tables and filled the pre-‐test. After 10 minutes, the experimenter gathered the test and asked the participants to move to the interactive tabletop on the other side of the room. Depending upon their experimental group, they either watched a small video lecture or interacted with Combinatorix for 15 minutes. In both instructional blocks, the experimenter provided the participants with the same instructions (i.e. “please collaboratively explore the material in front of you”). For the tabletop condition, the experimenter also gave a brief overview of the interaction techniques the participants could use to interact with the system. At the end of the 15 minutes, the experimenter switched the activity and repeated the instructions if necessary. Finally, when the participants completed the two blocks they were asked to fill a post-‐test evaluating their learning gains. The experimenter collected the tests after 10 minutes and debriefed the participants.
Introduction
Pre-test
Post-test
Video Table
VideoTable
Debrie!ng
~ 5 min
~ 10 min
~ 10 min
~ 15 min
~ 15 min
total: 60 min
~ 5 min
Group 1 Group 2
Hypotheses My hypotheses are based on the PFL framework [4]: I expect students following a “tell-‐and-‐practice” kind of instruction (group 1 in Fig. 2) to have lower learning gains compared to students who first built their own hypotheses of a concept (group 2 in Fig. 2). The first group reflects a standard classroom instruction as well as a flipped classroom practice. The second group reflects a more constructivist approach.
Results
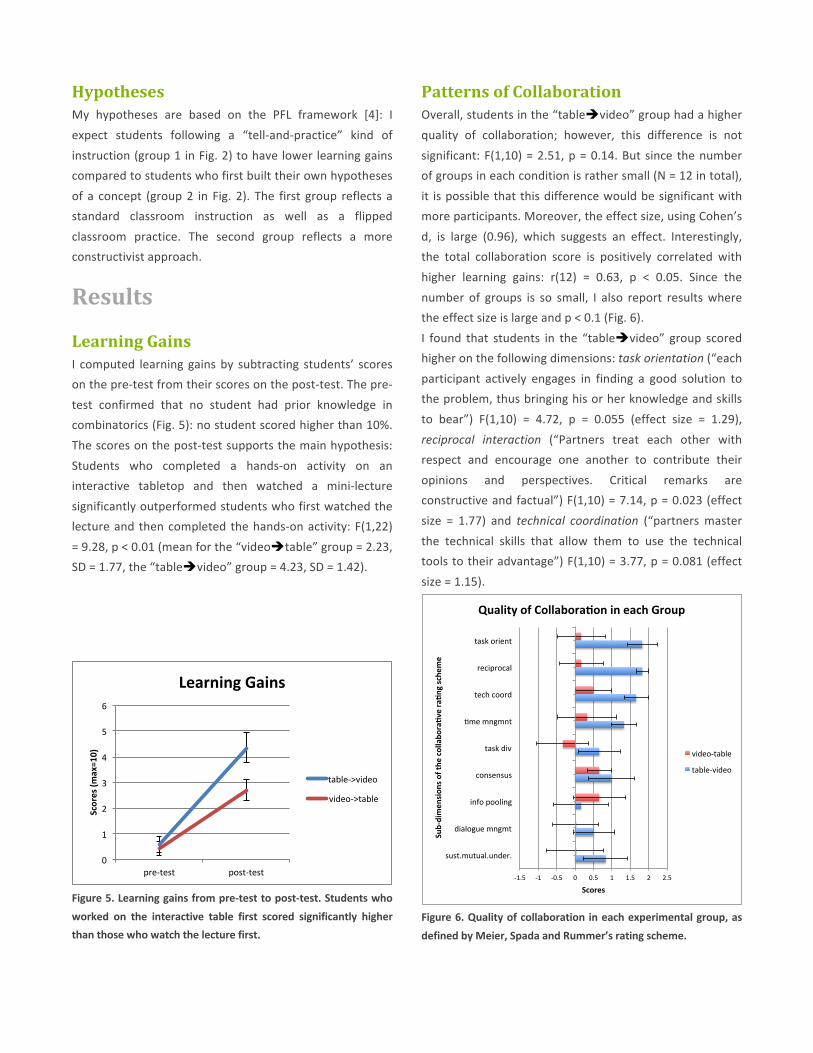
Learning Gains I computed learning gains by subtracting students’ scores on the pre-‐test from their scores on the post-‐test. The pre-‐test confirmed that no student had prior knowledge in combinatorics (Fig. 5): no student scored higher than 10%. The scores on the post-‐test supports the main hypothesis: Students who completed a hands-‐on activity on an interactive tabletop and then watched a mini-‐lecture significantly outperformed students who first watched the lecture and then completed the hands-‐on activity: F(1,22) = 9.28, p < 0.01 (mean for the “videoètable” group = 2.23, SD = 1.77, the “tableèvideo” group = 4.23, SD = 1.42).
Figure 5. Learning gains from pre-‐test to post-‐test. Students who worked on the interactive table first scored significantly higher than those who watch the lecture first.
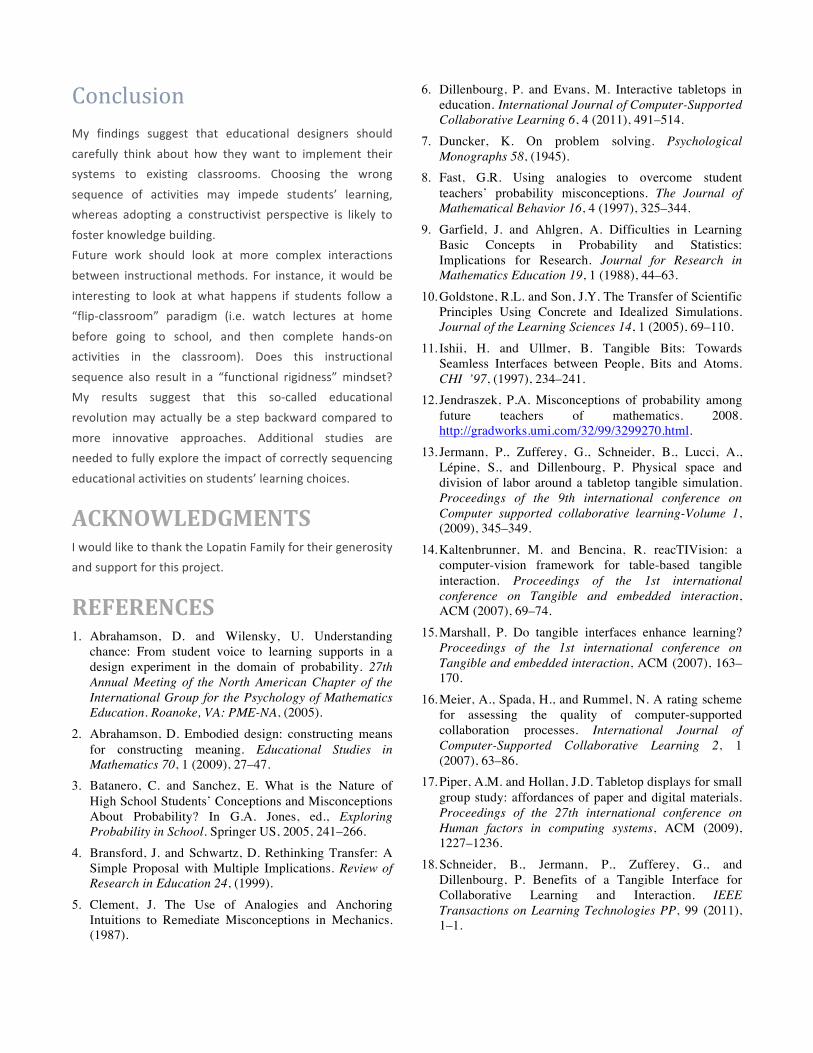
Patterns of Collaboration Overall, students in the “tableèvideo” group had a higher quality of collaboration; however, this difference is not significant: F(1,10) = 2.51, p = 0.14. But since the number of groups in each condition is rather small (N = 12 in total), it is possible that this difference would be significant with more participants. Moreover, the effect size, using Cohen’s d, is large (0.96), which suggests an effect. Interestingly, the total collaboration score is positively correlated with higher learning gains: r(12) = 0.63, p < 0.05. Since the number of groups is so small, I also report results where the effect size is large and p < 0.1 (Fig. 6). I found that students in the “tableèvideo” group scored higher on the following dimensions: task orientation (“each participant actively engages in finding a good solution to the problem, thus bringing his or her knowledge and skills to bear”) F(1,10) = 4.72, p = 0.055 (effect size = 1.29), reciprocal interaction (“Partners treat each other with respect and encourage one another to contribute their opinions and perspectives. Critical remarks are constructive and factual”) F(1,10) = 7.14, p = 0.023 (effect size = 1.77) and technical coordination (“partners master the technical skills that allow them to use the technical tools to their advantage”) F(1,10) = 3.77, p = 0.081 (effect size = 1.15).
Figure 6. Quality of collaboration in each experimental group, as defined by Meier, Spada and Rummer’s rating scheme.
0"
1"
2"
3"
4"
5"
6"
pre,test" post,test"
Scores'(m
ax=10)'
Learning'Gains'
table,>video"
video,>table"
!1.5% !1% !0.5% 0% 0.5% 1% 1.5% 2% 2.5%
sust.mutual.under.%
dialogue%mngmt%
info%pooling%
consensus%
task%div%
:me%mngmnt%
tech%coord%
reciprocal%
task%orient%
Scores'
Sub*dimen
sion
s'of'the
'collabo
ra4v
e'ra4n
g'sche
me'
Quality'of'Collabora4on'in'each'Group'
video!table%
table!video%

Figure 7. Number of actions performed by each group on Combinatorix (right) and number of times each group accessed a particular visualization (left).
Students’ Exploration I also looked at the number of actions performed by each group: the number of tangibles added and removed in each placeholder on the bottom of the screen (Fig. 7 – right side), as well as the number of times they accessed a particular visualization. Unfortunately, I did not have access to the amount of time spent on each screen. Overall, the log files suggest that participants in the “tableèvideo” tried more combinations of tangibles than participants in the “videoètable” condition. However those differences are not significant. Interestingly (Fig 7 – left side), participants in the “tableèvideo” group also accessed the “Venn diagram” visualization more often: F(1,10) = 17.07, p < 0.01. This difference was also significant for the number of times the first screen (i.e. displaying the small challenges) was displayed: F(1,10) = 6.00, p < 0.05. Interestingly, the number of times students displayed the third screen (i.e. the Venn diagram) was positively correlated with higher learning gains: r(12) = 0.63, p < 0.05.
Discourse Analysis The results of the discourse analysis confirm the trend found in the previous section. Students who used the table first (“tableèvideo” group) produced more utterances in general. In particular, they generated more conceptual discussion (Fig. 8).
Figure 8. Discourse analysis of the utterances produced by the students while working on Combinatorix.
I found a significant difference for the number of short comments F(1,22) = 7.44, p < 0.05 and the number of conceptual comments F(1,22) = 7.15, p < 0.05. Students who watched a lecture before working on the interactive tabletop produced fewer comments in general, both in a conceptual and a non-‐conceptual level. Conceptual discussion was strongly correlated with a positive learning gain: r(24) = 0.7, p < 0.001. While coding the videos, I also categorized on which screen students produced conceptual comments. Results are summarized on Fig. 9. The only significant difference is on screen two: students in the “tableèvideo” group had more conceptual discussion when looking at the tree diagram: F(1,22) = 18.83, p < 0.001. This measure was also correlated with a positive learning gain: r(24) = 0.64, p < 0.05.
Figure 9. Number of conceptual comments produced by each student on each screen (1 = questions, 2 = tree diagram, 3 = Venn diagram)
0"
1"
2"
3"
4"
5"
6"
7"
8"
Display"Screen"1"(ques:on)"
Display"Screen"2"(tree)"
Display"Screen"3"(venn)"
Raw$Cou
nts$
0"
5"
10"
15"
20"
25"
30"
35"
Tangible"Added"
Tangible"Removed"
Raw$Cou
nts$
table6video"
video6table"
0"
2"
4"
6"
8"
10"
12"
14"
16"
18"
20"
Misc" Read"Instruc5ons"
Short"Comment"
Conceptual"Comment"
Average'nu
mbe
r'of'u
.eran
ces'
Discourse'Analysis'
table>video"
video>table"
0"
2"
4"
6"
8"
10"
12"
Conceptual"Comment"Screen"1"
Conceptual"Comment"Screen"2"
Conceptual"Comment"Screen"2"
Average'nu
mbe
r'of'u
.eran
ces'
Conceptual'Discussion'on'Each'Screen'
table6video"
video6table"

DISCUSSION My results support the PFL (“Preparing for Future Learning”) [4] approach to integrating new educational technologies to the classroom. In comparison, the “tell-‐and-‐practice” approach produced significantly lower learning gains. More specifically, I found that groups of students who collaboratively worked on an interactive tabletop and then watched a video lecture outperformed students who first watched the lecture and then completed a hands-‐on activity on Combinatorix. I interpret this result as evidence that TUIs can ideally complement classroom instruction if implemented correctly. Those findings replicates previous results that I found using a different tangible interface [19]; in this study, I found that individuals who learnt from a TUI first and then read a textbook chapter outperformed students who completed these activities in a reverse order. Participants in the “tableèvideo” group also had a higher quality of collaboration: in particular, they were more fully engaged into the task, they made more efforts to encourage one another to contribute their opinions and perspectives, and they more fully took advantage of the technological tools available to them. This result suggests that students tend to be more egocentric when the hands-‐on activity follows a video lecture. Thus, it may be beneficial to organize collaborative learning activities before delivering a lecture. These findings are useful for educators in general, and more specifically for designers of educational technologies. Those students also explored the problem space to a greater extent, and accessed the visualizations provided to them more often. Additionally, the discourse analysis suggests that students talked more when using the tabletop before watching the video lecture. More importantly, they spent more time having conceptual discussions about probabilities. A finer analysis showed that students’ discourse on the second screen (the tree diagram) was significantly higher for this group and highly correlated with a positive learning gain. Combined with previous the results above, it suggests that students in the “tableèvideo” group were more active and more willing to explore the resources provided to them.
One potential interpretation for this difference is referred to as “Function Fixedness” in cognitive psychology: in a classic experiment, Dunker [7] asked subjects to attach a candle to a wall so that it did not drip onto the table below. They were provided with a candle, a box of thumbtacks, and a book of matches. Dunker found that very few subjects thought of using the inside of the box as a candle-‐holder; instead, they tried to directly glue or attach the candle to the wall with the tacks. He called this effect mental fixedness, defined as a "mental block against using an object in a new way that is required to solve a problem”. I believe that school-‐like lectures can act as mental blocks against students’ creative understanding of a domain: they work extremely well in certain contexts (e.g. for passing standardized tests), but have detrimental effects in other situation where students have to demonstrate cognitive flexibility or transfer their understanding of a concept to a different situation [4]. In this experiments, I saw that students reduced their exploration of the available resources to focus on question answering. One interpretation is that the video lecture acted as a mental block against exploiting visualizations and manipulating physical objects to scaffold their understanding of a domain. There are several limitations to this study. First, the learning gains are significant but relatively small. This is explained by the high difficulty of the test; I chose to ask challenging questions to the students to avoid a ceiling effect and have a widespread dataset. Additionally, my evaluation does not test the effectiveness of Combinatorix. I chose this experimental design because 30 minutes is a small amount of time to learn about such a complex domain. I believe that my current results provide more insights for implementing interacting tabletops in the classroom settings than a direct comparison against another instructional approach. Finally, my sample is relatively small; running more subjects would provide more convincing data regarding the effect reported above.
Conclusion My findings suggest that educational designers should carefully think about how they want to implement their systems to existing classrooms. Choosing the wrong sequence of activities may impede students’ learning, whereas adopting a constructivist perspective is likely to foster knowledge building. Future work should look at more complex interactions between instructional methods. For instance, it would be interesting to look at what happens if students follow a “flip-‐classroom” paradigm (i.e. watch lectures at home before going to school, and then complete hands-‐on activities in the classroom). Does this instructional sequence also result in a “functional rigidness” mindset? My results suggest that this so-‐called educational revolution may actually be a step backward compared to more innovative approaches. Additional studies are needed to fully explore the impact of correctly sequencing educational activities on students’ learning choices.
ACKNOWLEDGMENTS I would like to thank the Lopatin Family for their generosity and support for this project.
REFERENCES 1. Abrahamson, D. and Wilensky, U. Understanding
chance: From student voice to learning supports in a design experiment in the domain of probability. 27th Annual Meeting of the North American Chapter of the International Group for the Psychology of Mathematics Education. Roanoke, VA: PME-NA, (2005).
2. Abrahamson, D. Embodied design: constructing means for constructing meaning. Educational Studies in Mathematics 70, 1 (2009), 27–47.
3. Batanero, C. and Sanchez, E. What is the Nature of High School Students’ Conceptions and Misconceptions About Probability? In G.A. Jones, ed., Exploring Probability in School. Springer US, 2005, 241–266.
4. Bransford, J. and Schwartz, D. Rethinking Transfer: A Simple Proposal with Multiple Implications. Review of Research in Education 24, (1999).
5. Clement, J. The Use of Analogies and Anchoring Intuitions to Remediate Misconceptions in Mechanics. (1987).
6. Dillenbourg, P. and Evans, M. Interactive tabletops in education. International Journal of Computer-Supported Collaborative Learning 6, 4 (2011), 491–514.
7. Duncker, K. On problem solving. Psychological Monographs 58, (1945).
8. Fast, G.R. Using analogies to overcome student teachers’ probability misconceptions. The Journal of Mathematical Behavior 16, 4 (1997), 325–344.
9. Garfield, J. and Ahlgren, A. Difficulties in Learning Basic Concepts in Probability and Statistics: Implications for Research. Journal for Research in Mathematics Education 19, 1 (1988), 44–63.
10. Goldstone, R.L. and Son, J.Y. The Transfer of Scientific Principles Using Concrete and Idealized Simulations. Journal of the Learning Sciences 14, 1 (2005), 69–110.
11. Ishii, H. and Ullmer, B. Tangible Bits: Towards Seamless Interfaces between People, Bits and Atoms. CHI ’97, (1997), 234–241.
12. Jendraszek, P.A. Misconceptions of probability among future teachers of mathematics. 2008. http://gradworks.umi.com/32/99/3299270.html.
13. Jermann, P., Zufferey, G., Schneider, B., Lucci, A., Lépine, S., and Dillenbourg, P. Physical space and division of labor around a tabletop tangible simulation. Proceedings of the 9th international conference on Computer supported collaborative learning-Volume 1, (2009), 345–349.
14. Kaltenbrunner, M. and Bencina, R. reacTIVision: a computer-vision framework for table-based tangible interaction. Proceedings of the 1st international conference on Tangible and embedded interaction, ACM (2007), 69–74.
15. Marshall, P. Do tangible interfaces enhance learning? Proceedings of the 1st international conference on Tangible and embedded interaction, ACM (2007), 163–170.
16. Meier, A., Spada, H., and Rummel, N. A rating scheme for assessing the quality of computer-supported collaboration processes. International Journal of Computer-Supported Collaborative Learning 2, 1 (2007), 63–86.
17. Piper, A.M. and Hollan, J.D. Tabletop displays for small group study: affordances of paper and digital materials. Proceedings of the 27th international conference on Human factors in computing systems, ACM (2009), 1227–1236.
18. Schneider, B., Jermann, P., Zufferey, G., and Dillenbourg, P. Benefits of a Tangible Interface for Collaborative Learning and Interaction. IEEE Transactions on Learning Technologies PP, 99 (2011), 1–1.
19. Schneider, B., Wallace, J., Blikstein, P., and Pea, R. Preparing for Future Learning with a Tangible User Interface: The Case of Neuroscience. IEEE Transactions on Learning Technologies 99, 1 (5555), 1.
20. Schwartz, D. and Martin, T. Inventing to Prepare for Future Learning: The Hidden Efficiency of Encouraging Original Student Production in Statistics Instruction. Cognition and Instruction 22, 2 (2004), 129–184.
21. Shaer, O., Kol, G., Strait, M., Fan, C., Grevet, C., and Elfenbein, S. G-nome surfer: a tabletop interface for collaborative exploration of genomic data. Proceedings of the 28th international conference on Human factors in computing systems, ACM (2010), 1427–1436.
22. Smith, J.P., diSessa, A.A., and Roschelle, J. Misconceptions Reconceived: A Constructivist Analysis of Knowledge in Transition. Journal of the Learning Sciences 3, 2 (1994), 115.
23. Steele, C.M. A threat in the air: How stereotypes shape intellectual identity and performance. American Psychologist 52, 6 (1997), 613–629.
24. Tversky, A. and Kahneman, D. Judgment under uncertainty: Heuristics and biases. Springer, 1975.
25. Valdes, C., Ferreirae, M., Feng, T., et al. A collaborative environment for engaging novices in scientific inquiry. Proceedings of the 2012 ACM international conference on Interactive tabletops and surfaces, ACM (2012), 109–118.
26. Zufferey, G., Jermann, P., and Dillenbourg, P. A tabletop learning environment for logistics assistants: activating teachers. Proceedings of the Third IASTED International Conference on Human Computer Interaction, (2008), 37–4.


