
Common Trends in the Well-Being of
Children and Youth
A presentation to the Cultural Diversity Resources Annual Diversity ConferenceOctober 30, 2012

Nor
th D
akot
a KI
DS
COU
NT
w
ww
.ndk
idsc
ount
.org
Preliminary Information
North Dakota KIDS COUNT
Providing accurate, current data on children’s well-being
www.ndkidscount.org www.facebook.com/ndkidscount 2

Nor
th D
akot
a KI
DS
COU
NT
w
ww
.ndk
idsc
ount
.org
Today’s outline
• Part 1: Setting the Stage• Overview of your interests in children’s issues• Getting ready for a quiz
• Part 2: Presenting the Data• Who Are North Dakota’s Children
• Demographics of children• How are North Dakota’s Children Doing?
• Economic well-being• Family structures and supports• Education• Risky behaviors
3

Nor
th D
akot
a KI
DS
COU
NT
w
ww
.ndk
idsc
ount
.org
Your interests • In what ways do you work with children and teens?• When do you need to access data about children and teens?• What types of data about children and teens would help you
in your efforts? Or better understand your community?
4
Nor
th D
akot
a KI
DS
COU
NT
w
ww
.ndk
idsc
ount
.org
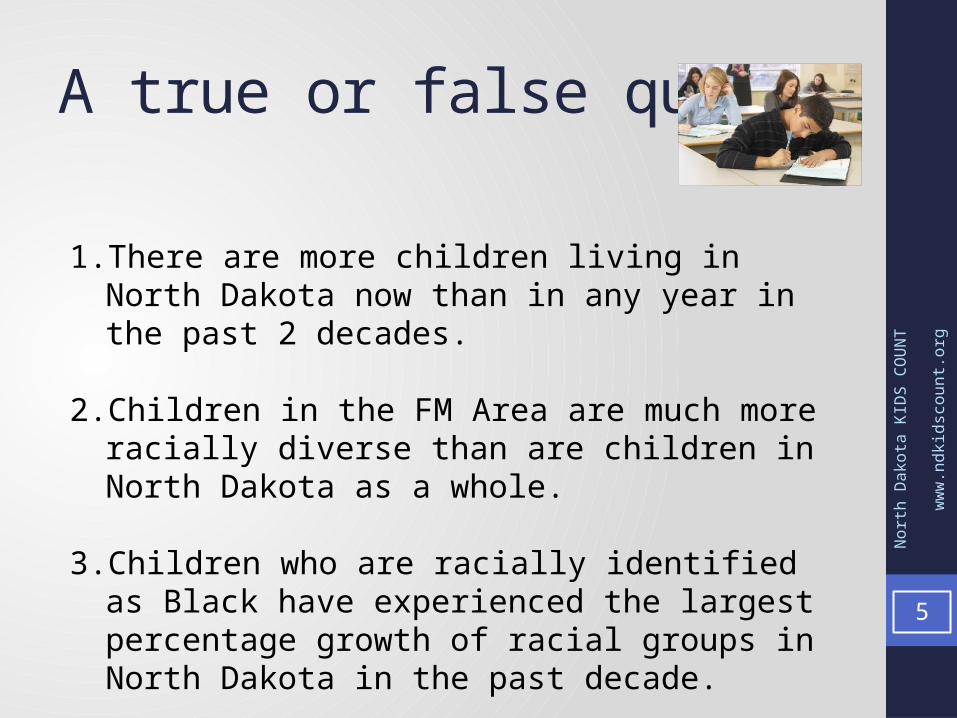
A true or false quiz
1. There are more children living in North Dakota now than in any year in the past 2 decades.
2. Children in the FM Area are much more racially diverse than are children in North Dakota as a whole.
3. Children who are racially identified as Black have experienced the largest percentage growth of racial groups in North Dakota in the past decade.
5

Nor
th D
akot
a KI
DS
COU
NT
w
ww
.ndk
idsc
ount
.org
Quiz, continued
4. Persons in minimum wage jobs who work year-round, full-time earn more than the poverty level.
5. The percentage of children living in poverty in North Dakota was lower in 2010 than in 2000.
6. Children identified as American Indian have poverty rates that are twice as high as white children in North Dakota.
6

Nor
th D
akot
a KI
DS
COU
NT
w
ww
.ndk
idsc
ount
.org
You’re Almost Done…
7. North Dakota has one of the lowest rates in the nation of mothers in the labor force.
8. The percentage of children living in two-parent households has decreased in North Dakota over the past 10 years.
9. North Dakota University System graduates who are minorities are more likely to remain in ND following graduation than are white graduates.
7

Nor
th D
akot
a KI
DS
COU
NT
w
ww
.ndk
idsc
ount
.org
Who are North Dakota’s Children?• Growth rates• Racial diversity
• U.S. Census Bureau: • Decennial Census; Population Estimates Program; American
Community Survey• http://factfinder2.census.gov• http://www.census.gov/popest/estimates.html
8

Nor
th D
akot
a KI
DS
COU
NT
w
ww
.ndk
idsc
ount
.org
True or False?
• There are more children living in North Dakota now than in any year in the past 2 decades.
• FALSE• Despite recent growth, there are 15% fewer
children in the state than in 1990.9

Nor
th D
akot
a KI
DS
COU
NT
w
ww
.ndk
idsc
ount
.org
Number of Children Ages 0-17 in North Dakota, 1990-2010
1990 1992 1994 1996 1998 2000 2002 2004 2006 2008 20100
20,000
40,000
60,000
80,000
100,000
120,000
140,000
160,000
180,000
200,000
175,385 172,052 172,161 169,257 165,448 160,849
152,062 147,004 143,794 143,017
149,871
10

Nor
th D
akot
a KI
DS
COU
NT
w
ww
.ndk
idsc
ount
.org
Number of Children Ages 0-17 in North Dakota, 2000-2010
2000 2002 2004 2006 2008 20100
20,000
40,000
60,000
80,000
100,000
120,000
140,000
160,000
180,000160,849
152,062147,004 143,794 143,017
149,871
41,567 40,705 40,810 41,636 42,795 46,404
North Dakota FM Area
Num
ber o
f chi
ldre
n
12% increase
7% decline
11
Nor
th D
akot
a KI
DS
COU
NT
w
ww
.ndk
idsc
ount
.org
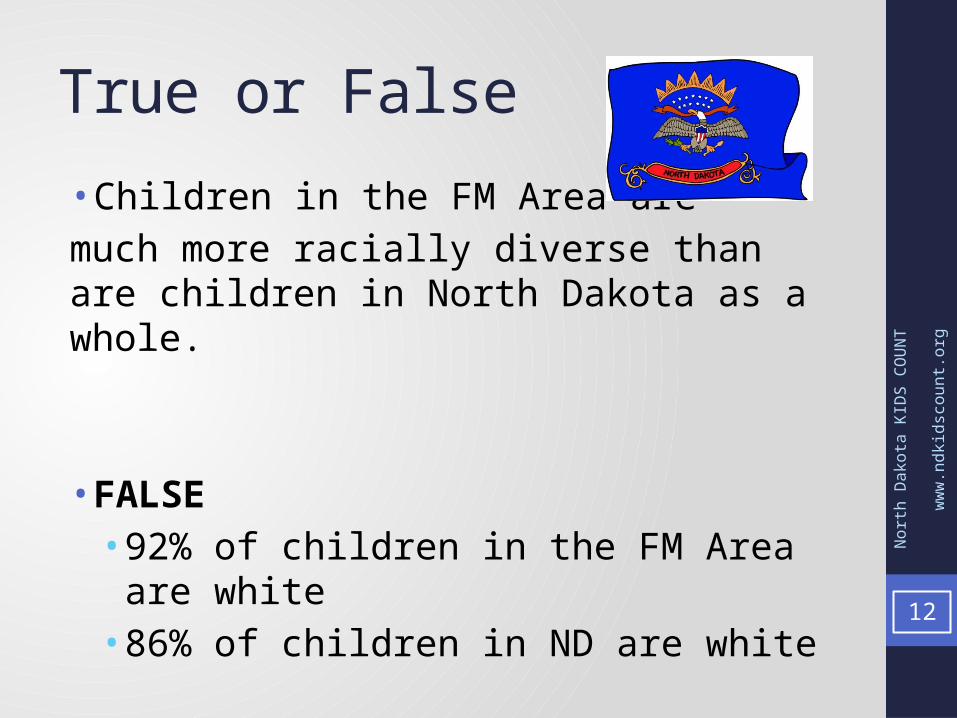
True or False
• Children in the FM Area are much more racially diverse than are children in North Dakota as a whole.
• FALSE • 92% of children in the FM Area are white• 86% of children in ND are white
12

Nor
th D
akot
a KI
DS
COU
NT
w
ww
.ndk
idsc
ount
.org
Percent of Children in North Dakota and FM Area by Race, 2010
White;
86%
Black; 3%
American Indian; 10%
Asian; 1%
North Dakota
White; 92%
Black; 4%
American Indian; 2% Asian; 2%
FM Area
13

Nor
th D
akot
a KI
DS
COU
NT
w
ww
.ndk
idsc
ount
.org
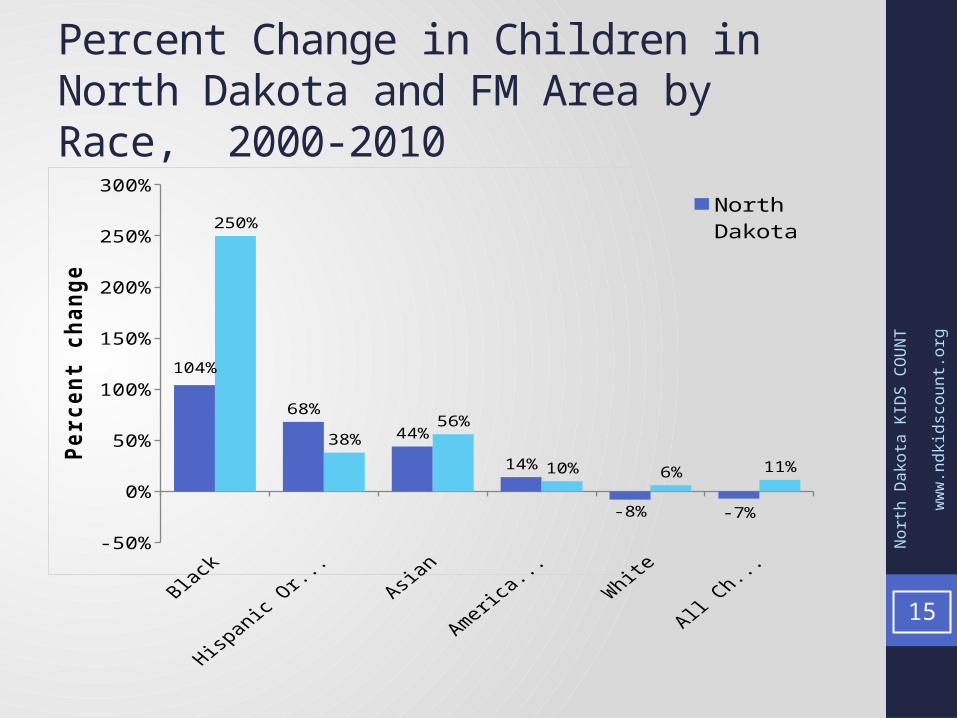
True or False
• Black children haveexperienced the largest percentagegrowth in number during the past decade.
• TRUE• This is true for both the state as a whole and for the
FM Area.
14
Nor
th D
akot
a KI
DS
COU
NT
w
ww
.ndk
idsc
ount
.org
Percent Change in Children in North Dakota and FM Area by Race, 2000-2010
Black Hispanic Origin (of any race)
Asian American Indian
White All Children-50%
0%
50%
100%
150%
200%
250%
300%
104%
68%
44%
14%
-8% -7%
250%
38%56%
10% 6% 11%
North DakotaFM Area
Perc
ent c
hang
e
15

Nor
th D
akot
a KI
DS
COU
NT
w
ww
.ndk
idsc
ount
.org
How are North Dakota’s Children Doing?
• KIDS COUNT state-by-state comparisons, based on• Economic well-being• Family and community• Education• Health
16

Nor
th D
akot
a KI
DS
COU
NT
w
ww
.ndk
idsc
ount
.org
How are North Dakota’s Children Doing?• 2012 rankings in the United States:• New Hampshire• Massachusetts• Vermont• New Jersey• Minnesota• North Dakota (#6)
• While the overall picture is good for North Dakota, we know that disparities exist.
17

Nor
th D
akot
a KI
DS
COU
NT
w
ww
.ndk
idsc
ount
.org
Economic Well-Being• Poverty• Parents in the labor force
• U.S. Census Bureau: • American Community Survey• http://factfinder2.census.gov
18

Nor
th D
akot
a KI
DS
COU
NT
w
ww
.ndk
idsc
ount
.org
True or False?
• Theme: Putting poverty in context
• Persons in minimum wage jobs who work year-round, full-time earn more than the poverty level.
• TRUE, but only for one-person households.
19

Nor
th D
akot
a KI
DS
COU
NT
w
ww
.ndk
idsc
ount
.org
Poverty guidelines in 2012
$11,1701
$15,1302
$19,0903
$23,0504
Income by household size
20Minimum wage, working 40 hours/week, 52 weeks/year = $15,080

Nor
th D
akot
a KI
DS
COU
NT
w
ww
.ndk
idsc
ount
.org
True or False
• Given the strength of ND’s economy, the percentage of children living in poverty in North Dakota was lower in 2010 than in 2000.
• FALSE• The poverty rate for children in North Dakota changed
little from 2000 to 2010.
• The percent of children in poverty in the FM Area rose from 2000 to 2010. 21

Nor
th D
akot
a KI
DS
COU
NT
w
ww
.ndk
idsc
ount
.org
Percent of Children Living in Poverty, North Dakota and FM Area, 1990-2010
North Dakota FM Area0.0%
2.0%
4.0%
6.0%
8.0%
10.0%
12.0%
14.0%
16.0%
18.0%17.1%
11.7%
14.0%
10.7%
14.2%
11.5%199020002010
22

Nor
th D
akot
a KI
DS
COU
NT
w
ww
.ndk
idsc
ount
.org
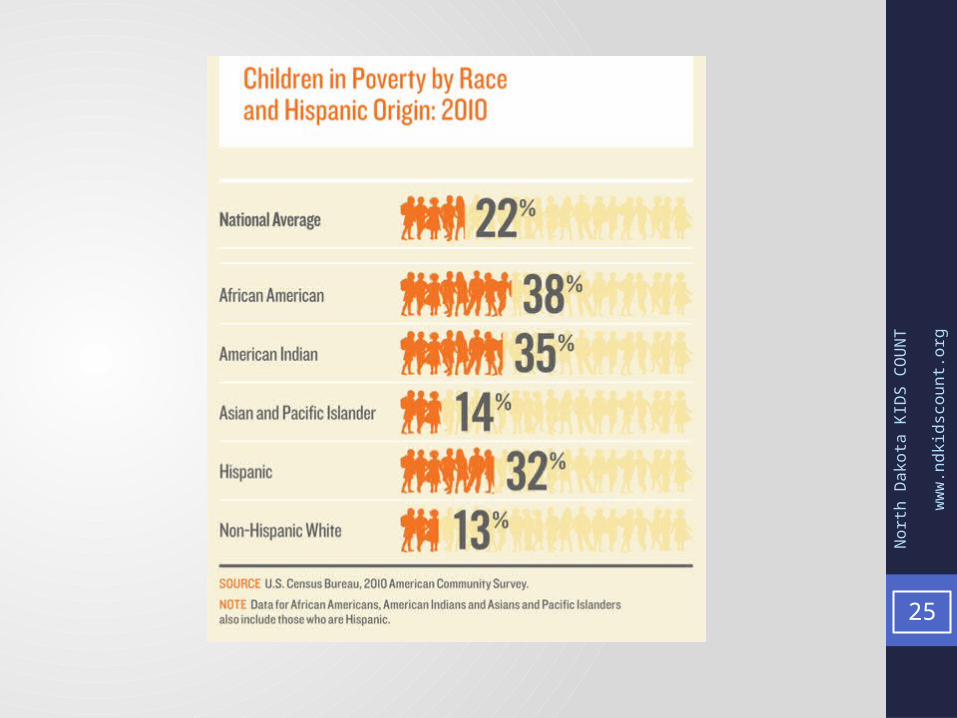
True or False?
• American Indian children have poverty rates that are twice as high as white children in North Dakota.
• FALSE• Almost 5 times as high
23

Nor
th D
akot
a KI
DS
COU
NT
w
ww
.ndk
idsc
ount
.org
Percent of North Dakota Children Ages 0-17 Living in Poverty by Race/Ethnicity, 2010
American Indian
Black Hispanic Origin of any race
Two or More Races
All North Dakota
Children
White Asian0%
10%
20%
30%
40%
50%
60%
49%
36%
26%23%
14%10%
7%
24
Nor
th D
akot
a KI
DS
COU
NT
w
ww
.ndk
idsc
ount
.org
25
Nor
th D
akot
a KI
DS
COU
NT
w
ww
.ndk
idsc
ount
.org
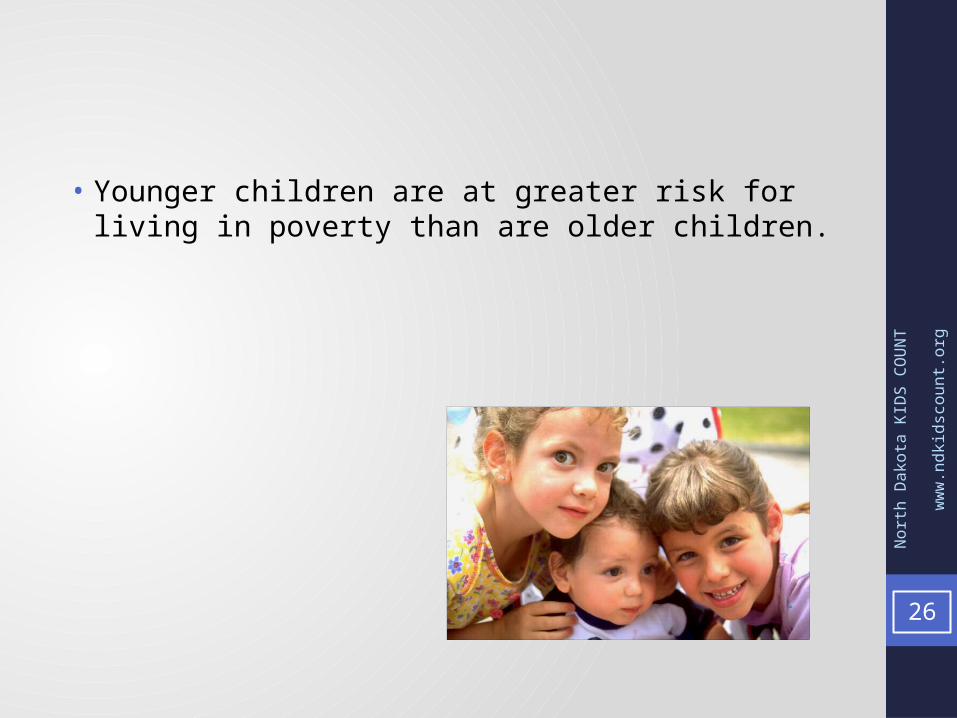
• Younger children are at greater risk for living in poverty than are older children.
26

Nor
th D
akot
a KI
DS
COU
NT
w
ww
.ndk
idsc
ount
.org
Percent of North Dakota Children Living in Poverty by Age and Race, 2010
American Indian
Black Hispanic Origin of any race
Two or More Races
All North Dakota
Children
White Asian0%
10%
20%
30%
40%
50%
60% 57%
51%
28%31%
18%
12%9%
43%
25% 25%
16%12%
9%6%
Ages 0-5Ages 6-17
Perc
ent l
ivin
g in
pov
erty
27

Nor
th D
akot
a KI
DS
COU
NT
w
ww
.ndk
idsc
ount
.org
• Parents in the labor force
28

Nor
th D
akot
a KI
DS
COU
NT
w
ww
.ndk
idsc
ount
.org
Multiple Job Holders, 2010
29
Nor
th D
akot
a KI
DS
COU
NT
w
ww
.ndk
idsc
ount
.org
True or False?
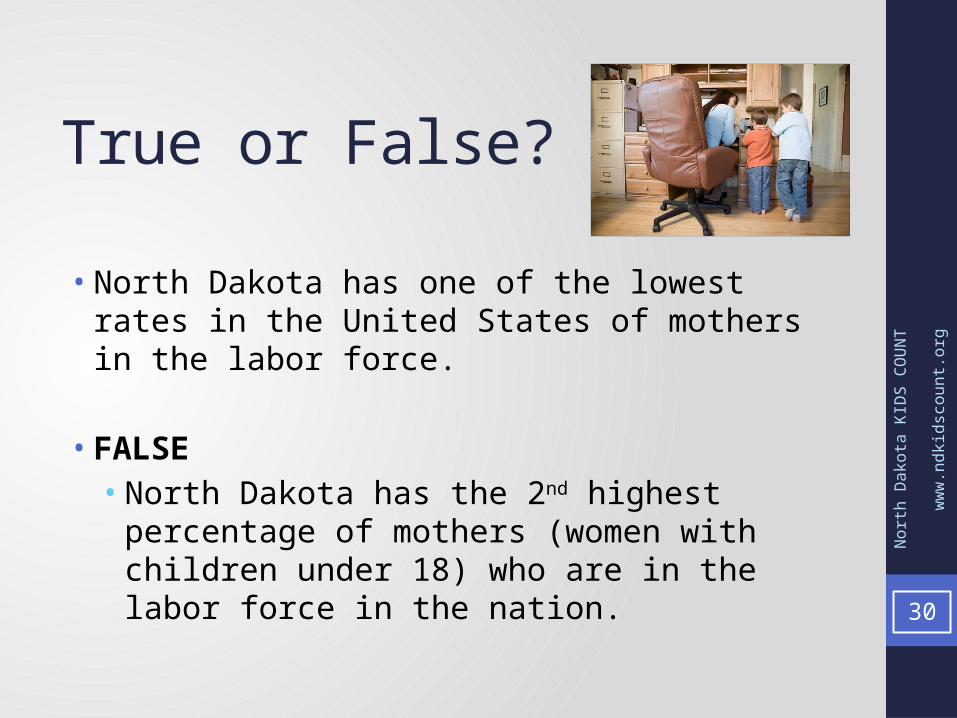
• North Dakota has one of the lowest rates in the United States of mothers in the labor force.
• FALSE• North Dakota has the 2nd highest percentage of
mothers (women with children under 18) who are in the labor force in the nation.
30

Nor
th D
akot
a KI
DS
COU
NT
w
ww
.ndk
idsc
ount
.org
Percent of Women with Children Under 18 Who are in the Labor Force, 2006-2010
North Dakota (2nd) Minnesota (7th) United States0%
10%
20%
30%
40%
50%
60%
70%
80%
90%82% 80%
73%
31
Nor
th D
akot
a KI
DS
COU
NT
w
ww
.ndk
idsc
ount
.org
32

Nor
th D
akot
a KI
DS
COU
NT
w
ww
.ndk
idsc
ount
.org
Family Structure and Supports• With whom do children live?
• U.S. Census Bureau: • American Community Survey• http://factfinder2.census.gov
33

Nor
th D
akot
a KI
DS
COU
NT
w
ww
.ndk
idsc
ount
.org
True or False
• The percentage of children living in two-parent households has decreased in North Dakota over the past 10 years.
• TRUE• The percentage of children living in two-parent
households decreased in North Dakota, but increased slightly in the FM Area.
34

Nor
th D
akot
a KI
DS
COU
NT
w
ww
.ndk
idsc
ount
.org
Percent Change in Children in North Dakota and FM Area by Type of Residence, 2000-2010
Married Parents Single Parents Grandparents Other Situations-20%
0%
20%
40%
60%
80%
100%
-15%
16%
49%
14%
3%
33%
85%
41%
North DakotaFM Area
Perc
ent c
hang
e in
chi
ldre
n by
eac
h ty
pe o
f re
siden
ce
35

Nor
th D
akot
a KI
DS
COU
NT
w
ww
.ndk
idsc
ount
.org
Percent of Children in 2010 Who Live with .....
Both Parents Single Parent Grandparent Other0%
10%
20%
30%
40%
50%
60%
70%
80%
69%
24%
4% 3%
71%
23%
3% 3%
North DakotaFM Area
Perc
ent o
f all
child
ren
36

Nor
th D
akot
a KI
DS
COU
NT
w
ww
.ndk
idsc
ount
.org
• Access to health insurance
• U.S. Census Bureau: • American Community Survey• http://factfinder2.census.gov
37

Nor
th D
akot
a KI
DS
COU
NT
w
ww
.ndk
idsc
ount
.org
Percent of Children Without Health Insurance by Age Group, 2010
North Dakota Minnesota South Dakota United States0%
1%
2%
3%
4%
5%
6%
7%
8%
9%
10%
6% 6%
7%
6%
7% 7%
9% 9%
Ages 0 to 5
Ages 6 to 17
Perc
ent o
f chi
ldre
n
38
Nor
th D
akot
a KI
DS
COU
NT
w
ww
.ndk
idsc
ount
.org
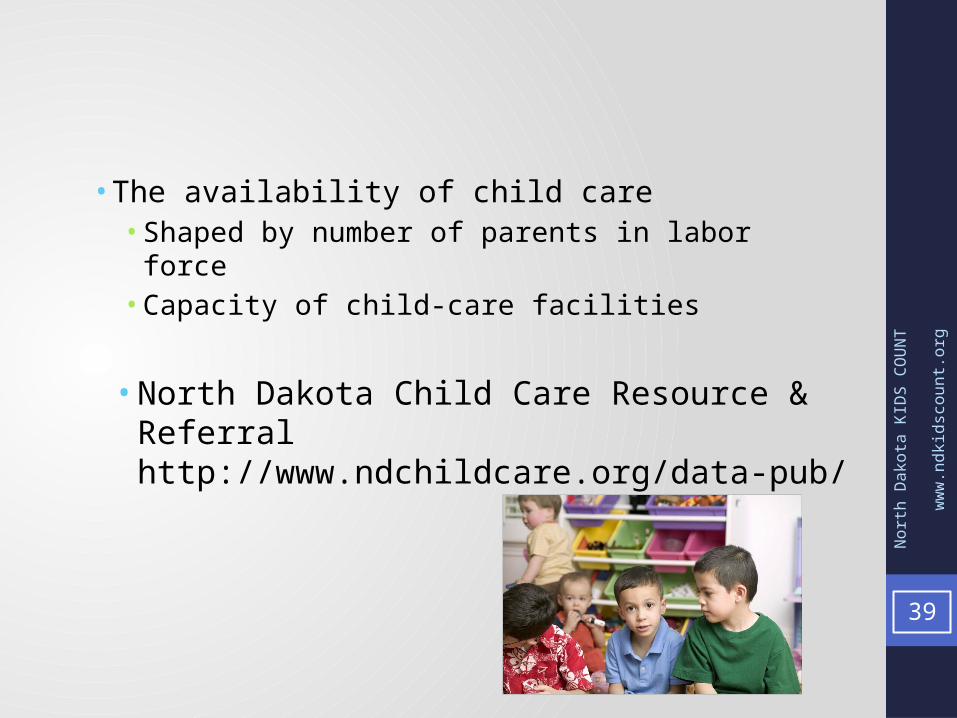
• The availability of child care• Shaped by number of parents in labor force• Capacity of child-care facilities
39
• North Dakota Child Care Resource & Referral http://www.ndchildcare.org/data-pub/

40

Nor
th D
akot
a KI
DS
COU
NT
w
ww
.ndk
idsc
ount
.org
41

Nor
th D
akot
a KI
DS
COU
NT
w
ww
.ndk
idsc
ount
.org
Educational Well-Being• How are North Dakota students doing with regard to reading
and math skills? Are there disparities?• Are students graduating from high school?• Are students prepared for college?• How many high school graduates attend college?• Are graduates remaining in the state?
42

Nor
th D
akot
a KI
DS
COU
NT
w
ww
.ndk
idsc
ount
.org
Percent of 4th Graders Not Proficient in Reading by Race, North Dakota and US, 2011
White
Black
Hispan
ic
America
n Indian
All Studen
ts0%
10%20%30%40%50%60%70%80%90%
62%71%
78%85%
64%
North Dakota United States
43
Nor
th D
akot
a KI
DS
COU
NT
w
ww
.ndk
idsc
ount
.org
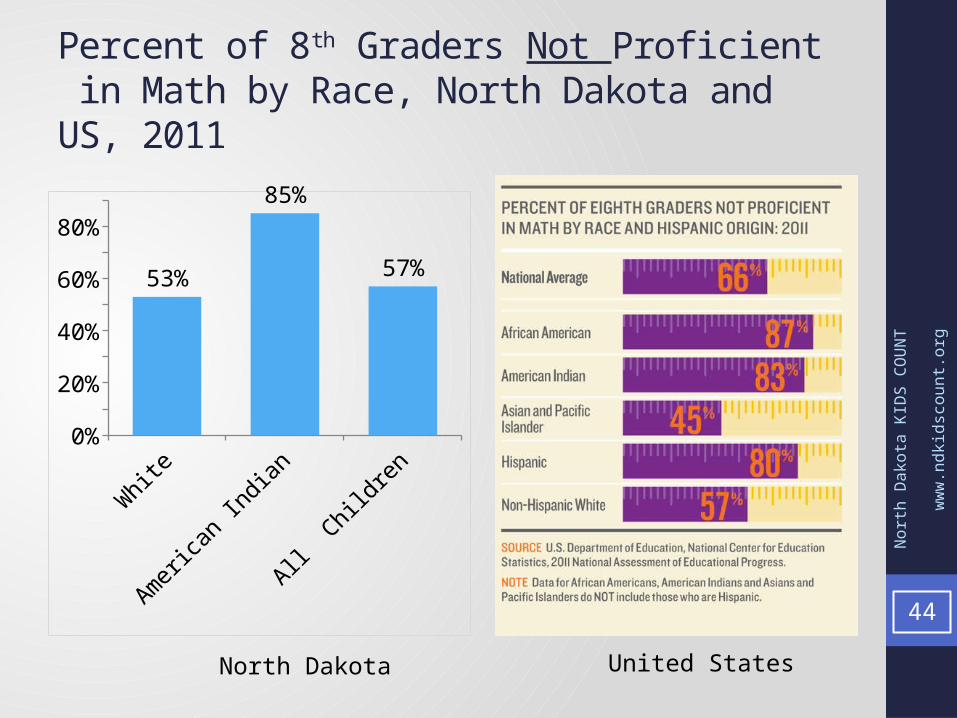
Percent of 8th Graders Not Proficient in Math by Race, North Dakota and US, 2011
White
American
Indian
All Child
ren0%
10%20%30%40%50%60%70%80%90%
53%
85%
57%
North Dakota United States
44

Nor
th D
akot
a KI
DS
COU
NT
w
ww
.ndk
idsc
ount
.org
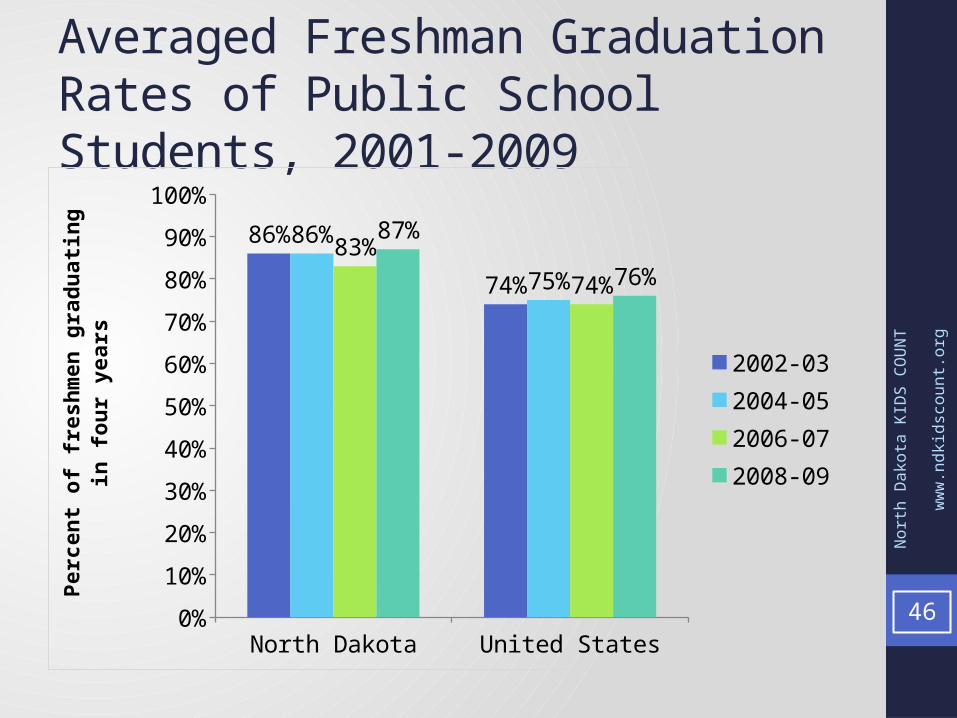
• North Dakota students have higher than average graduation rates, when compared with all students in the U.S.
• National Center for Education Statistics – and available through KIDS COUNT Data Center
http://datacenter.kidscount.org/
45
Nor
th D
akot
a KI
DS
COU
NT
w
ww
.ndk
idsc
ount
.org
Averaged Freshman Graduation Rates of Public School Students, 2001-2009
North Dakota United States0%
10%
20%
30%
40%
50%
60%
70%
80%
90%
100%
86%
74%
86%
75%83%
74%
87%
76%
2002-032004-052006-072008-09
Perc
ent o
f fre
shm
en g
radu
ating
in fo
ur y
ears
46

Nor
th D
akot
a KI
DS
COU
NT
w
ww
.ndk
idsc
ount
.org
• Graduation rate disparities
• North Dakota Department of Public Instruction http://www.dpi.state.nd.us/dpi/reports/Profile/index.shtm
47

Nor
th D
akot
a KI
DS
COU
NT
w
ww
.ndk
idsc
ount
.org
North Dakota High School Graduation Rates Over Time by Race/Ethnicity
2004-05 2006-07 2008-09 2010-1150%
55%
60%
65%
70%
75%
80%
85%
90%
95%
78%
89%
91%
88%
75%
78% 79%
74%
63%65%
55%
62%
89%90%
89%
90%
Asian BlackAmerican Indian White
48

Nor
th D
akot
a KI
DS
COU
NT
w
ww
.ndk
idsc
ount
.org
College readiness
49
• ACT, Inc.http://www.act.org/newsroom/data/2012/readinessreports.html

Nor
th D
akot
a KI
DS
COU
NT
w
ww
.ndk
idsc
ount
.org
Average ACT Composite Score of North Dakota Students, by Race/Ethnicity, 2012
All Stu-
dents
White Asian Hispanic/Latino
American Indian
Black/African
American
0
5
10
15
20
25
20.7 21.219.3
18.116.8
15.6
Ave
rage
ACT
Com
posi
te S
core
50

Nor
th D
akot
a KI
DS
COU
NT
w
ww
.ndk
idsc
ount
.org
College
51
• U.S. Census Bureau: • American Community Survey• http://factfinder2.census.gov
• North Dakota University System: • http://
ndus.edu/uploads/reports/75/2010-placements-of-2009-grads-findet.pdf
Nor
th D
akot
a KI
DS
COU
NT
w
ww
.ndk
idsc
ount
.org
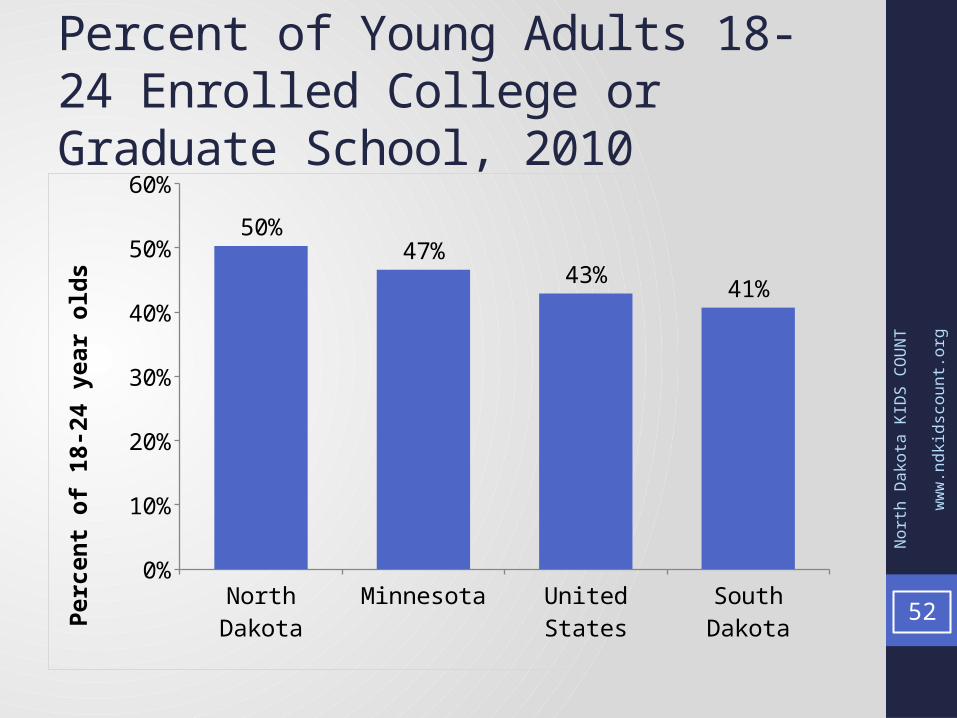
Percent of Young Adults 18-24 Enrolled College or Graduate School, 2010
North Dakota Minnesota United States South Dakota0%
10%
20%
30%
40%
50%
60%
50%47%
43%41%
Perc
ent o
f 18-
24 y
ear o
lds
52

Nor
th D
akot
a KI
DS
COU
NT
w
ww
.ndk
idsc
ount
.org
True or False
• North Dakota University System graduates who are minorities are more likely to remain in ND following graduation than are white graduates.
• FALSE
53

Nor
th D
akot
a KI
DS
COU
NT
w
ww
.ndk
idsc
ount
.org
Percent of 2009 North Dakota University System Graduates Who Remained in North Dakota the Next Year by Race/Ethnicity
White
Race/e
thnicity
unknown
American In
dian/Alaska
Native
Hispanic
Asian
Africa
n American/B
lack0%
10%
20%
30%
40%
50%
60%
70%
80%68% 68%
63%
52% 49% 48%
Perc
ent o
f gra
duat
es in
eac
h ra
cial
/eth
nic
grou
p
54

Nor
th D
akot
a KI
DS
COU
NT
w
ww
.ndk
idsc
ount
.org
Risky behaviors• Studied through the Youth Risk Behavior Survey of the CDChttp://www.dpi.state.nd.us/health/YRBS/http://www.cdc.gov/healthyyouth/yrbs/index.htm
• Minnesota Student Surveyhttp://www.health.state.mn.us/divs/chs/mss/
55

Nor
th D
akot
a KI
DS
COU
NT
w
ww
.ndk
idsc
ount
.org
• Some gender differences in risky behaviors
56

Nor
th D
akot
a KI
DS
COU
NT
w
ww
.ndk
idsc
ount
.org
Risky Behaviors that are Significantly Different for North Dakota High School Females and Males, 2011
Females Males
Bullied on school property (during past year) 30% 21%
Carried a weapon on school property (at least one day in past month) 3% 8%In a physical fight on school property (one or more times in past year) 5% 11%Felt sad or hopeless (almost everyday day for 2 or more weeks) 31% 17%
Seriously considered attempting suicide (in past year) 19% 10%
Ever been electronically bullied (in past year) 23% 12%
Drank alcohol for the first time before age 13 (more than a few sips) 13% 20%Tried marijuana for the first time before age 13 4% 8%Used marijuana on school property (one or more times during past month) 1% 5%Ever physically forced to have sexual intercourse 10% 3%
Smoked cigarettes, cigars, or used chewing tobacco, snuff or dip (at least one day in past month)
23% 33%
Used computers 3 or more hours per day 20% 30%
57

Nor
th D
akot
a KI
DS
COU
NT
w
ww
.ndk
idsc
ount
.org
Risky Behaviors that are Not Significantly Different for North Dakota High School Females and Males, 2011Drug or Alcohol Related Risky Behaviors Females Males
Rode with a driver who had been drinking (one or more times in past month) 27% 24%
Drove when drinking alcohol (one or more times in past month) 12% 12%
Smoked a whole cigarette for the first time before age 13 8% 8%
Smoked cigarettes on 20 or more days (in the past month) 8% 8%
Did not try to quit smoking (of smokers in past year) 45% 50%
Had five or more drinks of alcohol in a row within a couple of hours (at least once in past month)
24% 27%
Used marijuana (one or more times in past month) 14% 17%
Ever used any form of cocaine 5% 7%
Ever sniffed glue, breathed the contents of aerosol spray cans, or inhaled any paints or sprays to get high (one or more times in life)
12% 11%
Ever took prescription drugs one or more times without a doctor’s prescription 16% 16%
Offered, sold, or been given an illegal drug by someone on school property (during past year)
20% 22% 58

Nor
th D
akot
a KI
DS
COU
NT
w
ww
.ndk
idsc
ount
.org
Risky Behaviors that are Not Significantly Different for North Dakota High School Females and Males, 2011
Females Males
Ever had sexual intercourse 46% 43%
Had sexual intercourse with four or more persons (in life) 15% 12%
Watched TV for 3 or more hours (on average school day) 26% 24%
Attempted suicide (one or more times in past year) 12% 10%
59

Nor
th D
akot
a KI
DS
COU
NT
w
ww
.ndk
idsc
ount
.org
Percent of ND high school students reporting binge drinking
1999 2001 2003 2005 2007 2009 20110%
5%
10%
15%
20%
25%
30%
35%
40%
45%
50%46%
42%40%
34% 33%31%
26%
60

Nor
th D
akot
a KI
DS
COU
NT
w
ww
.ndk
idsc
ount
.org
Percent of ND high school students reporting driving with someone who has been drinking
611999 2001 2003 2005 2007 2009 2011
0%
10%
20%
30%
40%
50%
60%
48%44% 43%
37%
32%28%
25%

Nor
th D
akot
a KI
DS
COU
NT
w
ww
.ndk
idsc
ount
.org
Percent of ND high school students who attempted suicide
621999 2001 2003 2005 2007 2009 2011
0%
2%
4%
6%
8%
10%
12%
6%
8% 7%6%
9%
6%
11%

Nor
th D
akot
a KI
DS
COU
NT
w
ww
.ndk
idsc
ount
.org
Feel free to use or copy this presentation…
• Please credit North Dakota KIDS COUNT and let us know how you used this information by contacting us at [email protected].
• http://www.ndkidscount.org• http://www.facebook.com/ndkidscount
Karen Olson, Program DirectorNorth Dakota KIDS COUNT
63


