Comparing Consumption:inter-national and inter-temporal
An-Chi Tung, 2007.1.19
Outline • Graphs across economies
– patterns: right peak, left peak, twin peak, central peak…
– public vs private– health and education
• Findings and questions– trend? changes? why? what impact?
– …
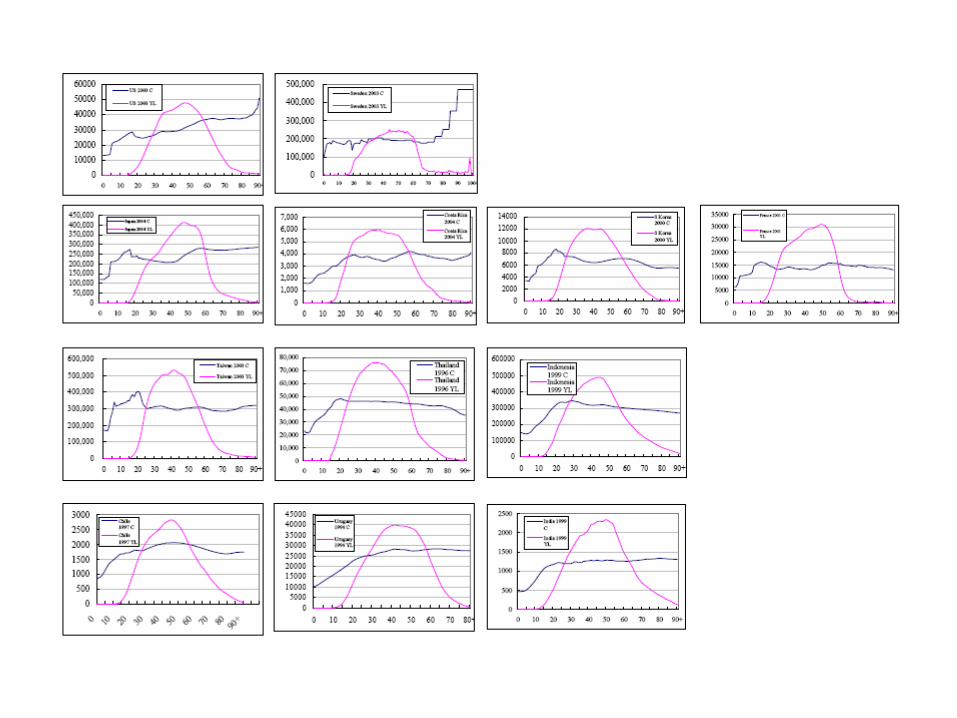
Graphs of Consumption
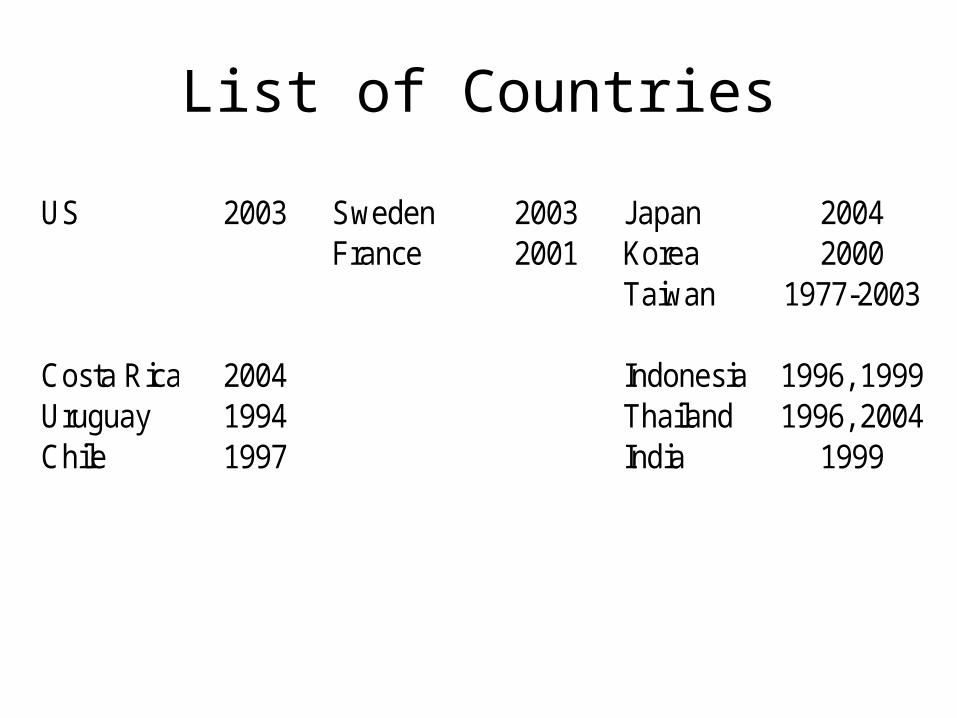
List of Countries
US 2003 Sweden 2003 Japan 2004France 2001 Korea 2000
Taiwan 1977-2003
Costa Rica 2004 Indonesia 1996, 1999Uruguay 1994 Thailand 1996, 2004Chile 1997 India 1999
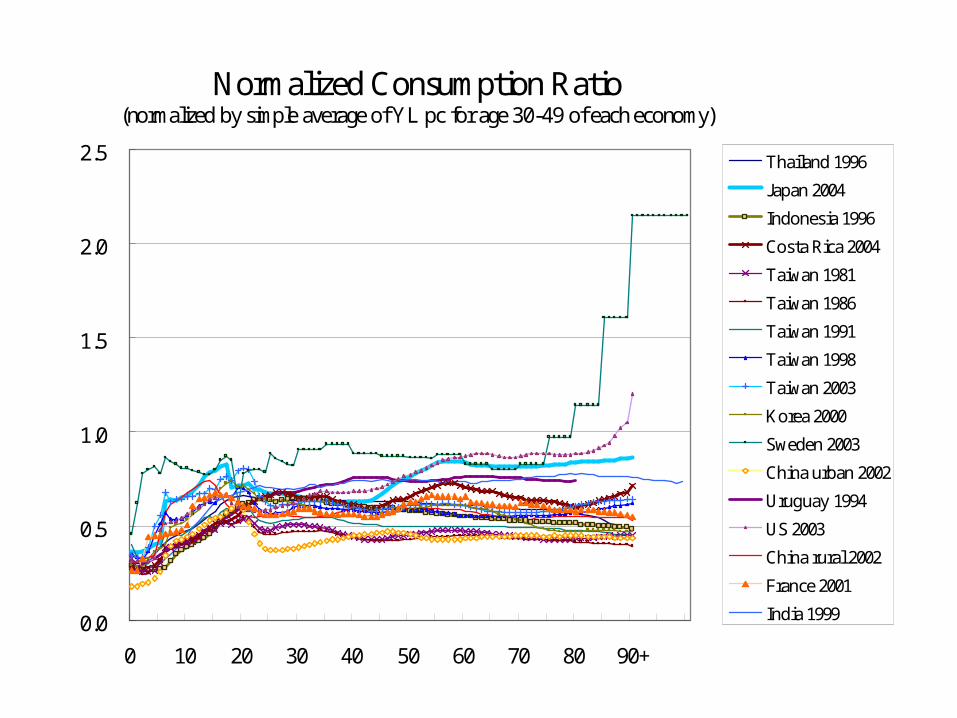
Normalized Consumption Ratio(normalized by simple average of YL pc for age 30-49 of each economy)
0.0
0.5
1.0
1.5
2.0
2.5
0 10 20 30 40 50 60 70 80 90+
Thailand 1996
Japan 2004
Indonesia 1996
Costa Rica 2004
Taiwan 1981
Taiwan 1986
Taiwan 1991
Taiwan 1998
Taiwan 2003
Korea 2000
Sweden 2003
China urban 2002
Uruguay 1994
US 2003
China rural 2002
France 2001
India 1999
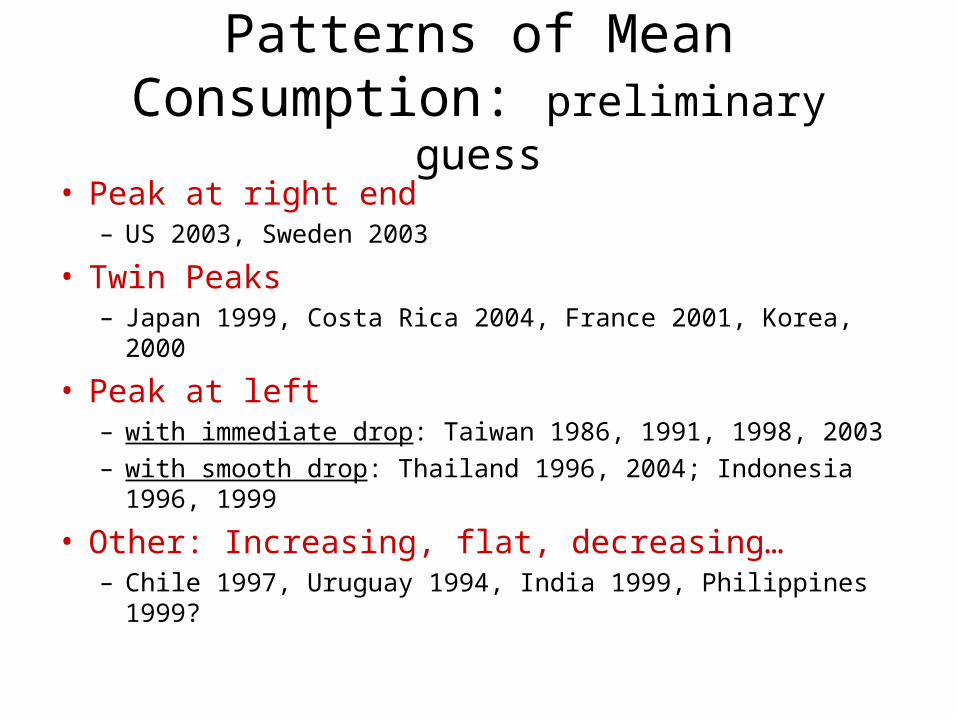
Patterns of Mean Consumption: preliminary guess
• Peak at right end– US 2003, Sweden 2003
• Twin Peaks– Japan 1999, Costa Rica 2004, France 2001, Korea, 2000
• Peak at left– with immediate drop: Taiwan 1986, 1991, 1998, 2003
– with smooth drop: Thailand 1996, 2004; Indonesia 1996, 1999
• Other: Increasing, flat, decreasing…– Chile 1997, Uruguay 1994, India 1999, Philippines 1999?
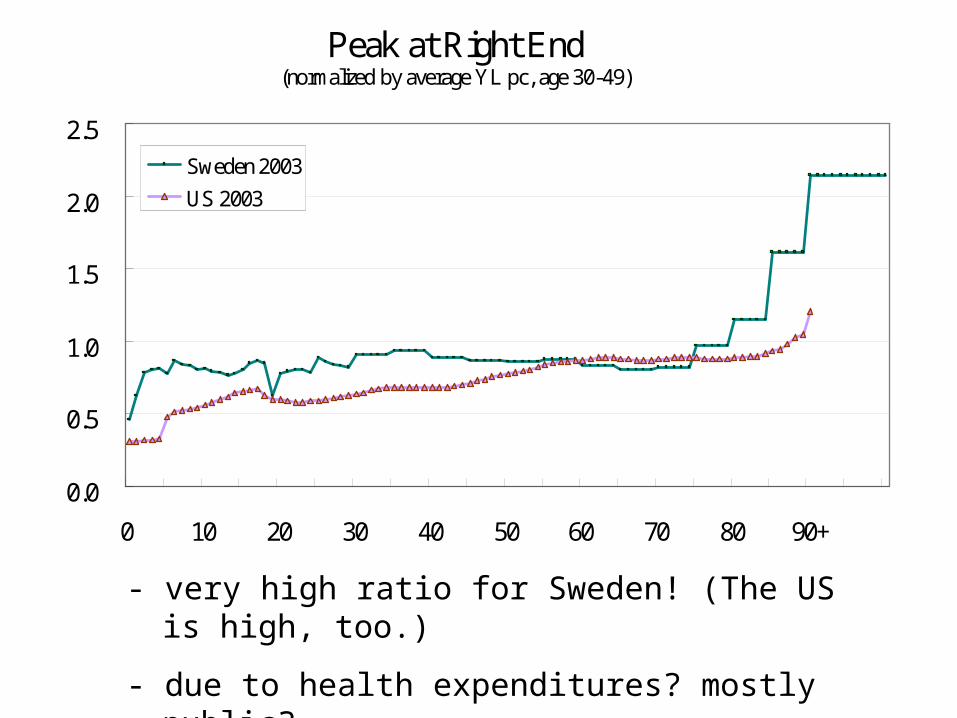
Peak at Right End(normalized by average YL pc, age 30-49)
0.0
0.5
1.0
1.5
2.0
2.5
0 10 20 30 40 50 60 70 80 90+
Sweden 2003
US 2003
- very high ratio for Sweden! (The US is high, too.)
- due to health expenditures? mostly public?
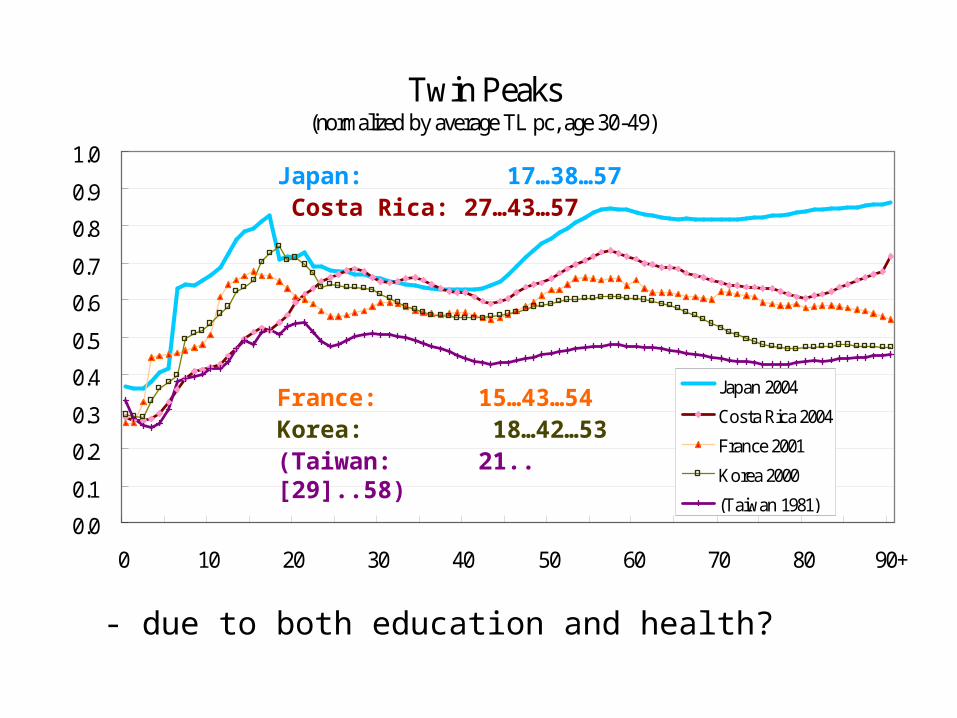
Twin Peaks(normalized by average TL pc, age 30-49)
0.0
0.1
0.2
0.3
0.4
0.5
0.6
0.7
0.8
0.9
1.0
0 10 20 30 40 50 60 70 80 90+
Japan 2004
Costa Rica 2004
France 2001
Korea 2000
(Taiwan 1981)
Japan: 17…38…57 Costa Rica: 27…43…57
France: 15…43…54Korea: 18…42…53(Taiwan: 21..[29]..58)
- due to both education and health?
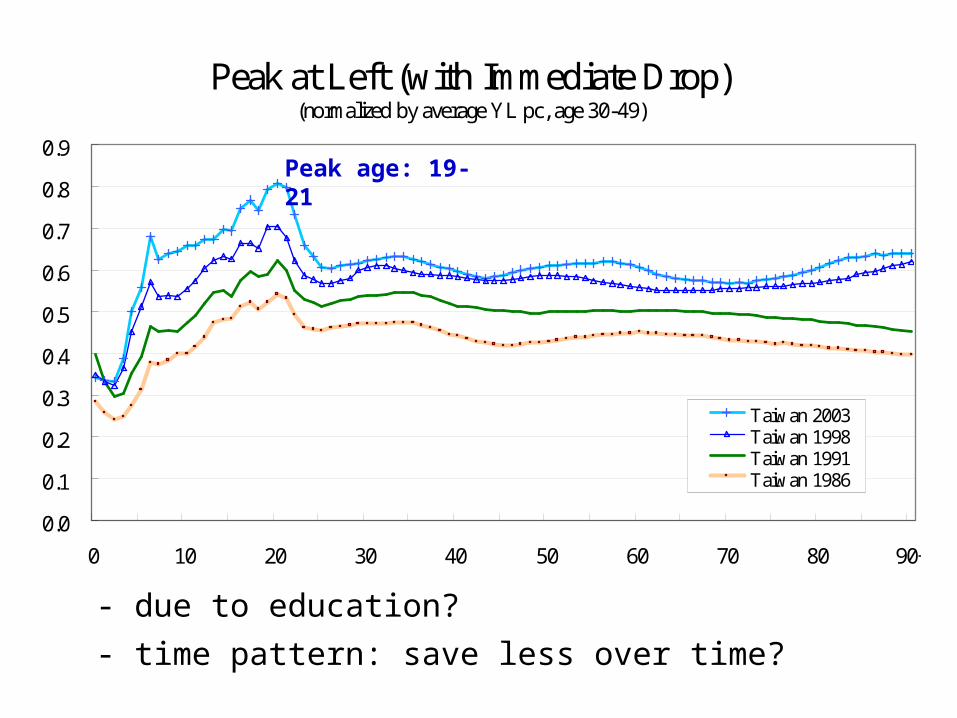
Peak at Left (with Immediate Drop)(normalized by average YL pc, age 30-49)
0.0
0.1
0.2
0.3
0.4
0.5
0.6
0.7
0.8
0.9
0 10 20 30 40 50 60 70 80 90+
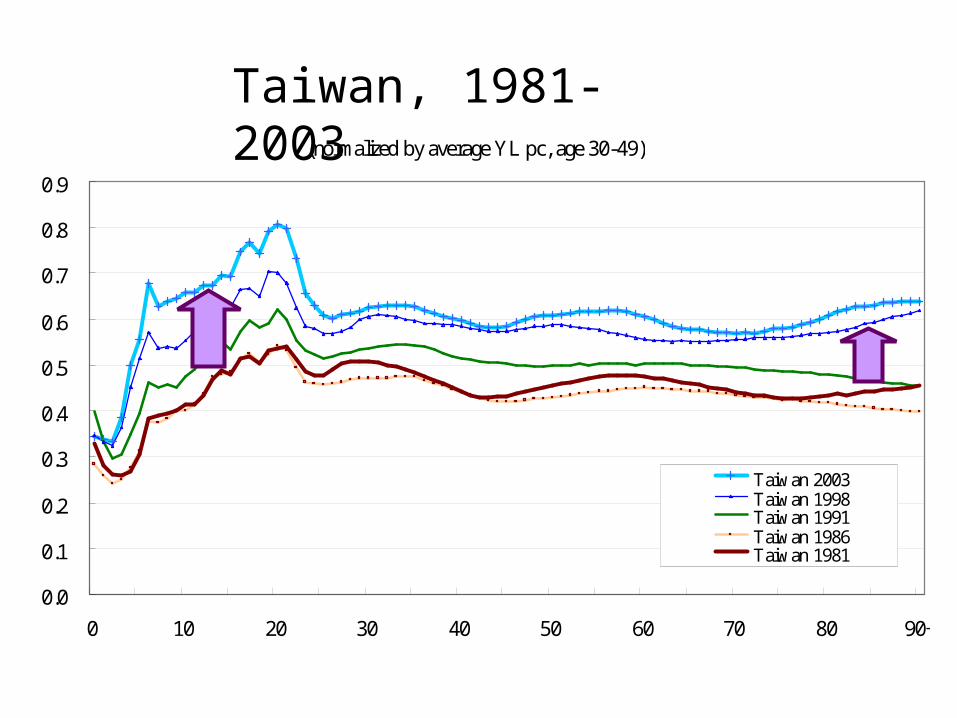
Taiwan 2003Taiwan 1998Taiwan 1991Taiwan 1986
- due to education?
- time pattern: save less over time?
Peak age: 19-21
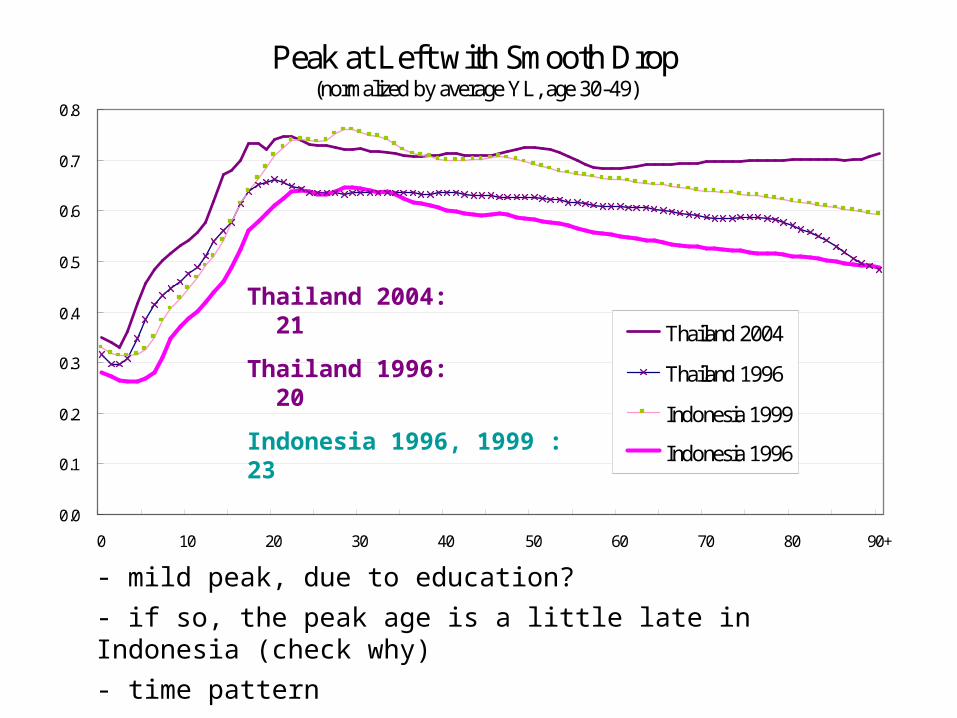
Peak at Left with Smooth Drop(normalized by average YL, age 30-49)
0.0
0.1
0.2
0.3
0.4
0.5
0.6
0.7
0.8
0 10 20 30 40 50 60 70 80 90+
Thailand 2004
Thailand 1996
Indonesia 1999
Indonesia 1996
- mild peak, due to education?
- if so, the peak age is a little late in Indonesia (check why)
- time pattern
Thailand 2004: 21
Thailand 1996: 20
Indonesia 1996, 1999 : 23
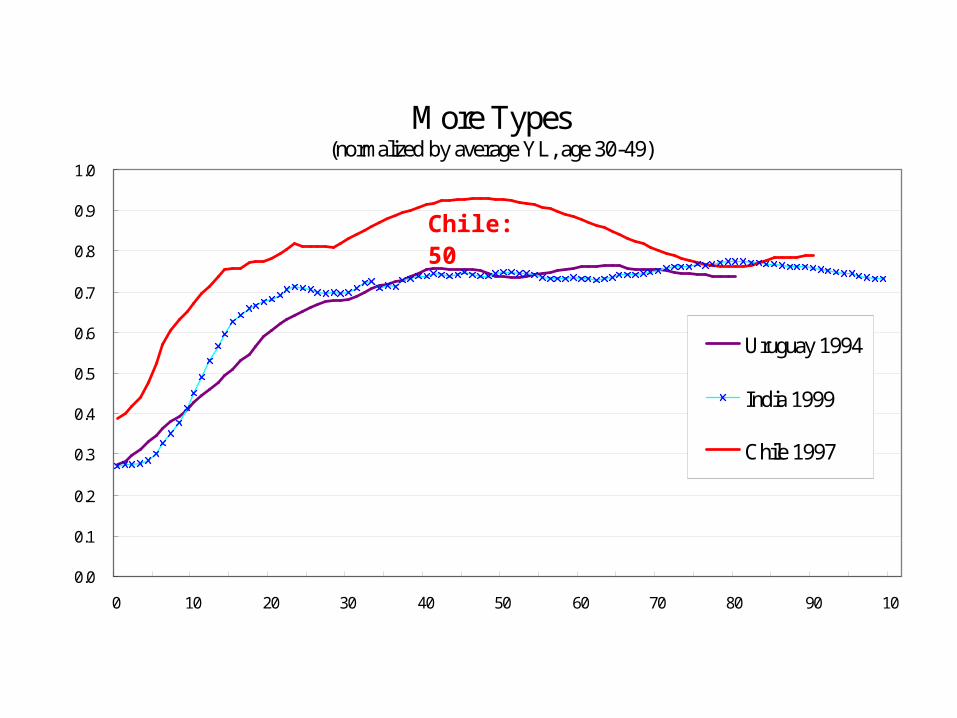
More Types(normalized by average YL, age 30-49)
0.0
0.1
0.2
0.3
0.4
0.5
0.6
0.7
0.8
0.9
1.0
0 10 20 30 40 50 60 70 80 90 10
Uruguay 1994
India 1999
Chile 1997
Chile: 50
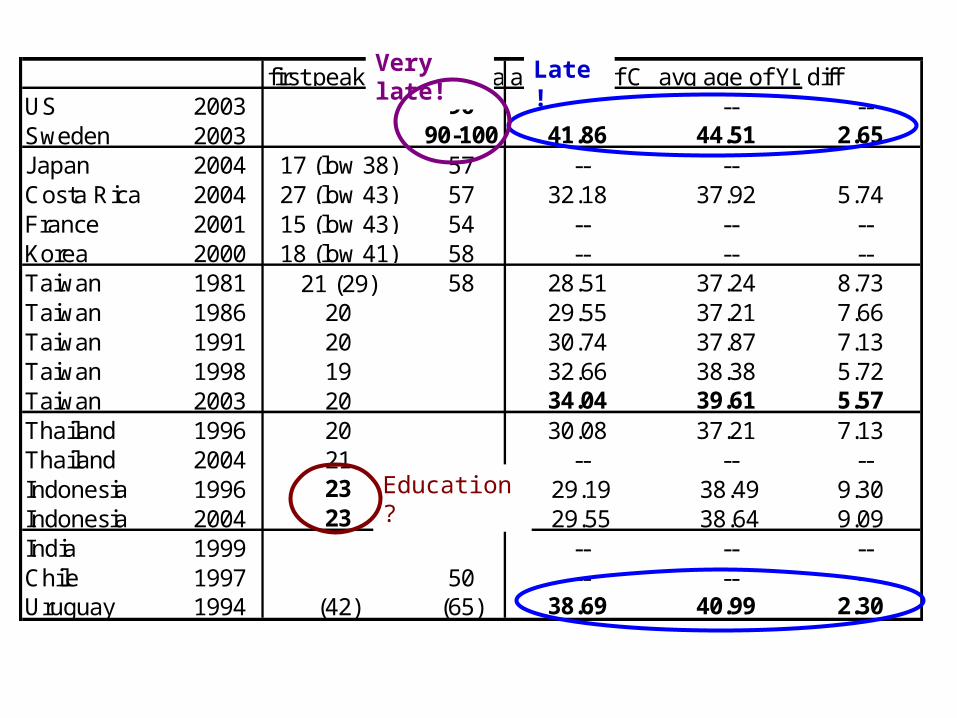
first peak age22nd peakavg age of C avg age of YLdiffUS 2003 90 -- -- --Sweden 2003 90-100 41.86 44.51 2.65Japan 2004 17 (low 38) 57 -- --Costa Rica 2004 27 (low 43) 57 32.18 37.92 5.74France 2001 15 (low 43) 54 -- -- --Korea 2000 18 (low 41) 58 -- -- --Taiwan 1981 21 (29) 58 28.51 37.24 8.73Taiwan 1986 20 29.55 37.21 7.66Taiwan 1991 20 30.74 37.87 7.13Taiwan 1998 19 32.66 38.38 5.72Taiwan 2003 20 34.04 39.61 5.57Thailand 1996 20 30.08 37.21 7.13Thailand 2004 21 -- -- --Indonesia 1996 23 29.19 38.49 9.30Indonesia 2004 23 29.55 38.64 9.09India 1999 -- -- --Chile 1997 50 -- -- --Uruguay 1994 (42) (65) 38.69 40.99 2.30
Late!Very late!
Education?
Why Different?
Differences among age groups may have to do with
(i) time: increasing over time?
(ii) composition of consumption: education, health,
others…
(iii) private or public
and financial sources: YL, asset reallocation, transfer…

Time Trend of Level and Shape
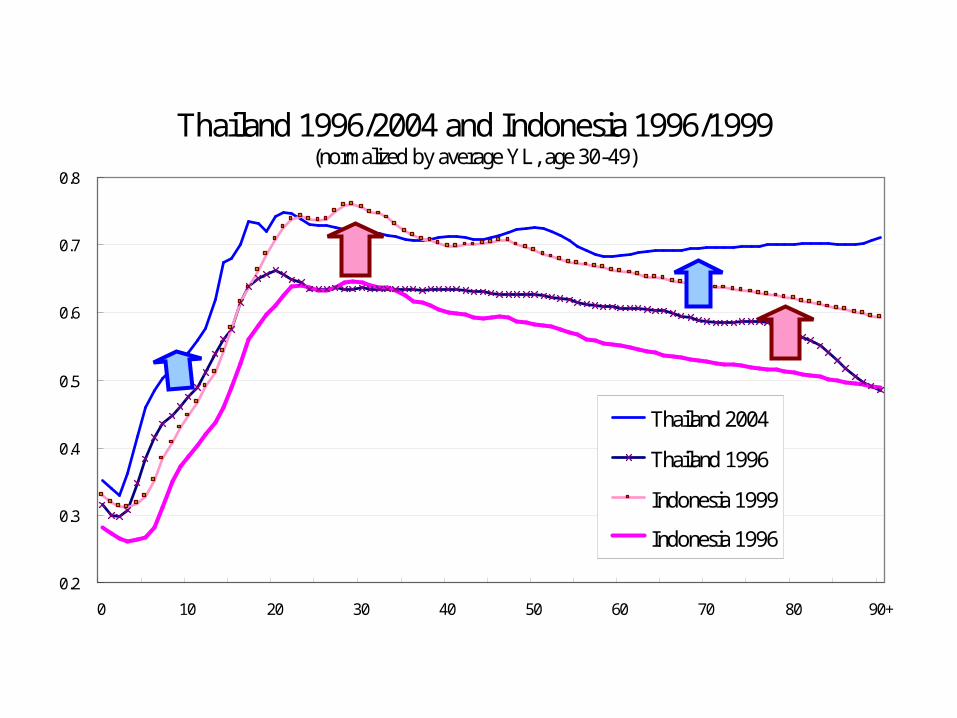
Thailand 1996/2004 and Indonesia 1996/1999(normalized by average YL, age 30-49)
0.2
0.3
0.4
0.5
0.6
0.7
0.8
0 10 20 30 40 50 60 70 80 90+
Thailand 2004
Thailand 1996
Indonesia 1999
Indonesia 1996
(normalized by average YL pc, age 30-49)
0.0
0.1
0.2
0.3
0.4
0.5
0.6
0.7
0.8
0.9
0 10 20 30 40 50 60 70 80 90+
Taiwan 2003Taiwan 1998Taiwan 1991Taiwan 1986Taiwan 1981
Taiwan, 1981-2003
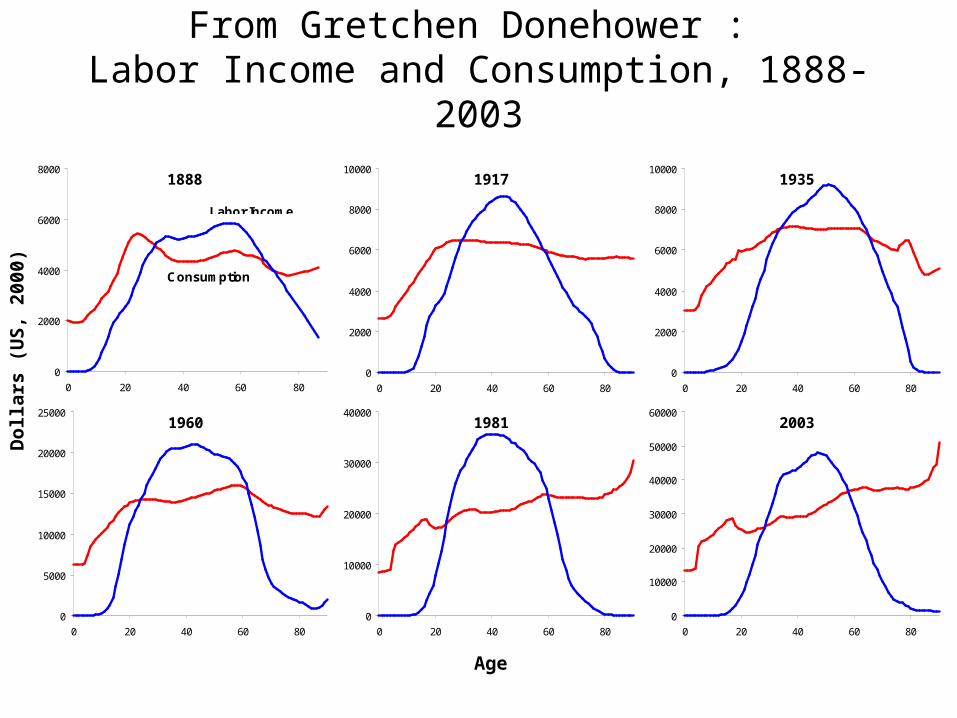
From Gretchen Donehower : Labor Income and Consumption, 1888-2003
Age
Do
llar
s (
US
, 20
00)
1888
0
2000
4000
6000
8000
0 20 40 60 80
Labor Income
Consumption
1917
0
2000
4000
6000
8000
10000
0 20 40 60 80
1935
0
2000
4000
6000
8000
10000
0 20 40 60 80
1960
0
5000
10000
15000
20000
25000
0 20 40 60 80
1981
0
10000
20000
30000
40000
0 20 40 60 80
2003
0
10000
20000
30000
40000
50000
60000
0 20 40 60 80
Composition of Consumption
1. Importance of Health and Education
2.Size of the Public Sector
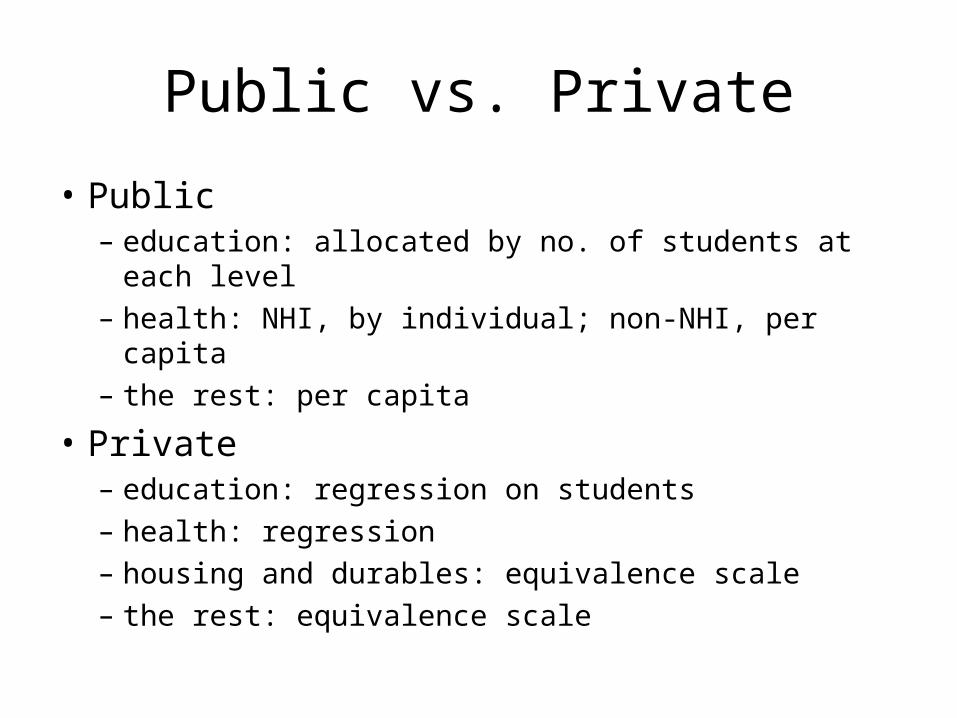
Public vs. Private
• Public – education: allocated by no. of students at each level
– health: NHI, by individual; non-NHI, per capita
– the rest: per capita
• Private– education: regression on students
– health: regression
– housing and durables: equivalence scale
– the rest: equivalence scale
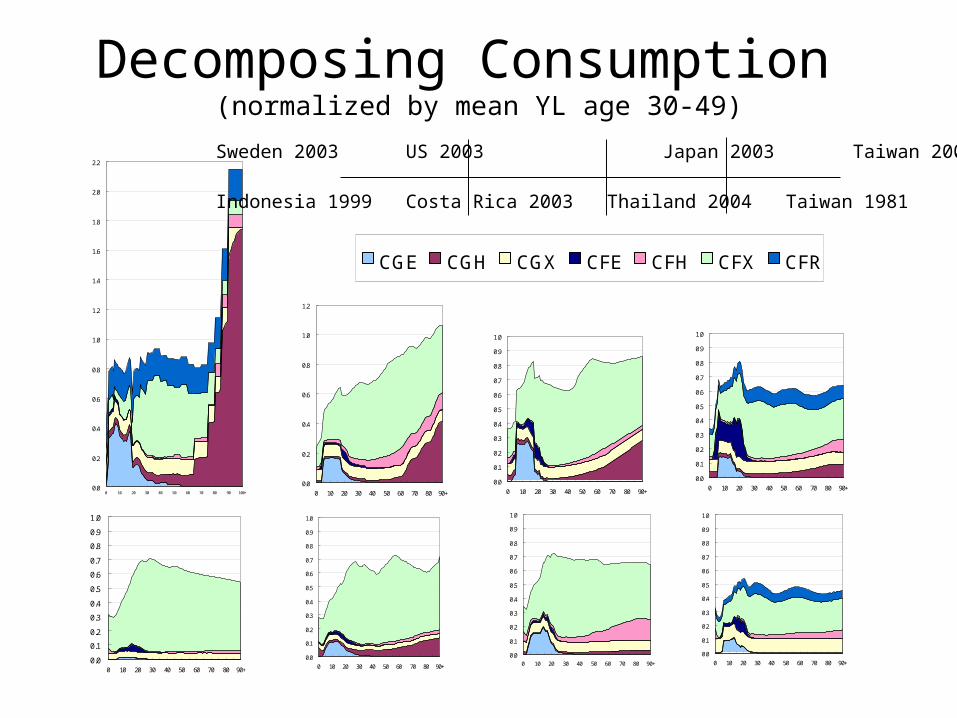
Decomposing Consumption (normalized by mean YL age 30-49)
0.0
0.2
0.4
0.6
0.8
1.0
1.2
1.4
1.6
1.8
2.0
2.2
0 10 20 30 40 50 60 70 80 90 100+
0.0
0.1
0.2
0.3
0.4
0.5
0.6
0.7
0.8
0.9
1.0
0 10 20 30 40 50 60 70 80 90+
0.0
0.1
0.2
0.3
0.4
0.5
0.6
0.7
0.8
0.9
1.0
0 10 20 30 40 50 60 70 80 90+
0.0
0.1
0.2
0.3
0.4
0.5
0.6
0.7
0.8
0.9
1.0
0 10 20 30 40 50 60 70 80 90+
0.0
0.2
0.4
0.6
0.8
1.0
1.2
0 10 20 30 40 50 60 70 80 90+
0.0
0.1
0.2
0.3
0.4
0.5
0.6
0.7
0.8
0.9
1.0
0 10 20 30 40 50 60 70 80 90+
0.0
0.1
0.2
0.3
0.4
0.5
0.6
0.7
0.8
0.9
1.0
0 10 20 30 40 50 60 70 80 90+0.0
0.1
0.2
0.3
0.4
0.5
0.6
0.7
0.8
0.9
1.0
0 10 20 30 40 50 60 70 80 90+
Sweden 2003 US 2003 Japan 2003 Taiwan 2003
Indonesia 1999 Costa Rica 2003 Thailand 2004 Taiwan 1981
0.00.40.81.21.62.02.40102030405060708090..
CGE CGH CGX CFE CFH CFX CFR
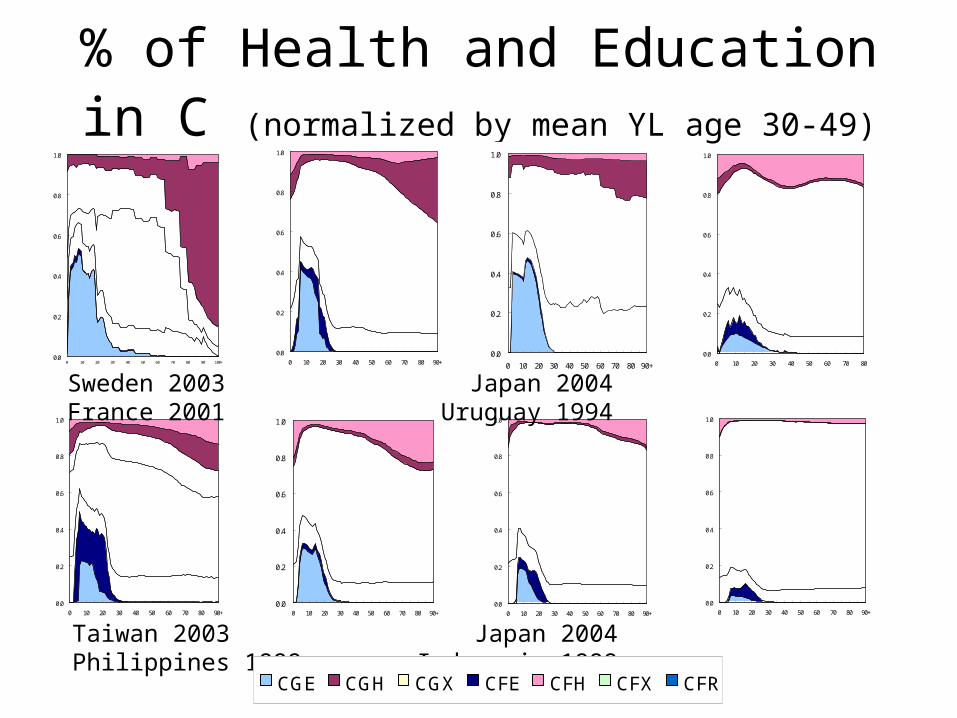
% of Health and Education in C (normalized by mean YL age 30-49)
0.0
0.2
0.4
0.6
0.8
1.0
0 10 20 30 40 50 60 70 80 90 100+
0.0
0.2
0.4
0.6
0.8
1.0
0 10 20 30 40 50 60 70 80 90+0.0
0.2
0.4
0.6
0.8
1.0
0 10 20 30 40 50 60 70 80 90+
0.0
0.2
0.4
0.6
0.8
1.0
0 10 20 30 40 50 60 70 80
0.0
0.2
0.4
0.6
0.8
1.0
0 10 20 30 40 50 60 70 80 90+0.0
0.2
0.4
0.6
0.8
1.0
0 10 20 30 40 50 60 70 80 90+
0.0
0.2
0.4
0.6
0.8
1.0
0 10 20 30 40 50 60 70 80 90+
0.0
0.2
0.4
0.6
0.8
1.0
0 10 20 30 40 50 60 70 80 90+
Sweden 2003 Japan 2004 France 2001 Uruguay 1994
Taiwan 2003 Japan 2004 Philippines 1999 Indonesia 1999
0.00.40.81.21.62.02.40102030405060708090..
CGE CGH CGX CFE CFH CFX CFR
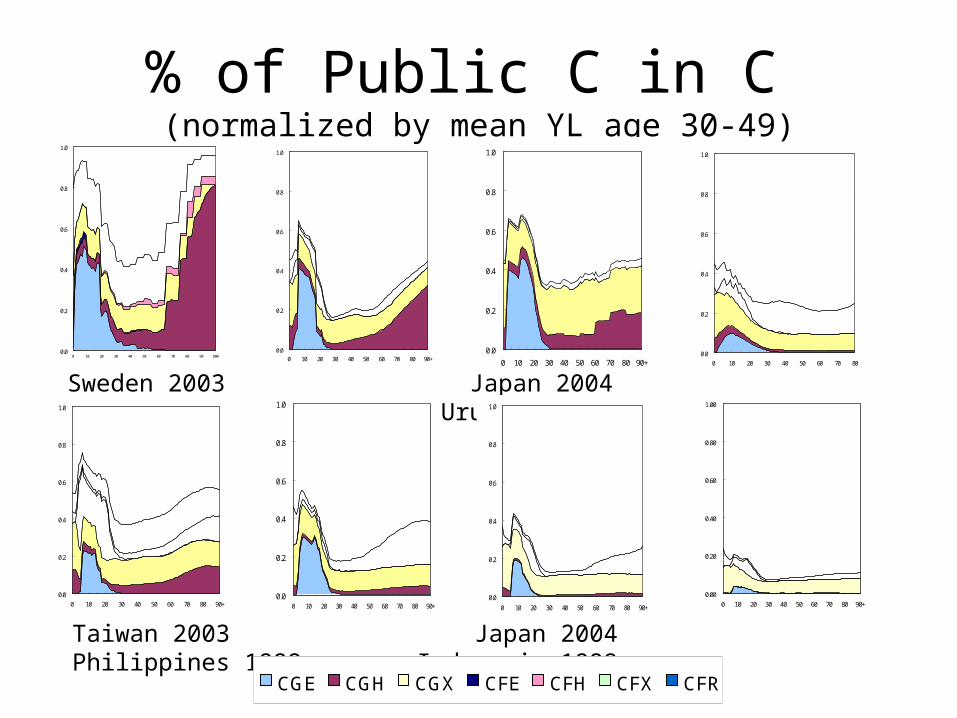
% of Public C in C (normalized by mean YL age 30-49)
Taiwan 2003 Japan 2004 Philippines 1999 Indonesia 1999
0.00.40.81.21.62.02.40102030405060708090..
CGE CGH CGX CFE CFH CFX CFR
0.0
0.2
0.4
0.6
0.8
1.0
0 10 20 30 40 50 60 70 80 90 100+
0.0
0.2
0.4
0.6
0.8
1.0
0 10 20 30 40 50 60 70 80 90+0.0
0.2
0.4
0.6
0.8
1.0
0 10 20 30 40 50 60 70 80 90+
Sweden 2003 Japan 2004 France 2001 Uruguay 1994
0.0
0.2
0.4
0.6
0.8
1.0
0 10 20 30 40 50 60 70 80
0.0
0.2
0.4
0.6
0.8
1.0
0 10 20 30 40 50 60 70 80 90+0.0
0.2
0.4
0.6
0.8
1.0
0 10 20 30 40 50 60 70 80 90+0.0
0.2
0.4
0.6
0.8
1.0
0 10 20 30 40 50 60 70 80 90+
0.00
0.20
0.40
0.60
0.80
1.00
0 10 20 30 40 50 60 70 80 90+
0.0
0.2
0.4
0.6
0.8
1.0
1.2
CFR
CFX
CFH
CFE
CGX
CGH
CGE
0.0
0.5
1.0
1.5
2.0
CFR
CFX
CFH
CFE
CGX
CGH
CGE
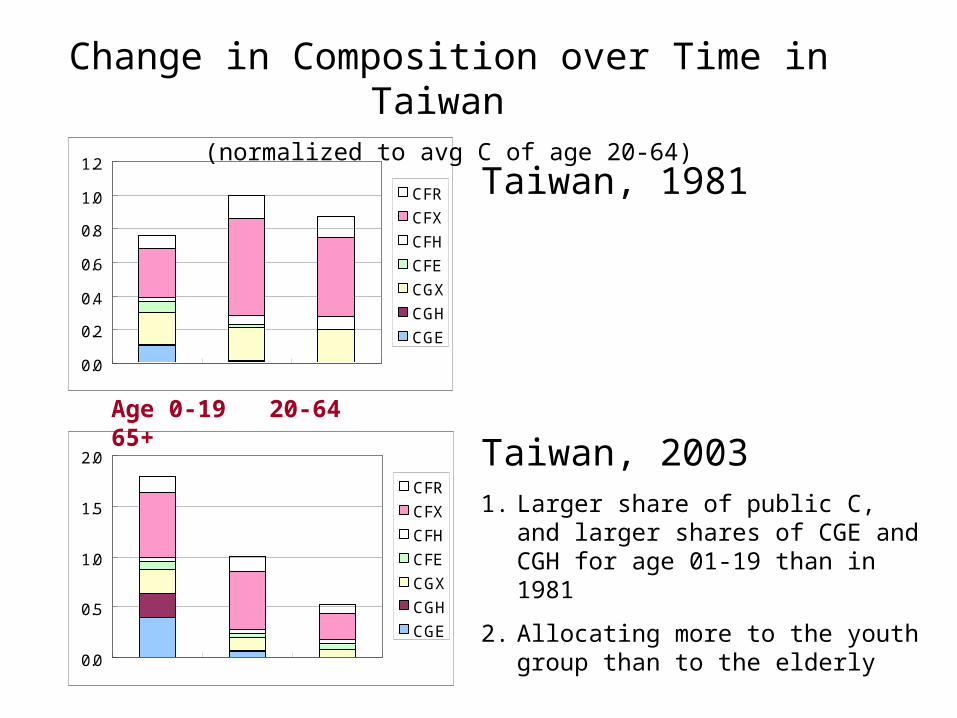
Taiwan, 1981
Taiwan, 20031. Larger share of public C, and larger shares
of CGE and CGH for age 01-19 than in 1981
2. Allocating more to the youth group than to the elderly
Age 0-19 20-64 65+
Change in Composition over Time in Taiwan (normalized to avg C of age 20-64)
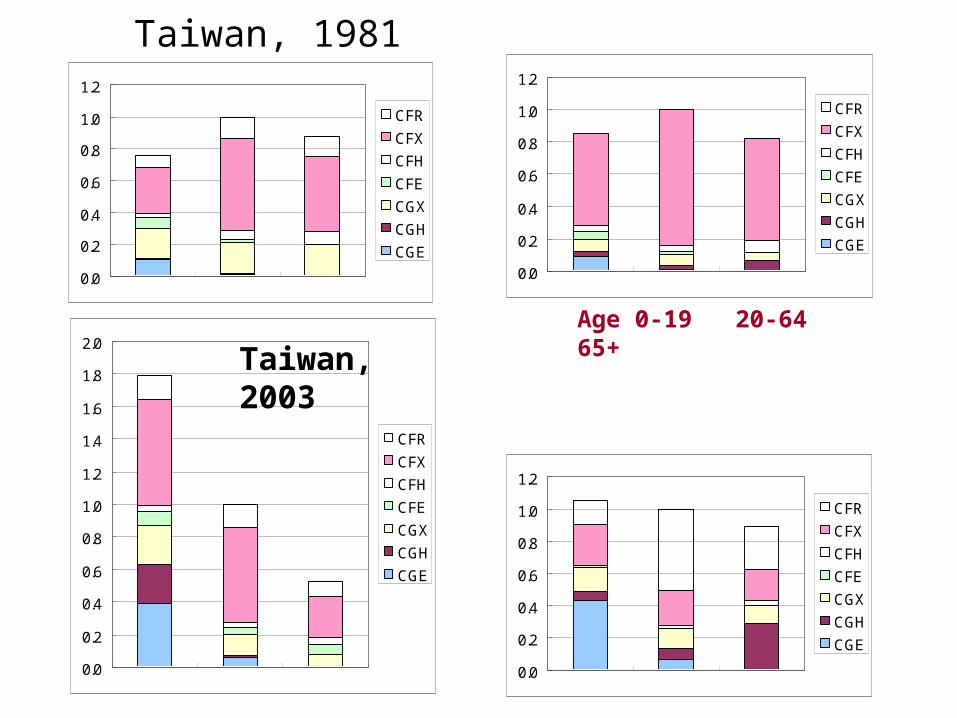
Taiwan, 1981 Chile,1997
Taiwan, 2003 Sweden, 2003
0.0
0.2
0.4
0.6
0.8
1.0
1.2
CFR
CFX
CFH
CFE
CGX
CGH
CGE
Age 0-19 20-64 65+
0.0
0.2
0.4
0.6
0.8
1.0
1.2
CFR
CFX
CFH
CFE
CGX
CGH
CGE
0.0
0.2
0.4
0.6
0.8
1.0
1.2
CFR
CFX
CFH
CFE
CGX
CGH
CGE
Age 0-19 20-64 65+
0.0
0.2
0.4
0.6
0.8
1.0
1.2
1.4
1.6
1.8
2.0
CFR
CFX
CFH
CFE
CGX
CGH
CGE
Taiwan, 2003

Issues and Questions
General Observations
1. There are differences across economies in level, shape, composition. For example, some countries have much larger public sector than the others, and some spend more on education.
2. For total C, there are four basic types.
3. Longitudinally, there may be a time trend.
Some questions
1. About trend or changes over time:- Is avg C (relative to YL) rising over time? Has this to do with GDP level or co-residence pattern?- Why does avg C drop after an early age: e.g. age 19 in Taiwan, 1998?
2. Does the increase in public consumption on health spending reduce the public consumption on education (as in the case of Taiwan)? If yes, future growth may be affected.
3. Does the increase in public consumption on health cause a decrease in private consumption on health?
4. …
Methodological Issues…
1. Same definition of education and health across countries?
(e.g., does “education” includes boarding expenditure and private tutoring?
2. Which methodology is best?


