
*Corresponding author (A. Singh) Email: [email protected], [email protected] ©2020 International Transaction
Journal of Engineering, Management, & Applied Sciences & Technologies. Volume 11 No.4 ISSN 2228-9860 eISSN 1906-9642 CODEN: ITJEA8 Paper ID:11A04H http://TUENGR.COM/V11/11A04H.pdf DOI: 10.14456/ITJEMAST.2020.68
1
International Transaction Journal of Engineering, Management, & Applied Sciences & Technologies
http://TuEngr.com
PAPER ID: 11A04H
COMPETENCY AND MARKETING PERFORMANCE
MEASUREMENT OF SAUDI ARABIAN FOOD & DRINK
PRODUCTS IN SAUDI ARABIA OF MIDDLE EAST REGION
Ajay Singh a*
a College of Business Administration, University of Hail, KINGDOM OF SAUDI ARABIA.
A R T I C L E I N F O
A B S T R A C T
Article history:
Received 28 June 2019 Received in revised form 08
November 2019
Accepted 18 November 2019
Available online 05 December
2019
Keywords: Food products; Drink products; Energy Drinks;
Customer satisfaction; Saudi Arabia; Gulf region; Health conscious products.
This paper investigates and measures the competency and
performance of food & drink products of various organizations of Saudi
Arabia in the Middle East region. The study primarily uses organizations,
past data and records, and, secondly, customer satisfaction surveys by
applying a structured questionnaire. The areas of the research focus on a
variety of food & drink products, customer satisfaction, Industry
resources, and socio-economic impact on the country. The key findings
of the study focus on the determination of distinguishing performances
and customers’ expectations. Measuring the performance of these
products emphasize immediate and meaningful outcomes from the
Industry and customer’s preferences and expectations. The competency &
performance of the food & drink products have evaluated with defined
satisfaction criteria that show the opinion of the people about these
varieties of products of Saudi Arabian companies. This study finds that
customers are happy with the products. However, producers must further
enhance product quality to meet and compete with new products entering
the market.
Disciplinary: Business Management (Marketing).
©2020 INT TRANS J ENG MANAG SCI TECH.
1. INTRODUCTION Competency and Performance measurement through the customer satisfaction concept has
accepted by many organizations and competitors in the time of globalization is the key to success
for them (Singh, 2016). Also, it has explained with the customer relationship and product quality &
services, price & value of the products, customers' long term relationship with the product, and
customers' expectations with product & services. Employee's competencies contribute to a firm's
entire performance, so the firms need to enhance the employee's learning opportunities at their
workplace to attain high performance along with competencies development (Osei & Ackah 2015).
Competitors recognized customer satisfaction as a critical business strategy to profit growth and
increase in market share (Singh, 2016). Consumer's high disposable income created Saudi Arabia as
©2020 International Transaction Journal of Engineering, Management, & Applied Sciences & Technologies

2 Ajay Singh
an inspirational destination and an attractive marketplace for investors seeking long-term growth
(BMI, 2018). Promotion emphasizes brand strengths across segments, and an intensive distribution
network has maintained locally, with new channels aimed in Middle Eastern as well as southeast
Asian markets (Sadi et al., 2007). The findings of various past researches about customer
satisfaction have used to sketch out the plan to emphasize companies' performance and target
outcome (Singh, 2016). In a survey of 200 senior marketing managers, 71 percent agreed that the
customer satisfaction metric is very useful in managing and monitoring their businesses (Farris et
al., 2010). Many companies have policies to incorporate competency and performance
measurement through customer satisfaction into their strategic vision and mission statement. Berry
& Parasuraman (1991) have provided the basis to measure a gap between the customer expectation
of performance and their perceived experience of performance. Eroglu et al. (1990) evaluated his
research along with a seven-point scale, and within these, six items based on ATM services and ice
cream restaurants.
1.1 SAUDI ARABIAN MARKET: A SNAPSHOT
Kingdom of Saudi Arabia (KSA) is the largest market of high-value packaged and processed
food in the Gulf region, with 33 million youth population having a large portion of expatriates
(BMI, 2018). The market has high income-potential in the Arab world with a trade-oriented
business environment. People 85% living in urban areas and around one-fifth of the Saudi
population comprise expatriates. The KSA is divided into 13 regions, and Makkah is the holiest city
in Saudi Arabia, over 7 million people, as it is the destination for hajj (pilgrimage) for all Muslims
throughout the world. The strength of the Saudi market is the sheer size of the local population, as it
constitutes 2/3rd of the total Gulf population in the Middle East region, which provides significant
long-term growth opportunities for the retail sector. Non-alcoholic drink market-driven industry
growth in Saudi Arabia has opened up more opportunities and broader growth for investors from
2018 onwards.
The country has an excellent infrastructure for international market players with a strong
logistical network. It has established a significant market in the Middle East, Europe, Africa, and
Asia and have very well facilitated with shipping, aviation, and transportation. Saudi Arabia is
among the largest member facilitators of goods and services in Gulf countries. Vision 2030 and
National Transformation Programme (NTP, 2020) initiated to achieve the goal of economic
diversification in the country. The country's infrastructure has considered performing well, ranking
29th in the World (WEF, 2016-2017) with 2nd
rank in MENA (Middle East, North Africa,
Afghanistan, and Pakistan) region.
Regarding cross-border trade, KSA ranks 158th out of 190 (World Bank, 2017). KSA become a
member of the World Trade Organization (WTO) in 2005. The official language is Arabic, while the
English language has widely accepted and spoken in the country. Ramadan is a holy period for the
Muslims, they have fasting during the period, and non-Muslims are supposed not to eat or drink in
public places during the same period.
The considerable advantage for foreign investors and companies are in the tax system
governance of the country. KSA has a high-value growth-driven market for food & drink products
having a traditional culture and strong Islamic belief and value (Rahman, 2014). The Kingdom
introduced an additional tax on unhealthy products, e.g., soft drinks and tobacco. The non-alcoholic

*Corresponding author (A. Singh) Email: [email protected], [email protected] ©2020 International Transaction
Journal of Engineering, Management, & Applied Sciences & Technologies. Volume 11 No.4 ISSN 2228-9860 eISSN 1906-9642 CODEN: ITJEA8 Paper ID:11A04H http://TUENGR.COM/V11/11A04H.pdf DOI: 10.14456/ITJEMAST.2020.68
3
drink industry is one of the dynamic industries in the Kingdom, and the use of alcoholic beverages
has strictly prohibited inside the country (BMI, 2018). Only Halal meat has consumed, and Pork or
Pork products have strictly banned throughout the Kingdom (EU, 2017). Agri-food production has
constrained by climate conditions of the country, and production has limited for the products due to
low water intensity. The Saudi Arabian General Investment Authority (SAGIA) encourages foreign
investors and facilitates them. All foods, drinks, and edible agricultural products, whether locally
manufactured or imported to Saudi Arabia, are required to comply with regulations and standards
set by the SFDA (Saudi Food & Drug Authority) or the Gulf Standardizations Organization (GSO).
The introduction of Value Added Tax (VAT) has shifted consumer preferences from energy drinks
and Carbonated drinks to healthier products (BMI, 2018).
The Saudi dairy industry is booming with the growing population, and so is the high demand. It
has the largest market for soft drinks in the Middle East, having the largest soft drink consumers in
the world (DSM, n.d). The healthier products such as juice and other non-alcoholic drinks become
popular among the consumers and are using as alternatives to carbonated beverages. Also, fresh
meats, fruits, and vegetable consumption are increasing in the Kingdom due to rising health
awareness among the people. Honey has been using for general and medicinal purposes. It has
consumed for homeopathic remedies, teas, and other food and beverages. Olive’s oil has also
increased a better growth opportunity for processing food & vegetables in the country. Chocolate
and consumption of confectionery products have dramatically increased over the past years. The
consumption of wheat is high in the Kingdom, and most of the cereal grain consumption has based
on wheat-based products (EU, 2017).
2. PERFORMANCE OF FOOD & DRINK PRODUCTS
As a member of the Gulf Cooperation Council (GCCs) common market, Saudi Arabia provides
a lower-cost export base than its neighbor countries. It is a right business place of entry for investors
seeking long-term business growth. Saudi Arabia is the largest dairy industry in the Gulf region and
is the market for high-value packaged and processed foods. The Saudi Arabian market becomes
more secure for the investors due to the Middle East and North African political crisis
comparatively with some other countries in the region, its customers are price-conscious, relatively
than UAE, Kuwait, or Qatar. Increasing habits of health consciousness have increased the
opportunities for food producers in this region also, the increased demand for organic foods. The
food-processing sector of the country is also continuing to attract investors, particularly its key
business segments, such as dairy products (BMI, 2014).
Saudi Arabia is the largest market in the Gulf region of the Middle East has a high per capita
consumption of soft drinks dealing with bottled water, fruit juice, and carbonate segments. Tea and
coffee consumption is also at a very high level as it is an integral part of the local Saudi culture. The
taste and preferences of Saudi consumers towards the branded product is very high, and a large
segment of the population is interested in new and innovative products. The Saudi Arabian economy
remains attractive for the investors as they found it most secure place in the Middle East reason due
to its high oil prices, government spending, and high customer confidence. The soft drinks industry
has shown the promising value and an increasing trend in the growth in past years. Its major
growing products are the bottled water and fruit juice segments. Besides, the energy drinks added

4 Ajay Singh
continuing strength as the soft drinks in the business of drink products. The hot drink products such
as teas, herbal tea, and fruit tea, become very popular and showing substantial growth opportunities
in this region. The dairy industry of Saudi Arabia in the Gulf region is most competent, and the
country leading company in this field is Almarai, the largest dairy company with a high market
share. Also, the leading players in the fruit and Juice are Almarai, Alsafi; other market players are
Hail Agricultural Development Company, AlsafiDanme, SADAFCO, Zamzam Cola (carbonate),
and Red Bull (energy drink).
The historical data of food consumption shows that food sales have increased from Saudi Riyal
(SR)144,946.6 million in 2015 to Saudi Riyal (SR)154, 633 million in 2017. While the percentage
of growth year-over-year has decreased from 8.6% to 1.9% in 2018. On the other hand, the sales of
drink products have increased from Saudi Riyal (SR) 12,862 million in 2015 to 13,733 million in
2017. While the percentage of growth year-over-year has decreased from 8.8% in 2015 to 1.9% in
2017 (BMI, 2018).
3. REVIEW OF LITERATURE
Competency and performance of food & drink products have ultimately affected by customer
satisfaction. It is because the company needs to take action to improve quality and create value
among its customers through the product and services. Lucas et al. (2014), in his research, examined
and evaluated the human performance benefits and potential harms associated with Energy drinks.
Al-Islam and Fari (2014) examined a group of people for energy drinks consumption, related
behaviors, and lifestyle factors. The findings of the survey reveal that energy drinks have consumed
at a relatively high rate amongst adolescents and adults. Musaiger and Zagzoog, (2014) examined
the knowledge, attitude, and intake of energy drinks among adolescents in Saudi Arabia through
applying multistage sampling over 1061 school-children of age group 12-19 years using a survey
questionnaire. The findings of the study reveal an alarming situation relating to energy drinks
consumption among Saudi adolescents and their unawareness of its side effects. Ismaiel et al. (2014)
analyze the significant factors that influence the consumption, expenditure pattern, and demand of
honey in Saudi Arabia using the econometric model on primary data. The findings suggest that
honey is an essential commodity in Saudi Arabia. Tamime et al. (2014), carried out a survey-based
study of the of fermented milk products from many countries. Gillan (2014) highlighted the strong
business opportunities for many different products and services in the KSA. Muhammad (2014)
reviewed the challenges facing the Saudi Arabian Dairy Industry dominated by a few companies
engaged in aggregation price war strategies. The study discussed the key player and the main drivers
for milk production and consumption in detail. Diduch et al. (2013) described how various factors
relating to treating water, how the finished product is stored, and transported might affect the quality
of bottled water. The study emphasizes increasing contamination by organic compounds in bottled
water. Samir (1998) focuses on nutritional problems in Arab countries due to changes in food
consumption patterns.
Sadi and Henderson (2007), examined how Al‐Marai and dairy food businesses use the strategy
of market penetration to beat the competition by offering quality merchandise across the Middle
East. Al-Otaibi and Robinson (2002) conducted a study on the dairy industry in Saudi Arabia to
know the current situation of the industry and to know the prospects of the industry and business in
the country. Grigg (1998), focused on the changing geography of world food consumption in the

*Corresponding author (A. Singh) Email: [email protected], [email protected] ©2020 International Transaction
Journal of Engineering, Management, & Applied Sciences & Technologies. Volume 11 No.4 ISSN 2228-9860 eISSN 1906-9642 CODEN: ITJEA8 Paper ID:11A04H http://TUENGR.COM/V11/11A04H.pdf DOI: 10.14456/ITJEMAST.2020.68
5
second half of the twentieth century. The socio-cultural factors such as religion, beliefs, food
preferences, gender discrimination, education and women employment, all have a noticeable
influence on food consumption patterns of the people of Saudi Arabia and Mass media (Musaiger,
1993).
This research assesses how well food & drink products are satisfying customer’s needs and
expectations in Saudi Arabia and identifies factors that contribute to customer’s satisfaction and
dissatisfaction with the Saudi Company’s food & drink products.
4. RESEARCH DESIGN
The research uses content analysis and the primary data collected from customers of different
age groups of both male & female from Saudi Arabia in the Middle East region. It uses secondary
sources of data are various food & drink companies’ published annual reports, published research
papers, and published articles, the data collected from Hail and Qassim province of Saudi Arabia.
The data collected through a structured questionnaire consists of various independent dimensions,
with a five-point Likert scale, as strongly agree (5-1) to strongly disagree. With a total of 500
questionnaires random distributed to different age groups of the population, from January to June
2019, 330 respondents have returned the answers. This study reports a simple analysis.
Table 1: Demographic Characteristics of Respondents from the survey of this study S.N. Variables Count %
1. Gender Male 284 86.06
Female 46 13.93
2. Marital Status Single 194 58.79
Married 136 41.21
3. Respondents Customer 244 73.94
Retailer 86 26.06
4. Age (Years) Less than 14 80 24.25
15 -19 46 13.94
20-24 53 16.06
25-34 52 15.76
35 -44 40 12.12
45 -54 32 9.70
55-65 27 8.18
65 and Above 0 0.00
5. Education Up to Secondary 114 34.54
Undergraduate 132 40.00
Graduate and above 54 16.37
Other Categories 30 9.09
6. Income Level
in Saudi Arabian Riyal(SAR)
Less than 3000 SR 31 9.39
3000- 5000 SR 62 18.79
5001-10000 SR 91 27.58
10001 -20000 SR 102 30.91
20001 and Above 44 13.33
7. Source of Income Parents 62 18.79
Jobs 111 33.64
Government and parents 113 34.24
Any other 44 13.33
8. Personal
Expenditure
Less than 1000 SAR 54 16.37
1001 -2000 SAR 153 46.36
2001 -3000 SAR 83 25.15
3000 and Above 40 12.12
6 Ajay Singh
5. FINDINGS
Table 1 shows the distribution of demographic characteristics of customers who were
participants in the study. It is evident from the table that about 86% of respondents were males out of
330 of the total samples. The respondents who were less than 14 years of age are 24.25 %, and the
majority of respondents (60%) were young (15-34 years old). Undergraduate participants were
highest at 40%. 1. More than 13% of respondents have their monthly income 20000SR and more. Only 9% of
have their monthly income less than 3000SR. For personal income sources, the survey results
show that more than 36% of the respondents were doing their job and are self-dependent, and 34%
of respondents were dependent on the government and their parents. 19% were dependents on their
parents only. The highest personal expenditure level in Saudi Arabia, 46.36% lies between 1000SR
to 2000SR in a month and only 12% spend more than 3000SR in a month for their expense.
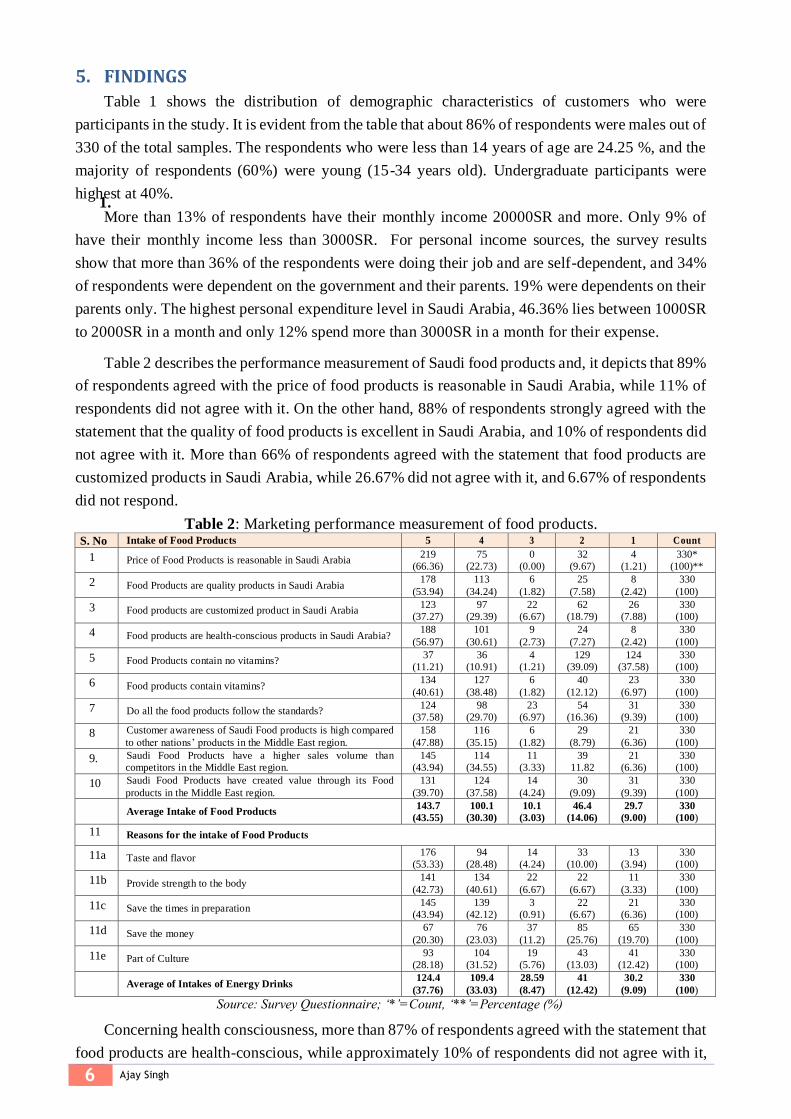
Table 2 describes the performance measurement of Saudi food products and, it depicts that 89%
of respondents agreed with the price of food products is reasonable in Saudi Arabia, while 11% of
respondents did not agree with it. On the other hand, 88% of respondents strongly agreed with the
statement that the quality of food products is excellent in Saudi Arabia, and 10% of respondents did
not agree with it. More than 66% of respondents agreed with the statement that food products are
customized products in Saudi Arabia, while 26.67% did not agree with it, and 6.67% of respondents
did not respond.
Table 2: Marketing performance measurement of food products. S. No Intake of Food Products 5 4 3 2 1 Count
1 Price of Food Products is reasonable in Saudi Arabia 219
(66.36)
75
(22.73)
0
(0.00)
32
(9.67)
4
(1.21)
330*
(100)**
2 Food Products are quality products in Saudi Arabia 178
(53.94)
113
(34.24)
6
(1.82)
25
(7.58)
8
(2.42)
330
(100)
3 Food products are customized product in Saudi Arabia 123
(37.27)
97
(29.39)
22
(6.67)
62
(18.79)
26
(7.88)
330
(100)
4 Food products are health-conscious products in Saudi Arabia? 188
(56.97)
101
(30.61)
9
(2.73)
24
(7.27)
8
(2.42)
330
(100)
5 Food Products contain no vitamins? 37
(11.21)
36
(10.91)
4
(1.21)
129
(39.09)
124
(37.58)
330
(100)
6 Food products contain vitamins? 134
(40.61)
127
(38.48)
6
(1.82)
40
(12.12)
23
(6.97)
330
(100)
7 Do all the food products follow the standards? 124
(37.58)
98
(29.70)
23
(6.97)
54
(16.36)
31
(9.39)
330
(100)
8 Customer awareness of Saudi Food products is high compared
to other nations’ products in the Middle East region.
158
(47.88)
116
(35.15)
6
(1.82)
29
(8.79)
21
(6.36)
330
(100)
9. Saudi Food Products have a higher sales volume than
competitors in the Middle East region.
145
(43.94)
114
(34.55)
11
(3.33)
39
11.82
21
(6.36)
330
(100)
10 Saudi Food Products have created value through its Food
products in the Middle East region.
131
(39.70)
124
(37.58)
14
(4.24)
30
(9.09)
31
(9.39)
330
(100)
Average Intake of Food Products 143.7
(43.55)
100.1
(30.30)
10.1
(3.03)
46.4
(14.06)
29.7
(9.00)
330
(100)
11 Reasons for the intake of Food Products
11a Taste and flavor 176
(53.33)
94
(28.48)
14
(4.24)
33
(10.00)
13
(3.94)
330
(100)
11b Provide strength to the body 141
(42.73)
134
(40.61)
22
(6.67)
22
(6.67)
11
(3.33)
330
(100)
11c Save the times in preparation 145
(43.94)
139
(42.12)
3
(0.91)
22
(6.67)
21
(6.36)
330
(100)
11d Save the money 67
(20.30)
76
(23.03)
37
(11.2)
85
(25.76)
65
(19.70)
330
(100)
11e Part of Culture 93
(28.18)
104
(31.52)
19
(5.76)
43
(13.03)
41
(12.42)
330
(100)
Average of Intakes of Energy Drinks 124.4
(37.76)
109.4
(33.03)
28.59
(8.47)
41
(12.42)
30.2
(9.09)
330
(100)
Source: Survey Questionnaire; ‘*’=Count, ‘**’=Percentage (%)
Concerning health consciousness, more than 87% of respondents agreed with the statement that
food products are health-conscious, while approximately 10% of respondents did not agree with it,

*Corresponding author (A. Singh) Email: [email protected], [email protected] ©2020 International Transaction
Journal of Engineering, Management, & Applied Sciences & Technologies. Volume 11 No.4 ISSN 2228-9860 eISSN 1906-9642 CODEN: ITJEA8 Paper ID:11A04H http://TUENGR.COM/V11/11A04H.pdf DOI: 10.14456/ITJEMAST.2020.68
7
and 2.73% of respondents didn’t answer. Asking about a negative relationship with food and
vitamins’, only 21% of respondents agreed with the statement that food Products contain no
vitamins, while approximately 77% did not agree with it. Opposite to it, asking about positive
relationships with food and vitamins’ 79% of respondents agreed with the statement that food
products contain vitamins, while approximately 19% of respondents did not agree with it. About the
competency and performance standards of food products, 67% of respondents agreed with the
statement that all the food products are standard while approximately 26% of respondents did not
agree with it. Asking on consumer awareness, more than 85% of respondents agreed with the
statement that customer awareness of Saudi food products is high comparatively than foreign food
products in the Middle East region while approximately 15% of respondents did not agree with it.
Also, more than 78% of respondents agreed with the statement that Saudi food products have higher
sales volume than its competitors in the Middle East region, while approximately 18% of
respondents did not agree with it. On value creation through Saudi food products, more than 77%
of respondents agreed with the statement that Saudi food products had created value in the Middle
East region while 18.5% of respondents did not agree with this statement.
Table 3: Performance Measurement Drink Products
Source: Survey Questionnaire; ‘*’=Count, ‘**’=Percentage (%)
S. No Intake of Drink Products 5 4 3 2 1 Count
1 Prices of Drink Products are reasonable? 209
(63.33)
79
(23.94)
0
(0.00)
34
(10.30)
8
(2.42)
330*
(100)**
2 Drink products are energy product in Saudi
Arabia?
168
(50.91)
123
(37.27)
7
(2.12)
24
(7.27)
8
(2.42)
330
(100)
3 Drink products contain caffeine? 43
(13.03)
47
(14.24)
29
(8.79)
132
(40.00)
79
(23.94)
330
(100)
4 Drink products are quality products in Saudi
Arabia?
178
(53.94)
103
(31.21)
5
(1.52)
26
(7.88)
18
(5.45)
330
(100)
5 Drink products are customized product in Saudi
Arabia?
99
(30.00)
87
(26.36)
14
(4.24)
66
(20.00)
64
(19.39)
330
(100)
6 Drink products contain vitamins? 104
(31.52)
97
(29.39)
18
(5.45)
68
(20.61)
43
(13.03)
330
(100)
7 Energy drinks to be the same as soft drinks? 39
(11.82)
43
(13.03)
23
(6.97)
134
(40.61)
91
(27.58)
330
(100)
8 Level of Customer awareness of Saudi Drink
products comparatively higher than other nations’
products in Middle East region.
147
(44.55)
106
(32.12)
11
(3.33)
37
(11.21)
29
(8.79)
330
(100)
9 Saudi Drink Products have higher sales volume
comparatively than other companies in the Middle
East region.
149
(45.15)
119
36.06
10
(3.03)
33
(10.00)
19
(5.76)
330
(100)
10 Saudi Arabia has created value through its Drink
products in the Middle East region.
141
(42.73)
114
(34.55)
16
(4.85)
29
(8.79)
30
(9.09)
330
(100)
Average Intake Food products 127.7
(38.70)
91.8
(27.82)
13.3
(4.03)
58.3
(17.67)
38.9
(11.79)
330
(100)
Reasons for Intake of Energy Drink Products
a Taste and flavor 196
(59.39)
77
(23.33)
8
(2.42)
36
(10.91)
13
(3.94)
330
(100)
b Energize body 87
(26.36)
66
(20.00)
22
(6.67)
78
(23.64)
77
(23.33)
330
(100)
c Build the body 33
(10.00)
36
(10.91)
19
(5.76)
146
(44.24)
96
(29.09)
330
(100)
d Follow the friends/ Colleague 147
(44.55)
96
(29.09)
9
(2.73)
54
(16.36)
24
(7.27)
330
(100)
e Just for Trial 94
(28.48)
89
(26.97)
29
(8.79)
77
(23.33)
41
(12.42)
330
(100)
Average of Intakes of Energy Drink Products 111.4
(33.76)
72.8
(22.06)
17.4
(5.27)
78.2
(23.70)
50.2
(15.21)
330
(100)

8 Ajay Singh
Table 3 is related to the Performance Measurement of drink products in Saudi Arabia in the
Middle East region. The table results show that 87% of respondents agreed with this statement that
prices of drink products are reasonable in Saudi Arabia, and 13% of respondents did not agree with
it. Similarly, 88% of respondents strongly agreed with the statement that drink products are energy
products in Saudi Arabia, while 10% of respondents did not agree with it. Further, 27% of
respondents agreed with this statement that drink products contain caffeine, while 64% did not agree
with it. About quality consciousness, more than 85% of respondents agreed with the statement that
drink products are quality products in Saudi Arabia, while approximately 13% of respondents did
not agree with it.
About product customization, 56% of respondents agreed with the statement that drink
products are customized products in Saudi Arabia, while approximately 39% did not agree with it.
About positive relation with drink products and vitamins, 61% of respondents agreed with the
statement that drink products contain vitamins while 34% of respondents did not agree with it.
Concerning energy drinks and soft drinks, only 25% of respondents agreed with the statement that
energy drinks are the same as soft drinks, while 68% of respondents did not agree with it.
For consumer awareness, more than 77% of respondents agreed with the statement that the
level of customer awareness about Saudi drink products is comparatively higher than foreign drink
products in the Middle East region while 20% of respondents did not agree with it. Also, more than
81% of respondents agreed with the statement that Saudi drink products have higher sales volume
than its competitors in the Middle East region, while approximately 16% of respondents did not
agree with it. In terms of value creation through Saudi drink products, more than 77% of
respondents admitted that Saudi drink products had created value in the Middle East region while
18% of respondents did not agree with it.
Figure 1: Food & Drink products and Customer
satisfaction.
Figure 2: Reason for Intake of Food/Energy
Drinks and Average Customer Satisfaction.
Figure 1 shows that on average, more than 74 % to 75% of respondents agreed that Saudi food
& drink products are competent and performing substantially in the Middle East region while only a
few of the respondents didn’t agree with it. Customer satisfaction is dependent on the competency
and performance measurement of the products. It is to be measured by product quality, product
price, health consciousness, taste and flavor, and product customization with the country culture.
Figure 2 shows that the respondents show a favorable response to the intake of food & drink
products, and on average, customers get satisfied. The three reasons for taking/liking of food
0
50
100
150
200
Stronglyagree
Agree Don'tKnow
Disagree Stronglydisagree
Food and Drink products and Customer satisfaction
Food Products Drink Products
Re
spo
nd
en
ts (P
eo
ple
)
0
50
100
150
200
Stronglyagree
Agree Don'tKnow
Disagree Stronglydisagree
Reason for Intake of Food /Energy Drink and Average Customer Satisfaction
Food Products Drink Products
Re
spo
nd
en
ts (P
eo
ple
)

*Corresponding author (A. Singh) Email: [email protected], [email protected] ©2020 International Transaction
Journal of Engineering, Management, & Applied Sciences & Technologies. Volume 11 No.4 ISSN 2228-9860 eISSN 1906-9642 CODEN: ITJEA8 Paper ID:11A04H http://TUENGR.COM/V11/11A04H.pdf DOI: 10.14456/ITJEMAST.2020.68
9
products are ‘Taste and flavor,’ ‘Provide strength to the body,’ and ‘Save the times in preparation.’
The data shows that 89% of respondents take food products due to its taste and flavor. 83 % of
respondents take food products because these provide strength to the body and, 86% of respondents
take these products as they think that these products save time in preparation/cooking. In
continuance of these, there are two other reasons for taking food products; these are ‘Save the
money’ and ‘Part of Culture.’ 43% of the respondents strongly agree with taking food products save
their money while 45% disagreed for the same. On the other hand, 60% of the respondents take food
products as they think these as a part of the culture while 25% disagreed with it (Table 2).
Also, the respondents show favorable responses on three reasons for taking drink products, and
these are ‘Taste and flavor,’ ‘Follow the friends or colleagues,’ and ‘Just for Trail.’ It shows that
83% of the respondents take drink products due to their taste and flavor. 74 % of respondents take
drink products because they follow their friends and colleges and, 55% of respondents take these
drink Products Just for Trail. There are two other reasons for choosing these products as they
‘energize the body’ and ‘build the body.’ It shows that 46% of the respondents agreed strongly with
taking drink products as they think these energies their body while 47% disagreed with it. About
building the body, 21% of respondents use drink products as they believe these products help to
develop their bodies, while 73% disagreed with it, (Table 3).
6. DISCUSSION
The findings of the study explain that males participated in more numbers comparatively than
female participants. The majority of the participants in the survey were young between 15 to 34
years. Undergraduate participants were highest amongst the surveyed population. The participants
of the middle income-level participated in more than other categories. One-third of the people have
their income from the government job, and the additional one-third of the people doing their
businesses and self-dependent, and the rest of one-third of people are dependent on the government
and their parents. A high percentage of personal expenditure of the people in Saudi Arabia lies
between 1000SR to 2000SR. Most Saudi Arabia people agreed on the price and quality of food &
drink products are reasonable in the Kingdom. The study results show that food & drink products
are satisfying the need of the customer, and products are customized; these are healthy and contains
vitamins. There is well awareness among the people about the Saudi food & drink products
comparatively foreign countries products. Because of it, Saudi food & drink products have high
sales volume, creating value to the customer, and are competent & high performing in the Middle
East Reason. The Saudi Arabian population agreed to drink products, and as per them, these
products provide energy and strengths. Some people believe that these drink products contain
caffeine, while most of them disagreed with it. Some people think that these products can save time
and money while half of them don’t believe in it. Saudi Arabia people also believe that using drink
products is part of their culture. The people take these drink products for taste, grouping with
friends, and sometimes just for trials.
7. CONCLUSION
The competency and marketing performance of food & drink products of Saudi Arabia in the

10 Ajay Singh
Middle East region have placed a great value for the customers and the country together. The
research shows that a large percentage of the population in Saudi Arabia is consuming these
products showing great satisfaction. The Saudi Arabian food processing Industry has been
increasing with considerable growth over the past decade. The government is imposing high tariffs
on imports to reduce competition with local companies in the Industry. The Saudi Arabian soft drink
industry comprises of 2/3rd volume of the whole market in the Gulf region. These include
carbonates, bottled water, fruit juices, energy drinks/functional drinks, etc. Rising health
consciousness among the people has a strong positive impact in the coming years, especially for
fruit juices, bottled water, and energy drinks, which is a good sign for Industrial growth in the
coming few years for food and drink products.
The survey outcomes reveal that huge populations experiencing better in consuming the food &
drink products and like as are better than any other similar company in the Middle East region. Most
of the people experiencing that the quality of food & drink products has following a reputed
standard, and the services of these respective companies are excellent. Also, these products are
satisfying the massive demand for Saudi Arabian food & drink products in the Middle East region.
Even though for some local Saudi brands, quality innovation and transparency are critical hills to
climb (Paul, 2012). The findings show that the values the customers receive from these products are
overall satisfactory. The existing data also show that a large percentage of customers feel satisfied
with a wide range of these food & drink products.
Despite these, the food imports of Saudi Arabia increased by 10% in 2018 compared to 2017
and expected to reach $35 billion in 2020 (GSA, 2018). Also, country Islamic value,
country-culture, and people’s health consciousness will allow the drink industry to grow only with
non-alcoholic drink markets.
8. DATA AND MATERIAL AVIALABILITY
Information regarding this study is available by contacting the corresponding author.
9. REFERENCES
Berry, L.L., A. Parasuraman (1991). Marketing Services: Competing Through Quality, New York: Free
Press. ISBN 978-0-02-903079-0.
BMI (2014), Saudi Arabia Food & drink report, 2014. ISSN 1749-2920. Retrieved from
www.businessmonitor.com
Diduch, M., Polkowska, Ż., & Namiesnik, J. (2013). Factors affecting the quality of bottled water. Journal of Exposure Science and Environmental Epidemiology, 23, 111-119.
DSM (n.d), Leading the fight for consumers’ health, Retrieved from,
https://www.dsm.com/corporate/solutions/nutrition-health/fortifying-out-diets-html
Eroglu, Sevgin A., &Machleit, Karen A. (1990). An empirical study of retail crowding: Antecedents and consequences. Journal of Retailing, 66(2), 201.
EU (2017), The Food and Beverage Market Entry Handbook: Saudi Arabia, Luxembourg: Publications
Office of the European Union, 2017.
Farris, P., Bendle, N. T., Pfeifer, P. E., & Reibstein, D. J. (2010). Marketing metrics: The definitive
guide to measuring marketing performance. Upper Saddle River, NJ: Wharton School.

*Corresponding author (A. Singh) Email: [email protected], [email protected] ©2020 International Transaction
Journal of Engineering, Management, & Applied Sciences & Technologies. Volume 11 No.4 ISSN 2228-9860 eISSN 1906-9642 CODEN: ITJEA8 Paper ID:11A04H http://TUENGR.COM/V11/11A04H.pdf DOI: 10.14456/ITJEMAST.2020.68
11
Grigg, D. (1999). The Changing Geography of World Food Consumption in the Second Half of the
Twentieth Century. The Geographical Journal, 165(1), 1-11.
GSA (2018), General Authority of Statistics https://www.stats.gov.sa/en • BMI • GAIN REPORT • Euromonitor • Aaron Allen & Associates • EY-MENA Hotel Benchmark Survey Report Alpen
Capital. http://www.foodexsaudi.com/en/about-saudi-food-market
Ismaiel, S., Kahtani, S. A., Adgaba, N., Al-Ghamdi, A. A., & Zulail, A. (2014). Factors That Affect
Consumption Patterns and Market Demands for Honey in the Kingdom of Saudi Arabia. Food and Nutrition Sciences,05(17), 1725-1737. doi:10.4236/fns.2014.517186
Lucas A. Johnson, David Foster, Jackie C. McDowell. (2014). Energy Drinks: Review of Performance
Benefits, Health Concerns, and Use by Military Personnel, Military Medicine, 179(4), 375–380.
Mo’ez Al-Islam & Ezzat Fari’s (2014). Pattern of Caffeinated Energy Drinks Consumption among
Adolescents and Adult in Hail, Saudi Arabia, Scientific Research, Food and Nutrition Sciences,
5, 156-168.
Mohammed Naquibur Rahman (2014). A study on Saudi Arabian retail dynamics, its potential future and challenges, 2(1), 102-113.
Musaiger, A. O. (1993). Socio-Cultural and Economic Factors Affecting Food Consumption Patterns in
the Arab Countries. Journal of the Royal Society of Health, 113(2), 68-74.
doi:10.1177/146642409311300205
Musaiger, A., & Zagzoog, N. (2014), Knowledge, Attitudes and Practices toward Energy Drinks among Adolescents in Saudi Arabia. Global Journal of Health Science,6(2). doi:10.5539/gjhs.v6n2p42
NTP, (2016), National Transformation Programme 2020.
Osei A. J., Ackah O. (2015). Employee’s competency and organizational performance in the
pharmaceutical industry, An empirical study of pharmaceutical firms in Ghana, International
Journal of Economics, Commerce and Management, 3(3), 1-9.
Paul T. (2012), Islamic Branding and Marketing: Creating a Global Islamic Business, John Wiley &
Sons (Asia) Pte. Ltd.
Sadi, M. A., & Henderson, J. C. (2007). In search of greener pastures. British Food Journal,109(8), 637-647.
Singh, Ajay, (2016), Performance Measurement of Almarai Products and Customer Satisfaction,
International Journal of Management Science, 4(1): 1-12.
Tamime, A., Hickey, M., & Muir, D. (2014). Strained fermented milks – A review of existing legislative
provisions, survey of nutritional labelling of commercial products in selected markets and terminology of products in some selected countries. International Journal of Dairy
Technology, 67(3), 305-333.
WEF (2016), World Economic Forum, Global Competitiveness Report 2016-2017. 2016. Available at
http://www3.weforum.org/docs/GCR2016-2017/05FullReport/TheGlobalCompetitivenessRep
ort2016-2017_FINAL.pdf
World Bank (2017), East of Doing Business in Saudi Arabia, Retrieved from
http://www.doingbusiness.org/data/exploreeconomies/saudi-arabia#trading-across-borders
Dr.Ajay Singh is an Assistant Professor of Management at the College of Business Administration, the University of
Hail. He obtained his Doctor of Philosophy in Management from Bundelkhand University, Jhansi (India). He received a Gold Medal for his Master of Philosophy study. Dr.Ajay’s research areas are Organizational Development,
Performance Management, Employee Engagement, Women Empowerment, and Cross-cultural Management.


