
Socioeconomic Institute Sozialökonomisches Institut
Working Paper No. 0405
Competition Policy and Exit Rates: Evidence from Switzerland
Stefan Buehler, Christian Kaiser and Franz Jaeger
March 2004, revised April 2005

Socioeconomic Institute University of Zurich Working Paper No. 0405 Competition Policy and Exit Rates: Evidence from Switzerland
March 2004, revised April 2005 Author’s addresses Stefan Buehler E-mail: [email protected] Christian Kaiser E-Mail: [email protected] Franz Jaeger E-Mail : [email protected]
Publisher Sozialökonomisches Institut
Bibliothek (Working Paper) Rämistrasse 71 CH-8006 Zürich Phone: +41-1-634 21 37 Fax: +41-1-634 49 82 URL: www.soi.unizh.ch E-mail: [email protected]
Competition Policy and Exit Rates: Evidence from
Switzerland∗
Stefan Buehler†
University of Zurich and University of St. Gallen
Christian Kaiser‡
University of St. Gallen
Franz Jaeger§
University of St. Gallen
April 2005
Abstract
This paper provides evidence on the relation between the intensity of product
market competition and the probability of exit. We adopt a natural experiment
approach towards analyzing the impact of a tightening of Swiss antitrust legis-
lation on exit probabilities. Based on a sample of more than 68,000 firms from
all major sectors of the Swiss economy, we find that the exit probability of non-
exporting firms increased significantly, whereas the exit probability of exporting
firms remained largely unaffected. Our results support the notion that there is a
positive relationship between the intensity of product market competition and the
probability of exit.
JEL Classification: D43, L23, L40.
Keywords: competition intensity, exit, natural experiment.
∗We are grateful to Spyros Arvanitis, Dennis Gärtner, Daniel Halbheer, Günter Lang, Adrian Raass,Armin Schmutzler, Christian Stoff, Peter Zweifel and seminar participants at Lefkada (InternationalConference on SME), Mannheim (Industrieökonomischer Ausschuss), Zurich (SSES), the University ofSt. Gallen, the University of Zurich, and the Secretariat of the Swiss Competition Commission for mosthelpful comments and suggestions. The usual disclaimer applies.
†University of Zurich, Socioeconomic Institute (SOI), Bluemlisalpstrasse 10, CH-8006 Zurich,Switzerland; e-mail: [email protected].
‡University of St. Gallen, Research Institute for Empirical Economics and Economic Policy (FEW-HSG), Varnbüelstr. 14, 9000 St. Gallen, Switzerland; e-mail: [email protected].
§University of St. Gallen, Research Institute for Empirical Economics and Economic Policy (FEW-HSG), Varnbüelstr. 14, 9000 St. Gallen, Switzerland; e-mail: [email protected].
1
1 Introduction
There appears to be a broad consensus that consumers typically benefit from the enforce-
ment of antitrust or ‘cartel laws’. Surprisingly, it it less clear whether producers actually
suffer from the reduced opportunity to increase profits by collusion. For instance, Selten
(1984) shows that, under free entry and exit, cartel laws prohibiting collusion are not
necessarily bad for business: When collusion is effectively prevented, there will be fewer
competitors around, so that active producers make higher profits on average than when
they collude.1
More recent work by Sutton (1991, 1998) also emphasizes that the equilibrium num-
ber of firms tends to decrease when the intensity of product market competition in-
creases. In particular, Sutton’s analysis demonstrates that there is a robust relation
between the intensity of product market competition and concentration in industries
where sunk costs are exogenous: There is a lower bound to concentration that unam-
biguously increases with the intensity of product market competition. That is, the higher
the intensity of product market competition, the lower the equilibrium number of firms
that may be supported by this market. The picture is less clear, however, for industries
with endogenous sunk costs, where firms bear significant costs for advertising or research
and development (R&D) before competing in the product market. In this case, the effect
of more intense product market competition on concentration can go either way.2
It is probably fair to say that the empirical evidence on the relation of product
market competition and concentration is fairly scant and has produced mixed results
(see Bittlingmayer 1985, Elliot and Gribbin 1977, and O’Brien et al. 1979). The lack
of clear evidence is unsurprising, given the difficulties associated with measuring the
intensity of product market competition and handling the notorious endogeneity prob-
lems of industry studies. In a recent analysis of the introduction of anti-cartel policy
on concentration in the UK, Symeonidis (2000b) has circumvented these problems by
adopting a “natural experiment” framework, viewing this policy change as exogenous.3
His results support the notion that more intense product market competition increases
concentration in both exogenous and endogenous sunk cost industries.
In the present paper, we focus on a closely related question that has largely been
ignored in the previous literature: How does an (exogenous) increase in the intensity of
competition affect a firm’s exit probability? We think this is a natural question to ask, as
1See Phlips (1995, Ch. 3) for a textbook discussion of Selten’s argument.2Symeonidis (2000a, property 1) illustrates this ambiguity in the setting of a linear Cournot model
with quality indices, where concentration is likely to decrease (increase) in the neighborhood of perfectcollusion (the non-collusive Nash equilibrium, respectively).
3See Meyer (1995) on the use of natural and quasi-experiments in economics.
2
one might expect exits to increase (at least temporarily) when product market competi-
tion becomes more intense.4 Also, taking the perspective of an individual firm allows us
to sidestep the nontrivial problem of constructing useful concentration measures across
a large number of diverse industries.5 Following Symeonidis (2000b), we adopt a natural
experiment approach towards analyzing the impact of a major change in Swiss antitrust
law enacted on July 1, 1996. More specifically, we compare the impact on the ‘treatment
group’ of non-exporting firms facing little competition in domestic markets with the im-
pact on a ‘control group’ of exporting firms operating under international competition.
In doing this, we exploit the dualistic nature of the Swiss economy with competitive
export industries and highly cartelized domestic industries (see Borner et al. 1995).
Earlier contributions by Klepper and Graddy (1990), Agarwal and Gort (1996), and
Van Kranenburg et al. (2002) suggest that a firm’s exit probability should be expected to
depend on firm-specific characteristics–such as a firm’s size, age, geographical location
etc.–as well as on industry-specific and macroeconomic conditions. To our knowledge,
Van Kranenburg et al. (2002) is the only paper that has analyzed the relationship be-
tween the intensity of product market competition and exit rates. These authors use the
(lagged) number of competitors in the daily newspaper industry under consideration as
a proxy for the intensity of product market competition, and they find that exit rates
tend to increase with the number of competitors.
From the perspective of the literature discussed above, the number of competitors
in any given industry is likely to be a good proxy for the intensity of product market
competition only if the number of firms may be treated as an exogenous variable, i.e., if it
is safe to assume that firms cannot decide about entry or exit. In contrast, if the number
of firms is an endogenous variable, a high intensity of product market competition is
associated with a small equilibrium number of firms, as only a small number of firms
may be supported by the profits available in this market. That is, relative to the case
where the number of firms is exogenous, the chain of causation between the number of
firms and the intensity of downstream competition is reversed. In particular, we should
expect that the intensity of product market competition is high (rather than low) when
4For instance, Sutton (1991, 43) notes that, in an off-equilibrium configuration, the only way torecover sunk costs lies in a change of market structure, which may come about in two ways:
“Either consolidation of ownership–whether by means of acquisition or merger–maybring about a rise in margins; or else in the longer run the failure to recover sunk costs willlead to an unwillingness to renew [a] plant as it becomes obsolete, so that concentrationrises as exit occurs.” [emphasis added]
5For instance, the well-known m-firm concentration ratio, which adds up the m highest shares inthe industry (see e.g. Tirole 1988, 221), will not react to liquidations or mergers of smaller firms.
3
the number of firms is small. We think that, in a study of firm exits, it is natural to
view the number of firms as being endogenous.
We use a large combined data set that has become available only recently. Part of
the data stem from the Swiss business census, which is a complete inventory count of all
firms active at the time of observation, encompassing approximately 297,000 firms. This
census contains information on the characteristics of firms, such as their age, location,
legal form, number of employees, etc. The data on the firms’ exits were provided by
Dun &Bradstreet, which has compiled a comprehensive database covering three different
types of exits: (i) bankruptcy, (ii) voluntary liquidations, and (iii) mergers.
We employ a Cox (1972, 1975) model with time-varying covariates to characterize
hazard rates. Our main results are the following. First, the change in Swiss antitrust
law in 1996 had a strong impact on firm conduct, raising hazard rates for the full sample
significantly. Second, whereas non-exporting firms experienced a significant increase of
hazard rates, exporting firms already exposed to international competition were not
significantly affected by the tightening of antitrust law. Taken together, these results
suggest that the tigthening of antitrust law in 1996 led to an increase of the intensity
of competition within Switzerland, raising exit rates significantly. Third, our findings
with respect to the remaining determinants of hazard rates–firm- and industry-specific
properties as well as macroeconomic conditions–are in line with the previous literature.
In particular, we find that hazard rates tend to decrease in age and size.
The remainder of the paper is organized as follows. Section 2 provides a brief discus-
sion of antitrust policy in Switzerland. Section 3 describes the data set and variables.
Section 4 sets out the empirical model and discusses our main results. Section 5 con-
cludes.
2 Antitrust Policy in Switzerland
Swiss antitrust policy has traditionally been perceived as being very permissive (see
e.g. Porter 1990, 714). In part, the lax attitude of Swiss antitrust authorities towards
anticompetitive conduct is explained by the fact that, until today, the Swiss constitution
makes it difficult to declare cartels per se as unlawful. Before the revision of Swiss
antitrust law in 1996, antitrust authorities were required to go through a rather opaque
process called “balance method” (Saldomethode) to evaluate the costs and benefits of a
particular (mis)conduct, with considerations such as the impact on the labor market or
specific regions routinely playing an important role. Since it was generally very difficult
to prove that a cartel actually had a negative ‘net benefit’, cartels were rarely prohibited.
Neven and Ungern-Sternberg (1997, 36) describe the performance of Swiss competition
4
policy up to the mid 1990s as follows:
“In the past, the [Cartel] Commission has relied far too much on judge-
ments and far too little on sound analysis. In various dimensions (definition
of relevant markets, evaluation of dominance, evaluation of countervailing
benefits, imposition of remedies), the analysis is rather poor by the stan-
dards of other jurisdictions. It lacks organising principles, fails to bring
appropriate evidence and often relies on highly judgmental evaluations.”
Emphasizing the need for a thorough revision of Swiss antitrust law, Borner et
al. (1995) further pointed out that the Swiss economy featured dualistic characteristics:
On the one hand, there was the competitive export sector serving the world markets; on
the other hand, there was a highly subsidized domestic sector facing little competition
due to a mixture of public regulations and both horizontal and vertical collusion.
The revision of the antitrust law, enacted on July 1, 1996, finally led to the per
se prohibition of so-called ‘hard’ cartels that eliminate ‘effective competition’ by fixing
prices, restricting quantity or dividing up markets (Art. 7). Furthermore, the notorious
balance method was abolished. Taken together, these improvements were expected to
intensify competition in domestic markets considerably, even though there arguably
remained a number of relevant shortcomings–such as the lack of power of competition
authorities to penalize parties restricting competition without delay and to confiscate
extra profits from unlawful behavior (OECD 2000).6
This rather drastic change in Swiss antitrust legislation allows us to study the ef-
fect of intensifying product market competition on firms’ exit behavior using a natural
experiment framework: The change in antitrust legislation generated variation in the
intensity of product market competition that is plausibly exogenous (Meyer 1995). We
can thus sidestep the well-known endogeneity problem of structure and performance
studies (Schmalensee 1989).
To evaluate the impact of the change in antitrust law on the firms’ exit behavior, we
will refer to the dichotomy of the Swiss economy discussed above and distinguish the
following types of firms:
• The vast majority of Swiss firms was solely active on domestic markets, i.e., theydid not export to foreign countries (“non-exporting firms”). These firms should
have been significantly affected by the change in antitrust legislation.
6Eliminating these and other shortcomings was the objective of yet another revision of the antitrustlaw enacted in April 2004.
5
• A smaller but non-negligable number of Swiss firms exported at least part of theiroutput to the world market (“exporting firms”) and had thus already faced intense
competition on international markets. The impact of the change in Swiss antitrust
law on these firms should thus be expected to be much smaller. In particular, it
is reasonable to hypothesize that firms which were located in Switzerland but did
export more than 2/3 of their output to foreign markets were not much affected
by the change in Swiss antitrust legislation.
3 Data and Variables
In this section, we briefly discuss our data and the variables used to estimate the impact
of the change in antitrust law on the firms’ exit probability.
3.1 Data Source and Sample Composition
For the purpose of this study, we merged the following databases:
(1) Swiss Business Census (SBC 95). The SBC 95 is a complete inventory count
compiled by the Swiss Federal Statistical Office (BFS), which contains all firms
with more than 20 weekly aggregate working hours existing in September 1995,
excluding the agricultural sector. The SBC 95 provides numerous variables that
characterize the attributes of these firms.
(2) Dun & Bradstreet Exit Database (DBED). The DBED contains all exits of firms
located in Switzerland from January 1994 to December 2000. It distinguishes
the following types of exit: (i) bankruptcies, (ii) voluntary liquidations, and (iii)
mergers.
The merged database covers an observation period between October 1995 and Decem-
ber 2000. After deleting all firms that were non-profit oriented according to their legal
status–such as cooperatives (“Genossenschaften”), associations and clubs (“Vereine”),
foundations (“Stiftungen”), churches, embassies and international organizations–, the
merged database contained 276,123 firms. Since for sole proprietorships, the DBED does
not fully cover voluntary liquidations and mergers, we dropped all sole proprietorships.
Furthermore, we dropped all firms established prior to 1970, since no information on
their founding dates was available.
After dropping these firms, our sample still includes more than 68,000 firms and is
thus comparably large and comprehensive. In particular, we have firms of all size ranges
6
and ages up to 25 years in our sample, which has rarely been the case in previous stud-
ies. Furthermore, with the exception of the agricultural sector, our sample contains all
industries represented in Switzerland (including services), whereas earlier work typically
focussed on only a few industries and did not cover services due to data limitations.
However, we are also aware of two disadvantages of our database associated with the
way entries and exits were recorded. First, whereas the DBED records exit times as
exact dates (day/month/year), the SBC 95 gives entry dates in intervals only (various
time spans).7 One approach towards dealing with this problem in survival analysis is
the use of interval-censored models. However, these models are not designed to handle
time-varying covariates (changes within the intervals), which will be crucial for our
analysis below. We therefore adopted the alternative approach of assuming a uniform
distribution of entries within these intervals (since no further information was available)
and simulating the date of entry, which yielded survival times measured in quarters
(see section 3.2 below). Second, it is well-known that firms tend to announce voluntary
liquidations with some delay (i.e., after closing down operations), giving rise to delays
in registration. This is a general problem of business failures studies.
It is instructive to compare the composition of our sample with that of a related
study by Harhoff et al. (1998) for West Germany, which is similar to ours in a number
of respects: First, it contains manufacturing as well as service firms, unlike the vast
majority of other studies. Second, these authors distinguish bankruptcies and voluntary
liquidations. Third, they have older firms in the sample that were at risk before the
survey period (“delayed entry”). Finally, their observation period is of a similar length
as ours.8
We now want to highlight some special properties of our sample. The descriptive
statistics given in Table 1 indicate that small firms make up a large proportion of Swiss
firms: Using the number of employees (Emp) to measure firm size, average firm size is
about 11 employees. The median firm size amounts to only 4 employees. Harhoff et
al., in contrast, found an average size of roughly 276 employees, and a median size of
slightly less than 8 for West Germany.
Recall from our above discussion that firms founded before 1970 had to be excluded
from our sample due to data limitations. It is thus unsurprising that, on average, firms
were only about 8 years old when they entered the survey period, whereas they were
roughly 29 years old in Harhoff et al. The firms in our sample are thus relatively young.
7Entries were recorded in the following nine intervals (..., 1969], [1970,1980], [1981,1985], [1986,1990],[1991], [1992], [1993], [1994], [1995].
8Harhoff et al. (1998) in turn compare their results to the study of Wagner (1994) for young firmsand find that “the difference is small enough to be accounted for by differences in industry composition”
(p. 467).
7

We further find that, after excluding sole proprietorships, stock corporations clearly
dominate in our sample, with close to 80% of all firms belonging to this group of firms.9
This share looks surprisingly large compared to Harhoff et al., where only about 4% of
the firms are stock companies. However, next to the fact that, unlike Harhoff et al., we
exclude the largest group of sole proprietorships, it is largely explained by the fact that
Swiss legislation poses very few obstacles to small firms to become stock companies.
Finally, taking a look at industries, we observe that more than two thirds of the firms
in our sample belong to the service sector (in the SBC 95 this share amounts to three
quarters of all firms). The vast majority of previous studies had–if at all–a somewhat
limited access to data on firms in the service sector. In the sample of Harhoff et al., for
instance, only 30% of the firms belong to the service sector.
3.2 Variables and Descriptive Statistics
We first explain the construction of our dependent variable and then discuss the ex-
planatory variables (see Table 1 for the descriptive statistics).
<Table 1 around here>
3.2.1 Dependent Variable
Our dependent variable is the firm’s lifetime, measured by how many quarters a firm
stayed in business. As noted above, the DBED contains three different types of exit:
(i) bankruptcies, (ii) voluntary liquidations, and (iii) mergers. In some studies, all three
types of exit are pooled (e.g. Dunne and Hughes 1994). Other studies use a more narrow
definition of exits–closely related to the concept of “failures”–excluding mergers, which
do not necessarily imply a low profitability of the involved firms. In the following, we
shall use a broad definition of exits and pool all three types of exit.10
In our sample, exits were recorded as bankruptcies if the firms filed for bankruptcy
between October 2, 1995 and December 31, 2000. For the exact time of exit, we used the
first available date which, in the bulk of bankruptcy cases, is the time when the court
instituted bankruptcy proceedings (as opposed to the time when the firm finally closed
down). This is due to the fact that the time spread between the opening of bankruptcy
9In the SBC 95, where sole proprietorships are included, we find this group to have the largest share(62.49%), at least in terms of their numbers; however, even there the share of stock corporations is with30% still considerable.10To check the robustness of our results, we have also used the more narrow definition of exits
excluding mergers. The results of these estimations are similar to those presented in Table 3; they areavailable on request from the authors.
8

proceedings and the actual close down varies considerably, depending, for instance, on
the size and the legal form of the firm. The other types of exit, voluntary liquidations
and mergers, were recorded at the time when the respective firms were deleted from
the commercial register. The time when they actually closed down would have been
preferable, but was not available.
Using the founding and exit times, it is straightforward to calcuate the duration of
a firm’s presence in the market. Note that the resulting duration data is right censored,
i.e. there are (many) firms that have not left the pool during the survey period. For these
firms, we know that true duration is at least as large as observed duration. Furthermore,
the data is left truncated, as all the firms covered by the SBC 95 must have been founded
prior to October, 1995 and thus have been at risk before coming under observation
(delayed entry). Both right censoring and left truncation will have to be taken into
account when modelling the probability of exit.
3.2.2 Explanatory Variables
In our sample, all values of firm attributes refer to the time when the firm filed the
relevant information for the business census, similar to Harhoff et al. (1998) and Konings
and Xavier (2003). In most other studies, firm attributes refer to the time of the firm’s
founding. We are aware that some of these attributes–such as the firm’s size–may
change over lifetime. Yet, as in virtually all other studies on business failures, time-
varying firm attributes are not available. To accommodate this problem, we control
for the firm’s age at the time of entering the sample. More specifically, we include the
variable Age 95, which indicates the firm’s age in September 1995 when it entered the
SBC 95.
In virtually all previous studies, the size of a firm is operationalized by its assets
(Dunne and Hughes 1994, Ranger-Moore 1997) or by the number of employees (Brüderl
et al. 1992, Audretsch 1995, Harhoff et al. 1998). It is common to log transform these
variables as it is natural to assume that marginal effects of size on exit probabilities
decrease. In the present study, we describe size by the natural log of the number of
employees (LnEmp); additionally, we include the square of this variable in order to test
for non-monotonicity ((LnEmp)2).11
We classify the legal form of firms into four groups, which differ with respect to the
initial capital requirements (Brüderl and Schüssler 1990), ease of ownership transfer and
liability rules (Harhoff et al. 1998) as well as tax treatment: (i) Partnerships (Partner),
(ii) Limited liability companies (Lim Liab), and (iii) stock corporations (Stock Corp).
11Alternative specifications of firm size, e.g. the number of apprentices or the sales area, can be foundin Kaiser (2004).
9
As noted above, sole proprietorships had to be dropped because the DBED does not
fully cover the failures of these firms.
The SBC 95 further contains information on the nature of the firms’ businesses. In
our sample, we use dummy variables to identify the industry sector to which a firm be-
longs: Manufacturing (Manufact), construction (Construct), trade (Trade), or services
(Service). Furthermore, we use a classification issued by BFS (1997) to control for geo-
graphical idiosyncrasies. That is, we use the following five dummy variables to indicate
where a firm is domiciled: Eastern Switzerland, including the greater Zurich area and
Graubünden (Eastern CH ), Northwestern Switzerland (NW CH ), Central Switzerland
(Central CH ), the French speaking area (French CH ), and the Italian speaking area
(Ticino). Eastern CH will serve as the reference variable.
Since a crucial aspect of our study will be to compare the impact of the change in
antitrust law on non-exporting and exporting firms, we control for the export share of a
firm, calculated as the ratio of exports and turnover, as indicated in the SBC 95. The
database distinguishes the following firm types with respect to export activity:
(i) Non-exporting firms (Exposh 1 ); these firms serve as the reference group.
(ii) Exporting firms with export shares below one third (Exposh 2 ).
(iii) Exporting firms with export shares between one third and two thirds (Exposh 3 ).
(iv) Exporting firms with export shares above two thirds (Exposh 4 ).
Finally, we use a number of time-varying explanatory variables. The most important
of these is a dummy variable controlling for the change in antitrust law (AL) in the third
quarter of 1996; AL is zero up to the second quarter of 1996 and one after that. Next,
we control for the external value of the Swiss currency (the Swiss Franc), using an index
constructed by the Swiss National Bank (SNB) (2003) based on the real exchange rates
with the 24 most important trade partners (Ext Val).12 We further use a variable con-
trolling for the aggregate movement of the economy in previous years, as in other studies
with time-varying covariates. For instance, Van Kranenburg et al. (2002) use the lagged
total number of firms while Ranger-Moore (1997) and Roberts and Thompson (2003)
use the lagged aggregate number of failures or exits, respectively. We include the lagged
number of bankruptcies (Bankrupt), generated by aggregating the yearly bankruptcies
listed in the DBED.13 We would expect that a higher number of bankruptcies in the
12As we use this variable with a one year lag, values between 1994 and 1999 enter the equation.13This number is based on all firms, i.e. also on those which do not meet the requirements of the SBC
95.
10
previous year will increase hazard rates because of ‘chain effects’ (at work both within
and across industries) that trigger further exits.14
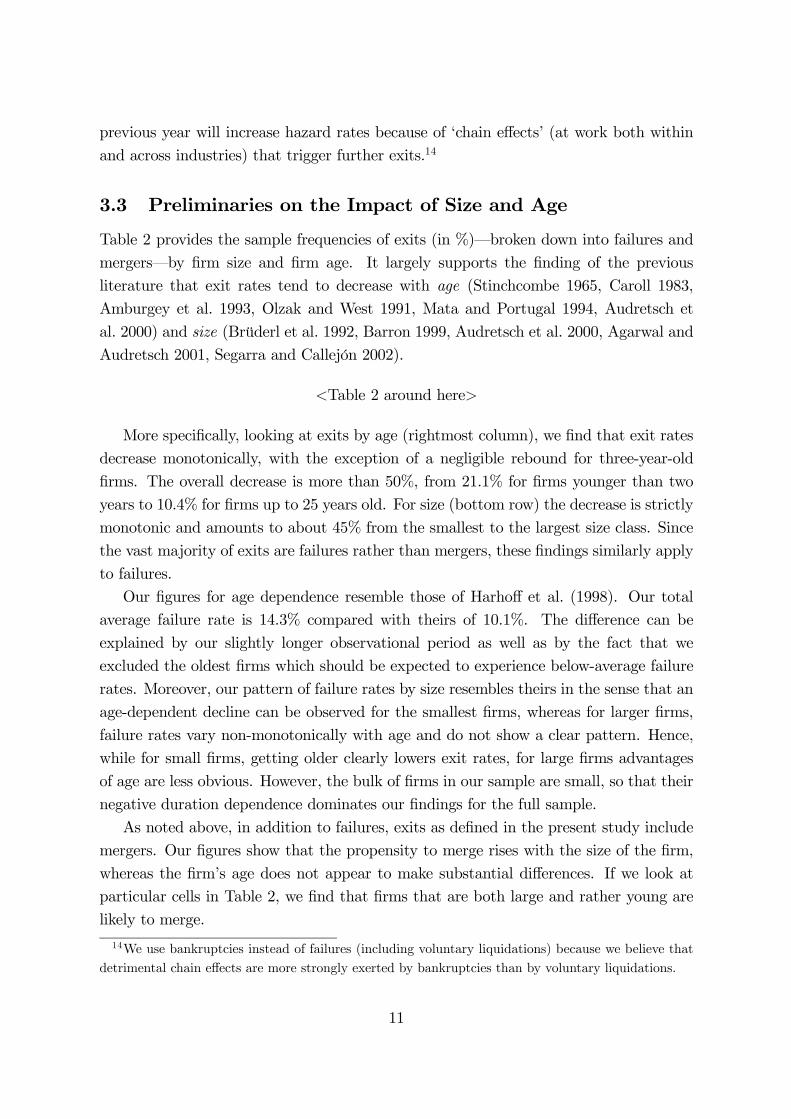
3.3 Preliminaries on the Impact of Size and Age
Table 2 provides the sample frequencies of exits (in %)–broken down into failures and
mergers–by firm size and firm age. It largely supports the finding of the previous
literature that exit rates tend to decrease with age (Stinchcombe 1965, Caroll 1983,
Amburgey et al. 1993, Olzak and West 1991, Mata and Portugal 1994, Audretsch et
al. 2000) and size (Brüderl et al. 1992, Barron 1999, Audretsch et al. 2000, Agarwal and
Audretsch 2001, Segarra and Callejón 2002).
<Table 2 around here>
More specifically, looking at exits by age (rightmost column), we find that exit rates
decrease monotonically, with the exception of a negligible rebound for three-year-old
firms. The overall decrease is more than 50%, from 21.1% for firms younger than two
years to 10.4% for firms up to 25 years old. For size (bottom row) the decrease is strictly
monotonic and amounts to about 45% from the smallest to the largest size class. Since
the vast majority of exits are failures rather than mergers, these findings similarly apply
to failures.
Our figures for age dependence resemble those of Harhoff et al. (1998). Our total
average failure rate is 14.3% compared with theirs of 10.1%. The difference can be
explained by our slightly longer observational period as well as by the fact that we
excluded the oldest firms which should be expected to experience below-average failure
rates. Moreover, our pattern of failure rates by size resembles theirs in the sense that an
age-dependent decline can be observed for the smallest firms, whereas for larger firms,
failure rates vary non-monotonically with age and do not show a clear pattern. Hence,
while for small firms, getting older clearly lowers exit rates, for large firms advantages
of age are less obvious. However, the bulk of firms in our sample are small, so that their
negative duration dependence dominates our findings for the full sample.
As noted above, in addition to failures, exits as defined in the present study include
mergers. Our figures show that the propensity to merge rises with the size of the firm,
whereas the firm’s age does not appear to make substantial differences. If we look at
particular cells in Table 2, we find that firms that are both large and rather young are
likely to merge.
14We use bankruptcies instead of failures (including voluntary liquidations) because we believe thatdetrimental chain effects are more strongly exerted by bankruptcies than by voluntary liquidations.
11
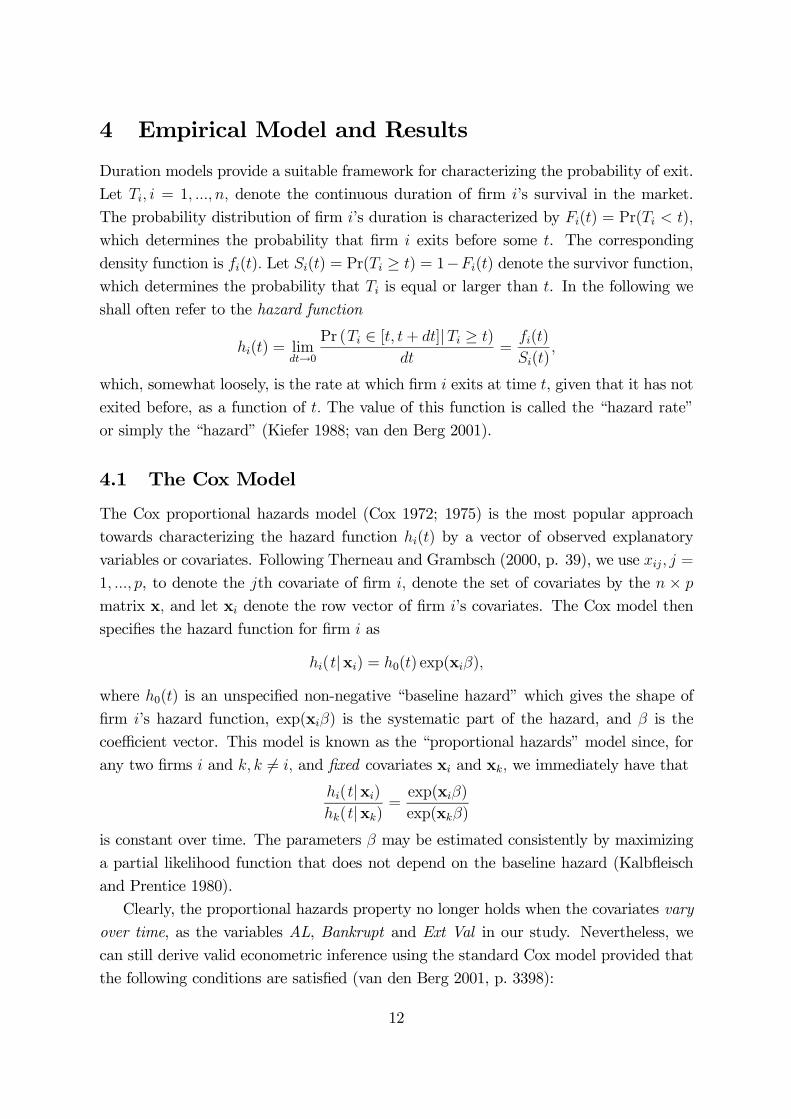
4 Empirical Model and Results
Duration models provide a suitable framework for characterizing the probability of exit.
Let Ti, i = 1, ..., n, denote the continuous duration of firm i’s survival in the market.
The probability distribution of firm i’s duration is characterized by Fi(t) = Pr(Ti < t),
which determines the probability that firm i exits before some t. The corresponding
density function is fi(t). Let Si(t) = Pr(Ti ≥ t) = 1−Fi(t) denote the survivor function,
which determines the probability that Ti is equal or larger than t. In the following we
shall often refer to the hazard function
hi(t) = limdt→0
Pr (Ti ∈ [t, t+ dt]|Ti ≥ t)
dt=
fi(t)
Si(t),
which, somewhat loosely, is the rate at which firm i exits at time t, given that it has not
exited before, as a function of t. The value of this function is called the “hazard rate”
or simply the “hazard” (Kiefer 1988; van den Berg 2001).
4.1 The Cox Model
The Cox proportional hazards model (Cox 1972; 1975) is the most popular approach
towards characterizing the hazard function hi(t) by a vector of observed explanatory
variables or covariates. Following Therneau and Grambsch (2000, p. 39), we use xij, j =
1, ..., p, to denote the jth covariate of firm i, denote the set of covariates by the n × p
matrix x, and let xi denote the row vector of firm i’s covariates. The Cox model then
specifies the hazard function for firm i as
hi(t|xi) = h0(t) exp(xiβ),
where h0(t) is an unspecified non-negative “baseline hazard” which gives the shape of
firm i’s hazard function, exp(xiβ) is the systematic part of the hazard, and β is the
coefficient vector. This model is known as the “proportional hazards” model since, for
any two firms i and k, k 6= i, and fixed covariates xi and xk, we immediately have that
hi(t|xi)hk(t|xk) =
exp(xiβ)
exp(xkβ)
is constant over time. The parameters β may be estimated consistently by maximizing
a partial likelihood function that does not depend on the baseline hazard (Kalbfleisch
and Prentice 1980).
Clearly, the proportional hazards property no longer holds when the covariates vary
over time, as the variables AL, Bankrupt and Ext Val in our study. Nevertheless, we
can still derive valid econometric inference using the standard Cox model provided that
the following conditions are satisfied (van den Berg 2001, p. 3398):
12

(i) x(t) is a predictable stochastic process. The concept of predictability stems from
the counting process literature and essentially requires that the explaining vari-
ables are weakly exogenous (Ridder and Tunalı 1999, 196). More specifically,
predictability implies that the value of xi(t) is known infinitesimally before t, at
time t− or even earlier. Put differently, information on the value of xi at time tdoes not help to predict a transition at t.
(ii) The realizations of x(t) and exp(xi(t)β), i = 1, ..., n, are bounded.
In the present context, it is natural to assume that conditions (i) and (ii) are satisfied.
First, consider condition (i). Predictability is satisfied, since our event time scale is
discrete and we generally use lagged time-varying covariates (time-invariant covariates
are trivially predictable). Next, consider condition (ii). Our time-varying covariates are
the dummy variable for the change in antitrust law (AL), the number of bankruptcies
(Bankrupt), and the external value of the Swiss Franc (Ext Val). Clearly, both AL and
Bankrupt are bounded below and above by definition.15 Finally, basic economic intuition
suggests that Ext Val is bounded below and above, too.16
We shall therefore apply the standard Cox model below to estimate the impact of
the change in antitrust law. With time-varying covariates, the Cox model is given by
hi(t|xi(t)) = limdt→0
Pr (Ti ∈ [t, t+ dt]|Ti ≥ t, {xi(u)}t0)dt
= h0(t) exp(xi(t)β),
where {xi(u)}t0 denotes the time path of xi up to t, i.e. xi is simply replaced by xi(t)
(see van den Berg 2001, pp. 3397).
4.2 Results
Table 3 provides our estimation results. To interpret these results, observe that we do
not report the estimated coefficients bβj, j = 1, ..., p, but the estimated hazard ratiosdHRj =
bh(t|xj = x0j(t) + 1,x−j(t))bh(t|xj = x0j(t),x−j(t))= exp(bβj), j = 1, ..., p,
where x−j(t) = (x1(t), ..., xj−1(t), xj+1(t), ..., xp(t)) . The hazard ratio is the factor bywhich the hazard function is multiplied if the covariate xj increases by one unit. That
15The dummy variable AL is either zero or one. The number of bankruptcies (Bankrupt), in turn, iszero at the minimum; at the maximum, it equals the number of firms in the market.16The minium of Ext Val is zero by definition. As to the maximum, observe that for Ext Val to go
to infinity, the currency values of the most important trade partners (measured in Swiss Francs) wouldhave to approach zero.
13
is, if dHRj = 1, the hazard rate does not change in response to a change in covariate j,
whereas the hazard increases (decreases) if dHRj > 1 (dHRj < 1, respectively).
<Table 3 around here>
The estimated models given in Table 3 differ with respect to sample composition.
The left-most column model reports the hazard ratios for the full sample where all
firms are pooled. The other models are based on subsamples where only firms with the
indicated export shares are included.
Our main interest lies in examining the impact of the change in antitrust law in
1996–represented by the dummy variable AL–on hazard rates. The pooled regression
suggests that the change in antitrust law produced a significant overall increase of hazard
rates of roughly 30%. This significant overall increase of hazard rates appears to be
consistent with the idea that the tightening of antitrust law served to lower the degree
of collusion in domestic markets. However, to substantiate the claim that the increase
of hazard rates was generated by more intense competition–rather than some other
exogenous “shock” occurring at the same time–it is necessary to compare the effects
of the change in antitrust law on firms that are likely to be affected and firms that are
not. As pointed out above, this is done by comparing the impact on non-exporting firms
(Exposh 1 ) with the impact on exporting firms (Exposh 2, Exposh 3, Exposh 4) already
facing competition on international markets. The estimated hazard ratios for these
models show that the non-exporting firms were the only ones significantly affected by
the change in antitrust law. They suffered a significant increase of hazard rates of more
than 30%. Exporting firms, in contrast, were not significantly affected by the change
in antitrust law.17 Together, these findings suggest that the change in antitrust law
indeed raised the intensity of competition in domestic markets, whereas competition in
international markets remained largely unaffected. Since the vast majority of firms in our
sample are non-exporting firms, the overall impact estimated by the pooled regression
is nevertheless large and significant.
The pooled regression further indicates that the firm’s export activity is an important
determinant of the hazard rate in its own right. Intuitively, one would expect that a
firm’s survival probability should increase the more it diversifies, so that firms with
medium export activity tend to have low hazard rates. Our results are consistent with
this view, as the hazard ratios for firms exporting up to two thirds of their outputs
17The effect on exporting firms is highest for firms with small export shares (Exposh 2 ). It is roughlythe same for firms with medium and large export shares (Exposh 3 and Exposh 4 ). However, the effect
is insignificant for all exporting firms. The latter finding still holds when combinations of Exposh 2,Exposh 3 and Exposh 4 are pooled to enlarge sample size.
14

(Exposh 2 and Exposh 3 ) are less than one (if not necessarily significant). Firms that
export more than two thirds of their output (Exposh 4 ), however, have the highest
hazard rates.
Concerning size, the pooled regression shows that both the natural log of the number
of employees (LnEmp) and its square ((LnEmp)2) are significant. The hazard-reducing
effect of LnEmp is countered by a hazard-increasing effect of (LnEmp)2. This indicates
that size advantages decrease up to an ‘optimal size’. Further increases of size lead to an
increase of hazard rates, giving rise to a ∪-shaped relationship between the number ofemployees and hazard rates.18 This result, which is supported by the estimation results
for the other models, is remarkable, as it is commonly accepted that size is positively
related to the likelihood of survival.19 However, many earlier studies have not really
addressed the question whether there is a monotone relation between size and survival,
using only one size term. Our results add to studies by Wholey et al. (1992), Dunne
and Hughes (1994), Ranger-Moore (1997), Harhoff et al. (1998) and Chen (2002), which
suggest that the relation between size and survival may be non-monotone at least for
some industries. In line with the bulk of the literature, we also find that hazard rates
significantly decrease with age (Age) (see Carroll (1983), Amburgey et al. (1993), Olzak
and West (1991), Mata and Portugal (1994), and Audretsch et al. (2000)).
Our estimates further suggest that legal form is an important determinant of firm
survival. Stock corporations have lower hazard rates than non-corporate firms. Partner-
ships (reference variable) are generally most likely to fail, followed by limited liability
companies (with a hazard ratio of 0.734) and stock corporations (with a hazard ratio of
0.686). This suggests that the advantages of corporations, such as higher initial capital
requirements, better access to financial capital and easier transfer of ownership, ap-
parently dominate their disadvantages due to more risk averse behavior resulting from
limited liability. Our results generally support the rankings of those of previous studies,
such as King and Wicker (1988) and Harhoff et al. (1998).
We distinguish four main industry sectors on the one-digit level: manufacturing,
construction, trade and services. It stands out that hazard rates for construction are
much higher than those for other industries. Harhoff et al. (1998), in contrast, obtained
18We can calculate a “total hazard ratio” function THR(Emp) as the product of the hazard ratiosof LnEmp and LnEmp2. This function shows a sharp initial drop and reaches its minimum of 0.522
at about 80 employees. That is, the hazard rates of firms with 80 employees are roughly half of thoseof firms with only one employee. For larger firms, the hazard ratio starts to increase again, but onlyvery moderately. For firms with 250 employees its value is 0.545, for firms with 500 employees it risesto 0.585.19Agarwal and Audretsch (2001, 22) note that “virtually every study undertaken has found that size
is positively related to the likelihood of survival”.
15

the lowest hazard rates for construction.20 A possible explanation for the high hazard
rates in our case may be found in falling real estate prices and falling construction
expenses during the survey period.21
Regarding the regions where firms are located, it is noteworthy that hazard rates in
the non-German speaking regions are generally significantly higher than in the German
speaking regions. More specifically, relative to the German speaking reference region
Eastern CH, which includes the greater Zurich area, all regions (except German speaking
Central CH ) suffer from significantly higher hazard rates.22
Finally, we consider the impact of macroeconomic conditions on hazard rates. Here,
we controlled for the external value of the Swiss currency (Ext Val), as its fluctuation
influences the exits of firms disparately, subject to their export activity, and its omission
could seriously distort findings on the change of antitrust law. We find the external value
to be significant in all models (with the exception of Exposh 3 ). As expected, an increase
in the external value of the Swiss currency raises hazard rates, as it deteriorates the
competitiveness of Swiss firms on foreign markets, and increases the competitiveness of
foreign firms on domestic markets. Furthermore, we included the number of bankruptcies
in the previous year (Bankrupt) to control for ‘chain effects’ associated with the general
business climate.23 For all models, we find the expected result that the number of lagged
bankruptcies raises the propensity to exit.
5 Conclusion
The analysis presented in this paper has produced three main results. First, the change
in Swiss antitrust law in 1996 led to a significant overall increase of hazard rates for
Swiss firms. Second, whereas non-exporting firms suffered from a significant increase of
hazard rates, exporting firms were not significantly affected. Third, all other standard
determinants of hazard rates generated effects largely in line with the previous literature.
Taken together, these results suggest that the tightening of Swiss antitrust law in 1996
led to an increase of the intensity of competition in domestic markets, but did not much
20However, for bankruptcies they also obtained the highest hazard rates for construction, in line withresults of Kaiser (2004), who uses the database employed in the present paper.21According to figures published by SNB (2003), the price index for appartments fell by 23.31% from
1994 to 1999; other real estate prices also showed significant decreases. For instance, for one-familyhouses prices dropped by 13.54% and for sales areas by 16.64%.22However, only considering firms with the highest export shares (Exposh 4 ), firms in the French
speaking area (including Geneva) have the lowest hazard rates.23An additional business cycle indicator released by the Swiss Institute for Business Cycle Research
(KOF-ETH) turned out be insignificant and was thus excluded.
16

affect the fairly competitive export sector of the Swiss economy.
References
Agarwal, R., Gort, M. (1996): The Evolution of Markets and Entry, Exit and Survival
of Firms, Review of Economics and Statistics 78, 489-498.
Agarwal, R., Audretsch, D. (2001): Does Entry Size Matter? The Impact of the Life
Cycle and Technology on Firm Survival, Journal of Industrial Economics 49, 21-
43.
Amburgey, T.L., Kelly, D., Barnett, W.P. (1993): Resetting the Clock: The Dynamics
of Organizational Change and Failure, Administrative Science Quarterly 38, 51-73.
Audretsch, D.B. (1995): Innovation and Industry Evolution. MIT Press, Cambridge,
MA.
Audretsch, D.B., Houweling, P., Thurik, A.R. (2000): Firm Survival in the Netherlands,
Review of Industrial Organization 16, 1-11.
Barron, D.N. (1999) The Structuring of Organizational Populations, American Socio-
logical Review 64, 421-445.
van den Berg, G.J. (2001): Duration models: Specification, identification, and multiple
durations, in: J.J. Heckman and E. Leamer (eds.), Handbook of Econometrics, Vol.
V, North Holland, Amsterdam, 3381-3460.
BFS (Swiss Federal Statistical Office) (1997): Die Raumgliederung der Schweiz (The
spacial structure of Switzerland), 2nd edition, Bern.
Bhattacharjee, A., Higson, C., Holly, S., Kattuman, P. (2003): Business Failure in UK
and US quoted firms: Impact of macro-economic instability and the role of legal
systems. Paper presented at the EARIE 2003 conference, Helsinki.
Bittlingmayer, G. (1985): Did Antitrust Policy Cause the Great Merger Wave?, Journal
of Law and Economics 28, 77-118.
Borner, S., Brunetti, A., Weder, R. (1995): Ökonomische Analyse zur Revision des
schweizerischen Kartellgesetzes (Economic analysis of the revision of Swiss an-
titrust law), in: Zäch, R., Zweifel, P. (eds.): Grundfragen der schweizerischen
Kartellrechtsreform. Dike, St. Gallen, 35-92.
17
Brüderl, J., Preisendörfer, P., Ziegler, R. (1992): Survival Chances of Newly Founded
Business Organizations, American Sociological Review 57, 227-242.
Brüderl, J., Schüssler, R. (1990): Organizational Mortality: The Liabilities of Newness
and Adolescence, Administrative Science Quarterly 35, 530-547.
Carroll, G. (1983): A Stochastic Model of Organizational Mortality: Review and Re-
analysis, Social Science Research 12, 303-329.
Chen, M.-Y. (2002). Survival Duration of Plants: Evidence from the US Petroleum
Refining Industry, International Journal of Industrial Organization 20, 517-555.
Cox, D.R. (1975): Partial Likelihood, Biometrika 62, 269-276.
Cox, D.R. (1972): Regression Models and Life-Tables, Journal of the Royal Statistical
Society, Series B34, 187-220.
Dunne, P., Hughes A. (1994): Age Size, Growth and Survival: UK Companies in the
1980s, Journal of Industrial Economics 42, 115-140.
Elliot, D.C., Gribbin, J.D. (1977): The Abolition of Cartels and Structural Change in
the United Kingdom, in: Jacquemin, A.P., de Jong, H.W. (eds.): Welfare Aspects
of Industrial Markets, Nijhoff, Leiden.
Harhoff, D., Stahl, K., Woywode, M. (1998): Legal Form, Growth and Exit of West
German Firms–Empirical Results for Manufacturing, Construction, Trade and
Service Industries, Journal of Industrial Economics 46, 453-488.
Kaiser, C. (2004): Factors Determining Firm Survival: Empirical Evidence from Swiss
Manufacturing, Construction, Trade and Service Industries. Doctoral Thesis Uni-
versity of St. Gallen.
Kalbfleisch, J.D.,Prentice, R.L. (1980): The Statistical Analysis of Failure Time Data.
John Wiley and Sons, New York.
Kiefer, N.M. (1988): Economic Duration and Hazard Functions, Journal of Economic
Literature 26, 646-679.
King, J.C., Wicker, A.W. (1988): The Population Demography of Organizations: An
Application to Retail and Service Establishments, Academy of Management Best
Paper Proceedings, 373-377.
Klepper, S., Graddy, E. (1990): The Evolution of New Industries and the Determinants
of Market Structure, Rand Journal of Economics 21, 27-44.
18
Konings, J., Xavier, A. (2003): Firm Perfomance and Selection in an Emerging Econ-
omy: Micro Evidence from Slovenia. Paper presented at the Royal Economic
Society Annual Conference 2003, Warwick.
Van Kranenburg, H.L., Palm, F.C., Pfann, G.A. (2002): Exit and Survival in a Con-
centrating Industry: The Case of Daily Newspapers in the Netherlands, Review of
Industrial Organization 21, 283-303.
Mata, J., Portugal, P. (1994): Life Duration of New Firms, Journal of Industrial Eco-
nomics 42, 227-245.
Meyer, B.D. (1995): Natural and Quasi-Experiments in Economics, Journal of Business
& Economic Statistics 13, 151-161.
Neven, D., Ungern-Sternberg, T. (1997): Swiss Competition Policy in the Last Decade,
in: Bachetta, P., Wasserfallen, W. (eds.): Economic Policy in Switzerland. MacMil-
lan, London, 35-57.
O’Brien, D.P., Howe, W.S., Wright, D.M., O’Brien, R.J. (1979): Competition Policy,
Profitability and Growth, Macmillan, London.
OECD (2000): Economic Survey–Switzerland 2000.
Olzak, S., West, E. (1991): Ethnic Conflict and the Rise of Ethnic Newspapers, Amer-
ican Sociological Review 56, 458-474.
Phlips, L. (1995), Competition Policy: A Game-Theoretic Perspective. Cambridge
University Press, Cambridge.
Porter, M.E. (1990): Competitive Advantage of Nations. Free Press, London.
Ranger-Moore, J. (1997): Bigger may be better but is older wiser?: Organizational Age
and Size in the New York Life Insurance Industry, American Sociological Review
62, 903-920.
Ridder, G., Tunalı, I. (1999): Stratified Partial Likelihood Estimation, Journal of
Econometrics 92, 193-232.
Roberts, B.M., Thompson, S.(2003): Entry and Exit in a Transition Economy: The
Case of Poland, Review of Industrial Organization 22, 225-243.
Schmalensee, R. (1989): Inter-Industry Studies of Struture and Performance, in: Schmalen-
see, R., Willig, R.D. (eds.): Handbook of Industrial Organization, Vol. 2, North
Holland, Amsterdam, 951-1009.
19

Segarra, A., Callejón, M. (2002) New firms’ survival and Market Turbulence: New
Evidence from Spain, Review of Industrial Organization 20, 1-14.
Selten, R. (1984): Are Cartel Laws Bad for Business?, in: Hauptmann, H., Krelle, W.,
Mosler, K.C. (eds.): Operations Research and Economic Theory, Springer, Berlin
etc.
Swiss National Bank (SNB) (2003): Statistisches Monatsheft (Monthly Statistical Bul-
letin), May 2003.
Stinchcombe, A.L. (1965): Social Structure and Organizations, in: March. J. (ed):
Handbook of Organizations, Rand McNeally, Chicago, 142-193
Sutton, J. (1998): Technology and Market Structure. MIT Press, Cambridge, MA.
Sutton, J. (1991): Sunk Costs and Market Structure. MIT Press, Cambridge, MA.
Symeonidis, G. (2000a): Price and Nonprice Competition With Endogeneous Market
Structure, Journal of Economics and Management Strategy 9, 53-83.
Symeonidis, G. (2000b): Price Competition and Market Structure: The Impact of
Cartel Policy on Concentration in the UK, Journal of Industrial Economics 48,
1-26.
Thernau, T.M., Grambsch, P.M. (2000): Modeling Survival Data. Extending the Cox
Model. Springer, Berlin etc.
Tirole, J. (1988): The Theory of Industrial Organization. MIT Press, Cambridge, MA.
Wagner, J. (1994): The Post-Entry Performance of New Small Firms in German Man-
ufacturing Industries, Journal of Industrial Economics 42, 141-154.
Wholey, D.R., Christianson, J.B., Sanchez, S.M. (1992) Organizational Size and Failure
among Health Maintenance Organizations, American Sociological Review 57, 829-
842.
20
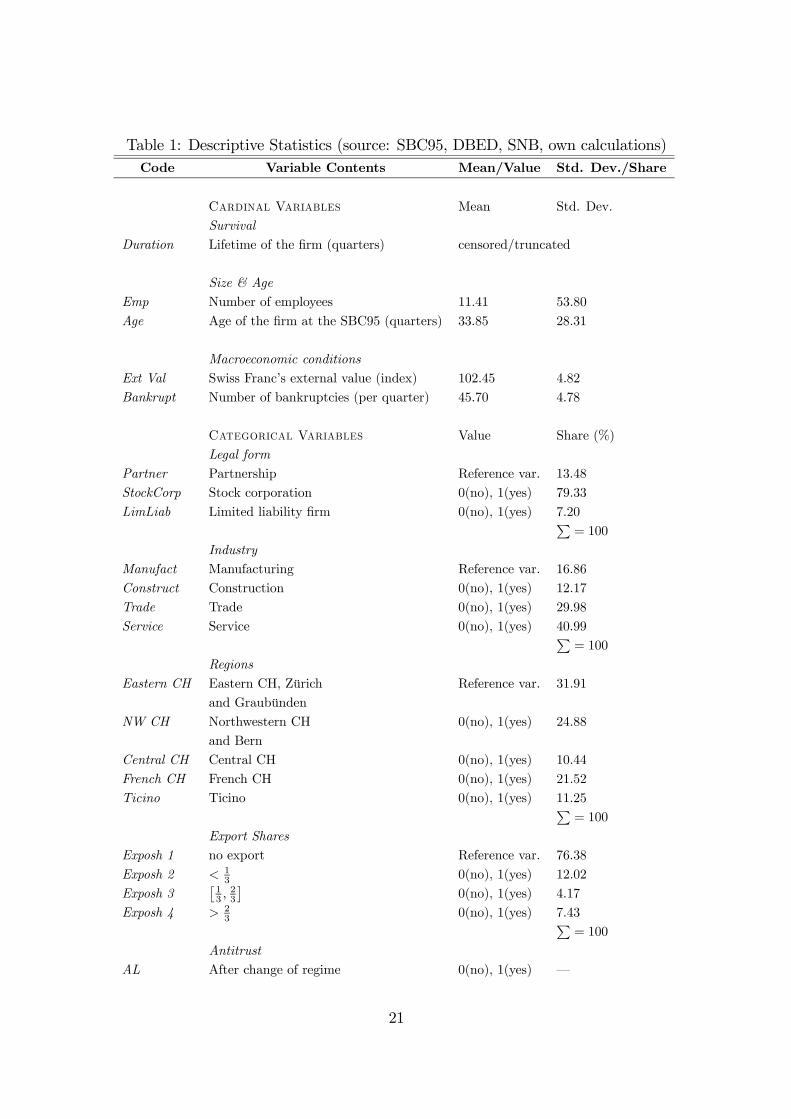
Table 1: Descriptive Statistics (source: SBC95, DBED, SNB, own calculations)Code Variable Contents Mean/Value Std. Dev./Share
Cardinal Variables Mean Std. Dev.Survival
Duration Lifetime of the firm (quarters) censored/truncated
Size & AgeEmp Number of employees 11.41 53.80
Age Age of the firm at the SBC95 (quarters) 33.85 28.31
Macroeconomic conditionsExt Val Swiss Franc’s external value (index) 102.45 4.82Bankrupt Number of bankruptcies (per quarter) 45.70 4.78
Categorical Variables Value Share (%)Legal form
Partner Partnership Reference var. 13.48StockCorp Stock corporation 0(no), 1(yes) 79.33
LimLiab Limited liability firm 0(no), 1(yes) 7.20P= 100
IndustryManufact Manufacturing Reference var. 16.86Construct Construction 0(no), 1(yes) 12.17Trade Trade 0(no), 1(yes) 29.98Service Service 0(no), 1(yes) 40.99P
= 100
Regions
Eastern CH Eastern CH, Zürich Reference var. 31.91and Graubünden
NW CH Northwestern CH 0(no), 1(yes) 24.88and Bern
Central CH Central CH 0(no), 1(yes) 10.44French CH French CH 0(no), 1(yes) 21.52Ticino Ticino 0(no), 1(yes) 11.25P
= 100
Export SharesExposh 1 no export Reference var. 76.38
Exposh 2 < 13 0(no), 1(yes) 12.02
Exposh 3£13 ,
23
¤0(no), 1(yes) 4.17
Exposh 4 > 23 0(no), 1(yes) 7.43P
= 100
AntitrustAL After change of regime 0(no), 1(yes) –
21
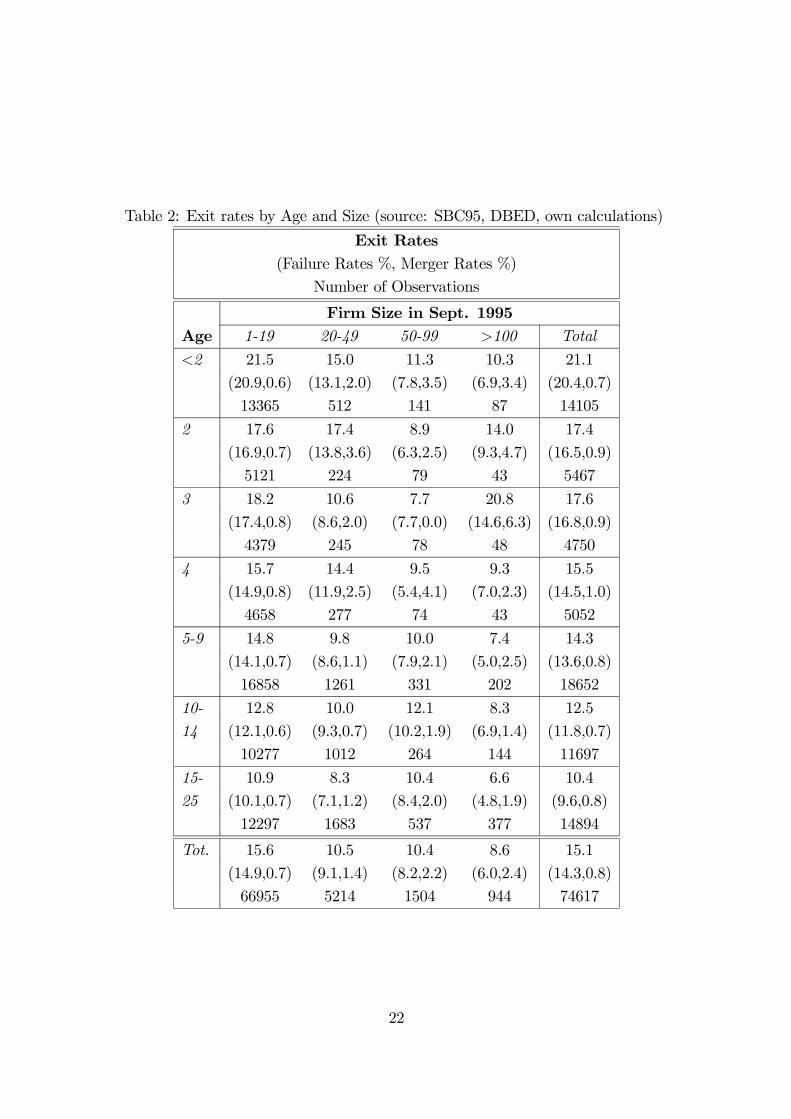
Table 2: Exit rates by Age and Size (source: SBC95, DBED, own calculations)
Exit Rates(Failure Rates %, Merger Rates %)
Number of Observations
Firm Size in Sept. 1995Age 1-19 20-49 50-99 >100 Total
<2 21.5 15.0 11.3 10.3 21.1
(20.9,0.6) (13.1,2.0) (7.8,3.5) (6.9,3.4) (20.4,0.7)
13365 512 141 87 14105
2 17.6 17.4 8.9 14.0 17.4
(16.9,0.7) (13.8,3.6) (6.3,2.5) (9.3,4.7) (16.5,0.9)
5121 224 79 43 5467
3 18.2 10.6 7.7 20.8 17.6
(17.4,0.8) (8.6,2.0) (7.7,0.0) (14.6,6.3) (16.8,0.9)
4379 245 78 48 4750
4 15.7 14.4 9.5 9.3 15.5
(14.9,0.8) (11.9,2.5) (5.4,4.1) (7.0,2.3) (14.5,1.0)
4658 277 74 43 5052
5-9 14.8 9.8 10.0 7.4 14.3
(14.1,0.7) (8.6,1.1) (7.9,2.1) (5.0,2.5) (13.6,0.8)
16858 1261 331 202 18652
10- 12.8 10.0 12.1 8.3 12.5
14 (12.1,0.6) (9.3,0.7) (10.2,1.9) (6.9,1.4) (11.8,0.7)
10277 1012 264 144 11697
15- 10.9 8.3 10.4 6.6 10.4
25 (10.1,0.7) (7.1,1.2) (8.4,2.0) (4.8,1.9) (9.6,0.8)
12297 1683 537 377 14894
Tot. 15.6 10.5 10.4 8.6 15.1
(14.9,0.7) (9.1,1.4) (8.2,2.2) (6.0,2.4) (14.3,0.8)
66955 5214 1504 944 74617
22
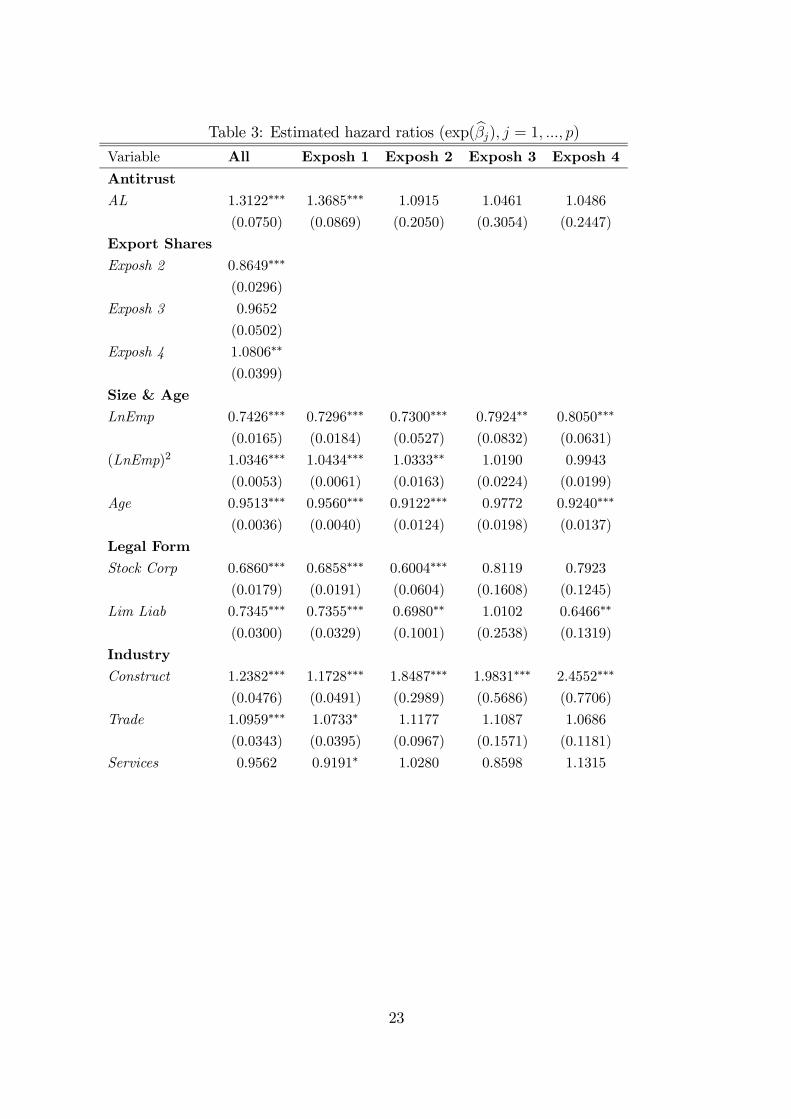
Table 3: Estimated hazard ratios (exp(bβj), j = 1, ..., p)Variable All Exposh 1 Exposh 2 Exposh 3 Exposh 4
AntitrustAL 1.3122∗∗∗ 1.3685∗∗∗ 1.0915 1.0461 1.0486
(0.0750) (0.0869) (0.2050) (0.3054) (0.2447)
Export SharesExposh 2 0.8649∗∗∗
(0.0296)
Exposh 3 0.9652
(0.0502)
Exposh 4 1.0806∗∗
(0.0399)
Size & AgeLnEmp 0.7426∗∗∗ 0.7296∗∗∗ 0.7300∗∗∗ 0.7924∗∗ 0.8050∗∗∗
(0.0165) (0.0184) (0.0527) (0.0832) (0.0631)
(LnEmp)2 1.0346∗∗∗ 1.0434∗∗∗ 1.0333∗∗ 1.0190 0.9943
(0.0053) (0.0061) (0.0163) (0.0224) (0.0199)
Age 0.9513∗∗∗ 0.9560∗∗∗ 0.9122∗∗∗ 0.9772 0.9240∗∗∗
(0.0036) (0.0040) (0.0124) (0.0198) (0.0137)
Legal FormStock Corp 0.6860∗∗∗ 0.6858∗∗∗ 0.6004∗∗∗ 0.8119 0.7923
(0.0179) (0.0191) (0.0604) (0.1608) (0.1245)
Lim Liab 0.7345∗∗∗ 0.7355∗∗∗ 0.6980∗∗ 1.0102 0.6466∗∗
(0.0300) (0.0329) (0.1001) (0.2538) (0.1319)
IndustryConstruct 1.2382∗∗∗ 1.1728∗∗∗ 1.8487∗∗∗ 1.9831∗∗∗ 2.4552∗∗∗
(0.0476) (0.0491) (0.2989) (0.5686) (0.7706)
Trade 1.0959∗∗∗ 1.0733∗ 1.1177 1.1087 1.0686
(0.0343) (0.0395) (0.0967) (0.1571) (0.1181)
Services 0.9562 0.9191∗ 1.0280 0.8598 1.1315
23
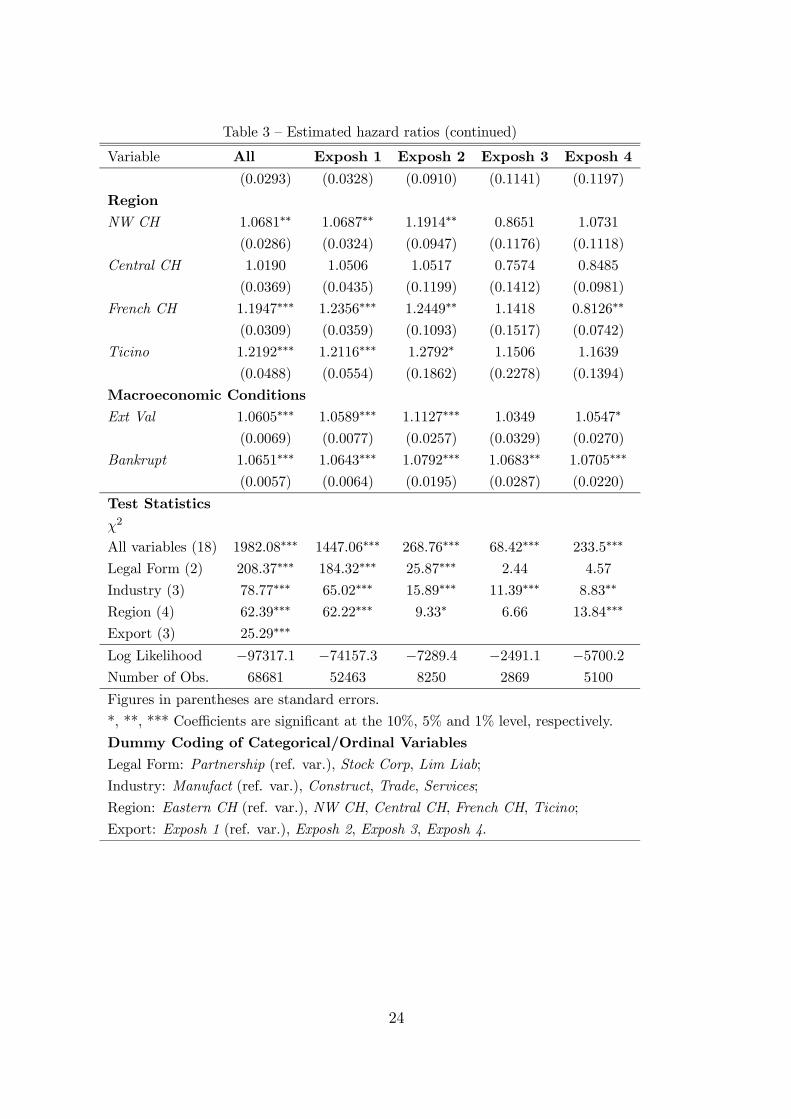
Table 3 — Estimated hazard ratios (continued)
Variable All Exposh 1 Exposh 2 Exposh 3 Exposh 4
(0.0293) (0.0328) (0.0910) (0.1141) (0.1197)
RegionNW CH 1.0681∗∗ 1.0687∗∗ 1.1914∗∗ 0.8651 1.0731
(0.0286) (0.0324) (0.0947) (0.1176) (0.1118)
Central CH 1.0190 1.0506 1.0517 0.7574 0.8485
(0.0369) (0.0435) (0.1199) (0.1412) (0.0981)
French CH 1.1947∗∗∗ 1.2356∗∗∗ 1.2449∗∗ 1.1418 0.8126∗∗
(0.0309) (0.0359) (0.1093) (0.1517) (0.0742)
Ticino 1.2192∗∗∗ 1.2116∗∗∗ 1.2792∗ 1.1506 1.1639
(0.0488) (0.0554) (0.1862) (0.2278) (0.1394)
Macroeconomic ConditionsExt Val 1.0605∗∗∗ 1.0589∗∗∗ 1.1127∗∗∗ 1.0349 1.0547∗
(0.0069) (0.0077) (0.0257) (0.0329) (0.0270)
Bankrupt 1.0651∗∗∗ 1.0643∗∗∗ 1.0792∗∗∗ 1.0683∗∗ 1.0705∗∗∗
(0.0057) (0.0064) (0.0195) (0.0287) (0.0220)
Test Statisticsχ2
All variables (18) 1982.08∗∗∗ 1447.06∗∗∗ 268.76∗∗∗ 68.42∗∗∗ 233.5∗∗∗
Legal Form (2) 208.37∗∗∗ 184.32∗∗∗ 25.87∗∗∗ 2.44 4.57
Industry (3) 78.77∗∗∗ 65.02∗∗∗ 15.89∗∗∗ 11.39∗∗∗ 8.83∗∗
Region (4) 62.39∗∗∗ 62.22∗∗∗ 9.33∗ 6.66 13.84∗∗∗
Export (3) 25.29∗∗∗
Log Likelihood −97317.1 −74157.3 −7289.4 −2491.1 −5700.2Number of Obs. 68681 52463 8250 2869 5100
Figures in parentheses are standard errors.
*, **, *** Coefficients are significant at the 10%, 5% and 1% level, respectively.
Dummy Coding of Categorical/Ordinal VariablesLegal Form: Partnership (ref. var.), Stock Corp, Lim Liab;
Industry: Manufact (ref. var.), Construct, Trade, Services;
Region: Eastern CH (ref. var.), NW CH, Central CH, French CH, Ticino;
Export: Exposh 1 (ref. var.), Exposh 2, Exposh 3, Exposh 4.
24

Working Papers of the Socioeconomic Institute at the University of Zurich
The Working Papers of the Socioeconomic Institute can be downloaded from http://www.soi.unizh.ch/research/wp/index2.html
0507 Ordered Response Models; Stefan Boes and Rainer Winkelmann, March 2005, 21p. 0506 Merge or Fail? The Determinants of Mergers and Bankruptcies in Switzerland, 1995-
2000; Stefan Buehler, Christian Kaiser, Franz Jaeger, March 2005, 18p. 0505 Consumer Resistance Against Regulation: The Case of Health Care
Peter Zweifel, Harry Telser, and Stephan Vaterlaus, February 2005, 23p. 0504 A Structural Model of Demand for Apprentices
Samuel Mühlemann, Jürg Schweri, Rainer Winkelmann and Stefan C. Wolter, February 2005, 25p.
0503 What can happiness research tell us about altruism?Evidence from the German Socio-Economic Panel Johannes Schwarze and Rainer Winkelmann, February 2005, 26p.
0502 Spatial Effects in Willingness-to-Pay: The Case of Nuclear Risks Peter Zweifel, Yves Schneider and Christian Wyss, January 2005, 37p. 0501 On the Role of Access Charges Under Network Competition
Stefan Buehler and Armin Schmutzler, January 2005, 30p. 0416 Social Sanctions in Interethnic Relations: The Benefit of Punishing your Friends Christian Stoff, Dezember 2004, 51p. 0415 Single Motherhood and (Un)equal Educational Opportunities: Evidence from
Germany Philippe Mahler and Rainer Winkelmann, November 2004, 23p.
0414 Are There Waves in Merger Activity After All? Dennis Gärtner and Daniel Halbheer, September 2004, 39p.
0413 Endogenizing Private Information: Incentive Contracts under Learning By Doing Dennis Gärtner, September 2004, 32p. 0412 Validity and Reliability of Willingness-to-pay Estimates: Evidence from Two
Overlapping Discrete-Choice Experiments Harry Telser, Karolin Becker and Peter Zweifel. September 2004, 25p. 0411 Willingness-to-pay Against Dementia: Effects of Altruism Between Patients and
Their Spouse Caregivers Markus König und Peter Zweifel, September 2004, 22p.
0410 Age and Choice in Health Insurance: Evidence from Switzerland Karolin Becker and Peter Zweifel, August 2004, 30p. 0409 Vertical Integration and Downstream Investment in Oligopoly
Stefan Buehler and Armin Schmutzler, July 2004, 30p. 0408 Mergers under Asymmetric Information – Is there a Leomons Problem?
Thomas Borek, Stefan Buehler and Armin Schmutzler, July 2004, 38p. 0407 Income and Happiness: New Results from Generalized Threshold
and Sequential Models Stefan Boes and Rainer Winkelmann, June 2004, 30p.
0406 Optimal Insurance Contracts without the Non-Negativity Constraint on Indemnities Revisited Michael Breuer, April 2004, 17p.
0405 Competition Policy and Exit Rates: Evidence from Switzerland Stefan Buehler, Christian Kaiser and Franz Jaeger, March 2004, 24p.

0404 Empirical Likelihood in Count Data Models: The Case of Endogenous Regressors Stefan Boes, March 2004, 22p.
0403 Globalization and General Worker Training Hans Gersbach and Armin Schmutzler, February 2004, 37p.
0402 Restructuring Network Industries: Dealing with Price-Quality Tradeoffs Stefan Bühler, Dennis Gärtner and Daniel Halbheer, January 2004, 18p.
0401 Deductible or Co-Insurance: Which is the Better Insurance Contract under Adverse Selection? Michael Breuer, January 2004, 18p.
0314 How Did the German Health Care Reform of 1997 Change the Distribution of the Demand for Health Services? Rainer Winkelmann, December 2003, 20p.
0313 Validity of Discrete-Choice Experiments – Evidence for Health Risk Reduction Harry Telser and Peter Zweifel, October 2003, 18p.
0312 Parental Separation and Well-Being of Youths Rainer Winkelmann, October 2003, 20p.
0311 Re-evaluating an Evaluation Study: The Case of the German Health Care Reform of 1997 Rainer Winkelmann, October 2003, 23p.
0310 Downstream Investment in Oligopoly Stefan Buehler and Armin Schmutzler, September 2003, 33p.
0309 Earning Differentials between German and French Speakers in Switzerland Alejandra Cattaneo and Rainer Winkelmann, September 2003, 27p.
0308 Training Intensity and First Labor Market Outcomes of Apprenticeship Graduates Rob Euwals and Rainer Winkelmann, September 2003, 25p.
0307 Co-payments for prescription drugs and the demand for doctor visits – Evidence from a natural experiment Rainer Winkelmann, September 2003, 22p.
0306 Who Integrates? Stefan Buehler and Armin Schmutzler, August 2003, 29p.
0305 Strategic Outsourcing Revisited Stefan Buehler and Justus Haucap, July 2003, 22p.
0304 What does it take to sell Environmental Policy? An Empirical Analysis for Switzerland Daniel Halbheer, Sarah Niggli and Armin Schmutzler, 2003, 30p.
0303 Mobile Number Portability Stefan Buehler and Justus Haucap, 2003, 12p. 0302 Multiple Losses, Ex-Ante Moral Hazard, and the Non-Optimality of the Standard
Insurance Contract Michael Breuer, 2003, 18p.
0301 Lobbying against Environmental Regulation vs. Lobbying for Loopholes Andreas Polk and Armin Schmutzler, 2003, 37p.
0214 A Product Market Theory of Worker Training Hans Gersbach and Armin Schmutzler, 2002, 34p.
0213 Weddings with Uncertain Prospects – Mergers under Asymmetric Information Thomas Borek, Stefan Buehler and Armin Schmutzler, 2002, 35p.
0212 Estimating Vertical Foreclosure in U.S. Gasoline Supply Zava Aydemir and Stefan Buehler, 2002, 42p.
0211 How much Internalization of Nuclear RiskThrough Liability Insurance? Yves Schneider and Peter Zweifel, 2002, 18p.


