Complex Event Processing inDistributed Systems
�
David C. Luckham and Brian FrascaProgram Analysis and Verification Group
Computer Systems LabStanford University
�
August 18, 1998
Abstract
Complex event processing is a new technology for extracting information from dis-tributed message-based systems. This technology allows users of a system to specifythe information that is of interest to them. It can be low level network processingdata or high level enterprise management intelligence, depending upon the role andviewpoint of individual users. And it can be changed from moment to moment whilethe target system is in operation. This paper presents an overview of Complex EventProcessing applied to a particular example of a distributed message-based system, afabrication process management system. The concepts of causal event histories, eventpatterns, event filtering, and event aggregation are introduced and their applicationto the process management system is illustrated by simple examples. This paper givesthe reader an overview of Complex Event Processing concepts and illustrates how theycan be applied using the RAPIDE toolset to one specific kind of system.
1 Towards Hierarchical Viewing
Many computer systems in operation today are distributed systems. Typical examplesare systems supporting commercial applications such as distributed financial transac-
�This project is funded by DARPA under ONR contract N00014-92-J-1928 and Air Force Rome
Labs Grant F30602-96-2-0191, and by AFOSR under Grant F49620-95-1-0093�We are indebted to members of the RAPIDE project who built the Rapide tools that were used in
this study, and for helping with the study: Marc Abramowitz, John Kenny, Walter Mann, Sigurd Meldal,Woosang Park, Louis Perrochon, Alex Santoro, James Vera.
1
tion processing systems, warehousing systems, and fabrication process control sys-tems. Generally speaking, the business operations of any global coporation are sup-ported by a widely distributed, message-based computer system. Military commandand control systems are also distributed systems. Although the types of component ob-jects in commercial and military systems are mostly different, the underlying paradigmis the same: a widely dispersed set of several hundreds or thousands of application pro-grams (or objects) communicating with one another by means of messages transmittedover various kinds of media.
In distributed message-based systems the component objects are communicating withone another “at a distance” by means of sending messages or by remote method invoca-tion. Communication between objects uses a communication layer. This is a mediumthat can vary from something as primitive as Ethernet to higher level comunication lay-ers such as the Internet or some more specialized kind of middleware. Middleware fordistributed applications includes CORBA ORBs and Information Busses. Middlewareprovides a layer of communication protocols together with APIs that the objects of asystem use to communicate. It contains, and hides, lower level networks, databases,demons and other such stuff. There are several widely used commercial middlewareproducts that form the communication layer for largescale business enterprises (seee.g., [Gro91], [TIB]).
The communication layer is usually viewed as being the lowest levels of a distributedsystem. Newspaper articles refer to it as the “under-the-hood” part of, say, a popularmultimedia product hosted on the Internet. It is generally looked upon as somethingthe common man should not know about and certainly not tinker with — it is a sourceof evil and many system problems. And when it collapses in one of many well-knownor not so well-known ways, the system grinds to a halt. We often hear “The network isdown.” Network crashes can become a critical concern to the higher level echelons in adistributed enterprise. So the communication layer becomes the domain of a powerfulnew kind of gnome, the specialist in network management, to the exclusion of allothers in the system.
1.1 Today’s diagnostics are too low level
Most distributed systems have built-in diagnostics to try to solve the network man-agement problems. They use the communications layer to record and log particularkinds of messages (also called events) that indicate the performance of basic opera-tions such as network functions. The event logs are fed to various commercial viewingtools. System administrators can view the logs and perform different kinds of measure-ments on them. This gives a primitive way of keeping track of how the communicationlayer is behaving and detecting overloading or failures on various pathways through it.Providing one can figure out from the event log exactly what is happening in the com-munication layer, action can be taken to keep the system’s communications operatingsmoothly. At present, the number of event viewing and analysis tools is expanding
2
rapidly to meet growing commercial needs.
But event-based diagnostics is still at a very primitive, embryonic stage. The kinds ofevents that are logged are low level events. They are intended to deal with network andcommunications layer management. The event logs can become very large. Eventsthat indicate related activities in the communication layer may appear to be widelyseparated by other events and by time. And there may be a lot of irrelevent eventsmixed in with ones of interest. Techniques to “pick out” events of interest are needed.Also, the event logs lack causal information — i.e., which events caused some eventto happen. This means that when we view a large event log, and an event that indicatesan error turns up, like a server going down, we cannot immediately focus on the otherevents in the log that led up to the failure. Instead, we have to use a lot of knowledgeabout the network to try to figure it out. So, even at the communication level, the eventlogs are hard to analyse and interpret usefully.
But getting information about application level activities is in even worse shape. Atpresent the low level event logs are not used to help with problems in other layers of thesystem, say in the component objects rather than in the communication layer. To helpus identify problems in the objects, we need to be able to relate sets of communicationevents with higher level operations that the objects perform. So far, the technology todo this has not been available.
There are also problems of “inflexibility”. In many situations, we need the objects togenerate meaningful events about their activities too — not just the network. Also,the types of events that are generated in present day diagnostics are designed into thesystem when it is built. So we lack the flexibility to generate new types of events todeal with new or unexpected problems that turn up while the system is in operation.We need to be able to vary the set of events that are generated by the system to fit withwhat we are interested in at any time.
1.2 The need for flexible multilevel viewing
So when we look at the current state of event-based diagnostics we see the need formore powerful monitoring and viewing tools. And the basis we need to do this isthe ability to aggregate sets of low level events into higher level events that give usinformation about what the component objects of the system are trying to do at theapplication level. For example, we would like the ability to:
� easily specify “interesting events” in large event logs, and filter them out fromthe rest of the events,
� aggregate sets of low level events into the corresponding abstract higher levelevents that they signify,
� detect causal relationships between events (at any level of abstraction) that hap-pen at different times in various subsystems,
3
� monitor event logs at any abstraction level during a system’s operation, and au-tomatically detect violations of critical requirements (e.g., security violations).
RAPIDE complex event processing lets us add such capabilities to a distributed system.We apply this technology to the communication layer and existing low level networkevent logging facilities. When we do this, not only do we improve the monitoring anddiagnostics at the network level, but we can provide system viewing and managementat any level in the system. The communications layer now becomes a source of infor-mation — not just a source of aggravation. Also this technology is flexible. We canadd new kinds of event-based viewing to a system, as and when needed, on the flywhile the system is in operation.
In this paper we illustrate the concepts of RAPIDE complex event processing and howthey apply to a particular system — a fabrication process management system.
2 Abstraction Hierarchies and Flexible Viewing
A very powerful technique to help in understanding a complex system is to separate thesystem’s activities and operations into layers. This is called an abstraction hierarchy.It allows us to view the system’s activities one layer at a time. For example, we donthave to think about low level packets of bits, headers and timeouts, at the same timeas we think about higher level operations such as sending and receiving Email. Thesets of operations are separated into different levels. We can translate the high levelactivities to a lower level when we want to.
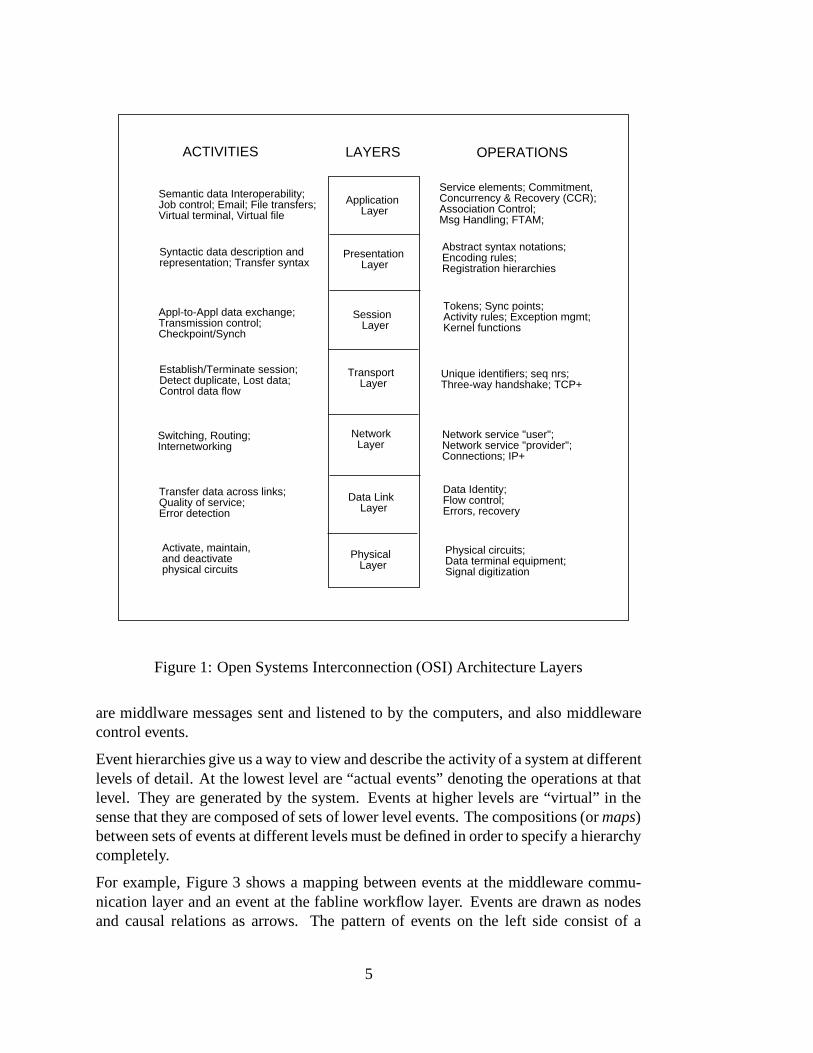
Some abstraction hierarchies have become international standards, such as the ISOOSI inter-connection reference model for network-based systems [Int87] shown inFigure 1. In the case of the ISO standard, protocols are defined to specify the activity ateach level in terms of the operations at that level. And relations between the operationsat different levels are also defined precisely.
RAPIDE complex event processing lets us apply to any system the idea of organizingactivities and operations into an abstraction hierarchy. In the case of message-basedsystems, we can organize the activities and events into layers. The events include themessages generated by the system, but in addition there are events that denote otheractivities such as a change of state of a component or the start or completion of a task,perhaps high level tasks. Events are like messages in form (they contain data etc.) butin addition they also denote activities. A typical low level example is a heartbeat event,which is a message “I’m alive”, that denotes (and lets other components know) that thesource component is still active. In fact, an event always denotes an activity.
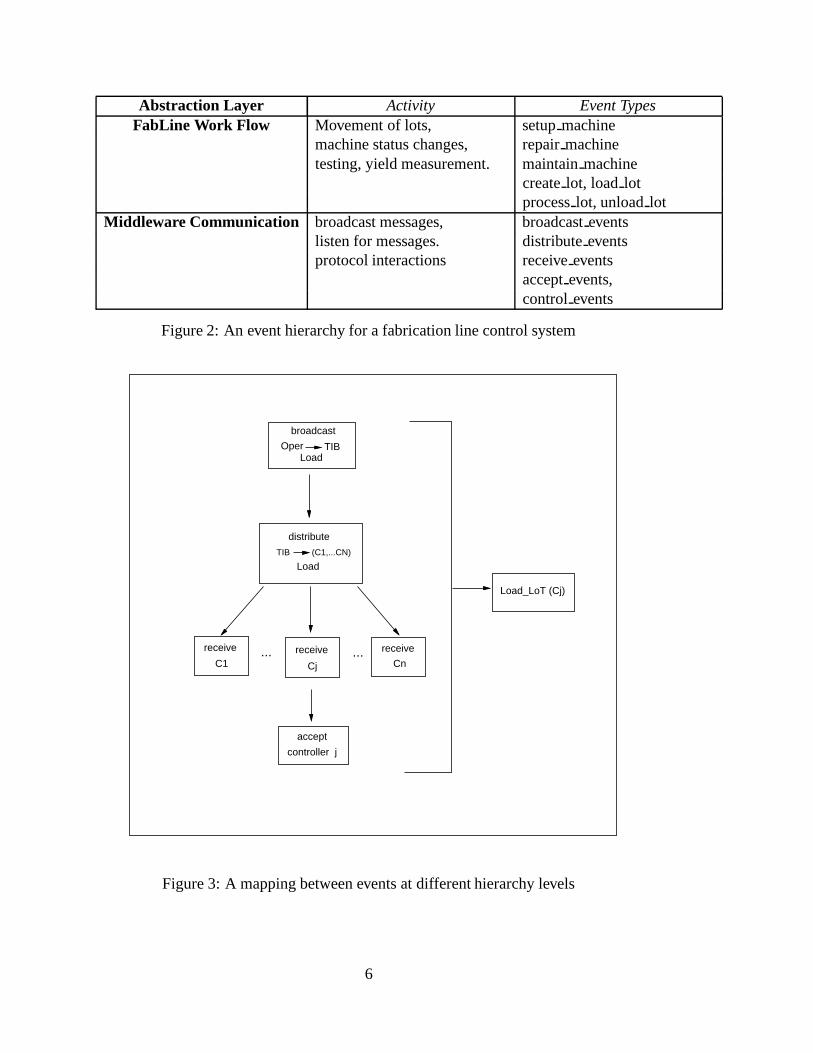
Figure 2 shows a two-layer hierarchy for a Fabline. Higher level events are related tofabrication line work flow activities such as moving lots in and out of equipment, pro-cessing lots inside equipment, and measuring lot yields. The lower level events denotecommunication between the computers that manage the robots and equipment; these
4
LAYERSACTIVITIES OPERATIONS
Application Layer
Presentation Layer
Session Layer
Transport Layer
Data Link Layer
Physical Layer
Semantic data Interoperability;Job control; Email; File transfers;Virtual terminal, Virtual file
Syntactic data description andrepresentation; Transfer syntax
Appl-to-Appl data exchange;Transmission control;Checkpoint/Synch
Establish/Terminate session;Detect duplicate, Lost data;Control data flow
Network Layer
Switching, Routing;Internetworking
Transfer data across links;Quality of service;Error detection
Activate, maintain,and deactivatephysical circuits
Service elements; Commitment,Concurrency & Recovery (CCR);Association Control;Msg Handling; FTAM;
Abstract syntax notations;Encoding rules;Registration hierarchies
Tokens; Sync points;Activity rules; Exception mgmt;Kernel functions
Unique identifiers; seq nrs;Three-way handshake; TCP+
Network service "user";Network service "provider";Connections; IP+
Data Identity;Flow control;Errors, recovery
Physical circuits;Data terminal equipment;Signal digitization
Figure 1: Open Systems Interconnection (OSI) Architecture Layers
are middlware messages sent and listened to by the computers, and also middlewarecontrol events.
Event hierarchies give us a way to view and describe the activity of a system at differentlevels of detail. At the lowest level are “actual events” denoting the operations at thatlevel. They are generated by the system. Events at higher levels are “virtual” in thesense that they are composed of sets of lower level events. The compositions (or maps)between sets of events at different levels must be defined in order to specify a hierarchycompletely.
For example, Figure 3 shows a mapping between events at the middleware commu-nication layer and an event at the fabline workflow layer. Events are drawn as nodesand causal relations as arrows. The pattern of events on the left side consist of a
5
Abstraction Layer Activity Event TypesFabLine Work Flow Movement of lots, setup machine
machine status changes, repair machinetesting, yield measurement. maintain machine
create lot, load lotprocess lot, unload lot
Middleware Communication broadcast messages, broadcast eventslisten for messages. distribute eventsprotocol interactions receive events
accept events,control events
Figure 2: An event hierarchy for a fabrication line control system
receive
C1receive
Cj
receive
Cn
Load_LoT (Cj)
... ...
broadcast
TIBOperLoad
distribute
TIB (C1,...CN)
Load
accept
controller j
Figure 3: A mapping between events at different hierarchy levels
6
broadcast from, say an operator, which goes on the middleware (in this example, amodel of TIBCO Rendezvous) and causes a distribute event, which in turn causesmultiple receive events at the middleware’s clients (control system computers). Onecontrol computer accepts the message. The result at the fabline work flow level isa virtual Load Lot event. It denotes the workflow activity of loading a lot into someequipment.
The causal relationships are important because there can be several such communica-tions involving similar messages going on concurrently. Casuality allows us to quicklydetect which communication layer events are playing in the same fabline workflowactivity. A set of events together with relationships between them, such as causality,is called a poset (partially ordered set of events).
If we define an abstraction hierachy, RAPIDE complex event processing allows us toconstruct the higher level events and process them exactly as any other events. This isdone by two kinds of objects:
� filters. Filters take posets of events as input and output some of the input events.Filters are defined by event patterns. They output (or pass through) those inputposets that match their patterns. Their effect is to reduce the number of events,hopefully to those of interest or importance.
� Maps. Maps take posets of events as input and generate new events. They aredefined by pairs of input and output event patterns. Whenever a subset of eventsin the input matches an input pattern, a map reacts by generating the events in thecorresponding output pattern. Maps are also called aggregators. Their purposeis to construct higher level events.
The basis for defining maps and filters is event patterns about which we will say morelater.
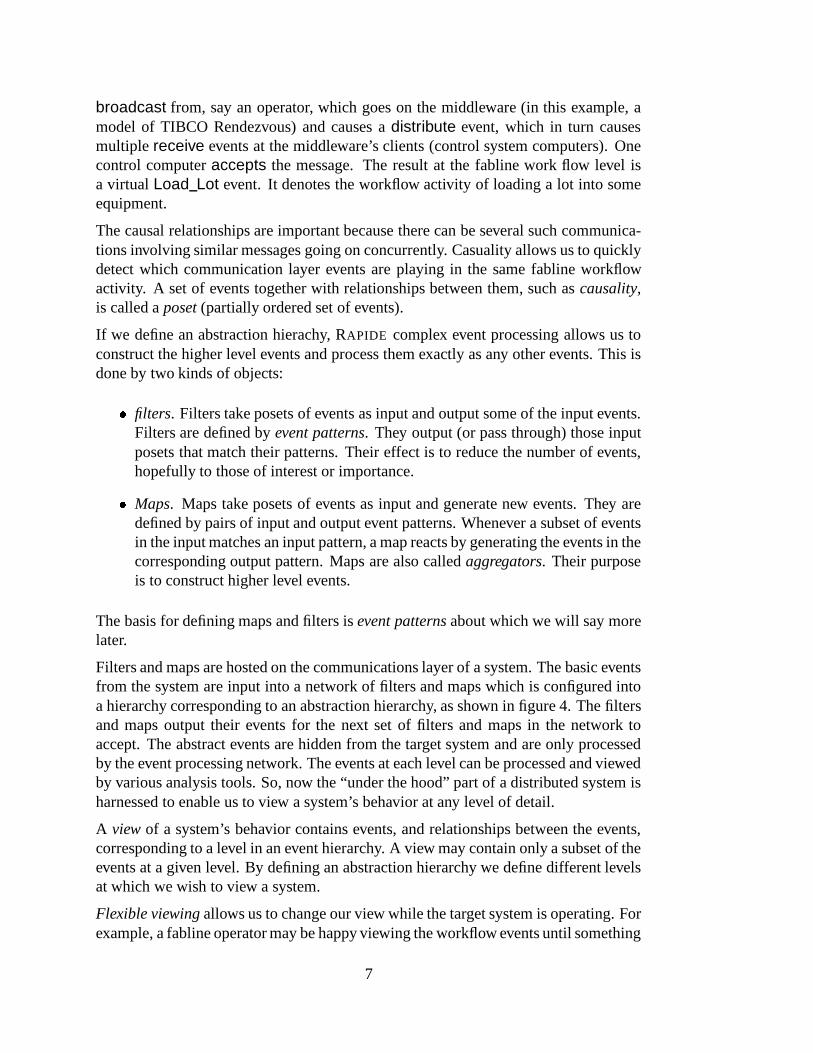
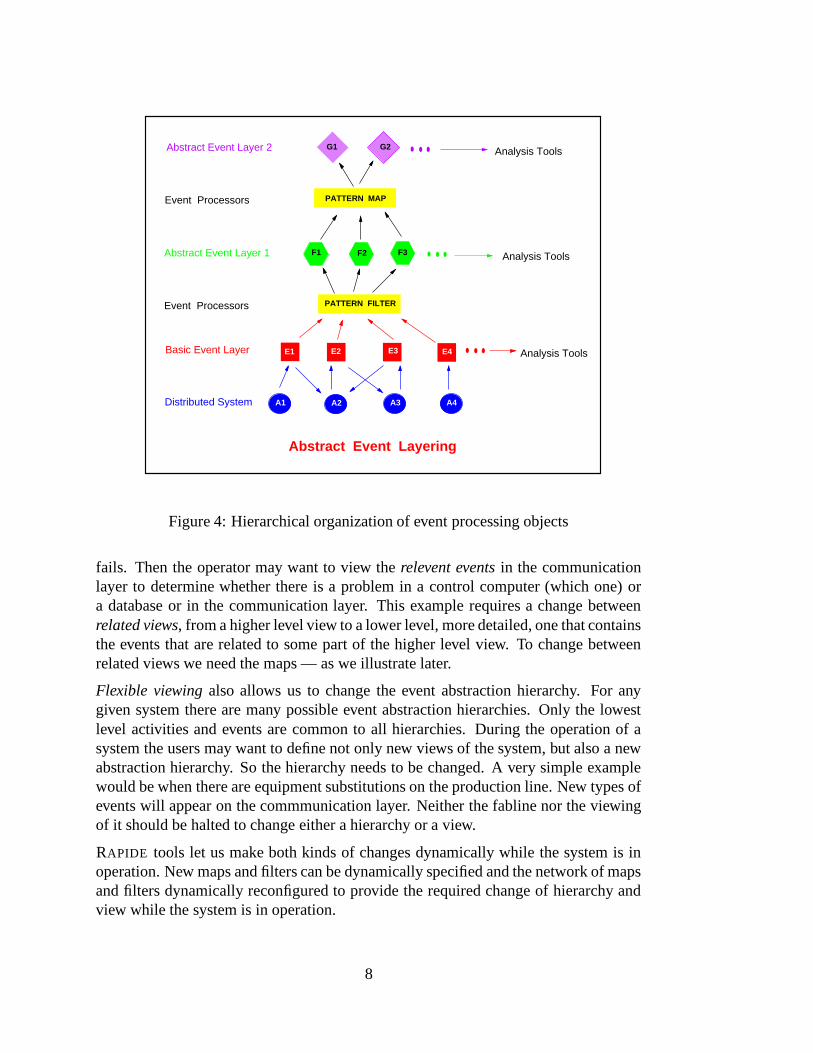
Filters and maps are hosted on the communications layer of a system. The basic eventsfrom the system are input into a network of filters and maps which is configured intoa hierarchy corresponding to an abstraction hierarchy, as shown in figure 4. The filtersand maps output their events for the next set of filters and maps in the network toaccept. The abstract events are hidden from the target system and are only processedby the event processing network. The events at each level can be processed and viewedby various analysis tools. So, now the “under the hood” part of a distributed system isharnessed to enable us to view a system’s behavior at any level of detail.
A view of a system’s behavior contains events, and relationships between the events,corresponding to a level in an event hierarchy. A view may contain only a subset of theevents at a given level. By defining an abstraction hierarchy we define different levelsat which we wish to view a system.
Flexible viewing allows us to change our view while the target system is operating. Forexample, a fabline operator may be happy viewing the workflow events until something
7
A1 A4A3A2
Abstract Event Layering
E2E1 E3 E4
F1 F2 F3
PATTERN FILTER
PATTERN MAP
G1 G2Abstract Event Layer 2
Abstract Event Layer 1
Event Processors
Basic Event Layer
Distributed System
Event Processors
Analysis Tools
Analysis Tools
Analysis Tools
Figure 4: Hierarchical organization of event processing objects
fails. Then the operator may want to view the relevent events in the communicationlayer to determine whether there is a problem in a control computer (which one) ora database or in the communication layer. This example requires a change betweenrelated views, from a higher level view to a lower level, more detailed, one that containsthe events that are related to some part of the higher level view. To change betweenrelated views we need the maps — as we illustrate later.
Flexible viewing also allows us to change the event abstraction hierarchy. For anygiven system there are many possible event abstraction hierarchies. Only the lowestlevel activities and events are common to all hierarchies. During the operation of asystem the users may want to define not only new views of the system, but also a newabstraction hierarchy. So the hierarchy needs to be changed. A very simple examplewould be when there are equipment substitutions on the production line. New types ofevents will appear on the commmunication layer. Neither the fabline nor the viewingof it should be halted to change either a hierarchy or a view.
RAPIDE tools let us make both kinds of changes dynamically while the system is inoperation. New maps and filters can be dynamically specified and the network of mapsand filters dynamically reconfigured to provide the required change of hierarchy andview while the system is in operation.
8
3 Causal Event Histories
Complex event processing operates not only on sets of events but also relationshipsbetween events. Relationships between events can be specified in event patterns inmaps and filters.
Events in a distributed system have various relationships to one another. Time withrespect to a system clock is one relation: event A happened before event B. Usuallytiming is represented by timestamps in the events. Cause is another relation: event Acaused event B to happen. And conversely, A and B are independent if they are notcausally related. Causal relations can be encoded in genetic data in the events or byother means (see references to RAPIDE [LKA
�
95], [LV95]).
There are different ways that a causal relation can be defined. For example, activi-ties such as two threads synchronizing by means of locks, or writing and reading thesame object, may imply a causal relation between events in the two threads. Theseare examples of computational cause, so called because the causal relation is directlyimplied by the semantics of the operations being performed in the computation thatis generating the events. We can also infer causal relations between events from thesemantics of the programming language (say Java) of the system and the semantics ofthe operations in the communication layer (say, TIBCO Rendezvous).
There are other models of causal relations between events that can be defined usingstatistics and probabilities. These causal models can also be used in complex eventprocessing (see, e.g., [?]). Probabilistic models of causality should be supersets ofcomputational causality in the sense that if any two events are causally related by thecomputation then they must be related by any probabilistic model of cause, but theprobabilistic model may also related other events as well. So, computational causalityis the minimal causal relationship between events that is imposed by the target systemitself. It does not include effects external to the system such as social and economicforces, or effects of Nature.
Network management tools today do not provide explicit causal event viewing, butrather work on traces of events. Event traces are sets of events, possibly ordered bytimestamps, but not containing any explicit representation of causality between theevents. Causality can sometimes be deduced from data in the events, or from proba-bilistic models defined by the system builders (this latter being unreliable). Complexevent processing works with explicit representations of event causality, and works withany model of cause. Our examples in this paper use computational causality.
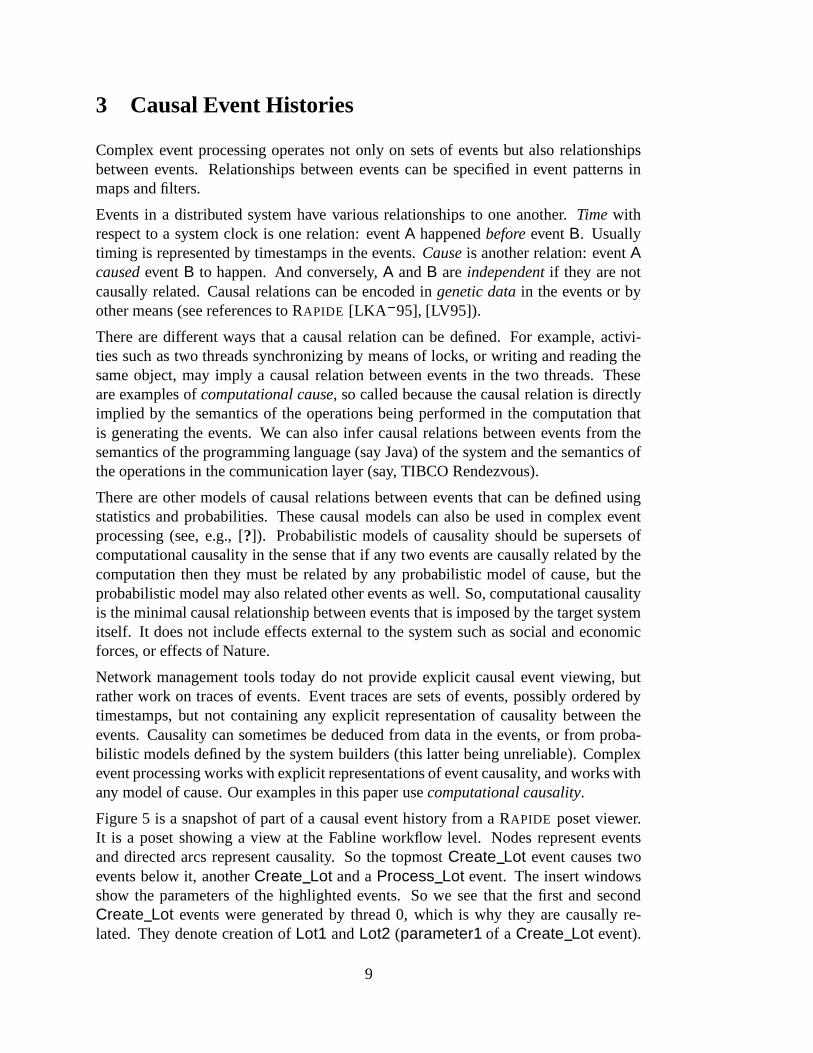
Figure 5 is a snapshot of part of a causal event history from a RAPIDE poset viewer.It is a poset showing a view at the Fabline workflow level. Nodes represent eventsand directed arcs represent causality. So the topmost Create Lot event causes twoevents below it, another Create Lot and a Process Lot event. The insert windowsshow the parameters of the highlighted events. So we see that the first and secondCreate Lot events were generated by thread 0, which is why they are causally re-lated. They denote creation of Lot1 and Lot2 (parameter1 of a Create Lot event).
9
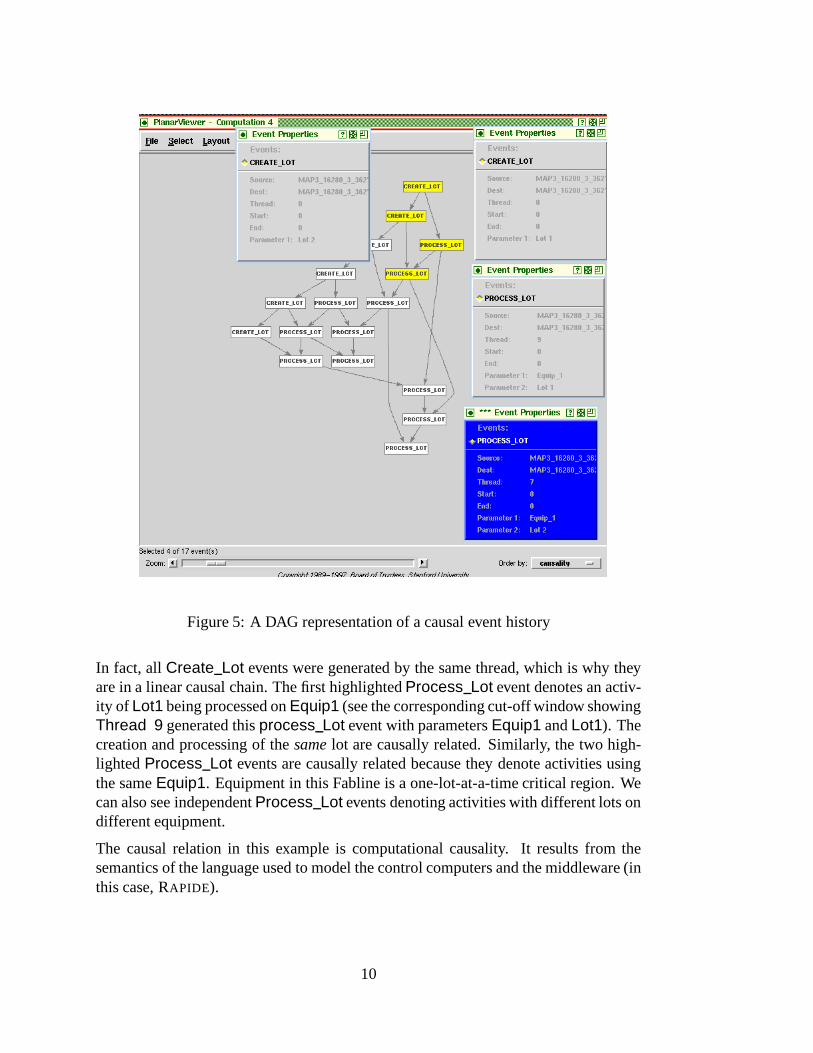
Figure 5: A DAG representation of a causal event history
In fact, all Create Lot events were generated by the same thread, which is why theyare in a linear causal chain. The first highlighted Process Lot event denotes an activ-ity of Lot1 being processed on Equip1 (see the corresponding cut-off window showingThread 9 generated this process Lot event with parameters Equip1 and Lot1). Thecreation and processing of the same lot are causally related. Similarly, the two high-lighted Process Lot events are causally related because they denote activities usingthe same Equip1. Equipment in this Fabline is a one-lot-at-a-time critical region. Wecan also see independent Process Lot events denoting activities with different lots ondifferent equipment.
The causal relation in this example is computational causality. It results from thesemantics of the language used to model the control computers and the middleware (inthis case, RAPIDE).
10
T I B
RecipeManagement
System
TestAnalyzer
Operator StatisticalProcessControl(SPC)
SPCDatabase
YieldEvaluator
MaterialHandlingSystem
EquipmentController
1
Equip1
EquipmentController
2
Equip2
WorkIn
Progress(WIP)
MES
WIPDatabase
Figure 6: Low level architectural model of a Fabline control system
4 A Fabrication Process Management System
To illustrate complex event processing we use a scaled down model of a managementsystem for a silicon chip fabrication line. These kinds of systems consist of severalhundred computers communicating across a middleware layer. Figure 6 shows a smallsubset of a typical fabline configuration with eleven computers. It contains most ofthe interesting types of computer as described in [CS96], e.g., work in progress (WIP),material handling system (MHS), statistical process control (SPC), etc., and equipmentcontrol. In a fullscale system there are a lot more pieces of equipement and theircontrol computers.
The model in Figure 6 also contains the communication layer, in this case TIBCO’sRendezvous Information Bus (called TIB). The control system computers communi-cate by broadcasting and listening for messages on TIB. Typical events at this level areTIB Send
�subject, data � and TIB Listen
�subject, data � . Several of these events
in a correct sequence, make up a meaningful communication between a pair of com-puters. When one views the event traffic on the TIB one gets a jumble of Send andListen events corresponding to different transactions between different system com-ponents. Figure 6 shows the architecture of the Fabline corresponding to the lowestabstraction level, the middleware communication level, of Figure 8.
11
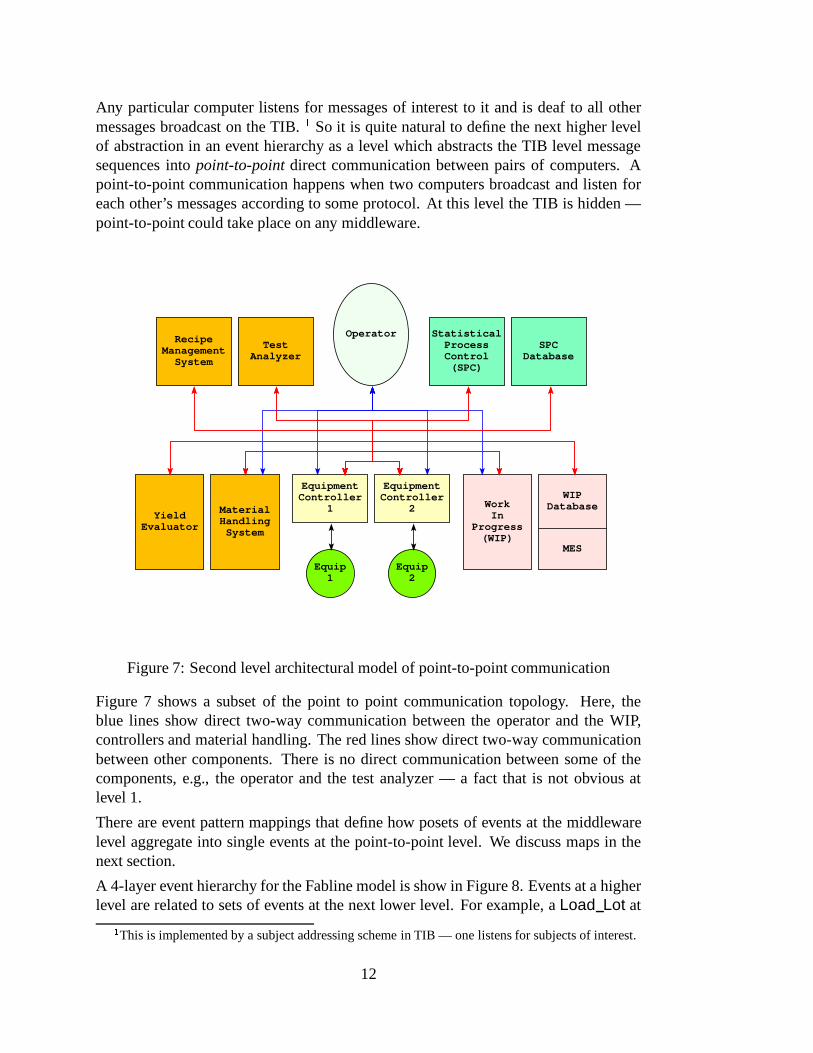
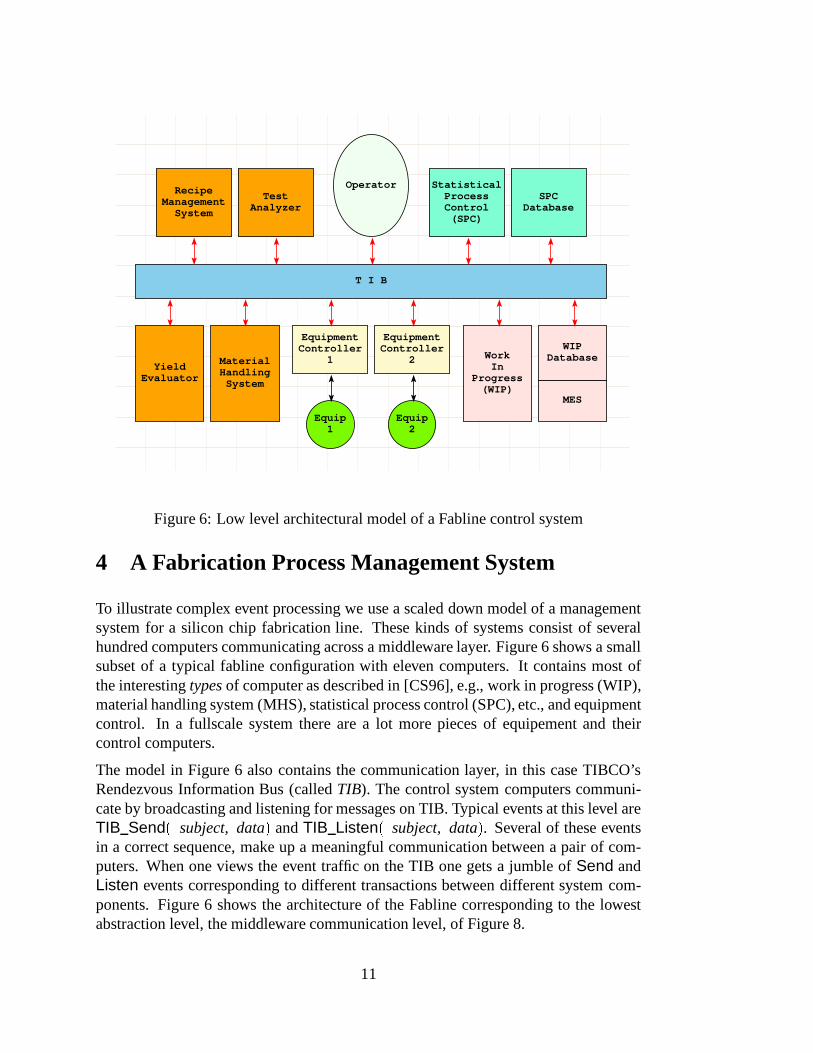
Any particular computer listens for messages of interest to it and is deaf to all othermessages broadcast on the TIB.
�
So it is quite natural to define the next higher levelof abstraction in an event hierarchy as a level which abstracts the TIB level messagesequences into point-to-point direct communication between pairs of computers. Apoint-to-point communication happens when two computers broadcast and listen foreach other’s messages according to some protocol. At this level the TIB is hidden —point-to-point could take place on any middleware.
RecipeManagement
System
TestAnalyzer
Operator StatisticalProcessControl(SPC)
SPCDatabase
YieldEvaluator
MaterialHandlingSystem
EquipmentController
1
Equip1
EquipmentController
2
Equip2
WorkIn
Progress(WIP)
MES
WIPDatabase
Figure 7: Second level architectural model of point-to-point communication
Figure 7 shows a subset of the point to point communication topology. Here, theblue lines show direct two-way communication between the operator and the WIP,controllers and material handling. The red lines show direct two-way communicationbetween other components. There is no direct communication between some of thecomponents, e.g., the operator and the test analyzer — a fact that is not obvious atlevel 1.
There are event pattern mappings that define how posets of events at the middlewarelevel aggregate into single events at the point-to-point level. We discuss maps in thenext section.
A 4-layer event hierarchy for the Fabline model is show in Figure 8. Events at a higherlevel are related to sets of events at the next lower level. For example, a Load Lot at
�
This is implemented by a subject addressing scheme in TIB — one listens for subjects of interest.
12
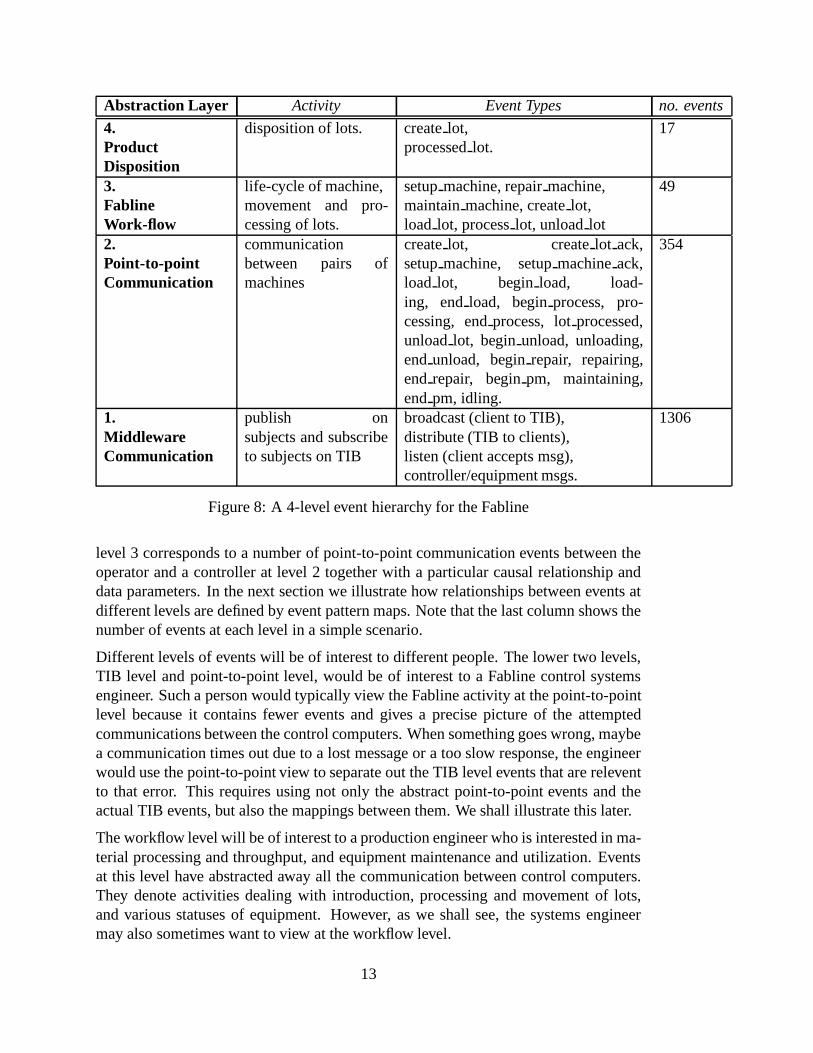
Abstraction Layer Activity Event Types no. events
4.ProductDisposition
disposition of lots. create lot,processed lot.
17
3.FablineWork-flow
life-cycle of machine,movement and pro-cessing of lots.
setup machine, repair machine,maintain machine, create lot,load lot, process lot, unload lot
49
2.Point-to-pointCommunication
communicationbetween pairs ofmachines
create lot, create lot ack,setup machine, setup machine ack,load lot, begin load, load-ing, end load, begin process, pro-cessing, end process, lot processed,unload lot, begin unload, unloading,end unload, begin repair, repairing,end repair, begin pm, maintaining,end pm, idling.
354
1.MiddlewareCommunication
publish onsubjects and subscribeto subjects on TIB
broadcast (client to TIB),distribute (TIB to clients),listen (client accepts msg),controller/equipment msgs.
1306
Figure 8: A 4-level event hierarchy for the Fabline
level 3 corresponds to a number of point-to-point communication events between theoperator and a controller at level 2 together with a particular causal relationship anddata parameters. In the next section we illustrate how relationships between events atdifferent levels are defined by event pattern maps. Note that the last column shows thenumber of events at each level in a simple scenario.
Different levels of events will be of interest to different people. The lower two levels,TIB level and point-to-point level, would be of interest to a Fabline control systemsengineer. Such a person would typically view the Fabline activity at the point-to-pointlevel because it contains fewer events and gives a precise picture of the attemptedcommunications between the control computers. When something goes wrong, maybea communication times out due to a lost message or a too slow response, the engineerwould use the point-to-point view to separate out the TIB level events that are releventto that error. This requires using not only the abstract point-to-point events and theactual TIB events, but also the mappings between them. We shall illustrate this later.
The workflow level will be of interest to a production engineer who is interested in ma-terial processing and throughput, and equipment maintenance and utilization. Eventsat this level have abstracted away all the communication between control computers.They denote activities dealing with introduction, processing and movement of lots,and various statuses of equipment. However, as we shall see, the systems engineermay also sometimes want to view at the workflow level.
13
The product disposition level deals with the manufacturing status of chip lots. Allworkflow activities have been abstracted away. This level would be of interest to uppermanagement in the production and sales organizations.
Finally, it is important to emphasize that abstraction hierarchies are usually quite sub-jective. Only a few of them become industry standards. During the day-to-day opera-tion of a system various viewers may want to change portions of the hierachy. RAPIDE
allows us to change an event abstraction hierarchy simply by changing the event def-initions at various levels, and the event pattern maps. These changes can be made onthe fly while the system is in operation and its middleware events are being monitored.
5 Defining An Event Hierachy
The hierarchy in Figure 8 is specified by event aggregation maps. A map is an objectcontaining a set of mapping rules. Each rule is a pair of event patterns, a left and aright pattern. The map listens for events at one level and tries to match its left patternsagainst the incoming events. When a match happens, variables in that left pattern willbe bound to objects in the matching event set so as to make the pattern and the eventset identical. So, the result of a successful match is a binding of pattern variables toobjects.
When a left pattern matches, the binding of variables to objects is applied to the corre-sponding right pattern. The result is an event, or in the general case, a causally relatedset of events. These right hand events are generated by the map. They will be events atthe next higher level above the incoming event level. These virtual events are put outon the middleware for other maps to observe. So we can construct a hierarchy of eventprocessing maps, as shown in Figure 4 corresponding to any abstraction hierarchy.
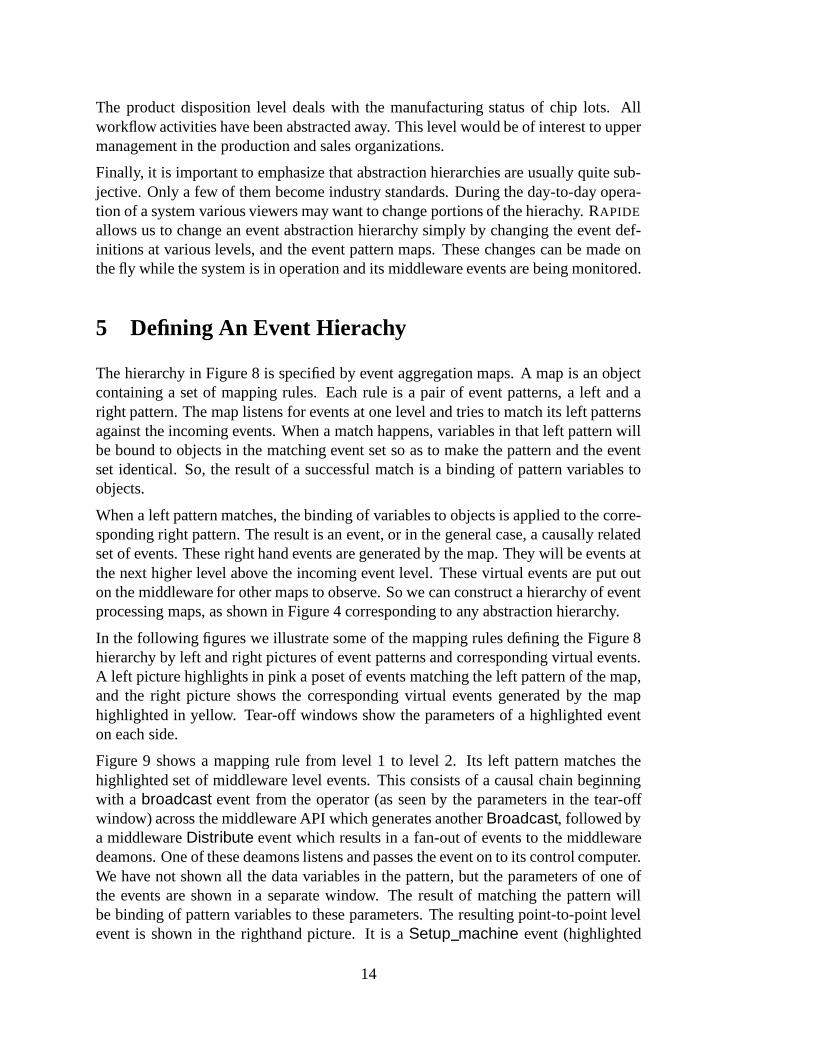
In the following figures we illustrate some of the mapping rules defining the Figure 8hierarchy by left and right pictures of event patterns and corresponding virtual events.A left picture highlights in pink a poset of events matching the left pattern of the map,and the right picture shows the corresponding virtual events generated by the maphighlighted in yellow. Tear-off windows show the parameters of a highlighted eventon each side.
Figure 9 shows a mapping rule from level 1 to level 2. Its left pattern matches thehighlighted set of middleware level events. This consists of a causal chain beginningwith a broadcast event from the operator (as seen by the parameters in the tear-offwindow) across the middleware API which generates another Broadcast, followed bya middleware Distribute event which results in a fan-out of events to the middlewaredeamons. One of these deamons listens and passes the event on to its control computer.We have not shown all the data variables in the pattern, but the parameters of one ofthe events are shown in a separate window. The result of matching the pattern willbe binding of pattern variables to these parameters. The resulting point-to-point levelevent is shown in the righthand picture. It is a Setup machine event (highlighted
14
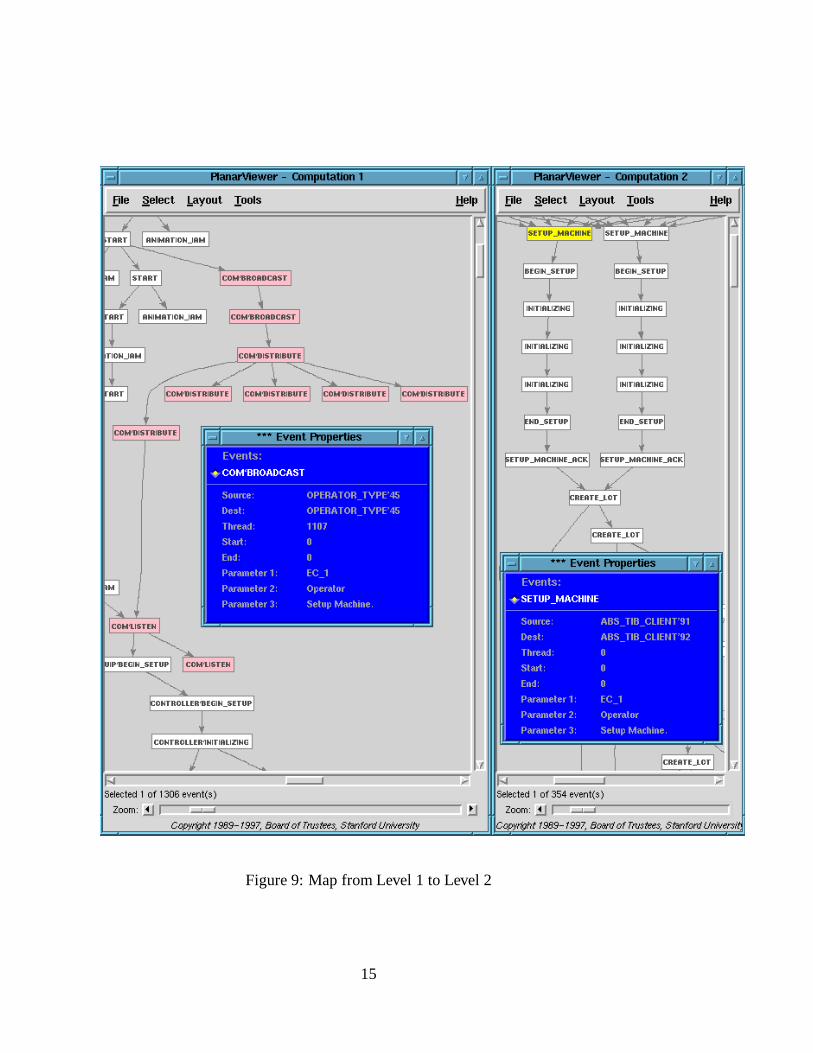
Figure 9: Map from Level 1 to Level 2
15
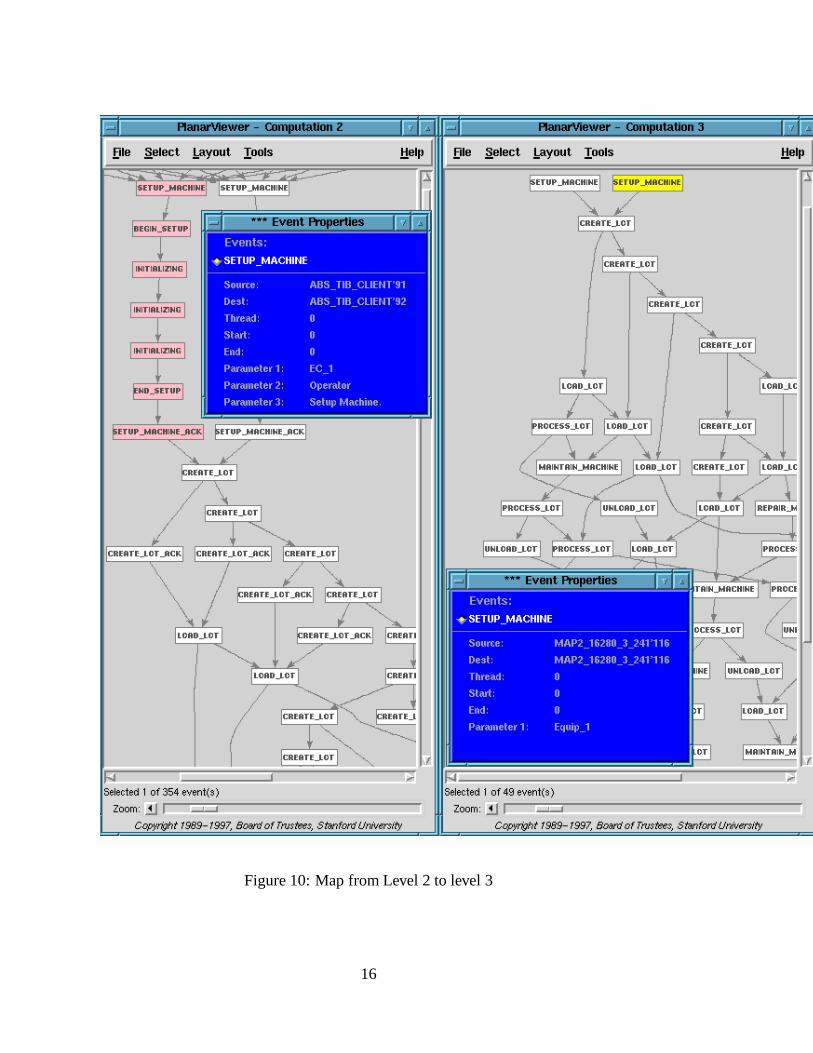
Figure 10: Map from Level 2 to level 3
16
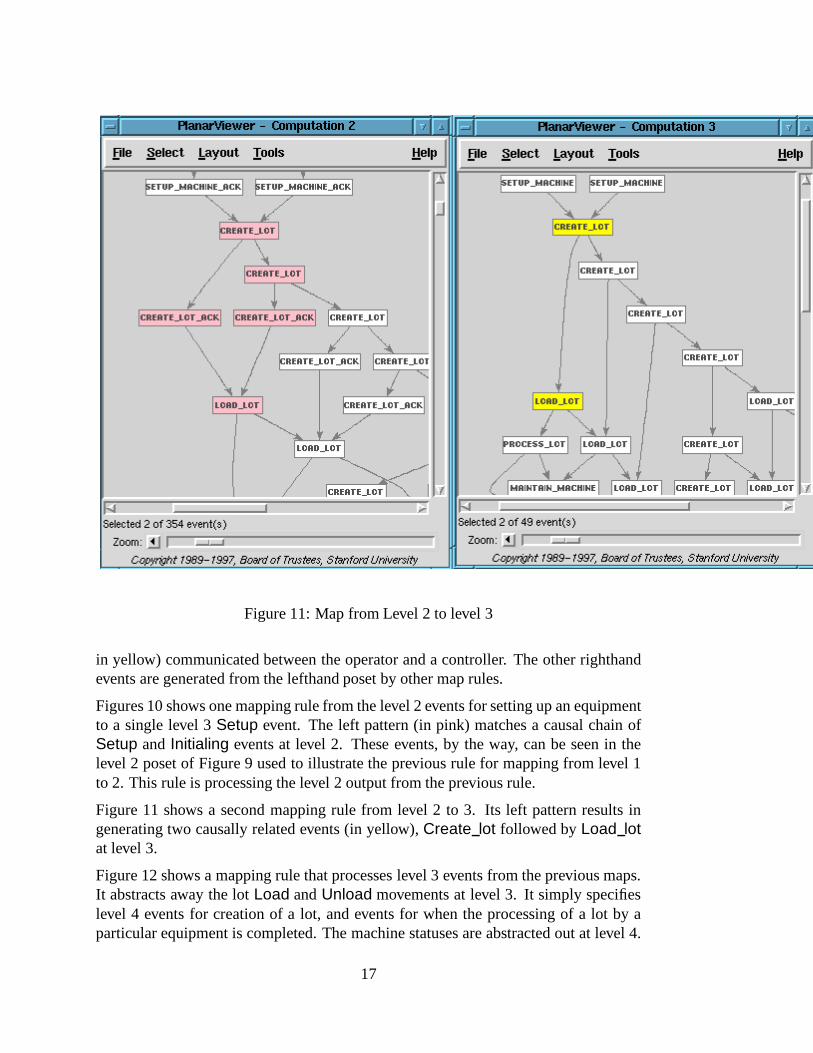
Figure 11: Map from Level 2 to level 3
in yellow) communicated between the operator and a controller. The other righthandevents are generated from the lefthand poset by other map rules.
Figures 10 shows one mapping rule from the level 2 events for setting up an equipmentto a single level 3 Setup event. The left pattern (in pink) matches a causal chain ofSetup and Initialing events at level 2. These events, by the way, can be seen in thelevel 2 poset of Figure 9 used to illustrate the previous rule for mapping from level 1to 2. This rule is processing the level 2 output from the previous rule.
Figure 11 shows a second mapping rule from level 2 to 3. Its left pattern results ingenerating two causally related events (in yellow), Create lot followed by Load lotat level 3.
Figure 12 shows a mapping rule that processes level 3 events from the previous maps.It abstracts away the lot Load and Unload movements at level 3. It simply specifieslevel 4 events for creation of a lot, and events for when the processing of a lot by aparticular equipment is completed. The machine statuses are abstracted out at level 4.
17
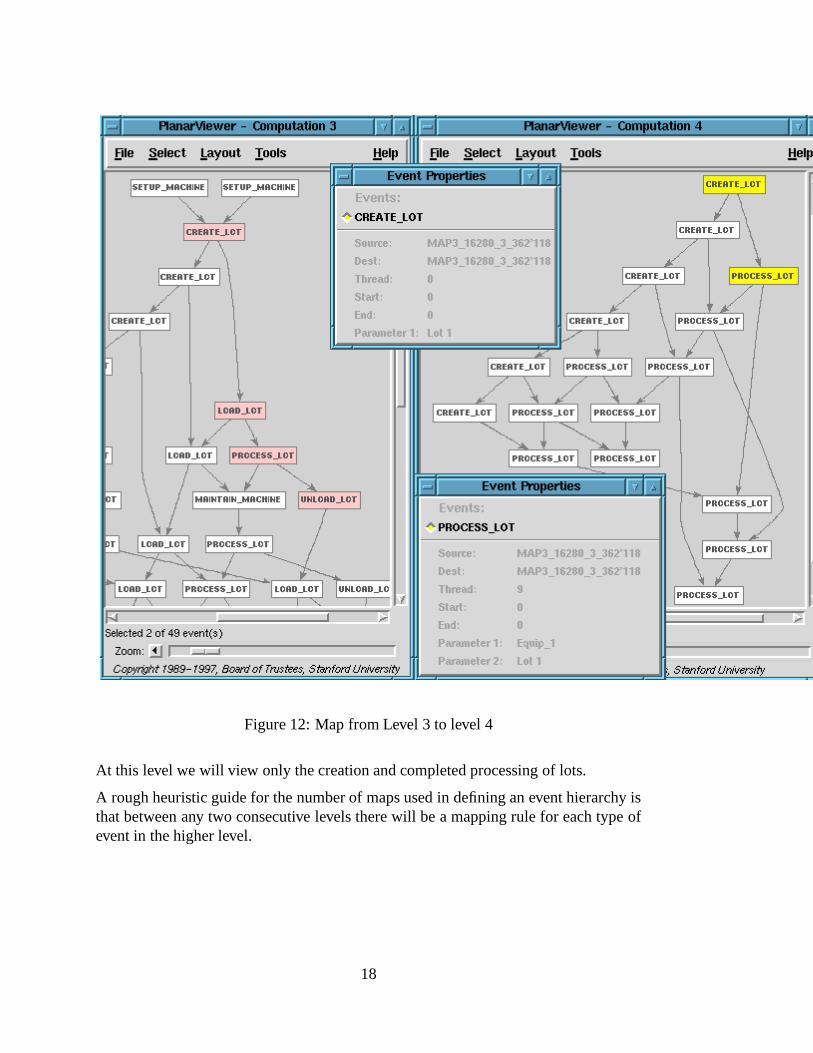
Figure 12: Map from Level 3 to level 4
At this level we will view only the creation and completed processing of lots.
A rough heuristic guide for the number of maps used in defining an event hierarchy isthat between any two consecutive levels there will be a mapping rule for each type ofevent in the higher level.
18
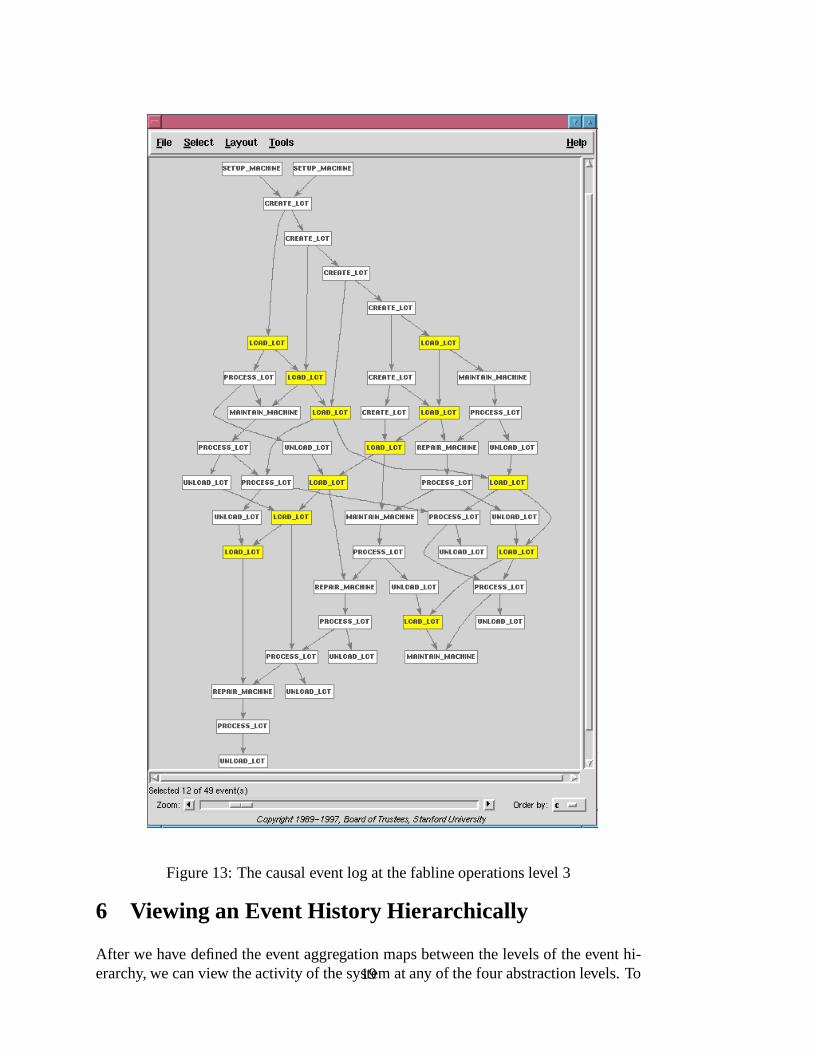
Figure 13: The causal event log at the fabline operations level 3
6 Viewing an Event History Hierarchically
After we have defined the event aggregation maps between the levels of the event hi-erarchy, we can view the activity of the system at any of the four abstraction levels. To19
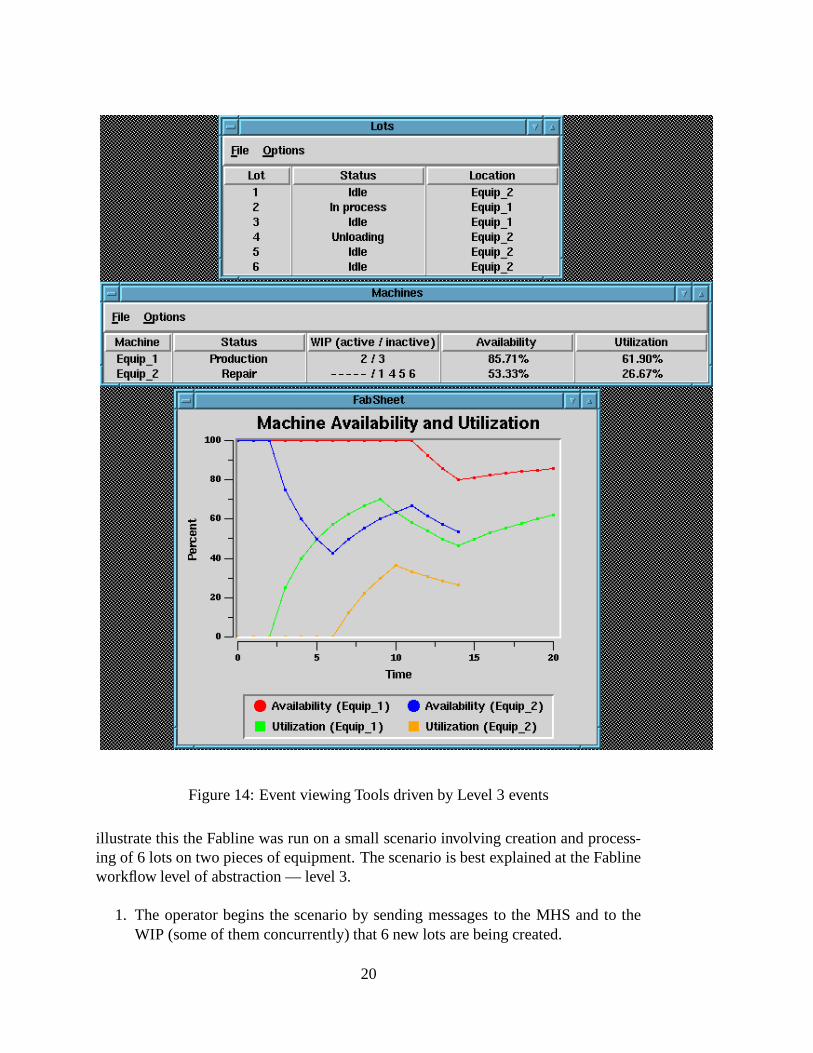
Figure 14: Event viewing Tools driven by Level 3 events
illustrate this the Fabline was run on a small scenario involving creation and process-ing of 6 lots on two pieces of equipment. The scenario is best explained at the Fablineworkflow level of abstraction — level 3.
1. The operator begins the scenario by sending messages to the MHS and to theWIP (some of them concurrently) that 6 new lots are being created.
20
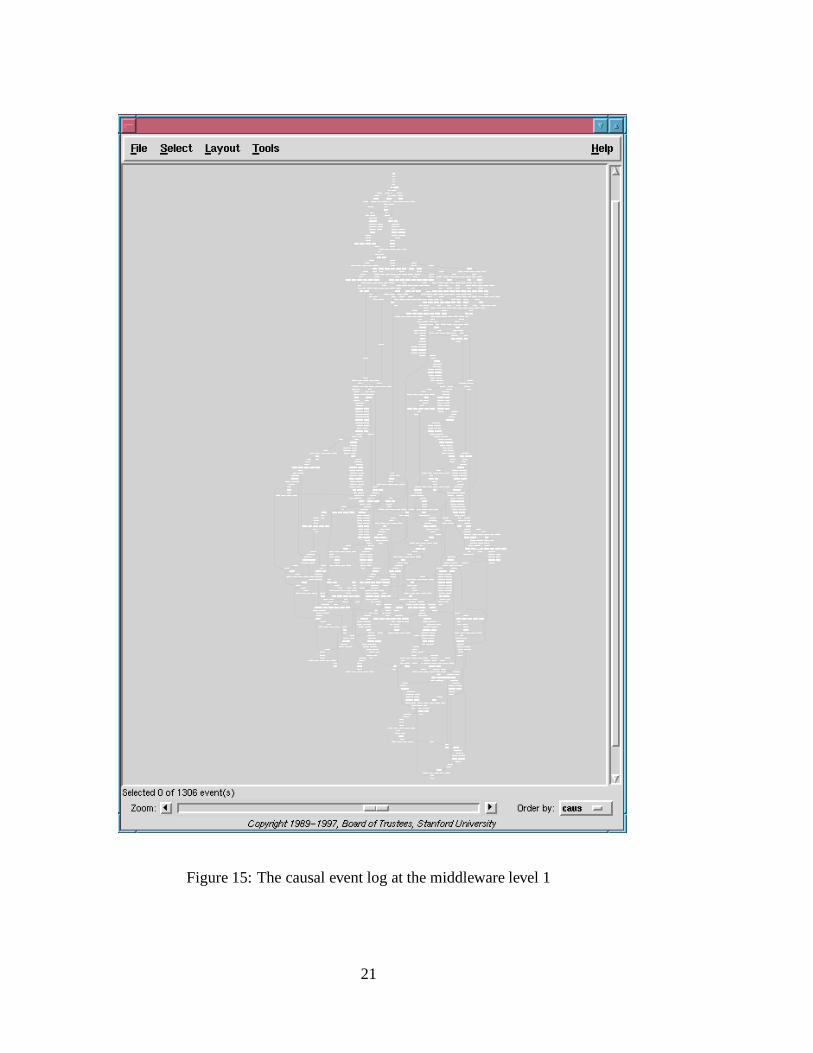
Figure 15: The causal event log at the middleware level 1
21
2. The operator then initializes (sets up) Equip-1 and Equip-2 by communicationwith their controllers.
3. The operator then causes 3 lots to be loaded, processed and unloaded on Equip-1, and the other 3 lots to be loaded, processed and unloaded on Equip-2. Theactivities on the two equipements take place independently. Each equipementcan load and or process one lot at a time, but can do loading and processingconcurrently.
4. step 3 is then repeated. Lots processed on Equip-1 are then processed on Equip-2, and conversely.
5. During these steps, equipments may randomly undergo maintenance or repair.
Figure 13 shows the poset generated by this scenario at level 3. The highlighted eventsshow independent threads loading the first and second batches of 3 lots each. Thefirst batch is loaded and processed on equipment 1 and then on equipement 2, whilethe second batch is processed in the reverse order. The independence of events in thetwo threads shows that the separate batches are processed concurrently as much aspossible. This information would be lost if event causality was not represented. Theposet also shows Maintenance events interspersed with processing events.
The level 3 events are fed to various event viewing tools shown in Figure 14. The toolssummarize information contained in the level 3 events. One viewer shows the statusof lots during the fabline operation. The other two viewers give different depictions ofthe status and availability of the equipement using formulas defined in [CS96]. Thisinformation has been aggregated by the maps from the data in events at level 1 andagain from events at level 2. At the same time, the number of events is greatly reduced(see Table 8) and irrelevant TIB communication events are eliminated. So viewing atthis level is much more efficient than trying to view level 1 or 2 events directly.
The poset of basic low level events from this scenario is shown in Figure 15. We cansee the thread structure as a result of depicting causality although we can’t see any de-tails of events because there are too many. The viewer does allow us to magnify areasof the poset by zoom operations, so if we are on-line we can navigate around the posetand view details. This picture shows that there are between 8 and 10 main threadsof control in action at various times. Roughly, these correspond to the active objectsin the level 1 architecture shown in Figure 6. Sometimes we can recognize repeatingpatterns of events corresponding to, say the communication involved in processing alot. But the viewer’s DAG layout algorithm is very sensitive so that repetitions of thesame pattern of events may be displayed in different — but topologically equivalent— layouts. So it is very important to have an automated way of specifying and detect-ing patterns of events rather than to rely on human recognition. The RAPIDE causalevent pattern language gives us a powerful technology for doing this. Pattern-directedviewing is supported by the RAPIDE viewer.
22
7 Low Level Trouble Shooting From a High Level View
Networked systems like Fabline often experience low level faults which bring the sys-tem to a grinding halt. These faults can be very costly. Typically, the informationbus can lose events, or the communication between the control computers is not ro-bust under timing delays. The middleware, the protocols or the software in the controlcomputers could all be at fault.
When such faults happen, a maintenance engineer is faced with a large level 1 eventlog. It has been reported to the authors that such faults have taken a top class engineerup to two weeks to figure out. His first problem is to try to understand in terms of level3 concepts what was going on when the fault happened.
In the following scenario we illustrate a process of hierarchical viewing, starting withthe highest level view and working down the hierarchy using the agggregation maps tolocate the low level source of a fabline fault. This is a very powerful tool for detectinglow level faults quickly.
Let us start by viewing the level 4 picture of our scenario, Figure 16. It shows thecreation and processing of 6 lots, each lot being processed by Equip � 1 and thenEquip � 2 or conversely — except lot 6 which is only processed on Equip � 2. Youcan’t see all the parameter data, but if you count the number of Process Lot eventsthere are only 11, whereas there should be 12. So we know something has gone wrong.
At level 4 each lot should be seen as going through the same process: creation followedby processing on two pieces of equipement. The pattern specifying this process isa causal chain of 3 events shown in the pattern window in Figure 16. Notice thevariables in the pattern are the lot and the machines. It matches any causal chainstarting with a Create and followed by two Process Lot events for the same lot ondifferent machines. You can’t see the guard, where ?m1
�� ?m2, because the patternwindow is too short.
All the matches of this pattern are highlighted in Figure 16. There are two events leftover, the creation of lot 6 and its processing on Equip � 2. So it was not processedon Equip � 1. Now we already know what high level operation failed — if we viewedonly the middleware events we would have no idea.
Why didn’t lot 6 get processed on Equip � 1? We need more details. So we go tolevel 3. And we look at just those level 3 events that led to the incomplete chain ofevents on lot 6 at level 4. To do this we use the hierarchy maps from level 3 to 4.Figure 17 highlights in pink those level 3 events that triggered the aggregation mapsthat generated the incomplete chain of two events at level 4 (shown in yellow). Herewe are using a feature of the RAPIDE toolset which records those lower level eventsthat trigger an aggregation mapping and result in a higher level event. This allows usto find the lower level events that were aggregated into any set of higher level events.Figure 17 shows that the causal chain of pink events involving lot 6 continues with aLoad Lot event signifying the lot 6 was loaded on Equip � 1. Then the equipment was
23
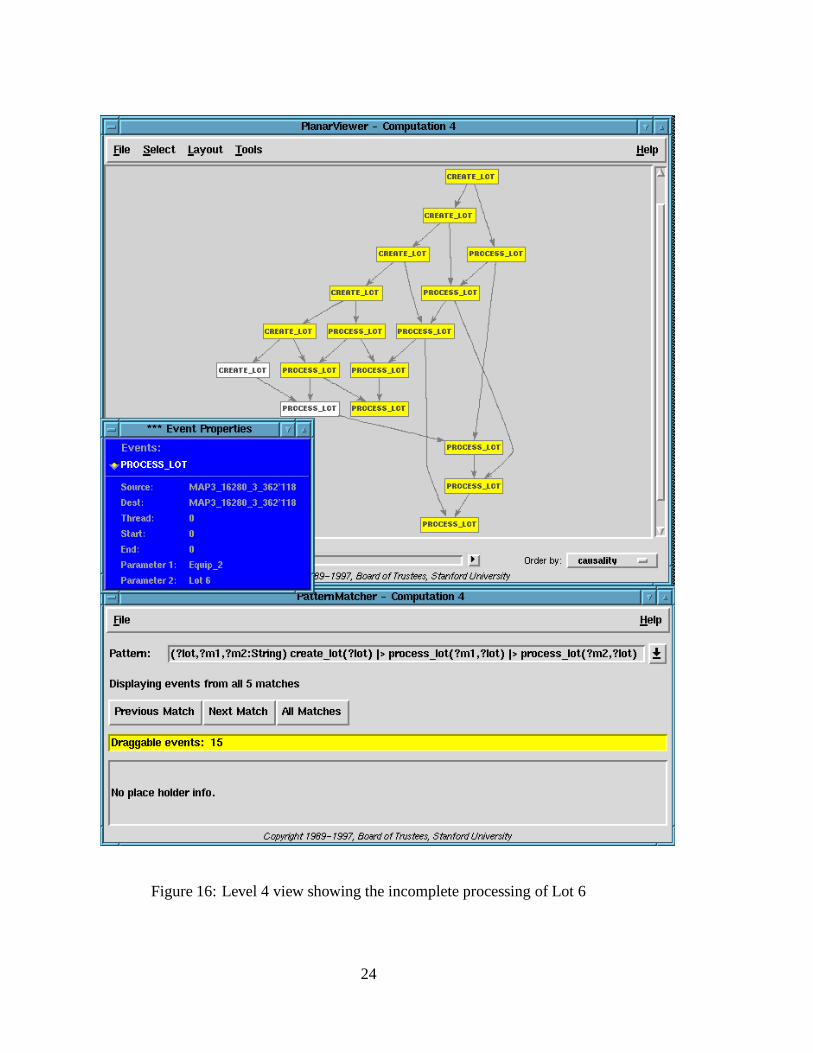
Figure 16: Level 4 view showing the incomplete processing of Lot 6
24
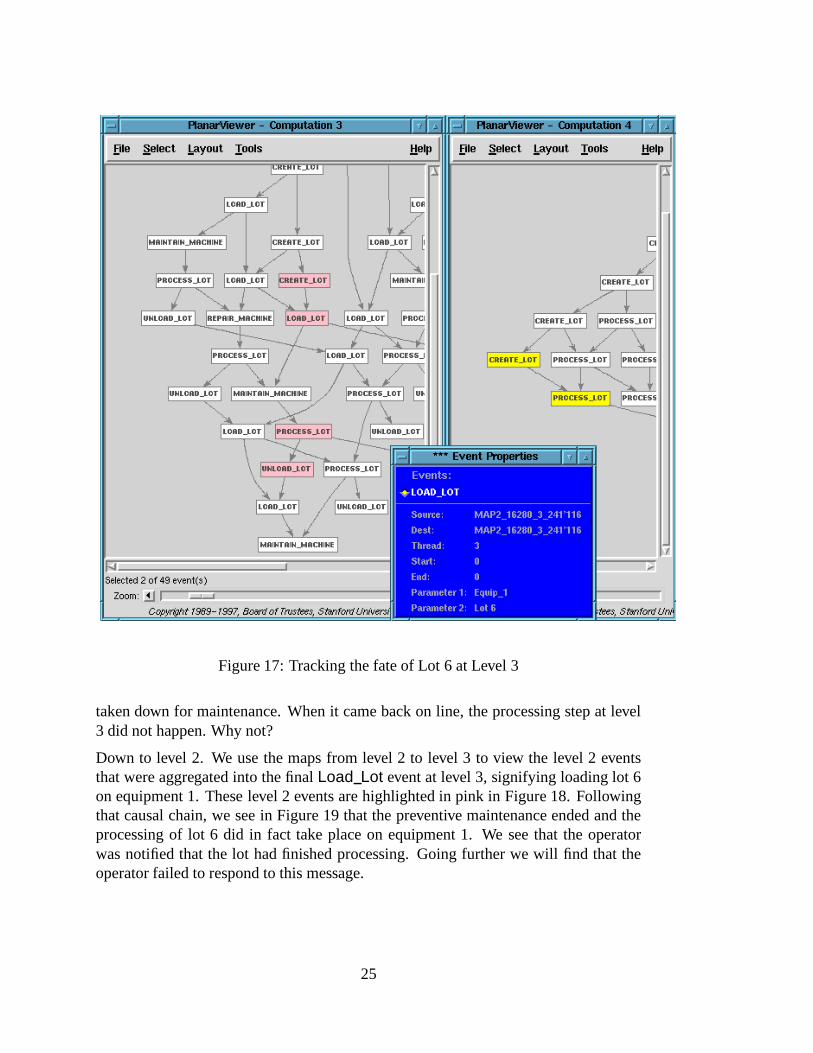
Figure 17: Tracking the fate of Lot 6 at Level 3
taken down for maintenance. When it came back on line, the processing step at level3 did not happen. Why not?
Down to level 2. We use the maps from level 2 to level 3 to view the level 2 eventsthat were aggregated into the final Load Lot event at level 3, signifying loading lot 6on equipment 1. These level 2 events are highlighted in pink in Figure 18. Followingthat causal chain, we see in Figure 19 that the preventive maintenance ended and theprocessing of lot 6 did in fact take place on equipment 1. We see that the operatorwas notified that the lot had finished processing. Going further we will find that theoperator failed to respond to this message.
25
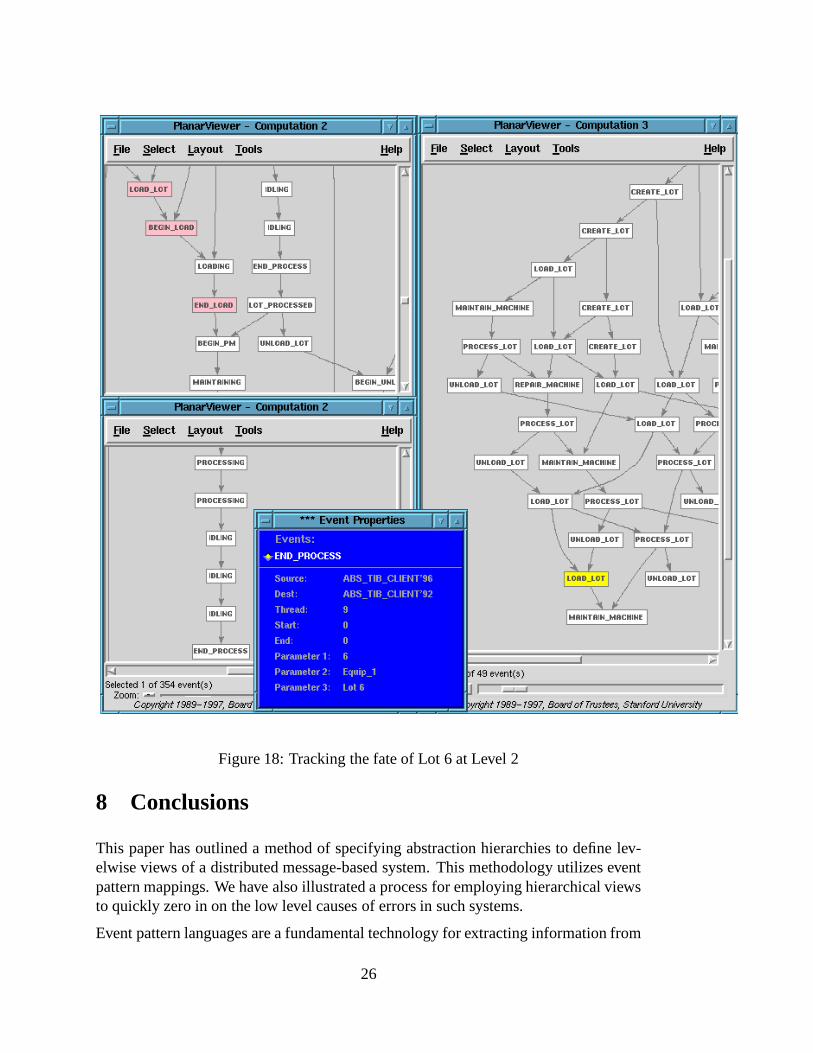
Figure 18: Tracking the fate of Lot 6 at Level 2
8 Conclusions
This paper has outlined a method of specifying abstraction hierarchies to define lev-elwise views of a distributed message-based system. This methodology utilizes eventpattern mappings. We have also illustrated a process for employing hierarchical viewsto quickly zero in on the low level causes of errors in such systems.
Event pattern languages are a fundamental technology for extracting information from
26
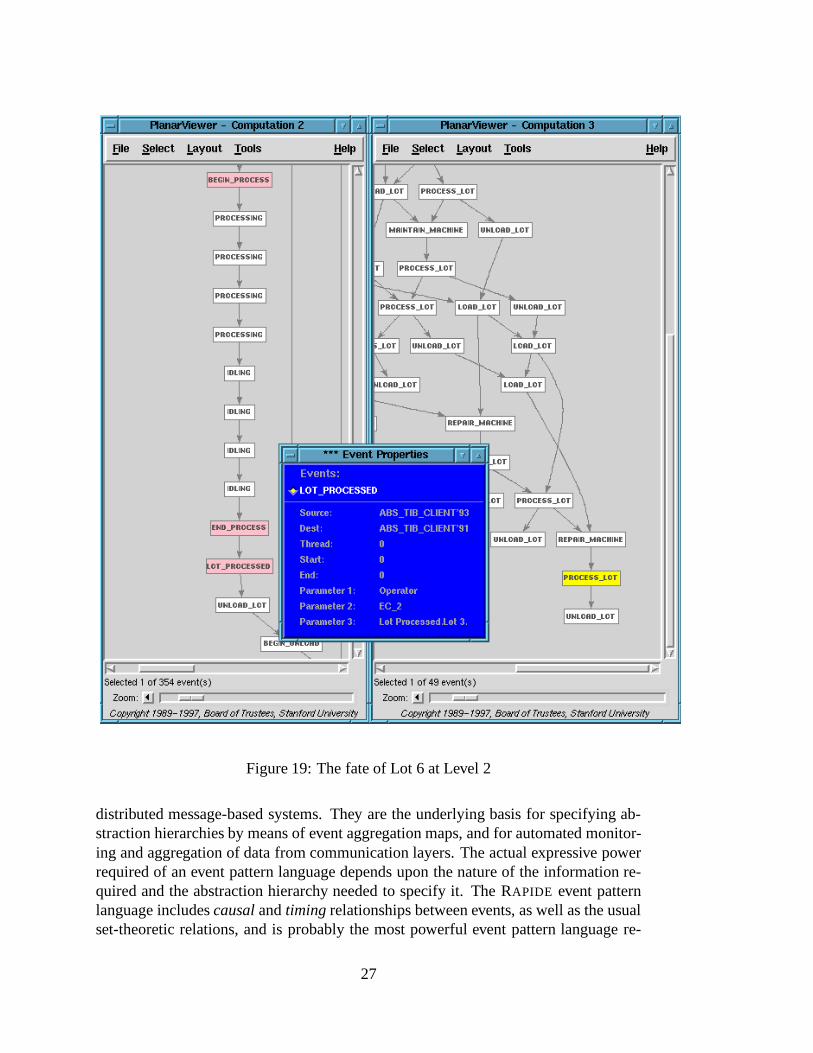
Figure 19: The fate of Lot 6 at Level 2
distributed message-based systems. They are the underlying basis for specifying ab-straction hierarchies by means of event aggregation maps, and for automated monitor-ing and aggregation of data from communication layers. The actual expressive powerrequired of an event pattern language depends upon the nature of the information re-quired and the abstraction hierarchy needed to specify it. The RAPIDE event patternlanguage includes causal and timing relationships between events, as well as the usualset-theoretic relations, and is probably the most powerful event pattern language re-
27
quired for complex event processing.
References
[CS96] Chang C.Y. and Sze S.M. ULSI Technology. Electrical and ComputerEngineering. McGraw - Hill, 1996.
[Gro91] The Object Management Group. The Common Object Request Broker:Architecture and Specification. The Object Management Group, revision1.1 edition, December 1991.
[Int87] International Organization for Standardization. Information processingsystems – Open Systems Interconnection – Specification of Basic EncodingRules for Abstract Notation One (ASN.1), December 1987. InternationalStandard 8825.
[LKA�
95] David C. Luckham, John J. Kenney, Larry M. Augustin, James Vera, DougBryan, and Walter Mann. Specification and analysis of system architectureusing Rapide. IEEE Transactions on Software Engineering, 21(4):336–355, April 1995.
[LV95] David C. Luckham and James Vera. An event-based architecture definitionlanguage. IEEE Transactions on Software Engineering, 21(9):717–734,September 1995.
[TIB] TIBCO. http://www.tibco.com/.
28


