
Computer-Aided Diagnosis of Solid Breast Nodules:
Use of an Artificial Neural Network Based on
Multiple Sonographic Features
Segyeong Joo, Yoon Seok Yang, Woo Kyung Moon, and Hee Chan Kim*, Member, IEEE

SkeletonSkeleton
INTRODUCTIONINTRODUCTION ULTRASONIC IMAGE DATABASE AND ULTRASONIC IMAGE DATABASE AND
PREPEOCESSINGPREPEOCESSING FEATURE EXTRACTIONFEATURE EXTRACTION NEURAL-NETWORK CLASSIFATIONNEURAL-NETWORK CLASSIFATION SYSTEM PERFORMANCE EVALUATIONSYSTEM PERFORMANCE EVALUATION RESULTSRESULTS

IntroductionIntroduction definitive benign or malignant sonographic characteridefinitive benign or malignant sonographic characteri
sticsstics
The goal is based on factorsThe goal is based on factors
(1) sonographic features are extracted(1) sonographic features are extracted (2) provide multiple sonographic feature values to the (2) provide multiple sonographic feature values to the
ANNANN

Ultrasonic image database and Ultrasonic image database and preprocessingpreprocessing
Started with the manually segmented region of interesStarted with the manually segmented region of interest (ROI) of the lesion area.t (ROI) of the lesion area.
Histologically confirmed usingHistologically confirmed using (1) core needle biopsy(296)(1) core needle biopsy(296) (2) excisional biopsy(24)(2) excisional biopsy(24) Database includeDatabase include (1) palpable breast lesion (1) palpable breast lesion (2) non-palpable breast lesion (2) non-palpable breast lesion

PreprocessingPreprocessing(1) Median Filtering(1) Median Filtering
(2) Unsharp Masking(2) Unsharp Masking (3) Contrast Enhancement(3) Contrast Enhancement (4) Binary Thresholding(4) Binary Thresholding (5) Edge Detection(5) Edge Detection


Feature extractionFeature extraction Determine whether a breast nodule is malignant or beni
gn (1)Spiculation (2)Ellipsoid Shape (3)Branch Pattern (4)Relative Brightness of Nodule (5)Number of Lobulations

• Spiculation (1)polar coordinates of boundary pixels of nodule images. (2)maligmant nodule’s spiculation consists of alternati
ng hyperechoic straight lineshyperechoic straight lines (3)(3)

• Ellipsoid shapeEllipsoid shape
(1) malignant nodule has taller than wide shape(1) malignant nodule has taller than wide shape
(2)

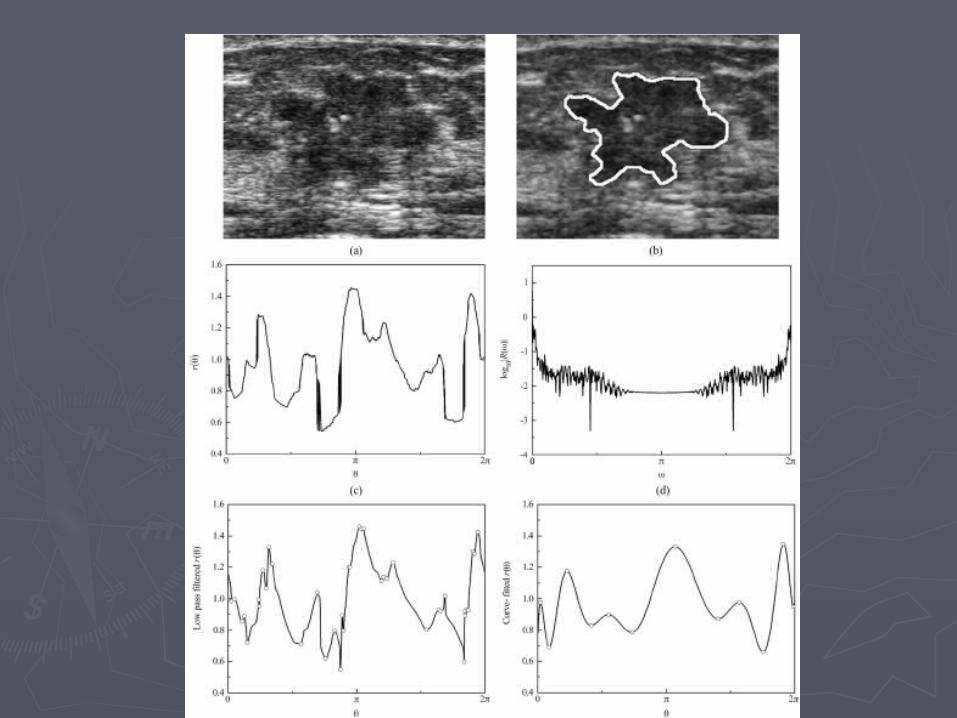
• Branch patternBranch pattern (1) Defined as multiple projections from the nodule withi(1) Defined as multiple projections from the nodule withi
n n or around ducts extending away from the nippleor around ducts extending away from the nipple (2) number of local extrema in the low-pass-filtered radia(2) number of local extrema in the low-pass-filtered radia
ll distance graphdistance graph (3)

• Relative brightness of noduleRelative brightness of nodule
(1) Malignant nodules are darker when compared (1) Malignant nodules are darker when compared with the with the
surroundingsurrounding
(2) Use thickened the boundary of the image(2) Use thickened the boundary of the image
(3) (3)

• Number of lobulationNumber of lobulation (1) detection of peak value(1) detection of peak value (2) radial distance graph was filtered by a median filter (2) radial distance graph was filtered by a median filter with window size of 30 (about 0.6 rad) and then curve- with window size of 30 (about 0.6 rad) and then curve- fitted to 15th-order polynomialsfitted to 15th-order polynomials (3) (3)


Neural-network classificationNeural-network classification training was stopped when the mean square error becatraining was stopped when the mean square error beca
meme lower than 0.001.lower than 0.001. Network topology determinationNetwork topology determination (1)K-fold cross-validation method with k=10(1)K-fold cross-validation method with k=10 (2)Accuracy is (true_position +true_negative finding)/tot(2)Accuracy is (true_position +true_negative finding)/tot
al fingingal finging


ResultsResults Feature extractionFeature extraction

ROC curve (Receiver Operating Characteristic)

ROC curve (Receiver Operating Characteristic)

ANN classificationANN classification• trained ANN showed 100% accuracy for the trained ANN showed 100% accuracy for the
training set training set
and 91.4% accuracy for the test set.and 91.4% accuracy for the test set.• in ROC curve ,the sensitivity increased to 99.3% in ROC curve ,the sensitivity increased to 99.3%
and specificity decreased to 7.3%and specificity decreased to 7.3%

Effect of edge-detection algorithmEffect of edge-detection algorithm• 13.2% of the total cases (77/584) were found to be 13.2% of the total cases (77/584) were found to be
unacceptableunacceptable• After manually corrected boundary data for After manually corrected boundary data for
erroneouserroneous
casescases• in ROC curve ,the sensitivity increased to 99.3% in ROC curve ,the sensitivity increased to 99.3%
and specificity decreased to 34.7%and specificity decreased to 34.7%

Evaluation of system performanceEvaluation of system performance• The developed CAD system shows a slightly better The developed CAD system shows a slightly better
result in the performance evaluation studyresult in the performance evaluation study• in ROC curve ,the sensitivity increased to 99.3% in ROC curve ,the sensitivity increased to 99.3%
and specificity decreased to 34.7%and specificity decreased to 34.7%


ENDEND
THANKS EVERYONETHANKS EVERYONE


