
Connectivity LabUniversity of California, Berkeley
Location and Timing with C/A code in GPS
Wanbin Tang
Jan 24, 2007

Connectivity LabUniversity of California, Berkeley
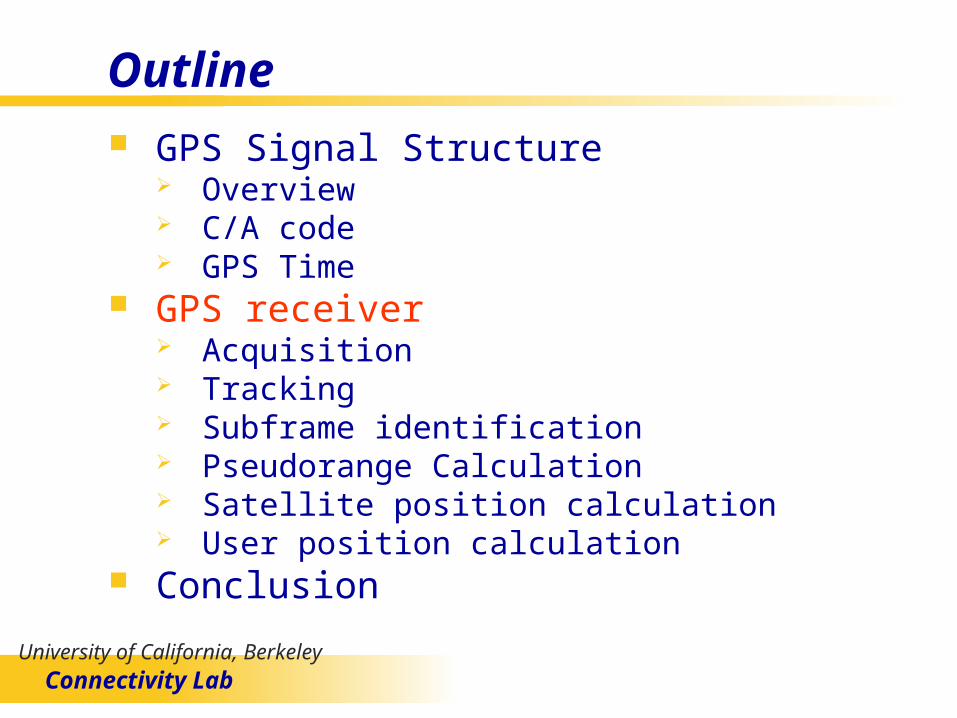
Outline GPS Signal Structure
Overview C/A code GPS Time
GPS receiver Acquisition Tracking Subframe identification Pseudorange Calculation Satellite position calculation User position calculation
Conclusion
Connectivity LabUniversity of California, Berkeley
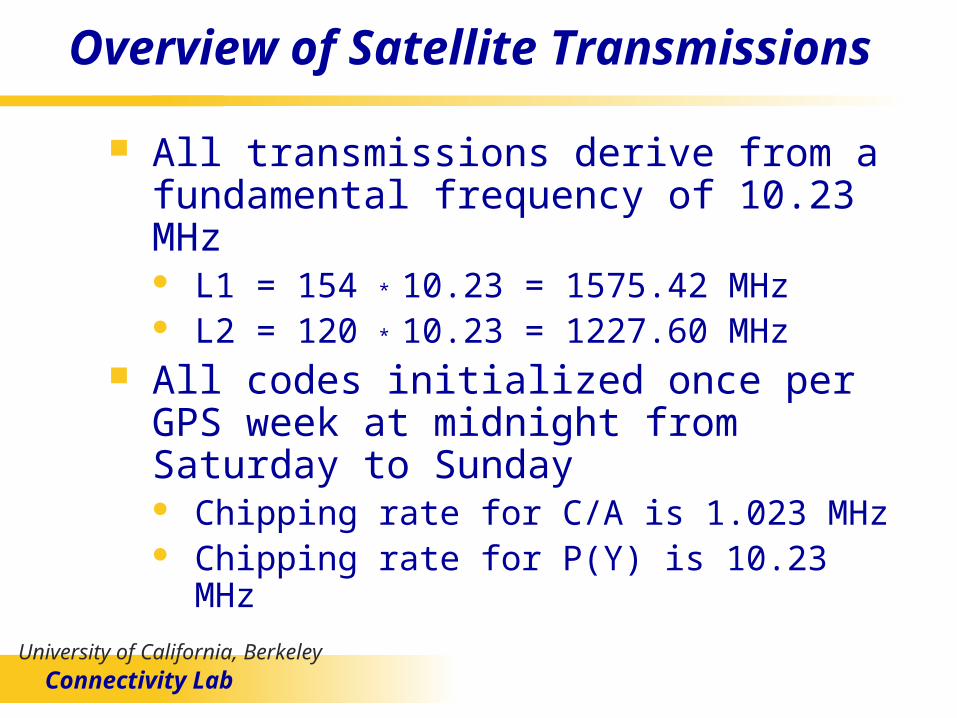
Overview of Satellite Transmissions
All transmissions derive from a fundamental frequency of 10.23 MHz L1 = 154 * 10.23 = 1575.42 MHz L2 = 120 * 10.23 = 1227.60 MHz
All codes initialized once per GPS week at midnight from Saturday to Sunday Chipping rate for C/A is 1.023 MHz Chipping rate for P(Y) is 10.23 MHz
Connectivity LabUniversity of California, Berkeley
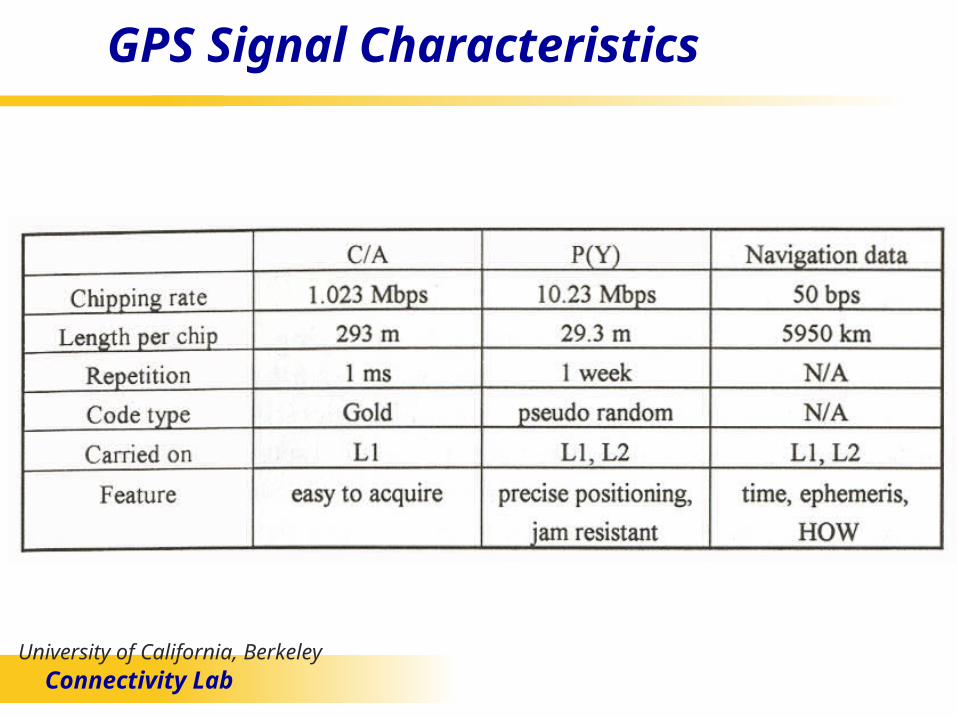
GPS Signal Characteristics

Connectivity LabUniversity of California, Berkeley
Codes on L1 and L2
S1p(t) ApP
p (t)DP (t)cos(2f1t) AcGP (t)DP (t)sin(2f1t)
where
Ap,Ac amplitudes (power) of P(Y) - code and C / A- code
PP (t) pseudorandom P(Y) - code
G P( t) C / A- code (Gold code)
DP( t) navigation data stream
and
S2p(t) BpP
p (t)DP (t)cos(2f2t)

Connectivity LabUniversity of California, Berkeley
Coarse/Acquisition Codes

Connectivity LabUniversity of California, Berkeley
PRN Cross-correlationCorrelation of receiver generated PRN code (A) with incoming datastream consisting of multiple (e.g. four, A, B, C, and D) codes

Connectivity LabUniversity of California, Berkeley
GPS Data Format

Connectivity LabUniversity of California, Berkeley
GPS Time
GPS time is referenced to a universal coordinated time (UTC). The GPS zero time is defined as midnight on the night of January 5/ morning of January 6, 1980. The largest unit used in stating GPS time is one week, defined as 604,800 seconds (7 × 24 × 3600).

Connectivity LabUniversity of California, Berkeley
GPS Time The GPS timing information
transmitted in the air interface includes : 17-bit truncated version of the TOW
count covers a whole week and the time unit is 6 sec (1.5 sec * 4), which equals one subframe time.
the 10 most-significant bits (MSBs) as the week number

Connectivity LabUniversity of California, Berkeley
GPS Time
Connectivity LabUniversity of California, Berkeley
Outline GPS Signal Structure
Overview C/A code GPS Time
GPS receiver Acquisition Tracking Subframe identification Pseudorange Calculation Satellite position calculation User position calculation
Conclusion
Connectivity LabUniversity of California, Berkeley
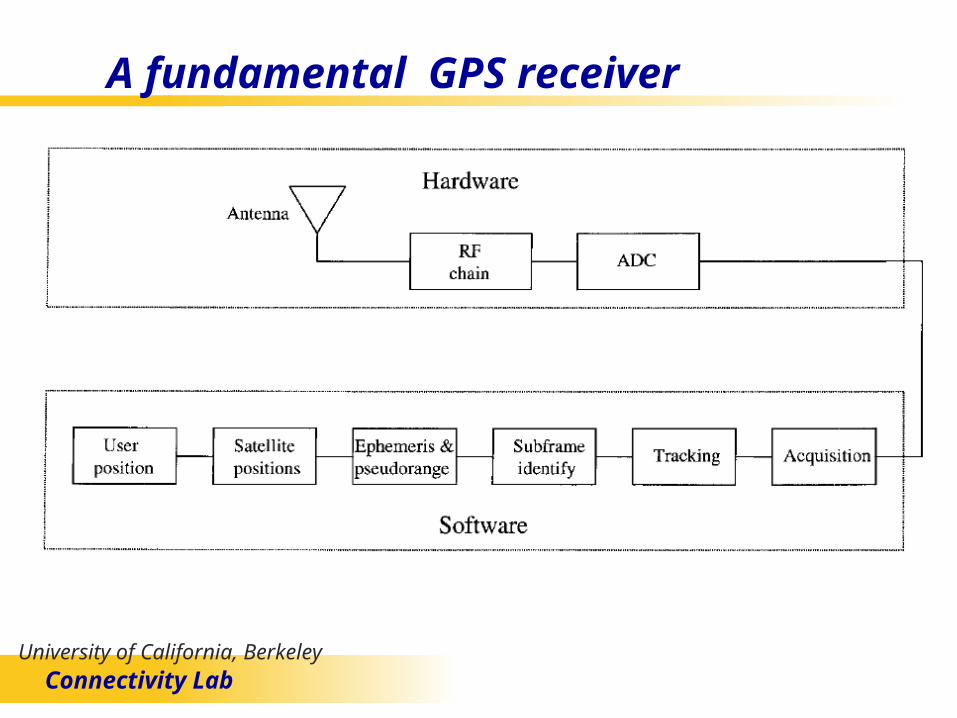
A fundamental GPS receiver

Connectivity LabUniversity of California, Berkeley
Acquisition
Requirement: Search over a frequency range of ±10 KHz
to cover all of the expected Doppler frequency range for high-speed aircraft.
The resolutions of the two important outputs of acquisition, the beginning of the C/ A code period and the carrier frequency, should reach the requirement of the tracking circuits.
Methods: Conventional correlation Fast Fourier transform (FFT) Delay and multiplication

Connectivity LabUniversity of California, Berkeley
Acquisition

Connectivity LabUniversity of California, Berkeley
FFT (5MSamples/s,1ms Received data)1. Perform the FFT on the 1 ms of input data x(n) and convert the
input into frequency domain as X(k) where n=k=0 to 4999 for 1 ms of data.
2. Take the complex conjugate X(k) and the outputs become X(k)*.3. Generate 21 local codes lsi(n) where i=1, 2, . . . 21, using
equation given in blow. The local code consists of the multiplication of the C/A code satellite s and a complex RF signal and it must be also sampled at 5 MHz. The frequency f i of the local codes are separated by 1 KHz.
lsi = Cs exp( j2pif it)4. Perform FFT on lsi(n) to transform them to the frequency
domain as Lsi(k).5. Multiply X(k)* and Lsi(k) point by point and call the result Rsi(k).6. Take the inverse FFT of Rsi(k) to transform the result into time
domain as rsi(n) and find the absolute value of the |rsi(n)|. There are a total of 105,000 (21 5,000) of |rsi(n)|.
7. The maximum of |rsi(n)| in the nth location and ith frequency bin gives the beginning point of C/A code in 200 ns resolution in the input data and the carrier frequency in 1 KHz resolution.

Connectivity LabUniversity of California, Berkeley
Fine frequency estimation
Strip the C/A code from the 1ms input signal; At time m, the highest frequency component
in 1ms of data is Xm(k) ,then the initial phase:
At time n, a short time after m, the phase is:
Fine frequency is:

Connectivity LabUniversity of California, Berkeley
Tracking

Connectivity LabUniversity of California, Berkeley
How to get fine timing resolution
Correlation output within 1chips in ideal conditions
Connectivity LabUniversity of California, Berkeley
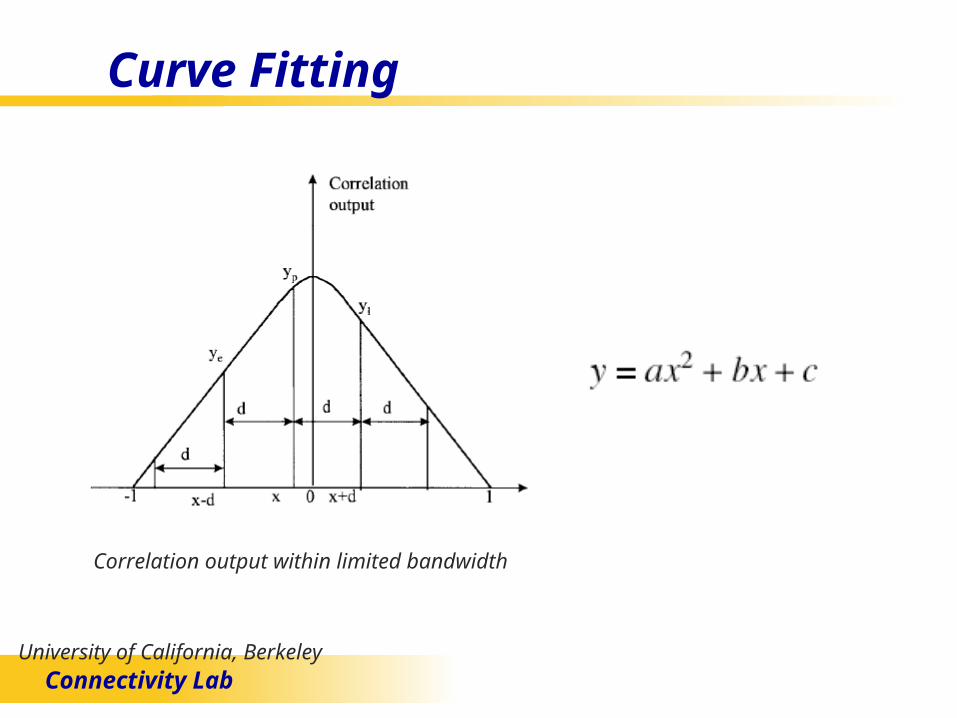
Curve Fitting
Correlation output within limited bandwidth

Connectivity LabUniversity of California, Berkeley
Basic Simulation Results
• 1 satellite ;• Raise cosine filter;• AWGN channel;• 1ms received data processing;• Oversample rate = 5;• Delay between the early and ontime tracking branch = one sample• Quadratic curving fitting
0 0.2 0.4 0.6 0.8 1 1.2 1.4 1.6 1.8 2
x 10-7
0
0.1
0.2
0.3
0.4
0.5
0.6
0.7
0.8
0.9
1
Time Resolution (s)
Pro
babi
lity
SNR = -15dB
SNR = -10dBSNR = -5dB
SNR = 0dB

Connectivity LabUniversity of California, Berkeley
Subframe identification
Convert tracking output to nevigation data;
Using the preamble of pattern(10001011) in the first word and parity code (00) to identify subframe.

Connectivity LabUniversity of California, Berkeley
Psedurange calculation
In collecting the digitized data there is no absolute time reference and the only time reference is the sampling frequency. As a result, the pseudorange
can be measured only in a relative way. prange = (const + diff of dat + finetime) * c
where c=299792458 m/s is speed of light; const is an arbitrarily chosen constant to make all the pseudoranges positive; and the
fine time is obtained from the tracking program. the relative transit time (diff of dat) is calculated according to:
the beginning points of the C/A code the beginning of the first navigation data the beginning of subframe 1

Connectivity LabUniversity of California, Berkeley
Calculate the satellite position
Calculate the coarse time of the transmission of satellite:
tc = TOW − relative transit time Using the navigation data and tc, the user can determine the satellite
position in earth-center earth-fixed coordinate system.
cos cos sin cos sin
sin cos cos cos sin
sin sin
er er
er er
x r r i
y r r i
z r i

Connectivity LabUniversity of California, Berkeley
Calculate the satellite position

Connectivity LabUniversity of California, Berkeley
Calculate the satellite position Calculate the mean motion:
Calculate the mean anomaly: M=M0 + n(tc −toe) Calculate the eccentric anomaly: E = M + es sin E Calculate the overall time correction:
Calculate the true anomaly:
Calculate the angle
3s
n na
0 1 2( ) ( )f f c oc f c oc r GDt a a t t a t t t T sinr s st Fe a E ct t t
11 2
coscos
1 coss
s
E ev
e E
21
2
1 sinsin
1 coss
s
e Ev
e E
1 2sign( )v v v
v w

Connectivity LabUniversity of California, Berkeley
Calculate the satellite position Calculate the following correction terms:
Calculate the angle between the accenting node and the Greenwich meridian :
Find the position of the satellite and adjust the pseudorange:
sin 2 cos 2us ucC C
sin 2 cos 2rs rcr C C
sin 2 cos 2is ici C C
r r r
idot( )oei i i t t
( )er e oe iet t t
cos cos sin cos sin
sin cos cos cos sin
sin sin
er er
er er
x r r i
y r r i
z r i
i i c t

Connectivity LabUniversity of California, Berkeley
Calculate user position
a minimum of four satellites is required to solve for the user position:
where bu is the user clock bias error expressed in distance.

Connectivity LabUniversity of California, Berkeley
Iterative method to update the transmit time
The time used to calculate the position of a satellite and the time used to calculate user position are different. The time used to calculate the satellite position should be adjusted to be the same time for calculating user position.
Update the satellites position with tt and get a updated user position. iterative calculae until the changes in x, y, z (or xu, yu, zu) are below a
predetermined value. In the end , the absolute position and timing of user is determined.

Connectivity LabUniversity of California, Berkeley
Outline GPS Signal Structure
Overview C/A code GPS Time
GPS receiver Acquisition Tracking Subframe identification Pseudorange Calculation Satellite position calculation User position calculation
Conclusion

Connectivity LabUniversity of California, Berkeley
Conclusion The complexity of GPS receiver is mostly
determined by baseband digital signal processing: acquisition tracking multi satellite signal receiving
The absolute time can be determined after the accurate position of user is get.
The timing resolution and position resolution are highly correlated. Roughly to say, if position resolution is less than 30m, the timing resolution is less than 100ns.

Connectivity LabUniversity of California, Berkeley
Thanks !


