What Is a High Entropy Alloy (HEA)? § An Alloy composed of at least five base elements. § Gibbs free energy of mixing [1]
• Energy of forming solid solu>ons is lower than that of forming intermetallic compounds
§ Does not for intermetallic compounds § Forms simple FCC and BCC solid solu>ons
Characteriza>on of the High Entropy Alloy TiFeCrNiX Connor Moorman1, Brian Welk2, Hamish Fraser2
1Department of Materials Science and Engineering 2Center for the Accelerated Matura>on of Materials The Ohio State University MSE
CAMM Center for the Accelerated Maturation of Materials
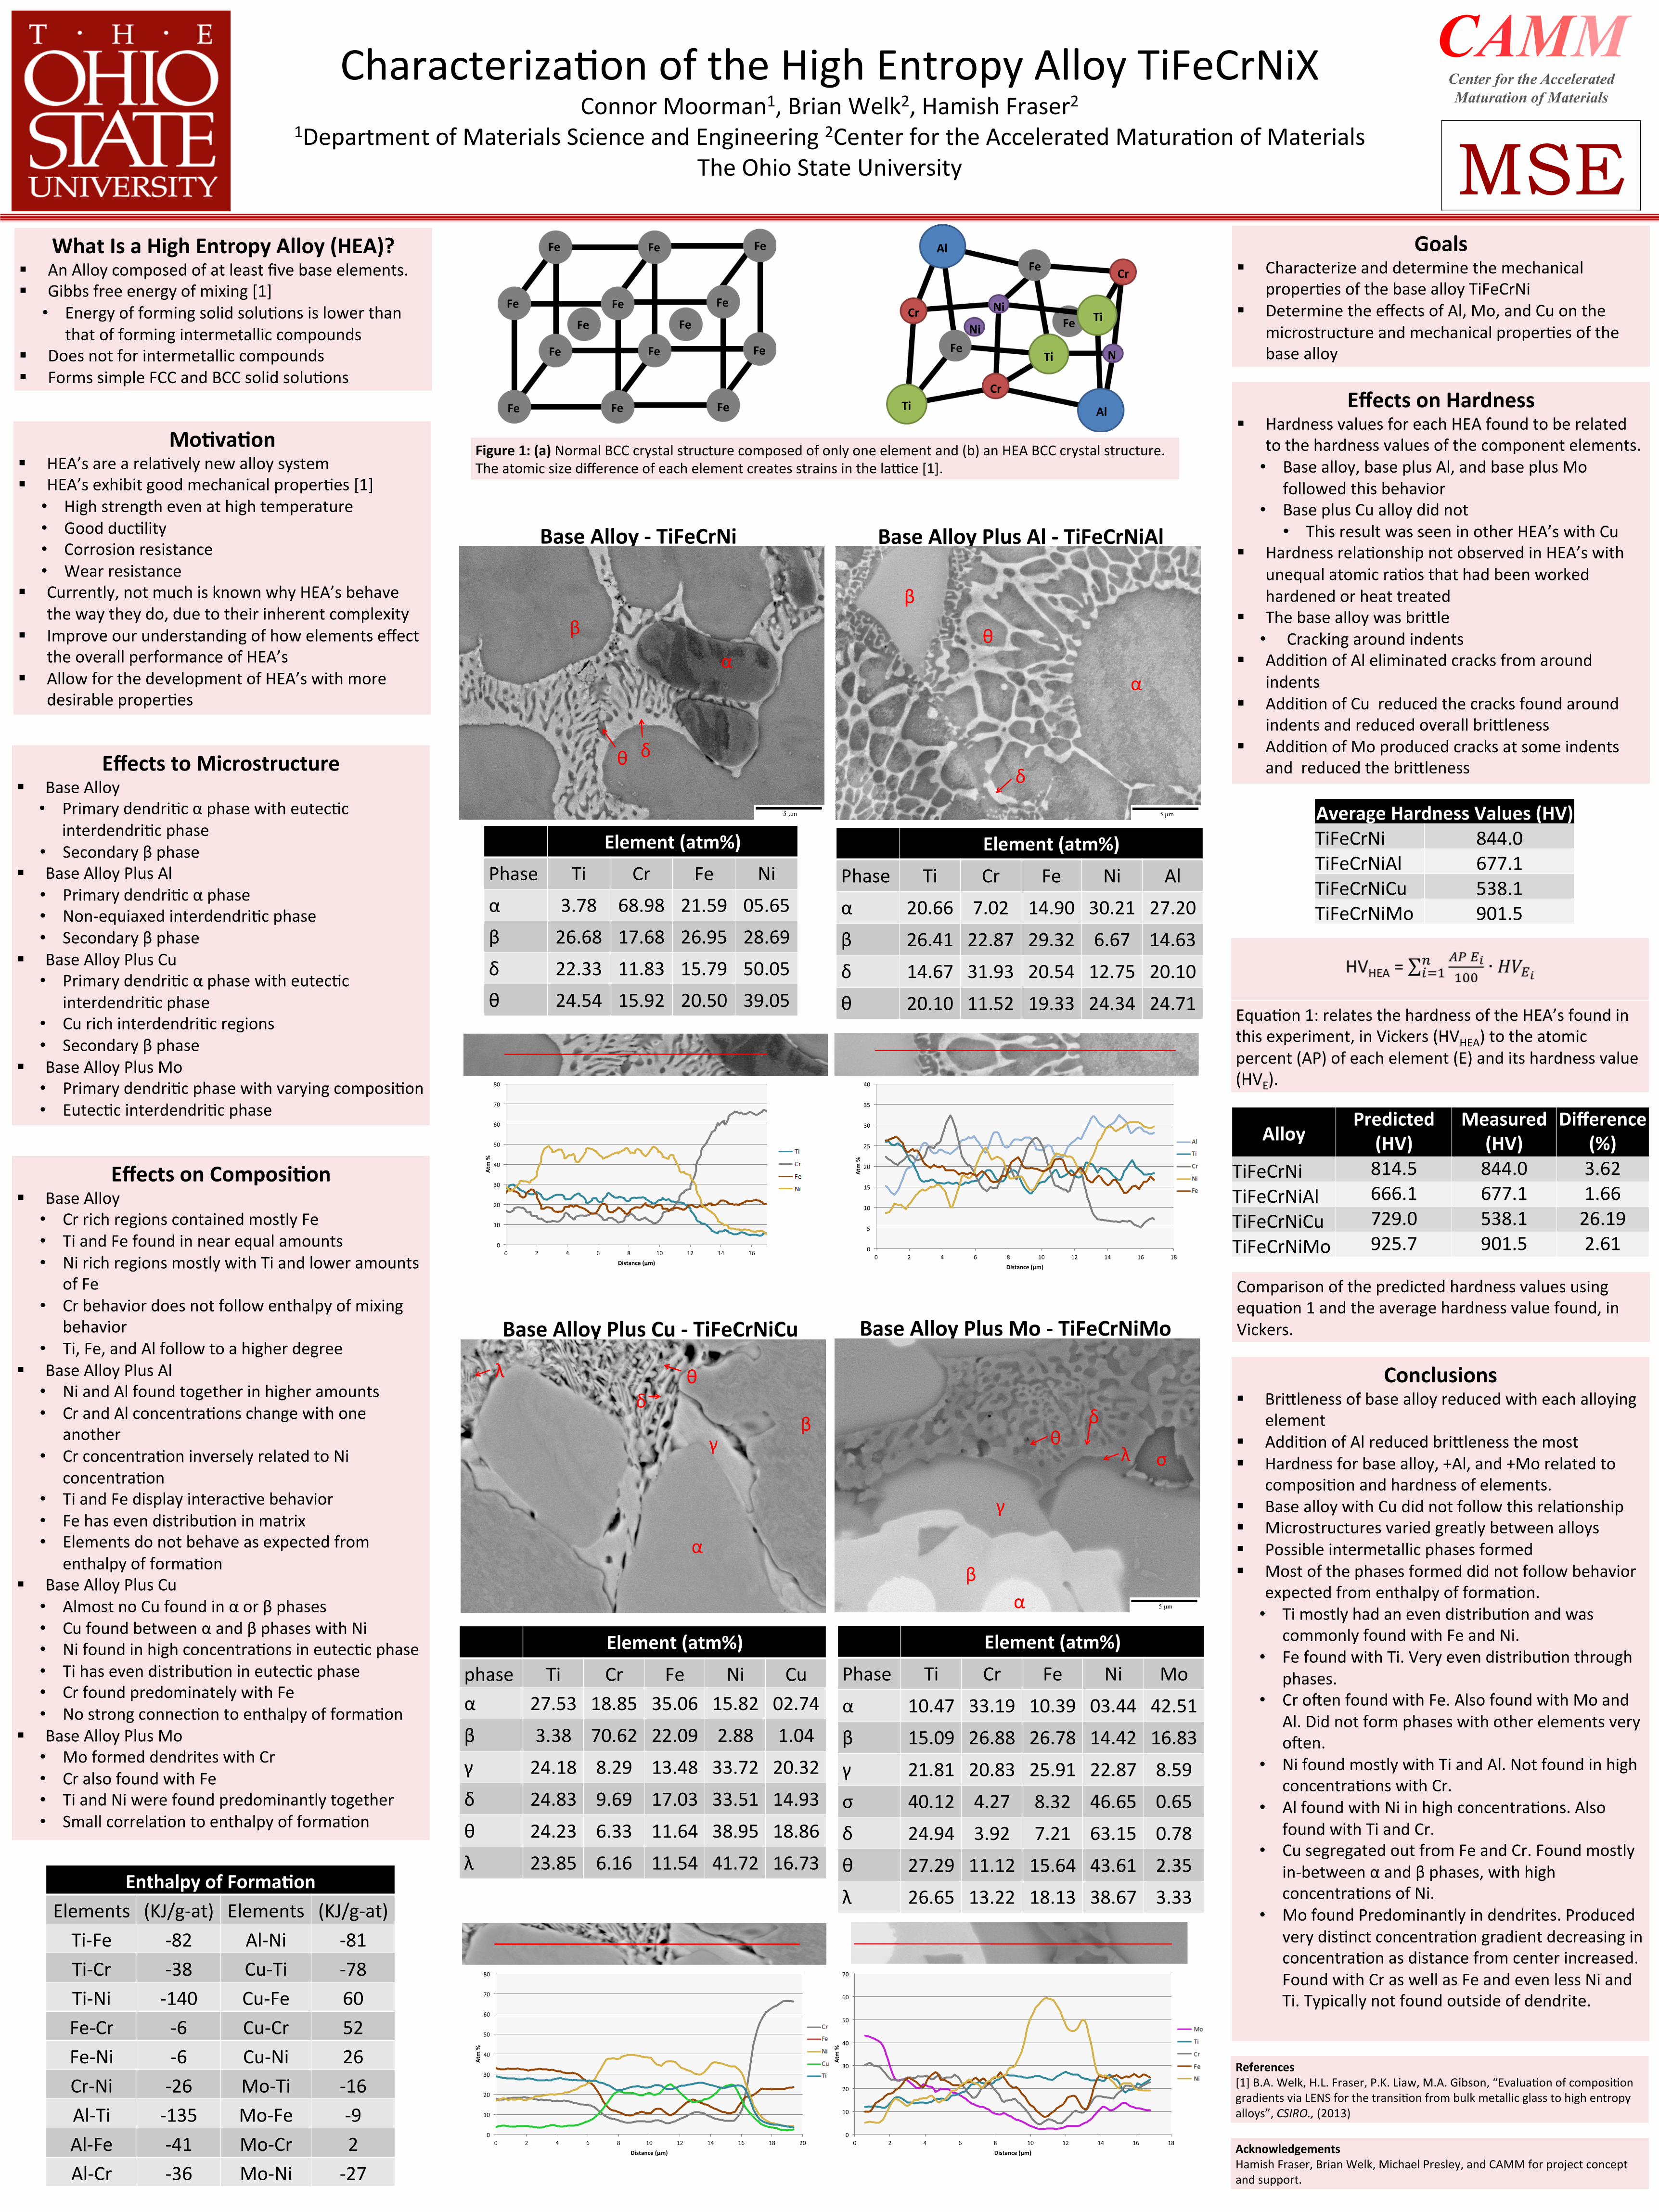
Figure 1: (a) Normal BCC crystal structure composed of only one element and (b) an HEA BCC crystal structure. The atomic size difference of each element creates strains in the laUce [1].
Fe
Fe
Fe
Fe
Fe
Fe
Fe
Fe
Fe
Fe
Fe
Fe
Fe
Fe
Fe
Fe
Fe
Ni
Ni
Ni
Cr
Cr
Cr
Al
Al
Ti
Ti
Ti
Base Alloy -‐ TiFeCrNi Base Alloy Plus Al -‐ TiFeCrNiAl
Base Alloy Plus Cu -‐ TiFeCrNiCu Base Alloy Plus Mo -‐ TiFeCrNiMo
Average Hardness Values (HV) TiFeCrNi 844.0 TiFeCrNiAl 677.1 TiFeCrNiCu 538.1 TiFeCrNiMo 901.5
Goals § Characterize and determine the mechanical
proper>es of the base alloy TiFeCrNi § Determine the effects of Al, Mo, and Cu on the
microstructure and mechanical proper>es of the base alloy
Alloy Predicted
(HV) Measured
(HV) Difference
(%) TiFeCrNi 814.5 844.0 3.62 TiFeCrNiAl 666.1 677.1 1.66 TiFeCrNiCu 729.0 538.1 26.19 TiFeCrNiMo 925.7 901.5 2.61
Effects on Hardness § Hardness values for each HEA found to be related
to the hardness values of the component elements. • Base alloy, base plus Al, and base plus Mo
followed this behavior • Base plus Cu alloy did not
• This result was seen in other HEA’s with Cu § Hardness rela>onship not observed in HEA’s with
unequal atomic ra>os that had been worked hardened or heat treated
§ The base alloy was bri`le • Cracking around indents
§ Addi>on of Al eliminated cracks from around indents
§ Addi>on of Cu reduced the cracks found around indents and reduced overall bri`leness
§ Addi>on of Mo produced cracks at some indents and reduced the bri`leness
Effects on ComposiKon § Base Alloy
• Cr rich regions contained mostly Fe • Ti and Fe found in near equal amounts • Ni rich regions mostly with Ti and lower amounts
of Fe • Cr behavior does not follow enthalpy of mixing
behavior • Ti, Fe, and Al follow to a higher degree
§ Base Alloy Plus Al • Ni and Al found together in higher amounts • Cr and Al concentra>ons change with one
another • Cr concentra>on inversely related to Ni
concentra>on • Ti and Fe display interac>ve behavior • Fe has even distribu>on in matrix • Elements do not behave as expected from
enthalpy of forma>on § Base Alloy Plus Cu
• Almost no Cu found in α or β phases • Cu found between α and β phases with Ni • Ni found in high concentra>ons in eutec>c phase • Ti has even distribu>on in eutec>c phase • Cr found predominately with Fe • No strong connec>on to enthalpy of forma>on
§ Base Alloy Plus Mo • Mo formed dendrites with Cr • Cr also found with Fe • Ti and Ni were found predominantly together • Small correla>on to enthalpy of forma>on
Element (atm%) Phase Ti Cr Fe Ni α 3.78 68.98 21.59 05.65 β 26.68 17.68 26.95 28.69 δ 22.33 11.83 15.79 50.05 θ 24.54 15.92 20.50 39.05
Element (atm%) Phase Ti Cr Fe Ni Al α 20.66 7.02 14.90 30.21 27.20 β 26.41 22.87 29.32 6.67 14.63 δ 14.67 31.93 20.54 12.75 20.10 θ 20.10 11.52 19.33 24.34 24.71
Element (atm%) Phase Ti Cr Fe Ni Mo α 10.47 33.19 10.39 03.44 42.51 β 15.09 26.88 26.78 14.42 16.83 γ 21.81 20.83 25.91 22.87 8.59 σ 40.12 4.27 8.32 46.65 0.65 δ 24.94 3.92 7.21 63.15 0.78 θ 27.29 11.12 15.64 43.61 2.35 λ 26.65 13.22 18.13 38.67 3.33
Effects to Microstructure § Base Alloy
• Primary dendri>c α phase with eutec>c interdendri>c phase
• Secondary β phase § Base Alloy Plus Al
• Primary dendri>c α phase • Non-‐equiaxed interdendri>c phase • Secondary β phase
§ Base Alloy Plus Cu • Primary dendri>c α phase with eutec>c
interdendri>c phase • Cu rich interdendri>c regions • Secondary β phase
§ Base Alloy Plus Mo • Primary dendri>c phase with varying composi>on • Eutec>c interdendri>c phase
References [1] B.A. Welk, H.L. Fraser, P.K. Liaw, M.A. Gibson, “Evalua>on of composi>on gradients via LENS for the transi>on from bulk metallic glass to high entropy alloys”, CSIRO., (2013)
Acknowledgements Hamish Fraser, Brian Welk, Michael Presley, and CAMM for project concept and support.
Conclusions § Bri`leness of base alloy reduced with each alloying
element § Addi>on of Al reduced bri`leness the most § Hardness for base alloy, +Al, and +Mo related to
composi>on and hardness of elements. § Base alloy with Cu did not follow this rela>onship § Microstructures varied greatly between alloys § Possible intermetallic phases formed § Most of the phases formed did not follow behavior
expected from enthalpy of forma>on. • Ti mostly had an even distribu>on and was
commonly found with Fe and Ni. • Fe found with Ti. Very even distribu>on through
phases. • Cr oqen found with Fe. Also found with Mo and
Al. Did not form phases with other elements very oqen.
• Ni found mostly with Ti and Al. Not found in high concentra>ons with Cr.
• Al found with Ni in high concentra>ons. Also found with Ti and Cr.
• Cu segregated out from Fe and Cr. Found mostly in-‐between α and β phases, with high concentra>ons of Ni.
• Mo found Predominantly in dendrites. Produced very dis>nct concentra>on gradient decreasing in concentra>on as distance from center increased. Found with Cr as well as Fe and even less Ni and Ti. Typically not found outside of dendrite.
Element (atm%) phase Ti Cr Fe Ni Cu α 27.53 18.85 35.06 15.82 02.74 β 3.38 70.62 22.09 2.88 1.04 γ 24.18 8.29 13.48 33.72 20.32 δ 24.83 9.69 17.03 33.51 14.93 θ 24.23 6.33 11.64 38.95 18.86 λ 23.85 6.16 11.54 41.72 16.73
α
θ δ
β
α
θ
δ
β
0
10
20
30
40
50
60
70
80
0 2 4 6 8 10 12 14 16
Atm %
Distance (µm)
0
5
10
15
20
25
30
35
40
0 2 4 6 8 10 12 14 16 18
Atm %
Distance (µm)
α
θδ
βγ
λ
α
θδ
β
γ
λ σ
0
10
20
30
40
50
60
70
80
0 2 4 6 8 10 12 14 16 18 20
Atm %
Distance (µm)
0
10
20
30
40
50
60
70
0 2 4 6 8 10 12 14 16 18
Atm %
Distance (µm)
Comparison of the predicted hardness values using equa>on 1 and the average hardness value found, in Vickers.
MoKvaKon § HEA’s are a rela>vely new alloy system § HEA’s exhibit good mechanical proper>es [1]
• High strength even at high temperature • Good duc>lity • Corrosion resistance • Wear resistance
§ Currently, not much is known why HEA’s behave the way they do, due to their inherent complexity
§ Improve our understanding of how elements effect the overall performance of HEA’s
§ Allow for the development of HEA’s with more desirable proper>es
Equa>on 1: relates the hardness of the HEA’s found in this experiment, in Vickers (HVHEA) to the atomic percent (AP) of each element (E) and its hardness value (HVE).
Enthalpy of FormaKon Elements (KJ/g-‐at) Elements (KJ/g-‐at) Ti-‐Fe -‐82 Al-‐Ni -‐81 Ti-‐Cr -‐38 Cu-‐Ti -‐78 Ti-‐Ni -‐140 Cu-‐Fe 60 Fe-‐Cr -‐6 Cu-‐Cr 52 Fe-‐Ni -‐6 Cu-‐Ni 26 Cr-‐Ni -‐26 Mo-‐Ti -‐16 Al-‐Ti -‐135 Mo-‐Fe -‐9 Al-‐Fe -‐41 Mo-‐Cr 2 Al-‐Cr -‐36 Mo-‐Ni -‐27


