Copyright © 2013 Pearson Education, Inc. publishing as Prentice Hall
4-1
International Business
Environments & Operations
14e
Daniels ● Radebaugh ● Sullivan

Copyright © 2013 Pearson Education, Inc. publishing as Prentice Hall
4-2
Chapter 4
The Economic Environments Facing
Business

Copyright © 2013 Pearson Education, Inc. publishing as Prentice Hall
4-3
Learning Objectives To communicate the importance of
economic analysis To discuss the idea of economic freedom To profile the characteristics of the types
of economic systems To introduce the notion of state capitalism To profile indicators of economic
development, performance, and potential

Copyright © 2013 Pearson Education, Inc. publishing as Prentice Hall
4-4
IntroductionLearning Objective 1:To communicate the importance of economic analysis

Copyright © 2013 Pearson Education, Inc. publishing as Prentice Hall
4-5
Introduction Managers assess a country’s economic
environment knowing Countries differ in different ways Economic and political changes alter market
circumstances It is important to understand connections,
change, and consequences The challenges of the comeback Choices of citizens, policymakers, and
institutions

Copyright © 2013 Pearson Education, Inc. publishing as Prentice Hall
4-6
International Economic Analysis
A universal assessment of economic environments is difficult because it is difficult to stipulate a definitive set of
indicators to estimate the performance and potential of a country’s economy
today’s set of perfect measures may prove imperfect tomorrow
interdependencies complicate interpreting the relationship among elements of the economic environment

Copyright © 2013 Pearson Education, Inc. publishing as Prentice Hall
4-7
International Economic Analysis
Economic Factors Affecting International Business Operations

Copyright © 2013 Pearson Education, Inc. publishing as Prentice Hall
4-8
Economic FreedomLearning Objective 2: To discuss the idea of economic freedom

Copyright © 2013 Pearson Education, Inc. publishing as Prentice Hall
4-9
Economic Freedom Economic freedom – people have the
right to work, produce, consume, save, and invest the way they prefer measured across business freedom, monetary
freedom, fiscal freedom, investment freedom, freedom from corruption, property rights, trade freedom, government size, financial freedom, and labor freedom

Copyright © 2013 Pearson Education, Inc. publishing as Prentice Hall
4-10
Economic FreedomEconomic Freedom by Region, with Population

Copyright © 2013 Pearson Education, Inc. publishing as Prentice Hall
4-11
Economic FreedomGlobal Distribution of Economic Freedom
Copyright © 2013 Pearson Education, Inc. publishing as Prentice Hall
4-12
Value of Economic Freedom
Economic freedom affects Growth rates Productivity Income levels Inflation Employment Life expectancy Literacy Political openness Environmental sustainability

Copyright © 2013 Pearson Education, Inc. publishing as Prentice Hall
4-13
Trends in Economic Freedom
The trend toward increased economic freedom is no longer certain Questions about the legitimacy of free markets The benefits of more state control

Copyright © 2013 Pearson Education, Inc. publishing as Prentice Hall
4-14
Types of Economic Systems
Learning Objective 3: To profile the characteristics of the types of economic systems

Copyright © 2013 Pearson Education, Inc. publishing as Prentice Hall
4-15
Types of Economic Systems
An economic system refers to the mechanism that deals with the production, distribution, and consumption of goods and services
Types Market economy Command economy Mixed economy
Copyright © 2013 Pearson Education, Inc. publishing as Prentice Hall
4-16
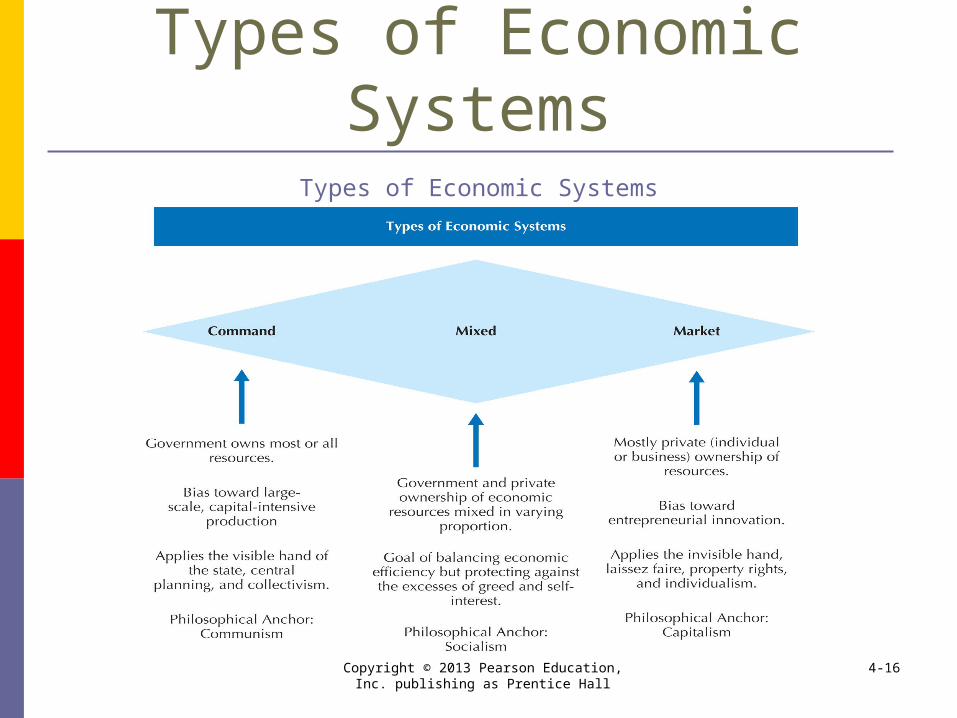
Types of Economic Systems
Types of Economic Systems

Copyright © 2013 Pearson Education, Inc. publishing as Prentice Hall
4-17
Market Economy In a market economy individuals rather
than governments make most economic decisions Capitalism
private ownership of capital Laissez-faire
governmental noninterference in economic affairs

Copyright © 2013 Pearson Education, Inc. publishing as Prentice Hall
4-18
Command EconomyLearning Objective 4: To introduce the notion of state capitalism

Copyright © 2013 Pearson Education, Inc. publishing as Prentice Hall
4-19
Command Economy In a command economy the visible hand
of the state supersedes the invisible hand of individuals Government
owns and controls resources determines prices
Communism
Copyright © 2013 Pearson Education, Inc. publishing as Prentice Hall
4-20
Mixed Economy Most economies are mixed economies
fall between market and command economies Socialism
regulate economic activity with a focus on social equality and a fair distribution of wealth

Copyright © 2013 Pearson Education, Inc. publishing as Prentice Hall
4-21
State Capitalism: Detour or Destination?
State capitalism refers to a system in which the government explicitly manipulates market outcomes for political purposes promote certain industries to encourage
economic development develop national companies into global leaders foreign companies restricted from strategic
industries

Copyright © 2013 Pearson Education, Inc. publishing as Prentice Hall
4-22
Economic Development, Performance, and PotentialLearning Objective 5:To profile indicators of economic development, performance, and potential

Copyright © 2013 Pearson Education, Inc. publishing as Prentice Hall
4-23
Economic Development, Performance, and Potential
Broad classes of countries include developing countries
largest number of countries low per capita income
emerging economies fast growing, relatively prosperous BRICs – Brazil, Russia, India, and China
developed countries high per capita income and standard of
living like the U.S., Japan, France, Australia

Copyright © 2013 Pearson Education, Inc. publishing as Prentice Hall
4-24
Gross National Income Gross national income (GNI)
the broadest measure of economic activity for a country
Gross national product (GDP) the total value of all final goods and services
produced within a nation in a particular year Gross domestic product (GDP)
the total market value of goods and services produced by workers and capital within a nation’s borders

Copyright © 2013 Pearson Education, Inc. publishing as Prentice Hall
4-25
Improving Analysis GNI data should be adjusted for
the growth rate of the economy the number of people in a country the local cost of living

Copyright © 2013 Pearson Education, Inc. publishing as Prentice Hall
4-26
Improving AnalysisGNI per capita, 2009

Copyright © 2013 Pearson Education, Inc. publishing as Prentice Hall
4-27
Improving AnalysisGNI per capita adjusted for Purchasing Power Parity

Copyright © 2013 Pearson Education, Inc. publishing as Prentice Hall
4-28
Broader Conceptions of Performance and Potential
Green economics gauge economic performance in terms of the
effect of current choices on long-term sustainability
Sustainable development meet the needs of the present without
compromising the ability of future generations to meet their own needs
Happynomics importance of emotional prosperity in addition
to financial prosperity

Copyright © 2013 Pearson Education, Inc. publishing as Prentice Hall
4-29
Features of an Economy Managers should also consider
Inflation Unemployment Debt Income distribution Poverty Balance of payments

Copyright © 2013 Pearson Education, Inc. publishing as Prentice Hall
4-30
Inflation Inflation
a measure of the increase in the cost of living Deflation
when prices for products go down not up Reflation
increase the money supply and reduce taxes to accelerate economic activity

Copyright © 2013 Pearson Education, Inc. publishing as Prentice Hall
4-31
Unemployment Unemployment rate
share of unemployed workers seeking employment for pay relative to the total civilian labor force
Misery index the sum of a country’s inflation and
unemployment rates

Copyright © 2013 Pearson Education, Inc. publishing as Prentice Hall
4-32
Debt Debt
the total of a government’s financial obligations
internal debt external debt
Growing public debt signals tax increases reduced growth rising inflation increasing austerity

Copyright © 2013 Pearson Education, Inc. publishing as Prentice Hall
4-33
Income Distribution Income distribution
estimates the proportion of the population that earns various levels of income
Gini coefficient measures the extent to which the distribution
of resources deviates from a perfectly equal distribution

Copyright © 2013 Pearson Education, Inc. publishing as Prentice Hall
4-34
Poverty Poverty the state of having little or no
money and few or no material possessions extreme poverty
less than $1.25 per day moderate poverty
less than $2.00 per day Today the world population is 80% poor,
10% middle income, and 10% rich Base of the Pyramid
Frugal engineering

Copyright © 2013 Pearson Education, Inc. publishing as Prentice Hall
4-35
Balance of Payments Balance of payments
reports a country’s trade and financial transactions with the rest of the world
Current account tracks merchandise trade
Capital account tracks loans given to foreigners and loans
received by citizens

Copyright © 2013 Pearson Education, Inc. publishing as Prentice Hall
4-36
Balance of PaymentsComponents of a Country’s Balance of Payments

Copyright © 2013 Pearson Education, Inc. publishing as Prentice Hall
4-37
Balance of PaymentsCurrent Account Balances: The Top and Bottom Five
Copyright © 2013 Pearson Education, Inc. publishing as Prentice Hall
4-38
All rights reserved. No part of this publication may be reproduced, stored in a retrieval system, or transmitted, in any form or by any means, electronic, mechanical, photocopying, recording, or otherwise, without the prior written permission of the publisher. Printed in the United States of America.


