
copyright Elsevier BV
University Investmentsin the Library, Phase II
An International Study
Arthur Eger MSc
Stellenbosch Symposium / IFLA Presidential Meeting 2010
18 February 2010
copyright Elsevier BV
Library value for the institute
• Academic libraries all over the world face the challenge of demonstrating and quantifying their value to their funders
• Academic leaders need evidence how the library supports the institution’s strategic goals
• Researchers at the University of Illinois at Urbana-Champaign (UIUC) interviewed top-level administrators about priorities and values (Luther, 2008)
copyright Elsevier BV
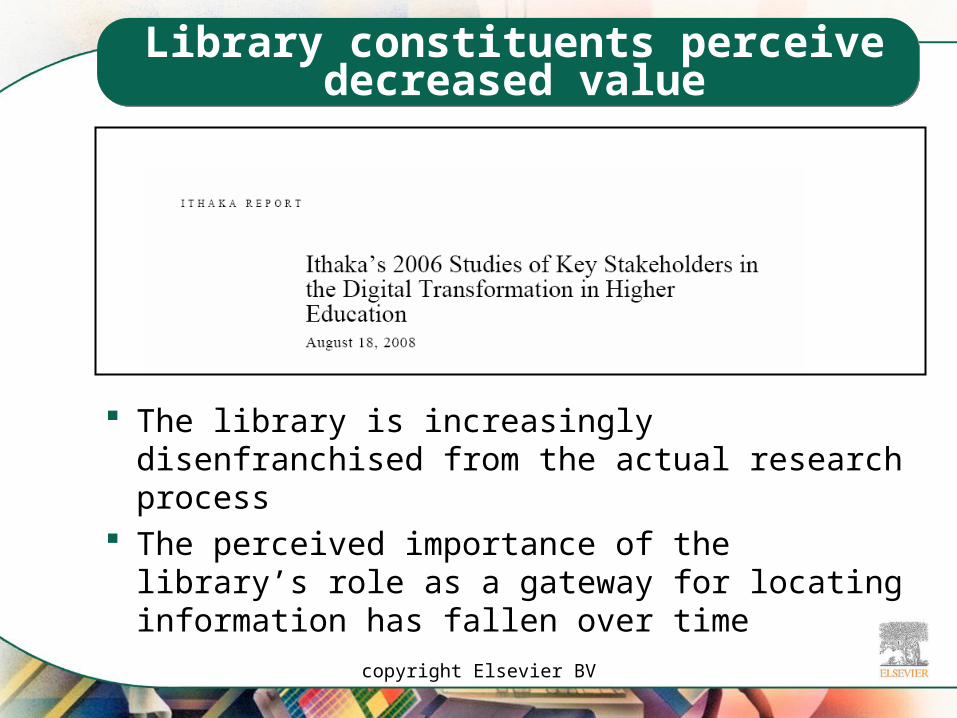
Library constituents perceivedecreased value
The library is increasingly disenfranchised from the actual research process
The perceived importance of the library’s role as a gateway for locating information has fallen over time

copyright Elsevier BV
Value gap emerges:ARL expenditures vs perception of library
Online catalogs
CD-ROMs
Web browsers
Amount spent on library resources
Perceived value of library as an information gateway
Value Gap
Chart courtesy of Dr Carol Tenopir, 2009
Figures from the Association of Research Libraries

copyright Elsevier BV
Cycle of development for the university
University
Learning about library users:What has been done in the past
Significant research improves the intellectual climate and research reputation
Reputation helps the university
attract and retain productive faculty
Productive faculty helps university attract funding and improves reputation
What administrators want: libraries that support institutional strategic goals

copyright Elsevier BV
Establishing library value in the past and the future
Library
Focus groups & opinion surveys to examine changes, make
improvements
Use surveys & data to show value,
outcomes, ROI
Usage logs to show what people do on library systems to inform collection
decisions & growth
Methods to learn about users and usage work together to show explicit and implicit value

copyright Elsevier BV
Goal of ROI
To demonstrate that library collections contribute to the income-generating
activities of the institution.
For every monetary unit spenton the library,
the university receives ‘X’ monetary unitsin return.

copyright Elsevier BV
Library validation methodologies
Popular methodologies:• Cost/benefit analysis• Contingent validation
(what would be lost if the library ceased to exist)• Secondary impact analysis• Social Return on Investment• Quantifiable benefits analysis
Some results:
•Florida Public Libraries ROI of $6.54 (2004)
•Ohio Public Library systems $3.81 quantifiable benefits
•University of Pittsburg nett benefit $2.90 to $1
Prior to 2008 no methodology offered a way to measure an academic library‘s role in generating (grant) income for the
university

copyright Elsevier BV
Quantifying for the university

copyright Elsevier BV
Types of data:Reliable, accessible, clearly defined
Data types Methods
Research Faculty Survey: quantitative and qualitative
Grant Proposals University-supplied data; survey
Grant Income University-supplied data
Library Total budget (including collection, facilities, personnel, etc.)
Administrators’ Priorities Personal interviews (with library leadership, university executives, and research managers)

copyright Elsevier BV
Phase I: ROI model for UIUC
78.14% faculty w/ grant proposals using citations from libraryX
50.79% award success rate from grants using citations from libraryX
$63,923 average grant income=
$25,369 avg. income generated from grants using citations from libraryX
6232 grants expended÷
$36,102,613 library budget=
$4.38 grant income for each $1.00 invested in library(ROI value expressed as 4.38:1 ratio)
The UIUC pilot study demonstrate that library collections contribute to income generating activities
copyright Elsevier BV
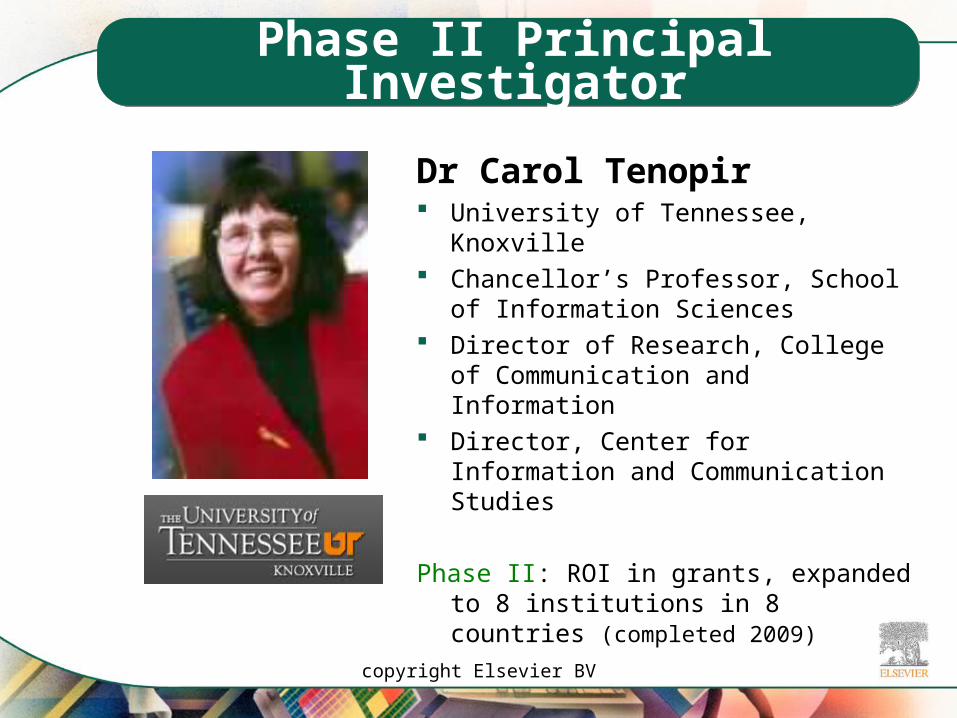
Phase II Principal Investigator
Dr Carol Tenopir University of Tennessee, Knoxville Chancellor’s Professor, School of
Information Sciences Director of Research, College of
Communication and Information Director, Center for Information and
Communication Studies
Phase II: ROI in grants, expanded to 8 institutions in 8 countries (completed 2009)

copyright Elsevier BV
Phase II: Narrow focus, broad range of institutions
Keeps the focus on ROI for grants income
Extends the phase I model• To 8 more institutions in 8 countries• Identifies similarities and differences across
the countries and institutions
Tests the model for replication

copyright Elsevier BV
Phase II: Distribution of institutions
copyright Elsevier BV
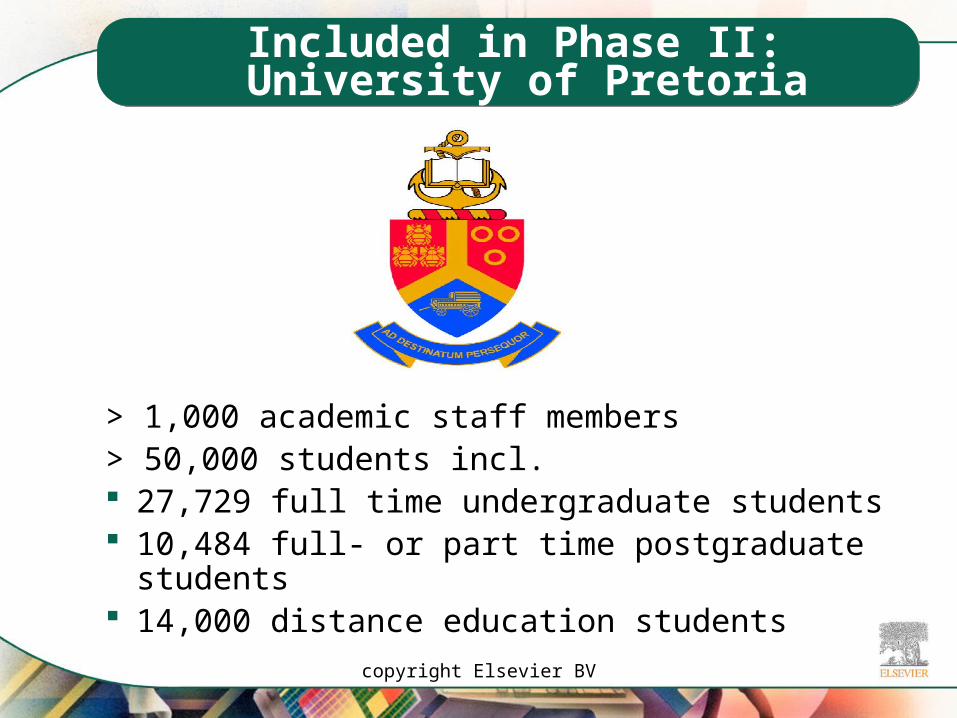
Included in Phase II: University of Pretoria
> 1,000 academic staff members> 50,000 students incl. 27,729 full time undergraduate students 10,484 full- or part time postgraduate students 14,000 distance education students
copyright Elsevier BV
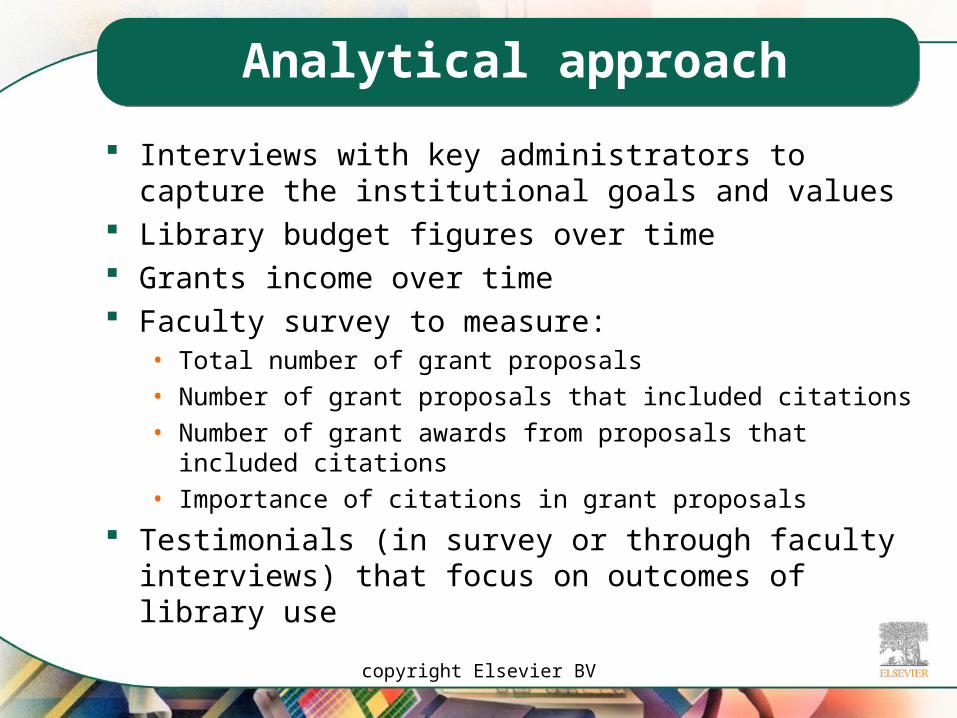
Analytical approach
Interviews with key administrators to capture the institutional goals and values
Library budget figures over time Grants income over time Faculty survey to measure:
• Total number of grant proposals• Number of grant proposals that included citations• Number of grant awards from proposals that included
citations• Importance of citations in grant proposals
Testimonials (in survey or through faculty interviews) that focus on outcomes of library use

copyright Elsevier BV
Executive values:Issues that are similar
Attain prestige and internationalization Improve faculty and research productivity Attract high quality students through high quality
instruction Expand grant funding
“Funding does not regenerate funding.But reputation does.”
– Charles Zukoski, UIUC

copyright Elsevier BV
Executive values:Issues that are different
University mission• Research-intensive versus focus on teaching• Cultural preservation versus globalization
Funding sources• External versus internal• National versus global
Mandates• Institutional, regional, national
Library alignment with mission• Investment in information resources• Enablement of e-access/infrastructure
copyright Elsevier BV
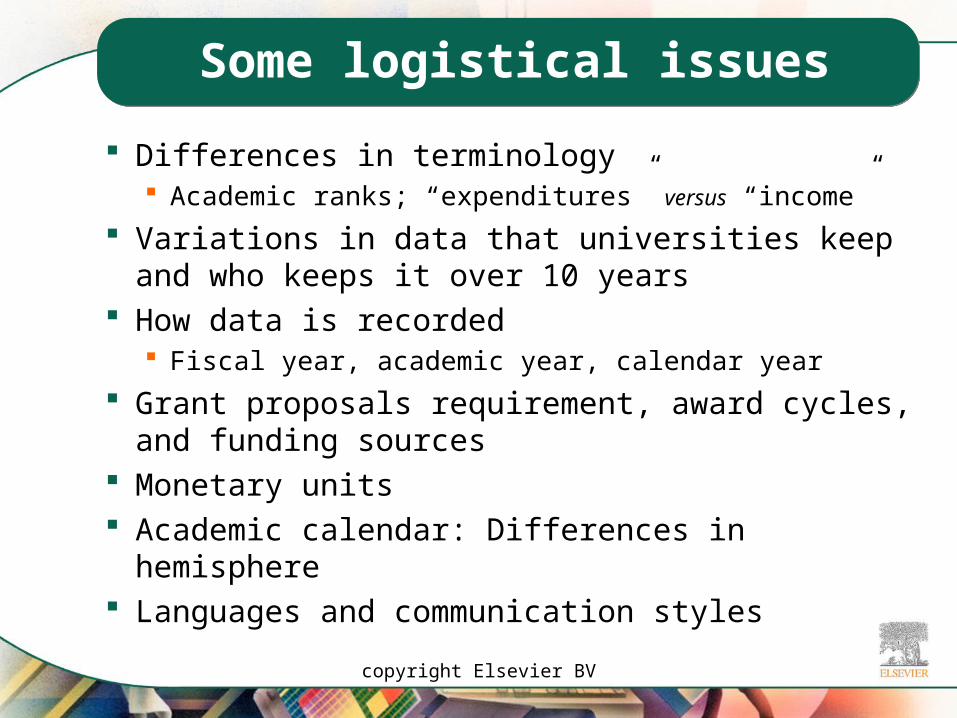
Some logistical issues
Differences in terminology Academic ranks; “expenditures” versus “income”
Variations in data that universities keep and who keeps it over 10 years
How data is recorded Fiscal year, academic year, calendar year
Grant proposals requirement, award cycles, and funding sources
Monetary units Academic calendar: Differences in hemisphere Languages and communication styles
copyright Elsevier BV
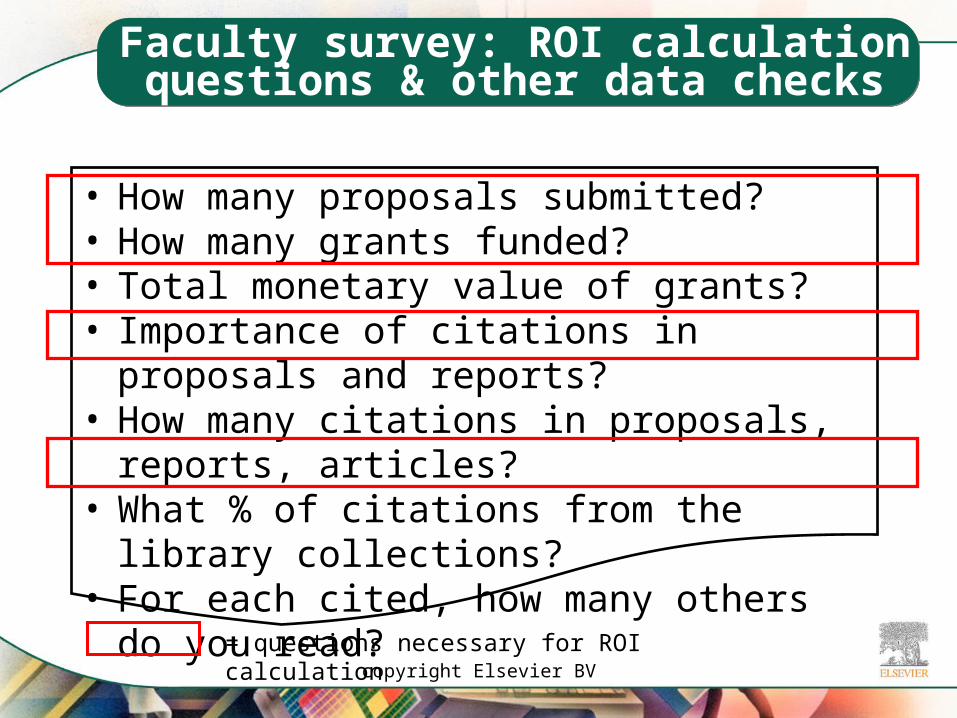
Faculty survey: ROI calculation questions & other data checks
• How many proposals submitted?• How many grants funded?• Total monetary value of grants?• Importance of citations in proposals and reports?• How many citations in proposals, reports,
articles?• What % of citations from the library collections?• For each cited, how many others do you read?
= questions necessary for ROI calculation

copyright Elsevier BV
Faculty survey: questions which may provide revealing testimonials
• How many hours in a typical week do you spend on:• Finding or accessing articles or books?• Reading articles or books?
• How has access to e-resources through the university network changed the way you work?

copyright Elsevier BV
Faculty survey: Demographics
• What is your primary subject discipline?• What is your current rank/position?

copyright Elsevier BV
Faculty survey comments:Value of e-resources
“With the current workload, I could not continue with
research without the convenience of access from
my own computer.” –Africa
“You have access to many more articles and … you
are more aware of what is going on in the field.”
–Western Europe
“Access has made collecting research
resources infinitely more efficient; and facilitated
interdisciplinary research.” –North America
“A sure way to kill a proposal is not to give proper credit or
to not update new developments.” –North
America

copyright Elsevier BV
Faculty survey comments:Positive impact on productivity
“I guess that on average the online access saves me more
than 10 hour per week.” –Western Europe
“The task of finding the most pertinent articles on a new
topic used to take a full afternoon. The same work can now be completed in 15 to 30
minutes.” –North America
“My productivity would drop at least four fold if I had to go to the library for all my needs.”
–North America
“The convenience of desktop delivery has improved my
efficiency and … my ability to be a better researcher and
teacher.” –Asia-Pacific

copyright Elsevier BV
Faculty survey comments:Library value to research
“Such access has become an essential research tool.”
–Asia-Pacific
“It would be impossible to be competitive
internationally without electronic access to publications.” –North
America
“I would leave this university in a microsecond
if the library deteriorated ...” –North
America
“It has helped me open or discard lines of research at
the very beginning by knowing what other
researchers have published or are soon going to
publish.” –Western Europe

copyright Elsevier BV
Grants ROI phase II model
Numbers/percentages input into model
Juxtapose with interviews and survey responses
Put the ROI result into context for institutional faculty and executive administration
copyright Elsevier BV
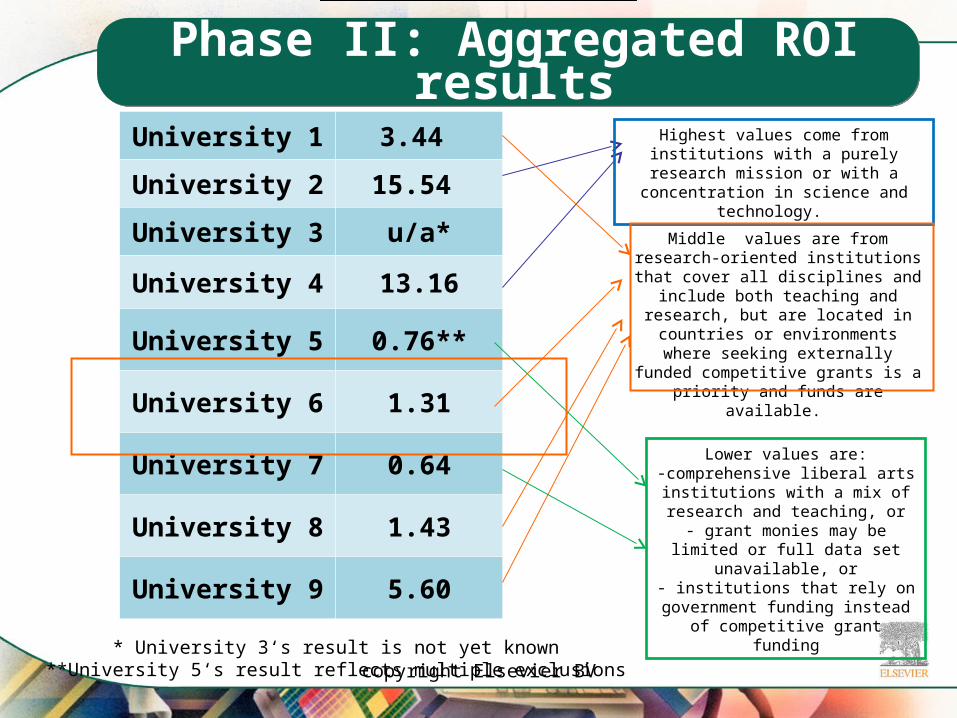
Phase II: Aggregated ROI results
University 1 3.44
University 2 15.54
University 3 u/a*
University 4 13.16
University 5 0.76**
University 6 1.31
University 7 0.64
University 8 1.43
University 9 5.60
Highest values come from institutions with a purely research mission or with a
concentration in science and technology.
Middle values are from research-oriented institutions that cover all
disciplines and include both teaching and research, but are located in countries or environments where seeking externally funded competitive grants is a priority
and funds are available.
Lower values are:-comprehensive liberal arts
institutions with a mix of research and teaching, or
- grant monies may be limited or full data set unavailable, or
- institutions that rely on government funding instead of competitive grant
funding
* University 3‘s result is not yet known**University 5‘s result reflects multiple exclusions

copyright Elsevier BV
ROI Elements for University of Pretoria
*
* University 7 showed an extreme high average size of grant influencing the average

copyright Elsevier BV
Faculty Survey Analysis

copyright Elsevier BV
Faculty Survey Analysis
•At least 3/3 of respondents say it is (very) important or essential to the grant award process to cite references
•Most respondents access at least half of the articles and books from library e-resources

copyright Elsevier BV
Faculty Survey Analysis
Respondents report they spend at least 3.5 hours per week finding and accessing articles, and at least 9.8 hours reading articles

copyright Elsevier BV
How e-resources changed faculty
E-resources help: to work more efficient and increase productivity by
faster access and more efficient searching to improve research and preparation of grant
proposals to explore a wider range and greater volume of
literature which leads to a greater understanding, making research and teaching more innovative, current and thorough
to share articles

copyright Elsevier BV
Phase II: Grants ROI varies
From 15.54:1 to under 1:1 ROI depends on institutional mission
• Research focus is higher; teaching focus is lower
Be cautious when comparing ROI among institutions with differing missions
ROI is one of other measures of the library’s value• Usage = implied value• Stakeholder testimonials = explicit value• Time & cost savings = contingent valuation
ROI for grants is only one of many other measures of the library‘s value

copyright Elsevier BV
Phase I and II: what we learned
Library resources support faculty’s work by increasing productivity, efficiency, interdisciplinary explorations and international collaborations
University leaders use library to recruit and retain faculty and students
Library supports promoting the university’s international reputation
Faculty view library as valuable to research and grants process
copyright Elsevier BV
Phase II and III: limitations and extensions
Phase II: measure of ROI is based solely on the contribution of the library’s resources to the institutional research grants income
Phase III: will examine how to quantify other ways in which the library creates value through its contribution to teaching, student engagement, and the university’s overall stature
Dr. Tenopir received a $1 million grant from the Institute of Museum and Library Services for Phase III

copyright Elsevier BV
Phase III: Broaden focus
How the library’s functional areas measure within the university mission

copyright Elsevier BV
What Phase III hopes to show
The library’s products and services … Help faculty be successful Help students be successful Generate both immediate and future income Provide a good return for the investment to
the institution

copyright Elsevier BV
Some final thoughtson measuring value
Tie what you measure to your university’s mission
Measure value and outcomes• Quantitative data shows ROI and trends• Qualitative information tells the story
No one method stands alone Enhanced access to information increases
your library’s value to your university
copyright Elsevier BV
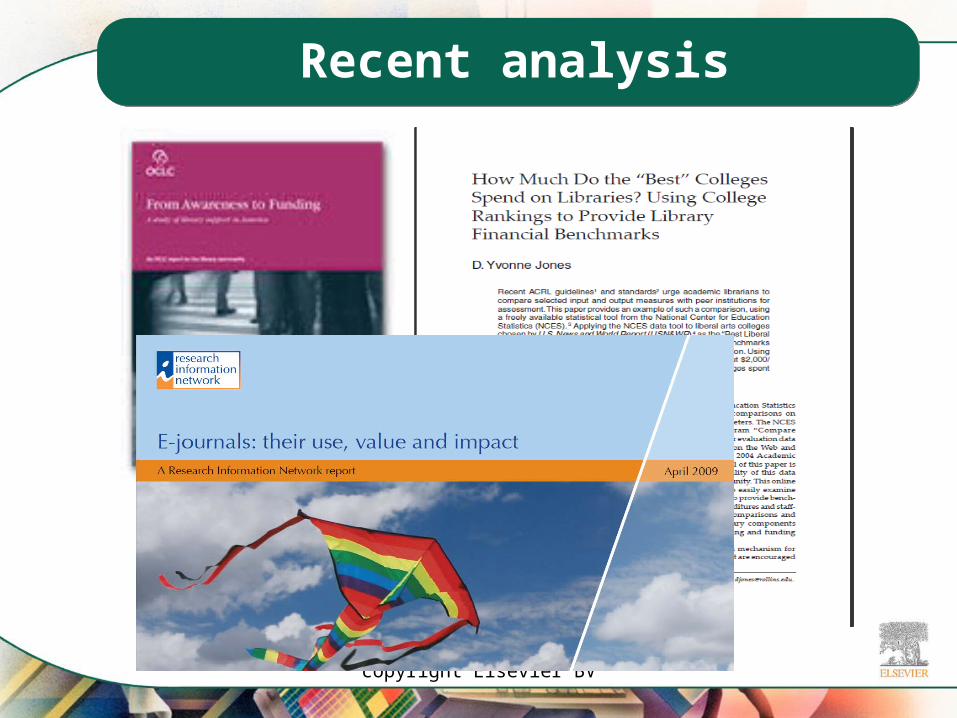
Recent analysis

copyright Elsevier BV40
This computer model quantifies the association between downloads and research outcomes.A doubling (100 per cent increase) in downloads, from 1 to 2 million, is statistically associated with dramatic increases in research productivity. The gearing becomes even stronger as the volume of downloads increases further. (Source: “E-journals: their use, value and impact”)

copyright Elsevier BV
41
Relationship between Number of Full Text Article requests from SD and number of articles published
0
1
2
3
4
5
6
7
8
9
10
1996 1997 1998 1999 2000 2001 2002 2003 2004 2005 2006 2007 2008
Th
ou
san
ds
# ar
ticl
es p
ub
lish
ed
0
1
2
3
4
5
Mil
lio
ns
FT
A d
ow
nlo
ads
Article output South Africa FTA downloads South Africa

copyright Elsevier BV
Thank you very much!
A free white paper about phase II and its results and analysis will be available before the end of
this year
www.elsevier.com/wps/find/librarianshome.librarians
twitter.com/library_connect
www.facebook.com/libraryconnect

copyright Elsevier BV
Further reading: Academic libraries
Luther, 2008. University investment in the library: What’s the return? A case study at the University of Illinois at Urbana-Champaign. http://libraryconnect.elsevier.com/whitepapers/0108/lcwp010801.html
Mezick, 2007. Return on investment: Libraries and student retention. Journal of Acad Libship 33, 561-566.
Jones, 2007. How much do the ‘best’ colleges spend on libraries? C&RL 68(4), 343-351.
Tenopir & King, 2007. Perceptions of value and value beyond perceptions. Serials 20(3), 199-207.
Housewright & Schonfeld, 2008. Ithaka’s 2006 studies of key stakeholders in the digital transformation of higher education.http://www.ithaka.org/publications/facultyandlibrariansurveys
Research Information Network and CIBER, 2009. E-journals: their use, value and impact. http://www.rin.ac.uk/use-ejournals

copyright Elsevier BV
Further reading: Public libraries
Griffiths, King and others, 2004. Taxpayer return on investment in Florida Public Libraries.dlis.dos.state.fl.us/bid/roi/pdfs/ROISummaryReport.pdf
Value for money: Southwestern Ohio’s return from investment in public libraries. 2006. http://9libraries.info/docs/EconomicBenefitsStudy.pdf
Library Research Service, 2007. Return in investment for public libraries. www.lrs.org/public/roi/
Urban Library Council, 2007. Making cities stronger: Public library contributions to local economic development. www.urbanlibraries.org/files/making_cities_stronger.pdf
OCLC and Gates Foundation, 2008. From awareness to funding: A study of library support in America. http://www.oclc.org/reports/funding/default.htm

copyright Elsevier BV
Further reading: Special libraries
Strouse, 2003. Demonstrating value and return on investment: The ongoing imperative. Information Outlook (March), 14-19.
Griffiths & King, 1993. Special Libraries: Increasing the information edge. Special Libraries Association.
Special Libraries Association, 1997. Enhancing competitiveness in the information age.


