
CORE ZOO

INTRODUCTION

•Will biometric characteristics within a zoo menagerie change with the addition of good and bad quality biometric enrollments?
RESEARCH QUESTION/HYPOTHESIS

•Biometric menageries are used to classify subjects based on biometric matching to their own template and to others
•There are many different types of zoo’s, like the Doddington zoo and the Dunstone and Yager zoo, and they all differ from each other
STATEMENT OF THE PROBLEM

LITERATURE REVIEW

•Biometrics refers to recognizing individuals based on behavioral and physical characteristics such as fingerprints and facial features
•These biometrics can be used to identify and relate one’s features to themselves and to others
BIOMETRICS

•Fingerprints are more commonly used over every other type of biometric, especially when comparing with zoo menageries
•Fingerprints have many “minutiae points” across the surface of the finger which are used to compare and identify who a fingerprint belongs to
FINGERPRINTS

• Quality can be tested by a number of different factors, the fidelity image, the utility image, and the character image
• Fidelity checks the degree of similarity between the sample and its user
• Utility assesses the overall impact on the system
• Character represents features from a biometric sample
• Higher quality images tend to perform better in a recognition system
• High quality fingerprints have well-defined ridge structures, good global and local features as well as no abrasions, residues, cuts, or creases from age [4]
FINGERPRINT QUALITY

•These zoo menageries are created by matching a person’s biometric sample against a population. If they are not the same person’s fingerprint it is given an imposter or genuine score that describes them as imposters or genuine
•These scores determine your zoo classification
IMPOSTER AND GENUINE SCORES

• Zoo menageries were created because there are still flaws within biometrics
• They characterize people as different animals depending on how well their fingerprint compares to another
• There are two main types of zoo menageries, the Doddington zoo and the Dunstone Yeager zoo
ZOO MENAGERIES

• Measures individual scores based on how well a user matches to those in a specific dataset [8]
• Characterizes people as sheep, wolves, goats, or lambs
• Sheep match well with their own template
• Wolves match well with others
• Goats don’t match themselves well
• Lambs match with other people but not themselves
DODDINGTON ZOO

• The Dunstone and Yager Zoo is created by matching a person’s biometric sample against the data set
• Measures the relationship between a user’s genuine and impostor match results [5]
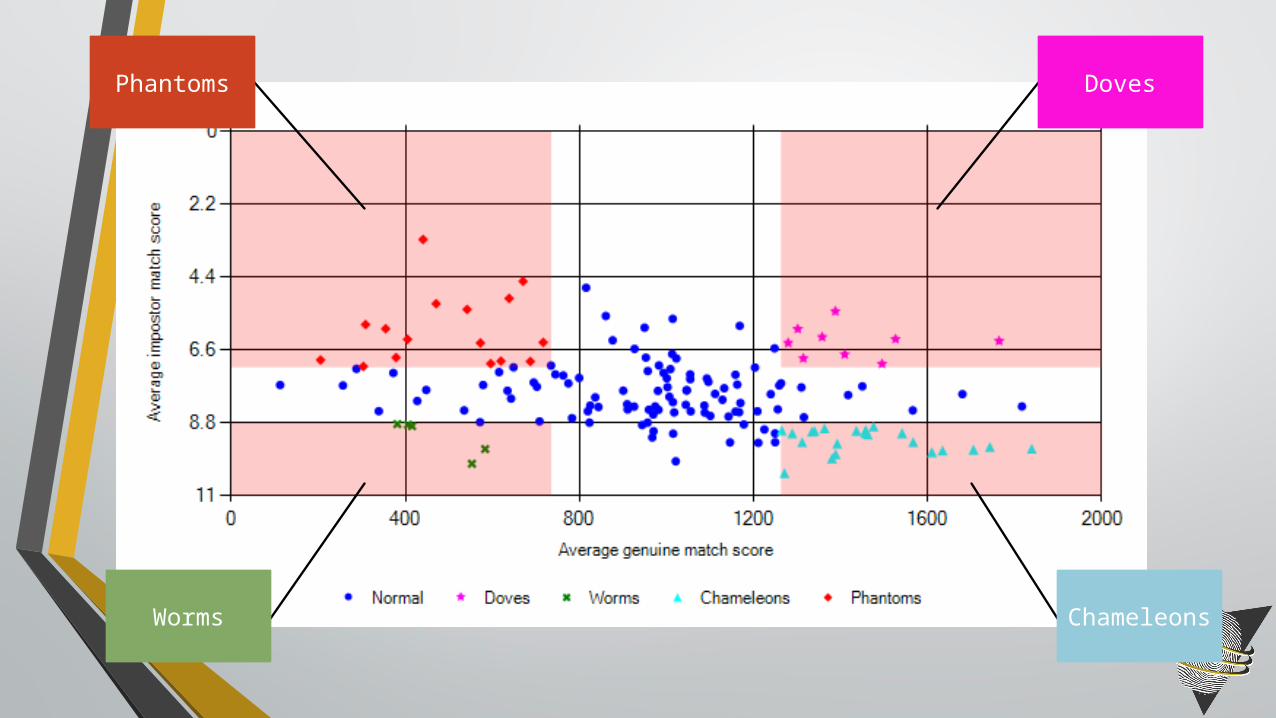
• Characterizes people as worms, phantoms, chameleons, and doves
• Worms match to others well but not to themselves
• Phantoms don’t match well with anybody
• Chameleons match to themselves and others well
• Doves match to themselves well but not to others
DUNSTONE AND YAGER ZOO

•The subject is given an average genuine based on their match results to themselves and an impostor match score based on their match results to others
•These scores determine what zoo classification each subject belongs in
GENUINE/IMPOSTOR SCORES
Phantoms
WormsChameleon
s
Doves

•Davis Wittman did a study that shows that zoo animals do exist in biometric measurements
•Found outliers in facial recognition that closely resemble other people as well as ones that do not match well to themselves
DOES A ZOO EXIST?

•Wittman et al [6] did a study that shows that zoo animals do exist in biometric measurements
•Found outliers in facial recognition that closely resemble other people as well as ones that do not match well to themselves
WEAKNESS OF THE ZOO

•Best possible users
•GH IL
DOVES
GH
GL
IH
IL
Top 25%
Bottom 25%
Genuine Impostor

•Worst possible users
•GL IH
WORMS
GH
GL
IH
IL
Top 25%
Bottom 25%
Genuine Impostor
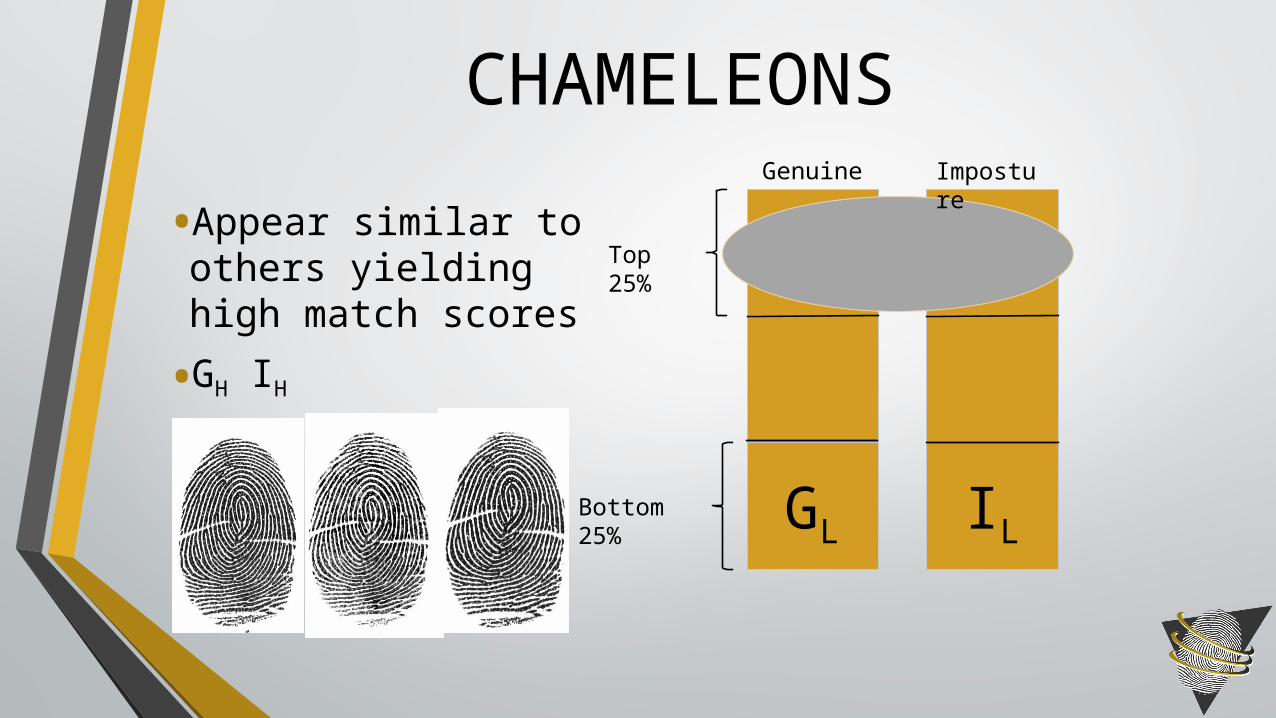
•Appear similar to others yielding high match scores
•GH IH
CHAMELEONS
GH
GL
IH
IL
Top 25%
Bottom 25%
Genuine Imposture

• Low matching scores regardless of compared subject
• GL IL
PHANTOMS
GH
GL
IH
IL
Top 25%
Bottom 25%
Genuine Imposture

METHODOLOGY

• Core – D1 – Original dataset from O’Connor’s thesis
• Dataset 2 – D2 – additional data set from Benny
• Dataset 3 – D3 – additional data set from DHS
• Top- Top 25% of images in terms of quality
• Bottom – Bottom 25% of images in terms of quality
CLASSIFICATIONS OF DATA SETS

• The datasets were combined into groups as shown below:
1. Core plus dataset 2 top as well as core plus dataset 2 bottom (C+D2T and C+D2B)
• Results are in one table
2. Core plus dataset 3 top as well as core plus dataset 3 bottom (C+D3T and C+D3B)
• Results are in one table
3. Core plus dataset 2 + 3 top (C+D2T+D3T)
4. Core plus dataset 2 + 3 bottom (C+D2B+D3B)
• Results for 3 and 4 are in one table
METHODOLOGY

HARDWARE USED
•Crossmatch Guardian
• Fingerprint sensor
•Filemaker
• Database of Samples
•OWR Bio-Metrics
• Used to check zoo placement
•Megamatcher
• Fingerprint matching and quality scores
SOFTWARE USED

RESULTS

•154 subjects in Core
•17 subjects added from Dataset 2 for top and bottom
•20 subjects added from Dataset 3 for top and bottom
RESULTS

Core + Bottom 25% Core Core + Top 25%
IDClassificati
on IDClassificati
on IDClassificati
on
358Normal 358Phantoms 358Phantoms
652Normal 652Phantoms 652Normal
677Normal 677Phantoms 677Normal
697Normal 697Phantoms 697Normal
704Normal 704Doves 704Normal
721Normal 721Doves 721Normal
724Chameleons 724
Chameleons 724Normal
741Normal 741Normal 741Worms
742Normal 742Phantoms 742Phantoms
743Normal 743Normal 743Chameleons
747Normal 747Phantoms 747Normal
839Normal 839Phantoms 839Normal
RESULTS OF CORE + D2

Core + Bottom 25% Core
Core + Top 25%
ID Category ID Category IDCategory
239 Worm 239 Normal 239 Normal
302 Dove 302 Dove 302 Normal
358 Normal 358 Phantom 358Phantom
359Chameleon 359
Chameleon 359 Normal
724Chameleon 724
Chameleon 724 Normal
726Chameleon 726
Chameleon 726 Normal
737 Worm 737 Worm 737 Normal
740 Phantom 740 Normal 740Phantom
743Chameleon 743 Normal 743 Normal
775 Normal 775 Normal 775Phantom
839 Normal 839 Phantom 839Phantom
RESULTS OF CORE + D3

RESULTS OF CORE + D2 + D3Core + Bottom
25% CoreCore + Top
25%
ID Category ID Category ID Category
302 Dove 302 Dove 302 Normal
358 Normal 358 Phantom 358 Phantom
359Chameleon 359
Chameleon 359 Normal
677 Phantom 677 Phantom 677 Normal
686 Phantom 686 Phantom 686 Normal
697 Phantom 697 Phantom 697 Normal
704 Dove 704 Dove 704 Normal
721 Dove 721 Dove 721 Normal
724Chameleon 724
Chameleon 724 Normal
726Chameleon 726
Chameleon 726 Normal
740 Phantom 740 Normal 740 Normal
741 Normal 741 Normal 741 Worm
743Chameleon 743 Normal 743
Chameleon
747 Phantom 747 Phantom 747 Normal
839 Normal 839 Phantom 839 Normal

EXAMPLE SUBJECT 839

SUBJECT 839 CORE GROUP

SUBJECT 839 + D2 TOP

SUBJECT 839 + D2 BOTTOM

SUBJECT 839 + D3 TOP
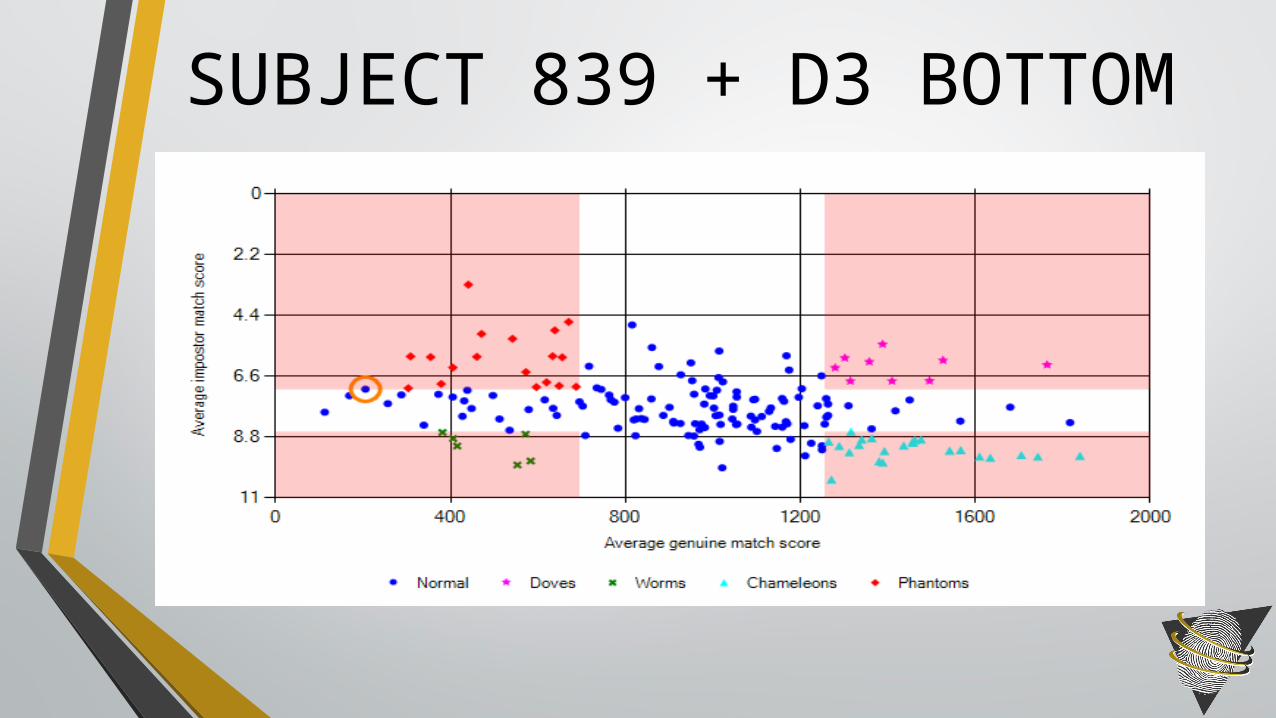
SUBJECT 839 + D3 BOTTOM

SUBJECT 839 + D2 + D3 TOP

SUBJECT 839 + D2 + D3 BOTTOM

•Low quality images tend to add subjects with low genuine scores and low imposter scores
•High quality images tend to add subjects with average to high genuine scores and low imposter scores
•Low quality additions also shifted the entire plot lower on the genuine axis
OBSERVATIONS

CONCLUSIONS

• Image quality does have some effect on the zoo characteristics of fingerprints
•Up to 10% of subjects changed zoo animals
•Even though the impostor scores have minimal change, subjects are still changing animal classifications
CONCLUSIONS

• Use larger and more variable populations such as top and bottom 25% together
• Are subjects stable when adding animal classifications from other datasets?
• Examine with fat plots instead of categorical analysis
• Can systems combine and still have the same results? – Interoperability of the zoo
FUTURE WORK

REFERENCES


