
Aswath Damodaran 1
Corporate Finance
Aswath Damodaran
Home Page: www.stern.nyu.edu/~adamodarwww.stern.nyu.edu/~adamodar/New_Home_Page/cfshdesc.html
E-Mail: [email protected]
Stern School of Business

Aswath Damodaran 2
First Principles
n Invest in projects that yield a return greater than the minimum acceptablehurdle rate.
• The hurdle rate should be higher for riskier projects and reflect the financing mixused - owners’ funds (equity) or borrowed money (debt)
• Returns on projects should be measured based on cash flows generated and thetiming of these cash flows; they should also consider both positive and negativeside effects of these projects.
n Choose a financing mix that minimizes the hurdle rate and matches the assetsbeing financed.
n If there are not enough investments that earn the hurdle rate, return the cash tostockholders.
• The form of returns - dividends and stock buybacks - will depend upon thestockholders’ characteristics.
Objective: Maximize the Value of the Firm

Aswath Damodaran 3
The Objective in Decision Making
n In traditional corporate finance, the objective in decision making is tomaximize the value of the firm.
n A narrower objective is to maximize stockholder wealth. When the stock istraded and markets are viewed to be efficient, the objective is to maximize thestock price.
n All other goals of the firm are intermediate ones leading to firm valuemaximization, or operate as constraints on firm value maximization.

Aswath Damodaran 4
The Classical Objective Function
STOCKHOLDERS
Maximizestockholderwealth
Hire & firemanagers- Board- Annual Meeting
BONDHOLDERSLend Money
ProtectbondholderInterests
FINANCIAL MARKETS
SOCIETYManagers
Revealinformationhonestly andon time
Markets areefficient andassess effect onvalue
No Social Costs
Costs can betraced to firm

Aswath Damodaran 5
What can go wrong?
STOCKHOLDERS
Managers puttheir interestsabove stockholders
Have little controlover managers
BONDHOLDERSLend Money
Bondholders canget ripped off
FINANCIAL MARKETS
SOCIETYManagers
Delay badnews or provide misleadinginformation
Markets makemistakes andcan over react
Significant Social Costs
Some costs cannot betraced to firm

Aswath Damodaran 6
When traditional corporate financial theory breaks down, thesolution is:
n To choose a different mechanism for corporate governance
n To choose a different objective:
n To maximize stock price, but reduce the potential for conflict and breakdown:• Making managers (decision makers) and employees into stockholders
• By providing information honestly and promptly to financial markets

Aswath Damodaran 7
An Alternative Corporate Governance System
n Germany and Japan developed a different mechanism for corporategovernance, based upon corporate cross holdings.
• In Germany, the banks form the core of this system.
• In Japan, it is the keiretsus
• Other Asian countries have modeled their system after Japan, with familycompanies forming the core of the new corporate families
n At their best, the most efficient firms in the group work at bringing the lessefficient firms up to par. They provide a corporate welfare system that makesfor a more stable corporate structure
n At their worst, the least efficient and poorly run firms in the group pull downthe most efficient and best run firms down. The nature of the cross holdingsmakes its very difficult for outsiders (including investors in these firms) tofigure out how well or badly the group is doing.

Aswath Damodaran 8
Choose a Different Objective Function
n Firms can always focus on a different objective function. Examples wouldinclude
• maximizing earnings
• maximizing revenues
• maximizing firm size
• maximizing market share
• maximizing EVA
n The key thing to remember is that these are intermediate objective functions.• To the degree that they are correlated with the long term health and value of the
company, they work well.
• To the degree that they do not, the firm can end up with a disaster

Aswath Damodaran 9
Maximize Stock Price, subject to ..
n The strength of the stock price maximization objective function is its internalself correction mechanism. Excesses on any of the linkages lead, ifunregulated, to counter actions which reduce or eliminate these excesses
n In the context of our discussion,• managers taking advantage of stockholders has lead to a much more active market
for corporate control.
• stockholders taking advantage of bondholders has lead to bondholders protectingthemselves at the time of the issue.
• firms revealing incorrect or delayed information to markets has lead to marketsbecoming more “skeptical” and “punitive”
• firms creating social costs has lead to more regulations, as well as investor andcustomer backlashes.

Aswath Damodaran 10
The Counter Reaction
STOCKHOLDERS
Managers of poorlyrun firms are puton notice.
1. More activistinvestors2. Hostile takeovers
BONDHOLDERS
Protect themselves
1. Covenants2. New Types
FINANCIAL MARKETS
SOCIETYManagers
Firms arepunishedfor misleadingmarkets
Investors andanalysts becomemore skeptical
Corporate Good Citizen Constraints
1. More laws2. Investor/Customer Backlash

Aswath Damodaran 11
6Application Test: Who owns/runs your firm?
n Looking at the top ten stockholders in your firm, consider the following:• Who is the marginal investor in this firm? (Is it an institutional investor or an
individual investor?)
• Are managers significant stockholders in the firm? If yes, are their interests likelyto diverge from those of other stockholders in the firm?

Aswath Damodaran 12
Picking the Right Projects: InvestmentAnalysis
Aswath Damodaran

Aswath Damodaran 13
First Principles
n Invest in projects that yield a return greater than the minimum acceptablehurdle rate.
• The hurdle rate should be higher for riskier projects and reflect the financingmix used - owners’ funds (equity) or borrowed money (debt)
• Returns on projects should be measured based on cash flows generated and thetiming of these cash flows; they should also consider both positive and negativeside effects of these projects.
n Choose a financing mix that minimizes the hurdle rate and matches the assetsbeing financed.
n If there are not enough investments that earn the hurdle rate, return the cash tostockholders.
• The form of returns - dividends and stock buybacks - will depend upon thestockholders’ characteristics.
Objective: Maximize the Value of the Firm

Aswath Damodaran 14
The notion of a benchmark
n Since financial resources are finite, there is a hurdle that projects have to crossbefore being deemed acceptable.
n This hurdle will be higher for riskier projects than for safer projects.
n A simple representation of the hurdle rate is as follows:
Hurdle rate = Riskless Rate + Risk Premium• Riskless rate is what you would make on a riskless investment
• Risk Premium is an increasing function of the riskiness of the project
n The two basic questions that every risk and return model in finance try toanswer are:
• How do you measure risk?
• How do you translate this risk measure into a risk premium?

Aswath Damodaran 15
What is Risk?
n Risk, in traditional terms, is viewed as a ‘negative’. Webster’s dictionary, forinstance, defines risk as “exposing to danger or hazard”. The Chinese symbolsfor risk, reproduced below, give a much better description of risk
n The first symbol is the symbol for “danger”, while the second is the symbolfor “opportunity”, making risk a mix of danger and opportunity.

Aswath Damodaran 16
Models of Risk and Return
The risk in an investment can be measured by the variance in actual returns around an expected return
E(R)
Riskless Investment Low Risk Investment High Risk Investment
E(R) E(R)
Risk that is specific to investment (Firm Specific) Risk that affects all investments (Market Risk)Can be diversified away in a diversified portfolio Cannot be diversified away since most assets1. each investment is a small proportion of portfolio are affected by it.2. risk averages out across investments in portfolioThe marginal investor is assumed to hold a “diversified” portfolio. Thus, only market risk will be rewarded and priced.
The CAPM The APM Multi-Factor Models Proxy ModelsIf there is 1. no private information2. no transactions costthe optimal diversified portfolio includes everytraded asset. Everyonewill hold this market portfolioMarket Risk = Risk added by any investment to the market portfolio:
If there are no arbitrage opportunities then the market risk ofany asset must be captured by betas relative to factors that affect all investments.Market Risk = Risk exposures of any asset to market factors
Beta of asset relative toMarket portfolio (froma regression)
Betas of asset relativeto unspecified marketfactors (from a factoranalysis)
Since market risk affectsmost or all investments,it must come from macro economic factors.Market Risk = Risk exposures of any asset to macro economic factors.
Betas of assets relativeto specified macroeconomic factors (froma regression)
In an efficient market,differences in returnsacross long periods mustbe due to market riskdifferences. Looking forvariables correlated withreturns should then give us proxies for this risk.Market Risk = Captured by the Proxy Variable(s)
Equation relating returns to proxy variables (from aregression)
Step 1: Defining Risk
Step 2: Differentiating between Rewarded and Unrewarded Risk
Step 3: Measuring Market Risk
Aswath Damodaran 17
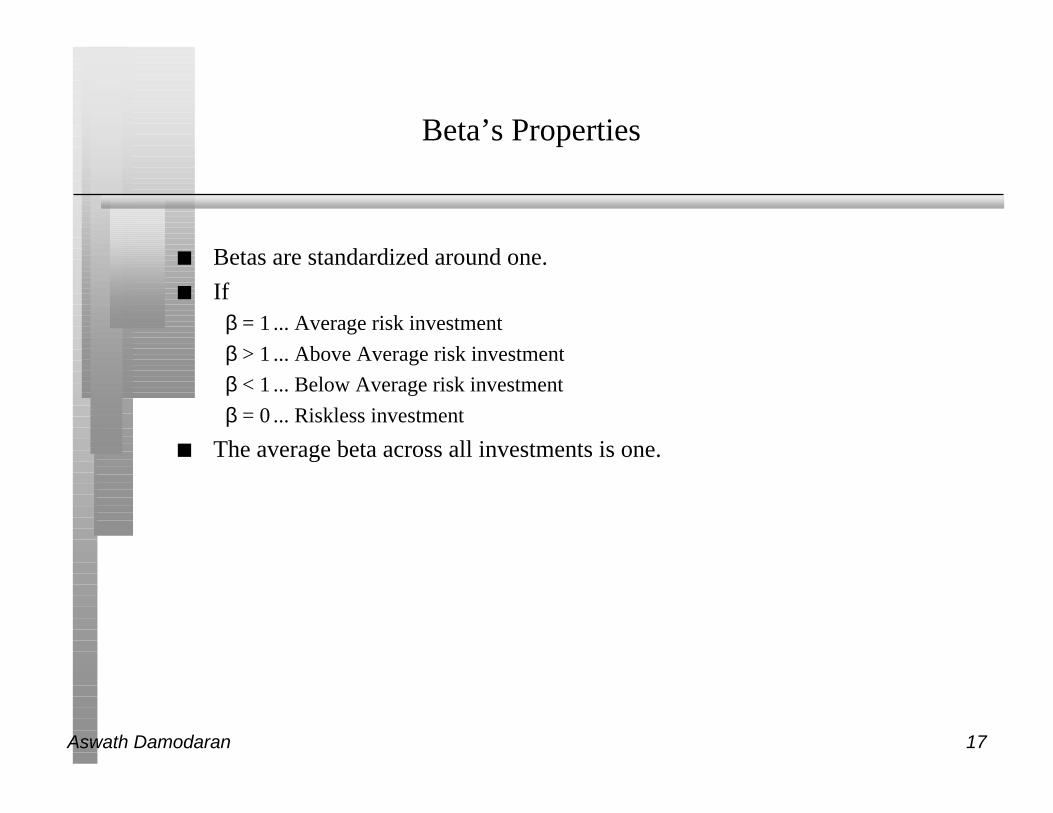
Beta’s Properties
n Betas are standardized around one.
n If β = 1 ... Average risk investment
β > 1 ... Above Average risk investment
β < 1 ... Below Average risk investment
β = 0 ... Riskless investment
n The average beta across all investments is one.

Aswath Damodaran 18
Limitations of the CAPM
1. The model makes unrealistic assumptions
2. The parameters of the model cannot be estimated precisely- Definition of a market index
- Firm may have changed during the 'estimation' period'
3. The model does not work well- If the model is right, there should be
a linear relationship between returns and betas
the only variable that should explain returns is betas
- The reality is that the relationship between betas and returns is weak
Other variables (size, price/book value) seem to explain differences in returns better.

Aswath Damodaran 19
Inputs required to use the CAPM -
(a) the current risk-free rate
(b) the expected return on the market index and
(c) the beta of the asset being analyzed.

Aswath Damodaran 20
The Riskfree Rate
n On a riskfree asset, the actual return is equal to the expected return.
n Therefore, there is no variance around the expected return.

Aswath Damodaran 21
Riskfree Rate and Time Horizon
n For an investment to be riskfree, i.e., to have an actual return be equal to theexpected return, two conditions have to be met –
• There has to be no default risk, which generally implies that the security has to beissued by the government. Note, however, that not all governments can be viewedas default free.
• There can be no uncertainty about reinvestment rates, which implies that it is a zerocoupon security with the same maturity as the cash flow being analyzed.

Aswath Damodaran 22
Riskfree Rate in Practice
n The riskfree rate is the rate on a zero coupon government bond matching thetime horizon of the cash flow being analyzed.
n Theoretically, this translates into using different riskfree rates for each cashflow - the 1 year zero coupon rate for the cash flow in year 1, the 2-year zerocoupon rate for the cash flow in year 2 ...
n Practically speaking, if there is substantial uncertainty about expected cashflows, the present value effect of using time varying riskfree rates is smallenough that it may not be worth it.

Aswath Damodaran 23
The Bottom Line on Riskfree Rates
n Using a long term government rate (even on a coupon bond) as the riskfreerate on all of the cash flows in a long term analysis will yield a closeapproximation of the true value.
n For short term analysis, it is entirely appropriate to use a short termgovernment security rate as the riskfree rate.
n If the analysis is being done in real terms (rather than nominal terms) use areal riskfree rate, which can be obtained in one of two ways –
• from an inflation-indexed government bond, if one exists
• set equal, approximately, to the long term real growth rate of the economy in whichthe valuation is being done.
Aswath Damodaran 24
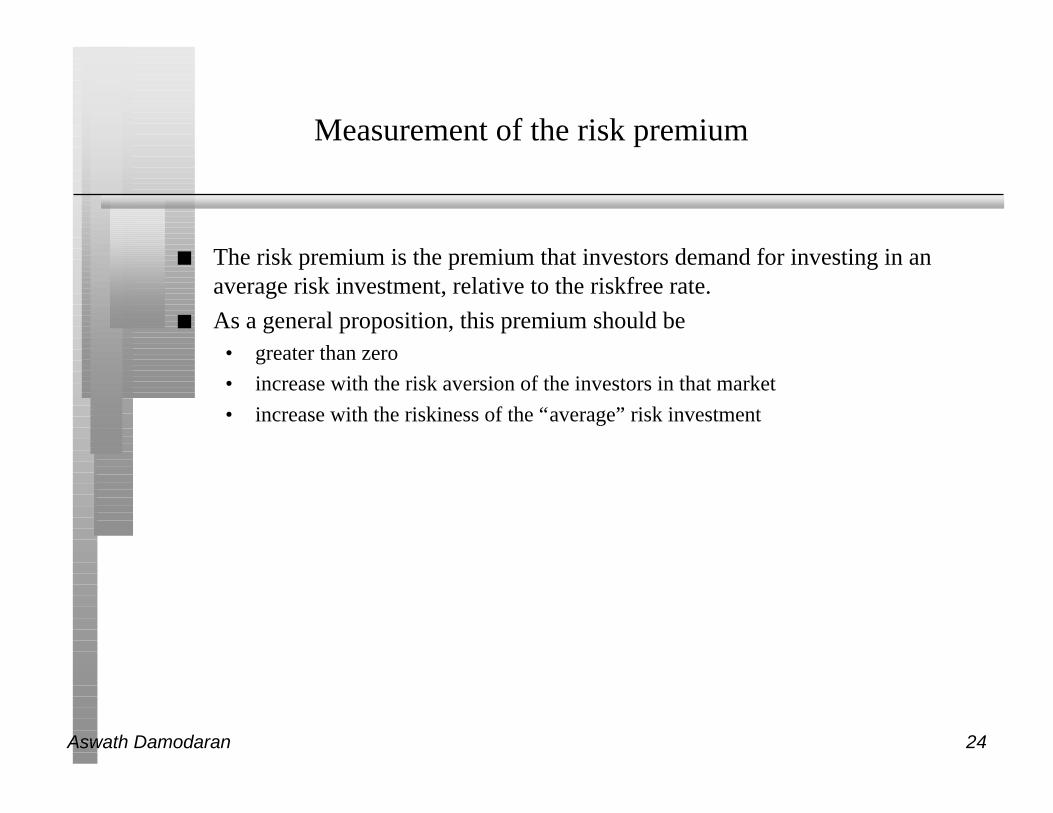
Measurement of the risk premium
n The risk premium is the premium that investors demand for investing in anaverage risk investment, relative to the riskfree rate.
n As a general proposition, this premium should be• greater than zero
• increase with the risk aversion of the investors in that market
• increase with the riskiness of the “average” risk investment

Aswath Damodaran 25
What is your risk premium?
n Assume that stocks are the only risky assets and that you are offered twoinvestment options:
• a riskless investment (say a Government Security), on which you can make 6.7%
• a mutual fund of all stocks, on which the returns are uncertain
How much of an expected return would you demand to shift your money from theriskless asset to the mutual fund?
o Less than 6.7%
o Between 6.7 - 8.7%
o Between 8.7 - 10.7%
o Between 10.7 - 12.7%
o Between 12.7 - 14.7%
o More than 14.7%

Aswath Damodaran 26
Risk Aversion and Risk Premiums
n If this were the capital market line, the risk premium would be a weightedaverage of the risk premiums demanded by each and every investor.
n The weights will be determined by the magnitude of wealth that each investorhas. Thus, Warren Bufffet’s risk aversion counts more towards determiningthe “equilibrium” premium than yours’ and mine.
n As investors become more risk averse, you would expect the “equilibrium”premium to increase.
Aswath Damodaran 27
Risk Premiums do change..
Go back to the previous example. Assume now that you are making the samechoice but that you are making it in the aftermath of a stock market crash (ithas dropped 25% in the last month). Would you change your answer?
o I would demand a larger premium
o I would demand a smaller premium
o I would demand the same premium

Aswath Damodaran 28
Estimating Risk Premiums in Practice
n Survey investors on their desired risk premiums and use the average premiumfrom these surveys.
n Assume that the actual premium delivered over long time periods is equal tothe expected premium - i.e., use historical data
n Estimate the implied premium in today’s asset prices.

Aswath Damodaran 29
The Survey Approach
n Surveying all investors in a market place is impractical.
n However, you can survey a few investors (especially the larger investors) anduse these results. In practice, this translates into surveys of money managers’expectations of expected returns on stocks over the next year.
n The limitations of this approach are:• there are no constraints on reasonability (the survey could produce negative risk
premiums or risk premiums of 50%)
• they are extremely volatile
• they tend to be short term; even the longest surveys do not go beyond one year

Aswath Damodaran 30
The Historical Premium Approach
n This is the default approach used by most to arrive at the premium to use inthe model
n In most cases, this approach does the following• it defines a time period for the estimation (1926-Present, 1962-Present....)
• it calculates average returns on a stock index during the period• it calculates average returns on a riskless security over the period
• it calculates the difference between the two• and uses it as a premium looking forward
n The limitations of this approach are:• it assumes that the risk aversion of investors has not changed in a systematic way
across time. (The risk aversion may change from year to year, but it reverts back tohistorical averages)
• it assumes that the riskiness of the “risky” portfolio (stock index) has not changedin a systematic way across time.

Aswath Damodaran 31
Historical Average Premiums for the United States
Historical period Stocks - T.Bills Stocks - T.Bonds
Arith Geom Arith Geom
1928-2000 8.41% 7.17% 6.53% 5.51%
1962-2000 6.41% 5.25% 5.30% 4.52%
1990-2000 11.42% 7.64% 12.67% 7.09%
What is the right premium?
n Go back as far as you can. Otherwise, the standard error in the estimate will belarge.
n Be consistent in your use of a riskfree rate.
n Use arithmetic premiums for one-year estimates of costs of equity andgeometric premiums for estimates of long term costs of equity.

Aswath Damodaran 32
What about historical premiums for other markets?
n Historical data for markets outside the United States tends to be sketchy andunreliable.
n The historical premiums tend to be unreliable estimates of the expectedpremiums.

Aswath Damodaran 33
Assessing Country Risk Using Country Ratings: LatinAmerica: April 2000
Country Rating Typical Spread Market SpreadArgentina B1 450 433Bolivia B1 450 469Brazil B2 550 483Colombia Ba2 300 291Ecuador Caa2 750 727Guatemala Ba2 300 331Honduras B2 550 537Mexico Baa3 145 152Paraguay B2 550 581Peru Ba3 400 426Uruguay Baa3 145 174Venezuela B2 550 571
Aswath Damodaran 34
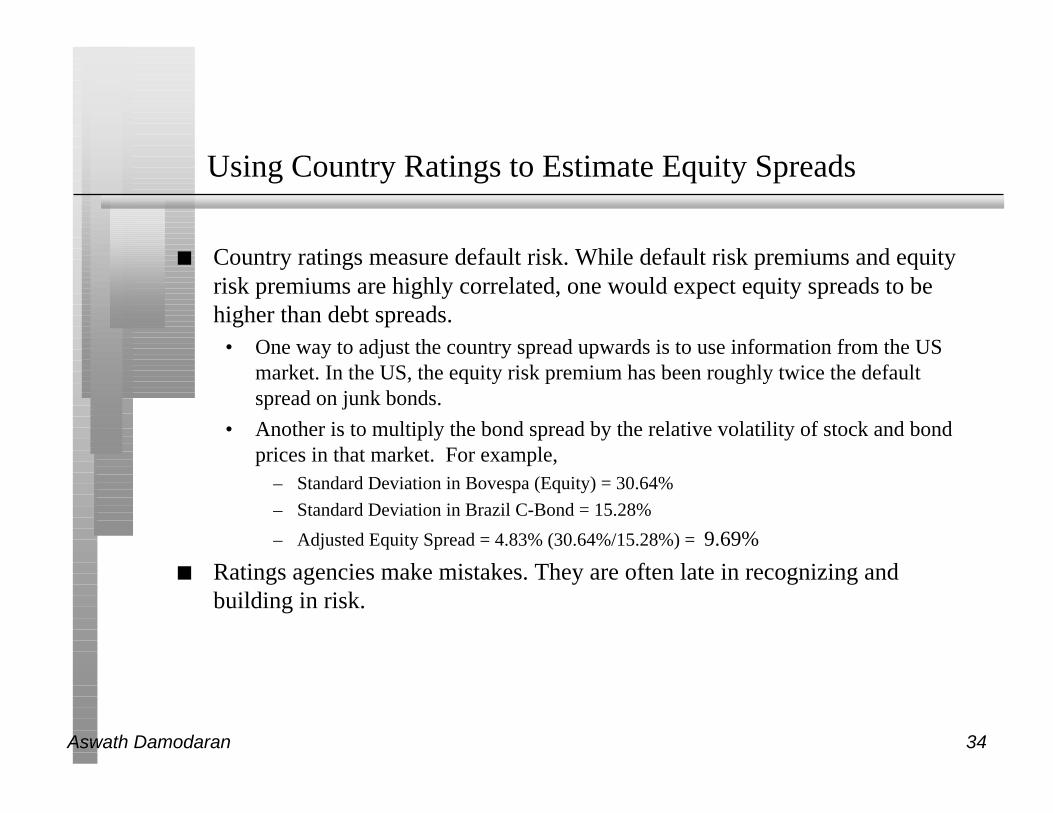
Using Country Ratings to Estimate Equity Spreads
n Country ratings measure default risk. While default risk premiums and equityrisk premiums are highly correlated, one would expect equity spreads to behigher than debt spreads.
• One way to adjust the country spread upwards is to use information from the USmarket. In the US, the equity risk premium has been roughly twice the defaultspread on junk bonds.
• Another is to multiply the bond spread by the relative volatility of stock and bondprices in that market. For example,
– Standard Deviation in Bovespa (Equity) = 30.64%
– Standard Deviation in Brazil C-Bond = 15.28%
– Adjusted Equity Spread = 4.83% (30.64%/15.28%) = 9.69%
n Ratings agencies make mistakes. They are often late in recognizing andbuilding in risk.

Aswath Damodaran 35
Implied Equity Premiums
n If we use a basic discounted cash flow model, we can estimate the implied riskpremium from the current level of stock prices.
n For instance, if stock prices are determined by the simple Gordon GrowthModel:
• Value = Expected Dividends next year/ (Required Returns on Stocks - ExpectedGrowth Rate)
• Plugging in the current level of the index, the dividends on the index and expectedgrowth rate will yield a “implied” expected return on stocks. Subtracting out theriskfree rate will yield the implied premium.
n The problems with this approach are:• the discounted cash flow model used to value the stock index has to be the right
one.
• the inputs on dividends and expected growth have to be correct
• it implicitly assumes that the market is currently correctly valued

Aswath Damodaran 36
Implied Premiums in the US
Implied Premium for US Equity Market
0.00%
1.00%
2.00%
3.00%
4.00%
5.00%
6.00%
7.00%
1960
1962
1964
1966
1968
1970
1972
1974
1976
1978
1980
1982
1984
1986
1988
1990
1992
1994
1996
1998
2000
Year
Implied P
rem
ium

Aswath Damodaran 37
6 Application Test: A Market Risk Premium
n Based upon our discussion of historical risk premiums so far, the risk premiumlooking forward should be:
o About 10%, which is what the arithmetic average premium has been since1981, for stocks over T.Bills
o About 5.5%, which is the geometric average premum since 1926, for stocksover T.Bonds
o About 3.5%, which is the implied premium in the stock market today

Aswath Damodaran 38
Estimating Beta
n The standard procedure for estimating betas is to regress stock returns (Rj)against market returns (Rm) -
Rj = a + b Rm
• where a is the intercept and b is the slope of the regression.
n The slope of the regression corresponds to the beta of the stock, and measuresthe riskiness of the stock.
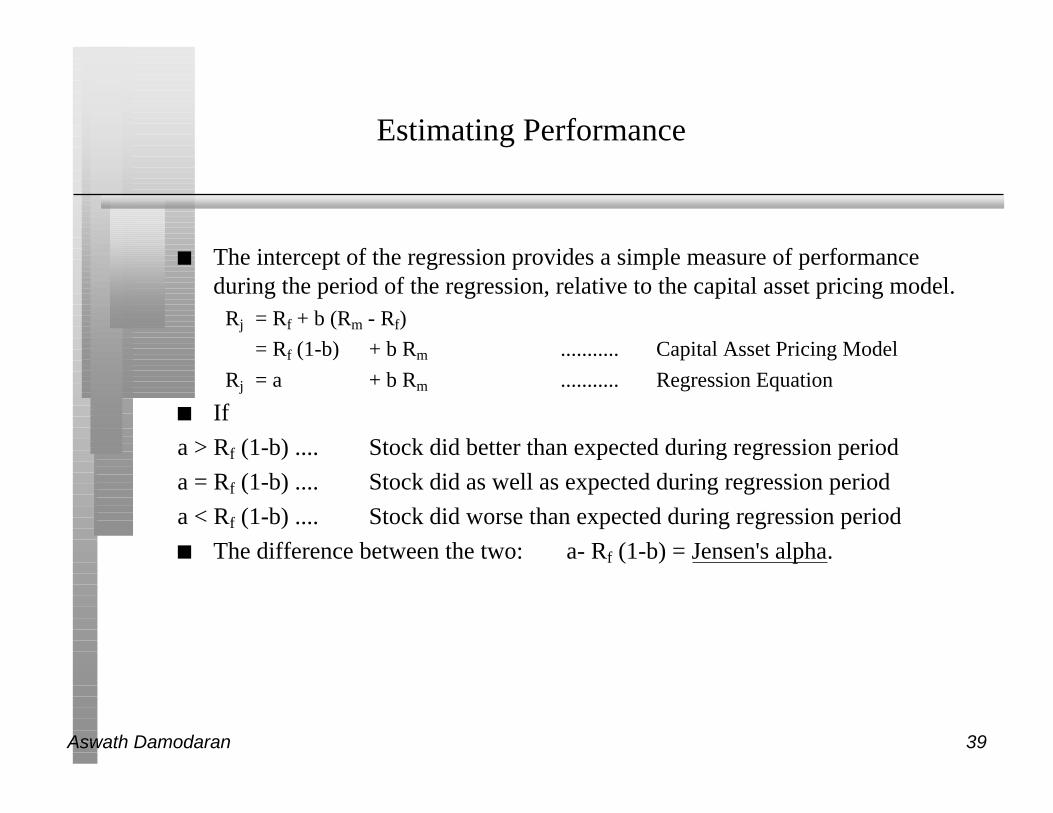
Aswath Damodaran 39
Estimating Performance
n The intercept of the regression provides a simple measure of performanceduring the period of the regression, relative to the capital asset pricing model.
Rj = Rf + b (Rm - Rf)
= Rf (1-b) + b Rm ........... Capital Asset Pricing Model
Rj = a + b Rm ........... Regression Equation
n If
a > Rf (1-b) .... Stock did better than expected during regression period
a = Rf (1-b) .... Stock did as well as expected during regression period
a < Rf (1-b) .... Stock did worse than expected during regression period
n The difference between the two: a- Rf (1-b) = Jensen's alpha.

Aswath Damodaran 40
Firm Specific and Market Risk
n The R squared (R2) of the regression provides an estimate of the proportion ofthe risk (variance) of a firm that can be attributed to market risk;
n The balance (1 - R2) can be attributed to firm specific risk.

Aswath Damodaran 41
Setting up for the Estimation
n Decide on an estimation period• Services use periods ranging from 2 to 5 years for the regression
• Longer estimation period provides more data, but firms change.
• Shorter periods can be affected more easily by significant firm-specific event thatoccurred during the period (Example: ITT for 1995-1997)
n Decide on a return interval - daily, weekly, monthly• Shorter intervals yield more observations, but suffer from more noise.
• Noise is created by stocks not trading and biases all betas towards one.
n Estimate returns (including dividends) on stock• Return = (PriceEnd - PriceBeginning + DividendsPeriod)/ PriceBeginning
• Included dividends only in ex-dividend month
n Choose a market index, and estimate returns (inclusive of dividends) on theindex for each interval for the period.

Aswath Damodaran 42
Choosing the Parameters: Disney
n Period used: 5 years
n Return Interval = Monthly
n Market Index: S&P 500 Index.
n For instance, to calculate returns on Disney in April 1992,• Price for Disney at end of March = $ 37.87
• Price for Disney at end of April = $ 36.42
• Dividends during month = $0.05 (It was an ex-dividend month)
• Return =($36.42 - $ 37.87 + $ 0.05)/$ 37.87=-3.69%
n To estimate returns on the index in the same month• Index level (including dividends) at end of March =
• Index level (including dividends) at end of April =
• Return =(415.53 - 404.35)/ 404.35 = 2.76%

Aswath Damodaran 43
Disney’s Historical Beta
Disney versus S & P 500: January 1992 - 1996
-15.00%
-10.00%
-5.00%
0.00%
5.00%
10.00%
15.00%
-6.00% -4.00% -2.00% 0.00% 2.00% 4.00% 6.00% 8.00%
S & P 500
Dis
ney

Aswath Damodaran 44
The Regression Output
n ReturnsDisney = -0.01% + 1.40 ReturnsS & P 500 (R squared=32.41%)
(0.27)
n Intercept = -0.01%
n Slope = 1.40

Aswath Damodaran 45
Analyzing Disney’s Performance
n Intercept = -0.01%
n This is an intercept based on monthly returns. Thus, it has to be compared to amonthly riskfree rate.
n Between 1992 and 1996,• Monthly Riskfree Rate = 0.4% (Annual T.Bill rate divided by 12)
• Riskfree Rate (1-Beta) = 0.4% (1-1.40) = -.16%
n The Comparison is then betweenIntercept versus Riskfree Rate (1 - Beta)
-0.01% versus 0.4%(1-1.40)=-0.16%
n Jensen’s Alpha = -0.01% -(-0.16%) = 0.15%
n Disney did 0.15% better than expected, per month, between 1992 and 1996.
n Annualized, Disney’s annual excess return = (1.0015)^12-1= 1.81%

Aswath Damodaran 46
More on Jensen’s Alpha
If you did this analysis on every stock listed on an exchange, what would theaverage Jensen’s alpha be across all stocks?
o Depend upon whether the market went up or down during the period
o Should be zero
o Should be greater than zero, because stocks tend to go up more often thandown

Aswath Damodaran 47
Estimating Disney’s Beta
n Slope of the Regression of 1.40 is the beta
n Regression parameters are always estimated with noise. The noise is capturedin the standard error of the beta estimate, which in the case of Disney is 0.27.
n Assume that I asked you what Disney’s true beta is, after this regression.• What is your best point estimate?
• What range would you give me, with 67% confidence?
• What range would you give me, with 95% confidence?

Aswath Damodaran 48
The Dirty Secret of “Standard Error”
Distribution of Standard Errors: Beta Estimates for U.S. stocks
0
200
400
600
800
1000
1200
1400
1600
<.10 .10 - .20 .20 - .30 .30 - .40 .40 -.50 .50 - .75 > .75
Standard Error in Beta Estimate
Num
ber
of
Firm
s

Aswath Damodaran 49
Breaking down Disney’s Risk
n R Squared = 32%
n This implies that• 32% of the risk at Disney comes from market sources
• 68%, therefore, comes from firm-specific sources
n The firm-specific risk is diversifiable and will not be rewarded

Aswath Damodaran 50
The Relevance of R Squared
You are a diversified investor trying to decide whether you should invest inDisney or Amgen. They both have betas of 1.35, but Disney has an R Squaredof 32% while Amgen’s R squared of only 15%. Which one would you investin:
o Amgen, because it has the lower R squared
o Disney, because it has the higher R squared
o You would be indifferent
Would your answer be different if you were an undiversified investor?

Aswath Damodaran 51
Beta Estimation in Practice: Bloomberg

Aswath Damodaran 52
Estimating Expected Returns: September 30, 1997
n Disney’s Beta = 1.40
n Riskfree Rate = 7.00% (Long term Government Bond rate)
n Risk Premium = 5.50% (Approximate historical premium)
n Expected Return = 7.00% + 1.40 (5.50%) = 14.70%

Aswath Damodaran 53
Use to a Potential Investor in Disney
As a potential investor in Disney, what does this expected return of 14.70% tellyou?
o This is the return that I can expect to make in the long term on Disney, if thestock is correctly priced and the CAPM is the right model for risk,
o This is the return that I need to make on Disney in the long term to break evenon my investment in the stock
o Both
Assume now that you are an active investor and that your research suggests thatan investment in Disney will yield 25% a year for the next 5 years. Basedupon the expected return of 14.70%, you would
o Buy the stock
o Sell the stock

Aswath Damodaran 54
How managers use this expected return
n Managers at Disney• need to make at least 14.70% as a return for their equity investors to break even.
• this is the hurdle rate for projects, when the investment is analyzed from an equitystandpoint
n In other words, Disney’s cost of equity is 14.70%.
n What is the cost of not delivering this cost of equity?
Aswath Damodaran 55
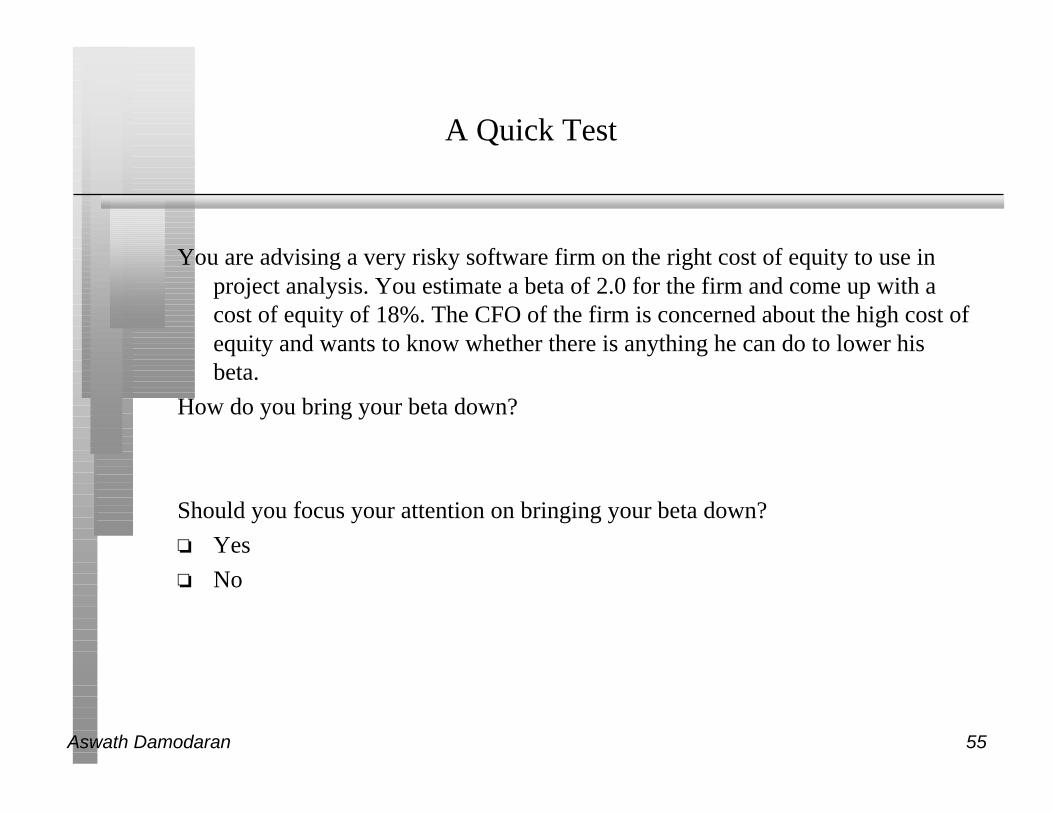
A Quick Test
You are advising a very risky software firm on the right cost of equity to use inproject analysis. You estimate a beta of 2.0 for the firm and come up with acost of equity of 18%. The CFO of the firm is concerned about the high cost ofequity and wants to know whether there is anything he can do to lower hisbeta.
How do you bring your beta down?
Should you focus your attention on bringing your beta down?
o Yes
o No

Aswath Damodaran 56
6 Application Test: Analyzing the Risk Regression
n Using your Bloomberg risk and return print out, answer the followingquestions:
• How well or badly did your stock do, relative to the market, during the period ofthe regression? (You can assume an annualized riskfree rate of 4.8% during theregression period)
Intercept - 0.4% (1- Beta) = Jensen’s Alpha
• What proportion of the risk in your stock is attributable to the market? Whatproportion is firm-specific?
• What is the historical estimate of beta for your stock? What is the range on thisestimate with 67% probability? With 95% probability?
• Based upon this beta, what is your estimate of the required return on this stock?
Riskless Rate + Beta * Risk Premium

Aswath Damodaran 57
Beta Differences: A First Look Behind Betas
Beta = 1
Average Stock
Beta > 1
Beta < 1
Above-average Risk
Below-average Risk
Government bonds: Beta = 0
Exxon: Beta=0.65: Oil price Risk may not be market risk
General Electric: Beta = 1.15: Multiple Business Lines
Low Risk
High Risk
Microsoft: Beta = 0.95: Size has its advantages
America Online: Beta = 2.10: Operates in Risky Business
BETA AS A MEASURE OF RISK
Time Warner: Beta = 1.45: High leverage is the reason
Philip Morris: Beta = 1.05: Risk from Lawsuits ????
Oracle: Beta = 0.45: Betas are just estimates

Aswath Damodaran 58
Determinant 1: Product Type
n Industry Effects: The beta value for a firm depends upon the sensitivity of thedemand for its products and services and of its costs to macroeconomic factorsthat affect the overall market.
• Cyclical companies have higher betas than non-cyclical firms
• Firms which sell more discretionary products will have higher betas than firms thatsell less discretionary products

Aswath Damodaran 59
Determinant 2: Operating Leverage Effects
n Operating leverage refers to the proportion of the total costs of the firm thatare fixed.
n Other things remaining equal, higher operating leverage results in greaterearnings variability which in turn results in higher betas.
Aswath Damodaran 60
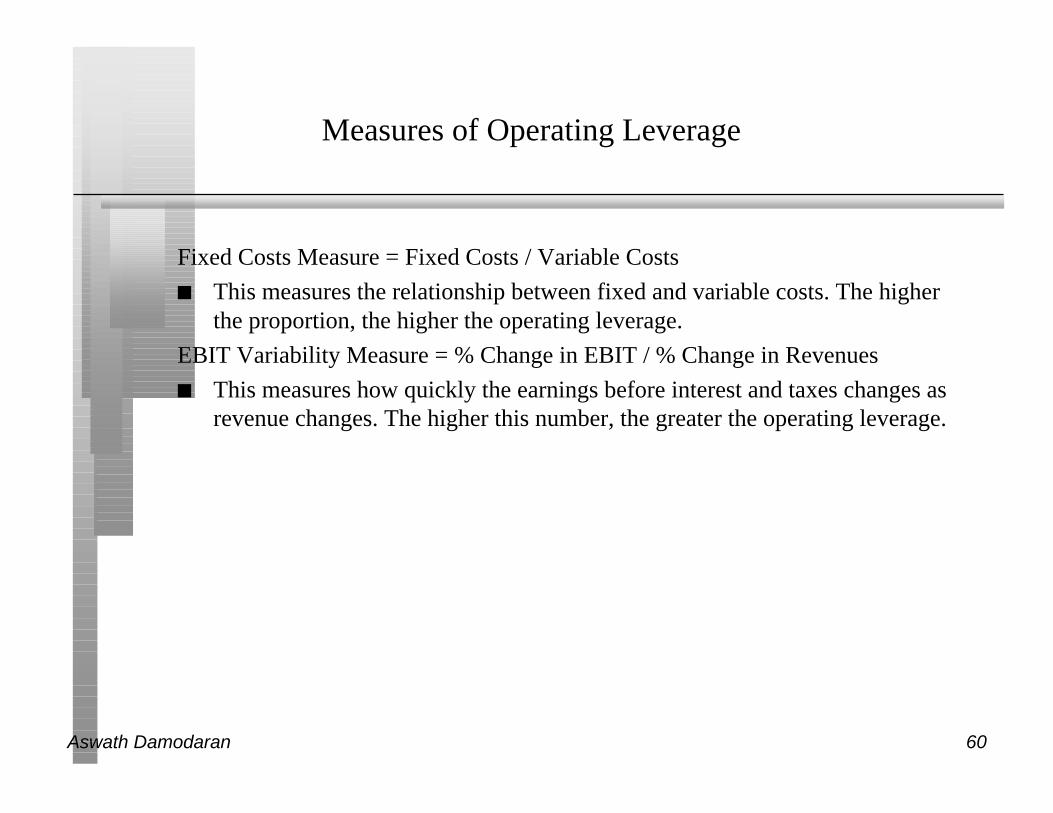
Measures of Operating Leverage
Fixed Costs Measure = Fixed Costs / Variable Costs
n This measures the relationship between fixed and variable costs. The higherthe proportion, the higher the operating leverage.
EBIT Variability Measure = % Change in EBIT / % Change in Revenues
n This measures how quickly the earnings before interest and taxes changes asrevenue changes. The higher this number, the greater the operating leverage.

Aswath Damodaran 61
A Look at Disney’s Operating Leverage
Year Net Sales % Change
in Sales
EBIT % Change
in EBIT
1987 2877 756
1988 3438 19.50% 848 12.17%
1989 4594 33.62% 1177 38.80%
1990 5844 27.21% 1368 16.23%
1991 6182 5.78% 1124 -17.84%
1992 7504 21.38% 1429 27.14%
1993 8529 13.66% 1232 -13.79%
1994 10055 17.89% 1933 56.90%
1995 12112 20.46% 2295 18.73%
1996 18739 54.71% 2540 10.68%
Average 23.80% 16.56%
Aswath Damodaran 62
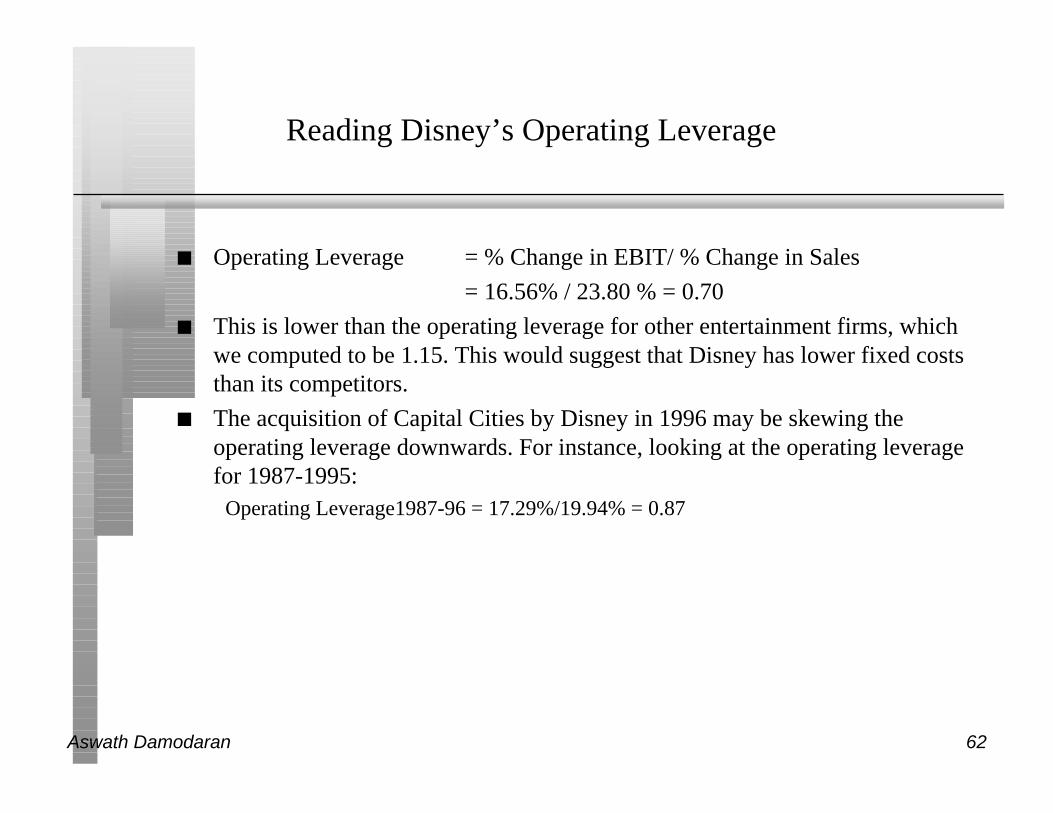
Reading Disney’s Operating Leverage
n Operating Leverage = % Change in EBIT/ % Change in Sales
= 16.56% / 23.80 % = 0.70
n This is lower than the operating leverage for other entertainment firms, whichwe computed to be 1.15. This would suggest that Disney has lower fixed coststhan its competitors.
n The acquisition of Capital Cities by Disney in 1996 may be skewing theoperating leverage downwards. For instance, looking at the operating leveragefor 1987-1995:
Operating Leverage1987-96 = 17.29%/19.94% = 0.87

Aswath Damodaran 63
A Test
Assume that you are comparing a European automobile manufacturing firm with aU.S. automobile firm. European firms are generally much more constrained interms of laying off employees, if they get into financial trouble. Whatimplications does this have for betas, if they are estimated relative to acommon index?
p European firms will have much higher betas than U.S. firms
p European firms will have similar betas to U.S. firms
p European firms will have much lower betas than U.S. firms

Aswath Damodaran 64
Determinant 3: Financial Leverage
n As firms borrow, they create fixed costs (interest payments) that make theirearnings to equity investors more volatile.
n This increased earnings volatility which increases the equity beta

Aswath Damodaran 65
Equity Betas and Leverage
n The beta of equity alone can be written as a function of the unlevered beta andthe debt-equity ratio
βL = βu (1+ ((1-t)D/E)
whereβL = Levered or Equity Beta
βu = Unlevered Beta
t = Corporate marginal tax rate
D = Market Value of Debt
E = Market Value of Equity

Aswath Damodaran 66
Effects of leverage on betas: Disney
n The regression beta for Disney is 1.40. This beta is a levered beta (because itis based on stock prices, which reflect leverage) and the leverage implicit inthe beta estimate is the average market debt equity ratio during the period ofthe regression (1992 to 1996)
n The average debt equity ratio during this period was 14%.
n The unlevered beta for Disney can then be estimated:(using a marginal tax rateof 36%)
= Current Beta / (1 + (1 - tax rate) (Average Debt/Equity))
= 1.40 / ( 1 + (1 - 0.36) (0.14)) = 1.28

Aswath Damodaran 67
Disney : Beta and Leverage
Debt to Capital Debt/Equity Ratio Beta Effect of Leverage
0.00% 0.00% 1.28 0.00
10.00% 11.11% 1.38 0.09
20.00% 25.00% 1.49 0.21
30.00% 42.86% 1.64 0.35
40.00% 66.67% 1.83 0.55
50.00% 100.00% 2.11 0.82
60.00% 150.00% 2.52 1.23
70.00% 233.33% 3.20 1.92
80.00% 400.00% 4.57 3.29
90.00% 900.00% 8.69 7.40
n Riskfree Rate = 7.00% Risk Premium = 5.50%

Aswath Damodaran 68
Betas are weighted Averages
n The beta of a portfolio is always the market-value weighted average of thebetas of the individual investments in that portfolio.
n Thus,• the beta of a mutual fund is the weighted average of the betas of the stocks and
other investment in that portfolio
• the beta of a firm after a merger is the market-value weighted average of the betasof the companies involved in the merger.
• The beta of a firm is the weighted average of the betas of the different businesses itoperates in
Aswath Damodaran 69
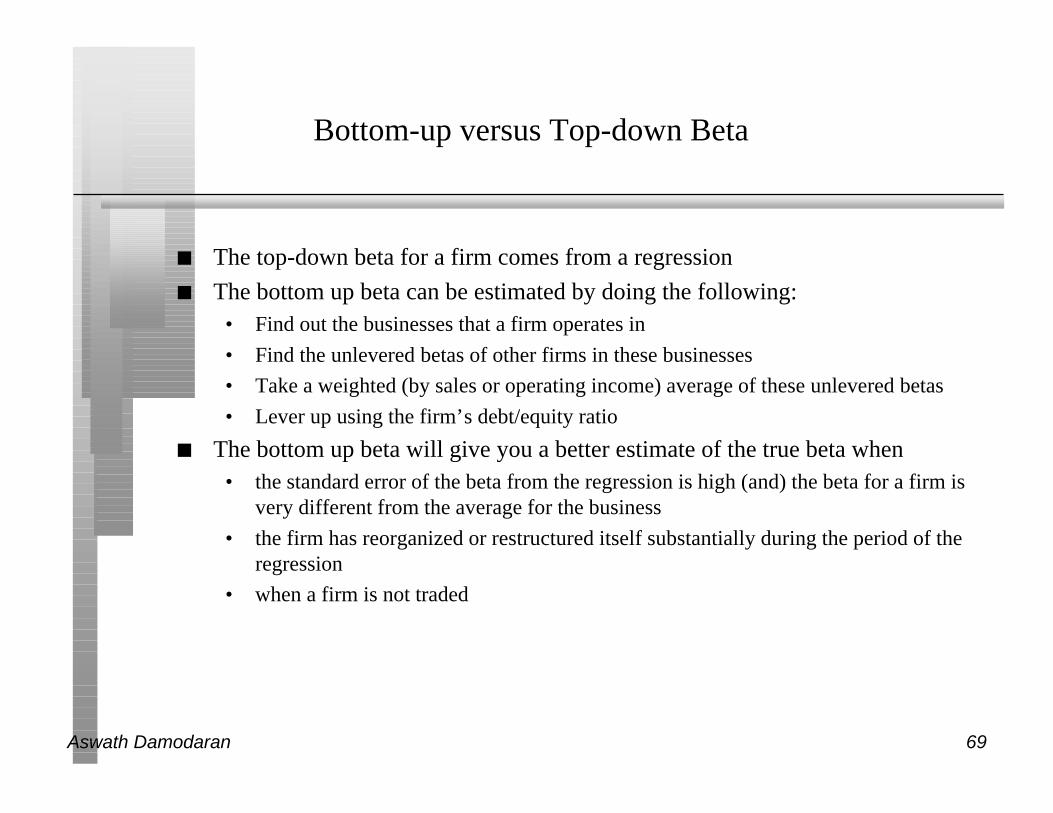
Bottom-up versus Top-down Beta
n The top-down beta for a firm comes from a regression
n The bottom up beta can be estimated by doing the following:• Find out the businesses that a firm operates in
• Find the unlevered betas of other firms in these businesses
• Take a weighted (by sales or operating income) average of these unlevered betas
• Lever up using the firm’s debt/equity ratio
n The bottom up beta will give you a better estimate of the true beta when• the standard error of the beta from the regression is high (and) the beta for a firm is
very different from the average for the business
• the firm has reorganized or restructured itself substantially during the period of theregression
• when a firm is not traded

Aswath Damodaran 70
Decomposing Disney’s Beta
Business Unlevered D/E Ratio Levered Riskfree Risk Cost of Equity
Beta Beta Rate Premium
Creative Content 1.25 20.92% 1.42 7.00% 5.50% 14.80%
Retailing 1.50 20.92% 1.70 7.00% 5.50% 16.35%
Broadcasting 0.90 20.92% 1.02 7.00% 5.50% 12.61%
Theme Parks 1.10 20.92% 1.26 7.00% 5.50% 13.91%
Real Estate 0.70 59.27% 0.92 7.00% 5.50% 12.31%
Disney 1.09 21.97% 1.25 7.00% 5.50% 13.85%
Business Estimated ValueComparable Firms Unlevered BetaDivision WeightCreative Content 22,167$ Motion Picture and TV program producers 1.25 35.71%Retailing 2,217$ High End Specialty Retailers 1.5 3.57%Broadcasting 18,842$ TV Broadcasting companies 0.9 30.36%Theme Parks 16,625$ Theme Park and Entertainment Complexes 1.1 26.79%Real Estate 2,217$ REITs specializing in hotel and vacation propertiers 0.7 3.57%Firm 62,068$ 100.00%
Aswath Damodaran 71
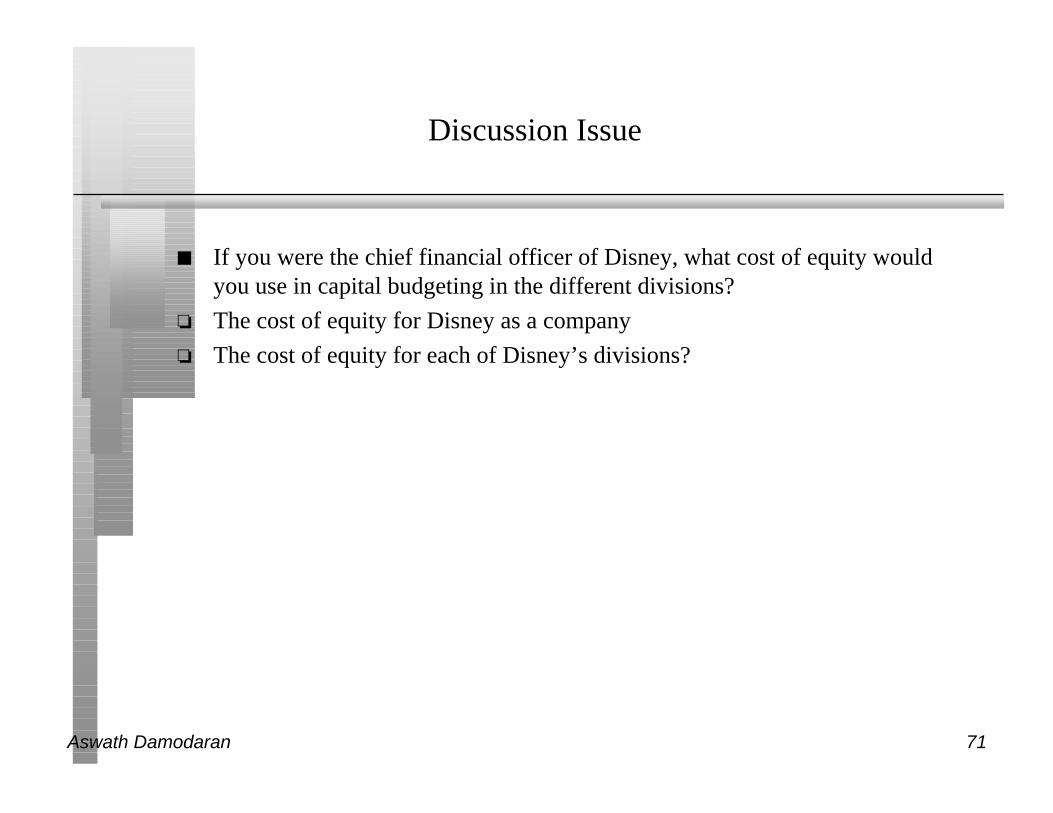
Discussion Issue
n If you were the chief financial officer of Disney, what cost of equity wouldyou use in capital budgeting in the different divisions?
o The cost of equity for Disney as a company
o The cost of equity for each of Disney’s divisions?

Aswath Damodaran 72
Estimating Betas for Non-Traded Assets
n The conventional approaches of estimating betas from regressions do not workfor assets that are not traded.
n The beta for a non-traded asset can be estimated by looking at publicly tradedfirms that are in similar businesses.

Aswath Damodaran 73
Using comparable firms to estimate betas
Assume that you are trying to estimate the beta for a independent bookstore inNew York City.
Company Name Beta D/E Ratio Market Cap $ (Mil )
Barnes & Noble 1.10 23.31% $ 1,416
Books-A-Million 1.30 44.35% $ 85
Borders Group 1.20 2.15% $ 1,706
Crown Books 0.80 3.03% $ 55
Average 1.10 18.21% $ 816
n Unlevered Beta of comparable firms 1.10/(1 + (1-.36) (.1821)) = 0.99
n If independent bookstore has similar leverage, beta = 1.10
n If independent bookstore decides to use a debt/equity ratio of 25%:
Beta for bookstore = 0.99 (1+(1-..42)(.25)) = 1.13 (Tax rate used=42%)

Aswath Damodaran 74
Is Beta an Adequate Measure of Risk for a Private Firm?
n The owners of most private firms are not diversified. Beta measures the riskadded on to a diversified portfolio. Therefore, using beta to arrive at a cost ofequity for a private firm will
o Under estimate the cost of equity for the private firm
o Over estimate the cost of equity for the private firm
o Could under or over estimate the cost of equity for the private firm

Aswath Damodaran 75
Total Risk versus Market Risk
n Adjust the beta to reflect total risk rather than market risk. This adjustment is arelatively simple one, since the R squared of the regression measures theproportion of the risk that is market risk.
Total Beta = Market Beta / Correlation with the market index
n In the Bookscapes example, where the market beta is 1.10 and the averagecorrelation with the market index of the comparable publicly traded firms is33%,
• Total Beta = 1.10/0.33 = 3.30
• Total Cost of Equity = 7% + 3.30 (5.5%)= 25.05%

Aswath Damodaran 76
6 Application Test: Estimating a Bottom-up Beta
n Based upon the business or businesses that your firm is in right now, and itscurrent financial leverage, estimate the bottom-up unlevered beta for yourfirm.

Aswath Damodaran 77
From Cost of Equity to Cost of Capital
n The cost of capital is a composite cost to the firm of raising financing to fundits projects.
n In addition to equity, firms can raise capital from debt

Aswath Damodaran 78
What is debt?
n General Rule: Debt generally has the following characteristics:• Commitment to make fixed payments in the future
• The fixed payments are tax deductible
• Failure to make the payments can lead to either default or loss of control of thefirm to the party to whom payments are due.

Aswath Damodaran 79
What would you include in debt?
n Any interest-bearing liability, whether short term or long term.
n Any lease obligation, whether operating or capital.

Aswath Damodaran 80
Estimating the Cost of Debt
n If the firm has bonds outstanding, and the bonds are traded, the yield tomaturity on a long-term, straight (no special features) bond can be used as theinterest rate.
n If the firm is rated, use the rating and a typical default spread on bonds withthat rating to estimate the cost of debt.
n If the firm is not rated,• and it has recently borrowed long term from a bank, use the interest rate on the
borrowing or
• estimate a synthetic rating for the company, and use the synthetic rating to arrive ata default spread and a cost of debt
n The cost of debt has to be estimated in the same currency as the cost of equityand the cash flows in the valuation.
Aswath Damodaran 81
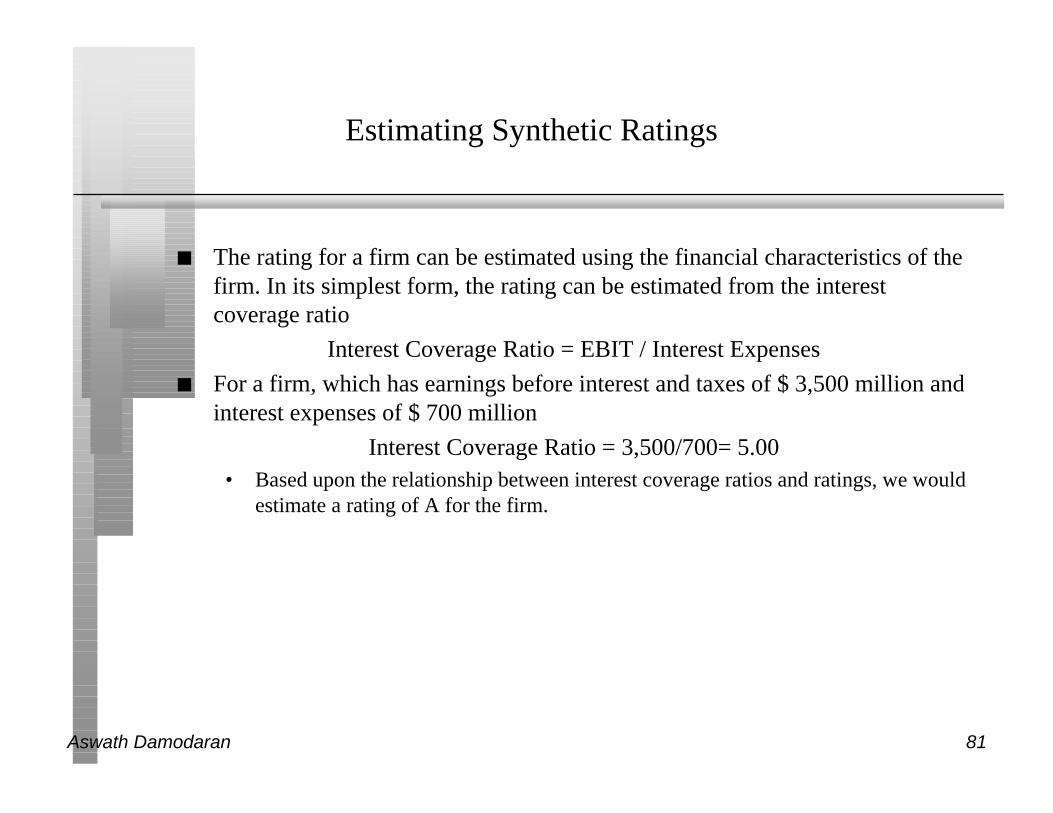
Estimating Synthetic Ratings
n The rating for a firm can be estimated using the financial characteristics of thefirm. In its simplest form, the rating can be estimated from the interestcoverage ratio
Interest Coverage Ratio = EBIT / Interest Expenses
n For a firm, which has earnings before interest and taxes of $ 3,500 million andinterest expenses of $ 700 million
Interest Coverage Ratio = 3,500/700= 5.00• Based upon the relationship between interest coverage ratios and ratings, we would
estimate a rating of A for the firm.
Aswath Damodaran 82
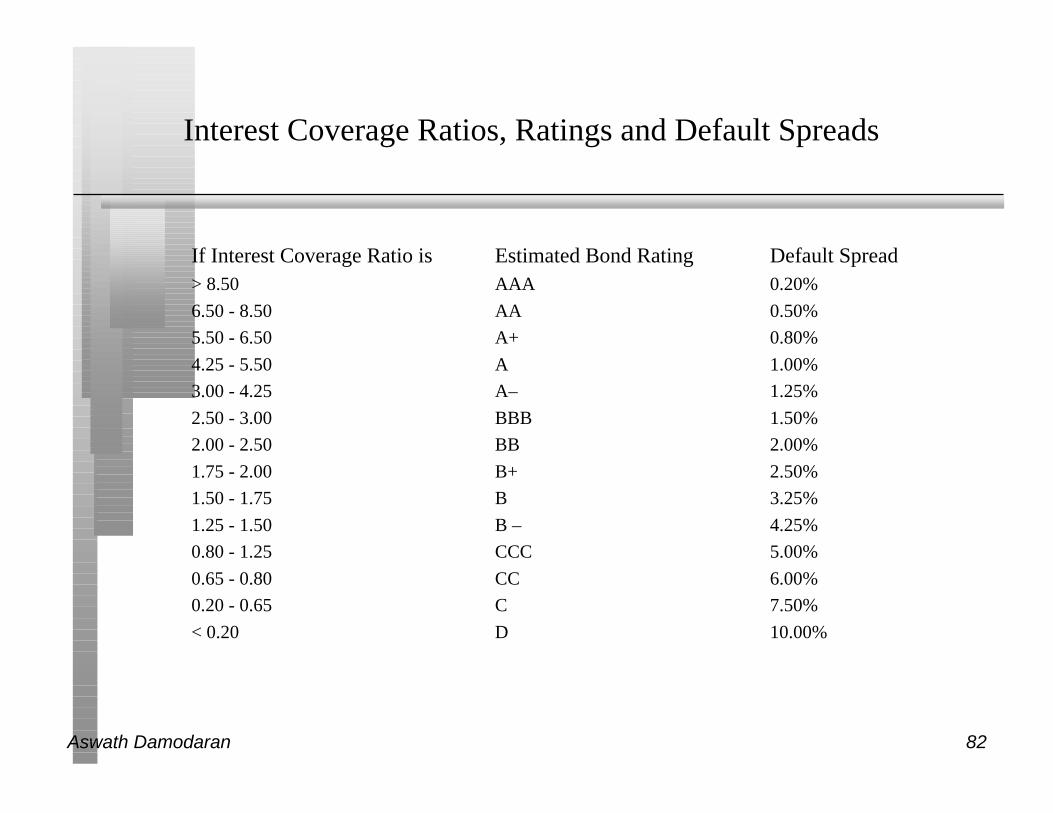
Interest Coverage Ratios, Ratings and Default Spreads
If Interest Coverage Ratio is Estimated Bond Rating Default Spread> 8.50 AAA 0.20%
6.50 - 8.50 AA 0.50%
5.50 - 6.50 A+ 0.80%
4.25 - 5.50 A 1.00%
3.00 - 4.25 A– 1.25%
2.50 - 3.00 BBB 1.50%
2.00 - 2.50 BB 2.00%
1.75 - 2.00 B+ 2.50%
1.50 - 1.75 B 3.25%
1.25 - 1.50 B – 4.25%
0.80 - 1.25 CCC 5.00%
0.65 - 0.80 CC 6.00%
0.20 - 0.65 C 7.50%
< 0.20 D 10.00%

Aswath Damodaran 83
6 Application Test: Estimating a Cost of Debt
n Based upon your firm’s current earnings before interest and taxes, its interestexpenses, estimate
• An interest coverage ratio for your firm
• A synthetic rating for your firm (use the table from previous page)
• A pre-tax cost of debt for your firm
• An after-tax cost of debt for your firm
Pre-tax cost of debt (1- tax rate)

Aswath Damodaran 84
Estimating Market Value Weights
n Market Value of Equity should include the following• Market Value of Shares outstanding
• Market Value of Warrants outstanding
• Market Value of Conversion Option in Convertible Bonds
n Market Value of Debt is more difficult to estimate because few firms haveonly publicly traded debt. There are two solutions:
• Assume book value of debt is equal to market value
• Estimate the market value of debt from the book value
• For Disney, with book value of $12,342 million, interest expenses of $479 million,an average maturity of 3 years and a current cost of borrowing of 7.5% (from itsrating)
Estimated MV of Disney Debt =479
(1−1
(1.075) 3
.075
+12,342
(1.075) 3 = $11,180
Present value of an annuityOf $479 mil for 3 years
Present value offace value of debt

Aswath Damodaran 85
Converting Operating Leases to Debt
n The “debt value” of operating leases is the present value of the leasepayments, at a rate that reflects their risk.
n In general, this rate will be close to or equal to the rate at which the companycan borrow.

Aswath Damodaran 86
Operating Leases at The Home Depot
n The pre-tax cost of debt at the Home Depot is 6.25%Yr Operating Lease Expense Present Value 1 $ 294 $ 277 2 $ 291 $ 258 3 $ 264 $ 220 4 $ 245 $ 192 5 $ 236 $ 174 6-15 $ 270 $ 1,450 (PV of 10-yr annuity)
Present Value of Operating Leases =$ 2,571
n Debt outstanding at the Home Depot = $1,205 + $2,571 = $3,776 mil(The Home Depot has other debt outstanding of $1,205 million)

Aswath Damodaran 87
6 Application Test: Estimating Market Value
n Estimate the• Market value of equity at your firm and Book Value of equity
• Market value of debt and book value of debt (If you cannot find the averagematurity of your debt, use 5 years)
MV of Debt =
n Estimate the• Weights for equity and debt based upon market value
• Weights for equity and debt based upon book value
Interest Exp(1−
1
(1 + Pre − tax cost of debt)5
Pre − tax cost of debt
+BV of Debt
(1+ Pre − tax cost of debt)5
PV of an annuity for 5 yearsAt pre-tax cost of debt

Aswath Damodaran 88
Application Test: Estimating Levered Beta and Cost ofEquity
n Using the bottom-up unlevered beta that you computed for your firm, and thevalues of debt and equity that you have estimated for your firm, estimate abottom-up levered beta for your firm.
Levered Beta = Unlev Beta [ 1 + (1- tax rate) (MV of Debt/MV of Equity)]
n Estimate the cost of equity based upon the bottom-up levered beta.

Aswath Damodaran 89
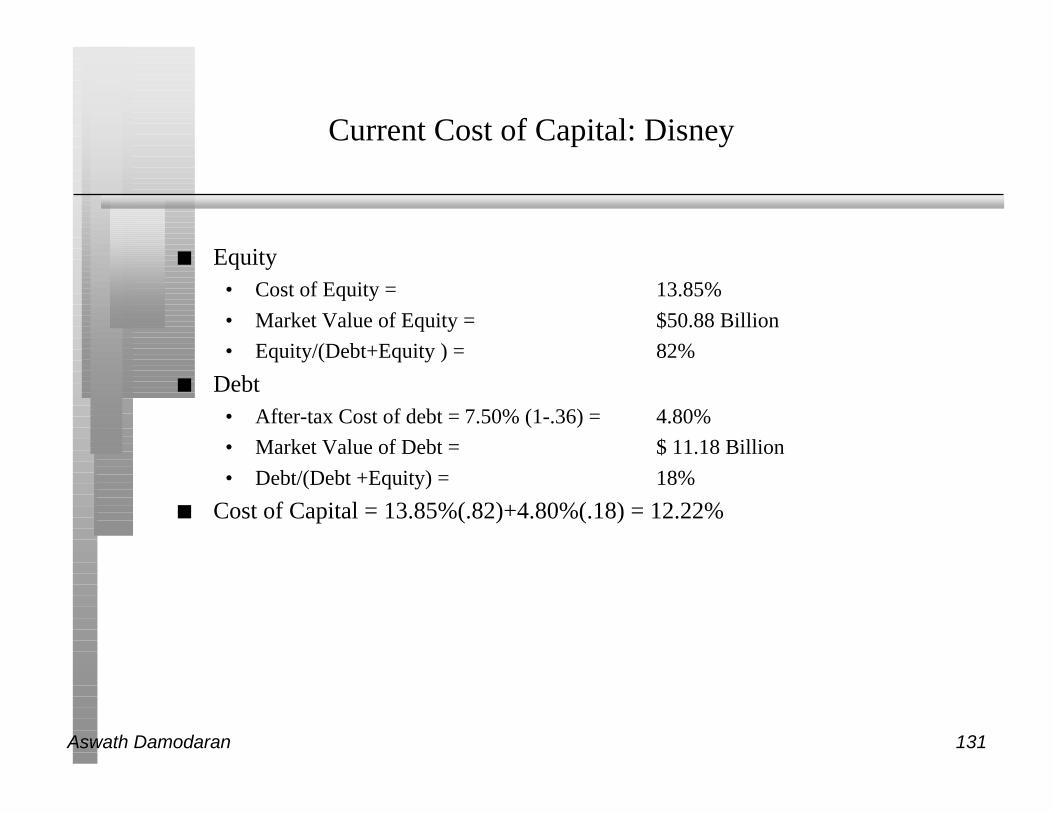
Estimating Cost of Capital: Disney
n Equity• Cost of Equity = 13.85%
• Market Value of Equity = 675.13*75.38= $50 .88 Billion
• Equity/(Debt+Equity ) = 82%
n Debt• After-tax Cost of debt = 7.50% (1-.36) = 4.80%
• Market Value of Debt = $ 11.18 Billion
• Debt/(Debt +Equity) = 18%
n Cost of Capital = 13.85%(.82)+4.80%(.18) = 12.22%
50.88/(50.88+11.18) 11.18/(50.88+11.18)

Aswath Damodaran 90
Disney’s Divisional Costs of Capital
Business E/(D+E) Cost of D/(D+E) After-tax Cost of Capital
Equity Cost of Debt
Creative Content 82.70% 14.80% 17.30% 4.80% 13.07%
Retailing 82.70% 16.35% 17.30% 4.80% 14.36%
Broadcasting 82.70% 12.61% 17.30% 4.80% 11.26%
Theme Parks 82.70% 13.91% 17.30% 4.80% 12.32%
Real Estate 62.79% 12.31% 37.21% 4.80% 9.52%
Disney 81.99% 13.85% 18.01% 4.80% 12.22%

Aswath Damodaran 91
6 Application Test: Estimating Cost of Capital
n Based upon the costs of equity and debt that you have estimated earlier, andthe weights for each, estimate the cost of capital for your firm.
Cost of capital = Cost of equity {MV of Equity/(MV of Equity + MV of Debt) }+After-tax cost of debt {MV of Debt/(MV of Equity + MV of Debt)}
n How different would your cost of capital have been, if you used book valueweights?

Aswath Damodaran 92
Choosing a Hurdle Rate
n Either the cost of equity or the cost of capital can be used as a hurdle rate,depending upon whether the returns measured are to equity investors or to allclaimholders on the firm (capital)
n If returns are measured to equity investors, the appropriate hurdle rate is thecost of equity.
n If returns are measured to capital (or the firm), the appropriate hurdle rate isthe cost of capital.

Aswath Damodaran 93
Back to First Principles
n Invest in projects that yield a return greater than the minimum acceptablehurdle rate.
• The hurdle rate should be higher for riskier projects and reflect the financingmix used - owners’ funds (equity) or borrowed money (debt)
• Returns on projects should be measured based on cash flows generated and thetiming of these cash flows; they should also consider both positive and negativeside effects of these projects.
n Choose a financing mix that minimizes the hurdle rate and matches the assetsbeing financed.
n If there are not enough investments that earn the hurdle rate, return the cash tostockholders.
• The form of returns - dividends and stock buybacks - will depend upon thestockholders’ characteristics.

Aswath Damodaran 94
Measuring Investment Returns
Aswath Damodaran
Stern School of Business

Aswath Damodaran 95
First Principles
n Invest in projects that yield a return greater than the minimum acceptablehurdle rate.
• The hurdle rate should be higher for riskier projects and reflect the financing mixused - owners’ funds (equity) or borrowed money (debt)
• Returns on projects should be measured based on cash flows generated andthe timing of these cash flows; they should also consider both positive andnegative side effects of these projects.
n Choose a financing mix that minimizes the hurdle rate and matches the assetsbeing financed.
n If there are not enough investments that earn the hurdle rate, return the cash tostockholders.
• The form of returns - dividends and stock buybacks - will depend upon thestockholders’ characteristics.
Objective: Maximize the Value of the Firm

Aswath Damodaran 96
Measures of return: earnings versus cash flows
n Principles Governing Accounting Earnings Measurement• Accrual Accounting: Show revenues when products and services are sold or
provided, not when they are paid for. Show expenses associated with theserevenues rather than cash expenses.
• Operating versus Capital Expenditures: Only expenses associated with creatingrevenues in the current period should be treated as operating expenses. Expensesthat create benefits over several periods are written off over multiple periods (asdepreciation or amortization)
n To get from accounting earnings to cash flows:• you have to add back non-cash expenses (like depreciation)
• you have to subtract out cash outflows which are not expensed (such as capitalexpenditures)
• you have to make accrual revenues and expenses into cash revenues and expenses(by considering changes in working capital).

Aswath Damodaran 97
Measuring Returns Right: The Basic Principles
n Use cash flows rather than earnings. You cannot spend earnings.
n Use “incremental” cash flows relating to the investment decision, i.e.,cashflows that occur as a consequence of the decision, rather than total cashflows.
n Use “time weighted” returns, i.e., value cash flows that occur earlier more thancash flows that occur later.
The Return Mantra: “Time-weighted, Incremental Cash Flow Return”
Aswath Damodaran 98
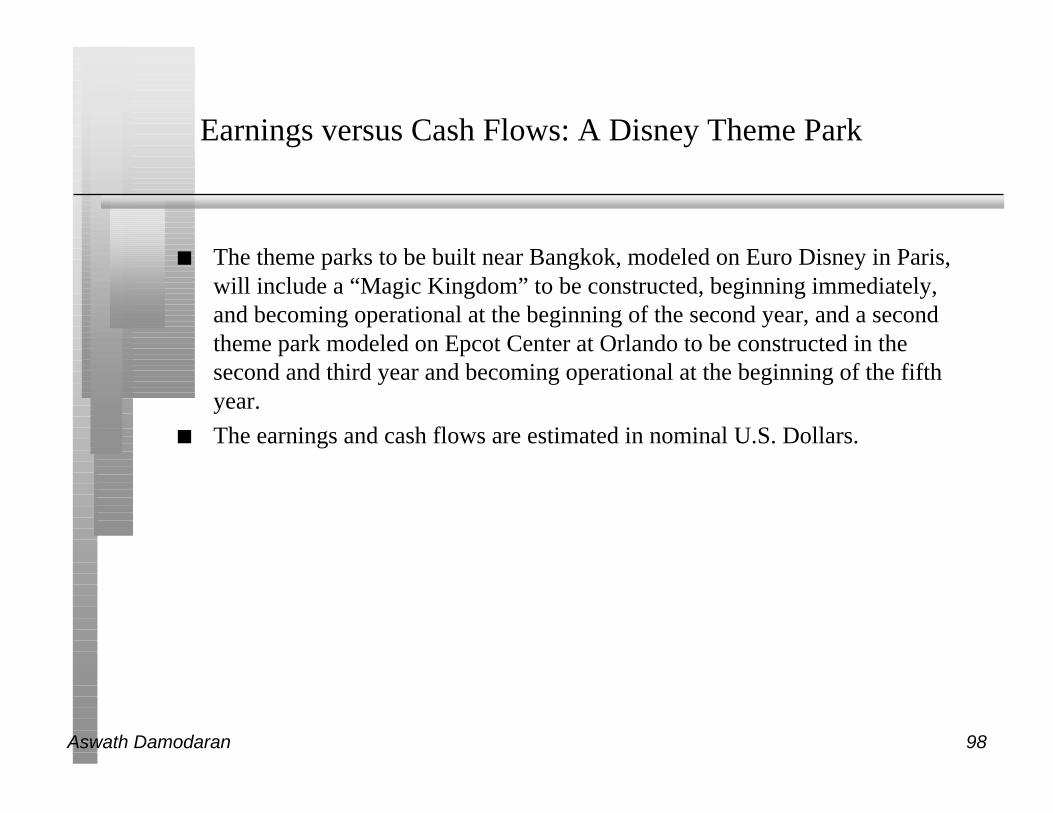
Earnings versus Cash Flows: A Disney Theme Park
n The theme parks to be built near Bangkok, modeled on Euro Disney in Paris,will include a “Magic Kingdom” to be constructed, beginning immediately,and becoming operational at the beginning of the second year, and a secondtheme park modeled on Epcot Center at Orlando to be constructed in thesecond and third year and becoming operational at the beginning of the fifthyear.
n The earnings and cash flows are estimated in nominal U.S. Dollars.

Aswath Damodaran 99
The Full Picture: Earnings on Project
0 1 2 3 4 5 6 7 8 9 10RevenuesMagic Kingdom 1,000$ 1,400$ 1,700$ 2,000$ 2,200$ 2,420$ 2,662$ 2,928$ 3,016$ Second Theme Park 500$ 550$ 605$ 666$ 732$ 754$ Resort & Properties 200$ 250$ 300$ 375$ 688$ 756$ 832$ 915$ 943$ Total 1,200$ 1,650$ 2,000$ 2,875$ 3,438$ 3,781$ 4,159$ 4,575$ 4,713$
Operating ExpensesMagic Kingdom 600$ 840$ 1,020$ 1,200$ 1,320$ 1,452$ 1,597$ 1,757$ 1,810$ Second Theme Park -$ -$ -$ 300$ 330$ 363$ 399$ 439$ 452$ Resort & Property 150$ 188$ 225$ 281$ 516$ 567$ 624$ 686$ 707$ Total 750$ 1,028$ 1,245$ 1,781$ 2,166$ 2,382$ 2,620$ 2,882$ 2,969$
Other ExpensesDepreciation & Amortization 375$ 378$ 369$ 319$ 302$ 305$ 305$ 305$ 315$ Allocated G&A Costs 200$ 220$ 242$ 266$ 293$ 322$ 354$ 390$ 401$
Operating Income (125)$ 25$ 144$ 509$ 677$ 772$ 880$ 998$ 1,028$ Taxes (45)$ 9$ 52$ 183$ 244$ 278$ 317$ 359$ 370$ Operating Income after Taxes (80)$ 16$ 92$ 326$ 433$ 494$ 563$ 639$ 658$
Aswath Damodaran 100
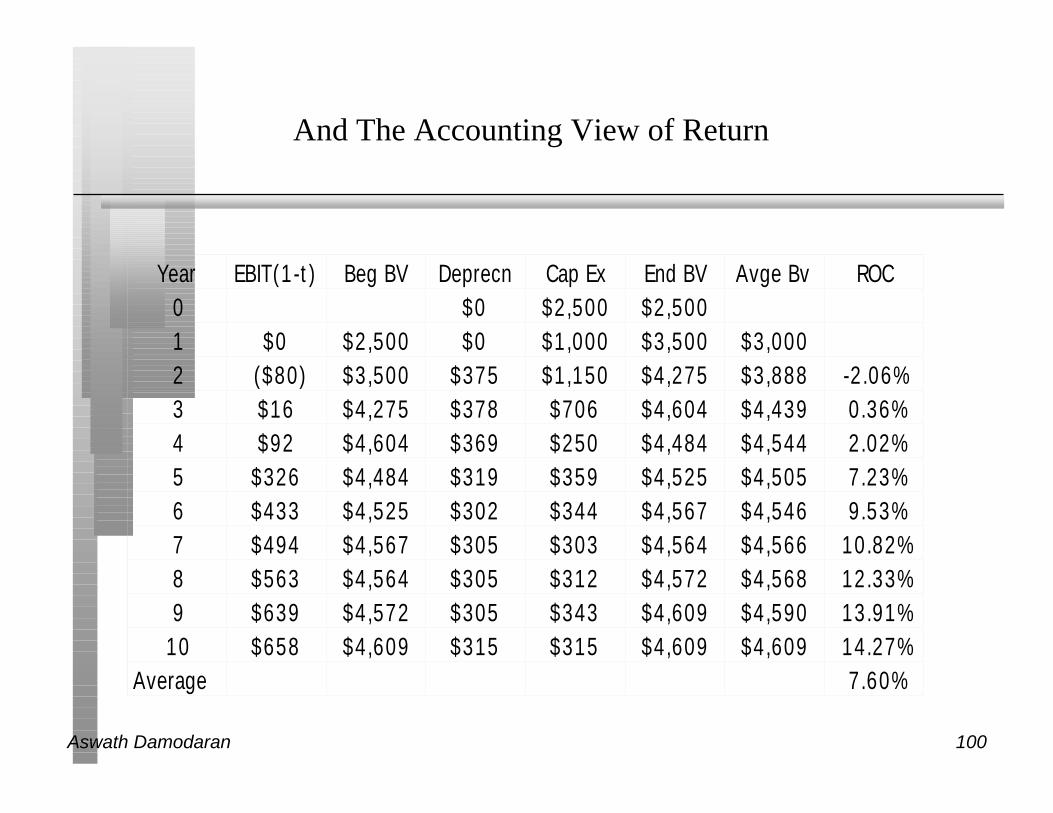
And The Accounting View of Return
Year EBIT(1-t) Beg BV Deprecn Cap Ex End BV Avge Bv ROC0 $0 $2,500 $2,5001 $0 $2,500 $0 $1,000 $3,500 $3,0002 ($80) $3,500 $375 $1,150 $4,275 $3,888 -2.06%3 $16 $4,275 $378 $706 $4,604 $4,439 0.36%4 $92 $4,604 $369 $250 $4,484 $4,544 2.02%5 $326 $4,484 $319 $359 $4,525 $4,505 7.23%6 $433 $4,525 $302 $344 $4,567 $4,546 9.53%7 $494 $4,567 $305 $303 $4,564 $4,566 10.82%8 $563 $4,564 $305 $312 $4,572 $4,568 12.33%9 $639 $4,572 $305 $343 $4,609 $4,590 13.91%
10 $658 $4,609 $315 $315 $4,609 $4,609 14.27%Average 7.60%

Aswath Damodaran 101
Would lead use to conclude that...
n Do not invest in this park. The return on capital of 7.60% is lower than thecost of capital for theme parks of 12.32%; This would suggest that theproject should not be taken.
n Given that we have computed the average over an arbitrary period of 10 years,while the theme park itself would have a life greater than 10 years, would youfeel comfortable with this conclusion?
o Yes
o No

Aswath Damodaran 102
From Project to Firm Return on Capital
n Just as a comparison of project return on capital to the cost of capital yields ameasure of whether the project is acceptable, a comparison can be made at thefirm level, to judge whether the existing projects of the firm are adding ordestroying value.
n Disney, in 1996, had earnings before interest and taxes of $5,559 million, hada book value of equity of $11,368 million and a book value of debt of $7,663million. With a tax rate of 36%, we get
Return on Capital = 5559 (1-.36) / (11,368+7,663) = 18.69%
Cost of Capital for Disney= 12.22%
Excess Return = 18.69% - 12.22% = 6.47%
n This can be converted into a dollar figure by multiplying by the capitalinvested, in which case it is called economic value added
EVA = (.1869-.1222) (11,368+7,663) = $1,232 million

Aswath Damodaran 103
6 Application Test: Assessing Investment Quality
n For the most recent period for which you have data, compute the after-taxreturn on capital earned by your firm, where after-tax return on capital iscomputed to be
After-tax ROC = EBIT (1-tax rate)/ (BV of debt + BV of Equity)previous year
n For the most recent period for which you have data, compute the return spreadearned by your firm:
Return Spread = After-tax ROC - Cost of Capital
n For the most recent period, compute the EVA earned by your firm
EVA = Return Spread * (BV of Debt +BV of Equity)

Aswath Damodaran 104
The cash flow view of this project..
•
To get from income to cash flow, we
ladded back all non-cash charges such as depreciation
lsubtracted out the capital expenditures
lsubtracted out the change in non-cash working capital
0 1 2 3Operating Income after Taxes (80)$ 16$ + Depreciation & Amortization -$ -$ 375$ 378$ - Capital Expenditures 2,500$ 1,000$ 1,150$ 706$ - Change in Working Capital -$ -$ 60$ 23$
Cash Flow on Project (2,500)$ (1,000)$ (915)$ (335)$
9 10639$ 658$ 305$ 315$ 343$ 315$ 21$ 7$
580$ 651$

Aswath Damodaran 105
The incremental cash flows on the project
To get from cash flow to incremental cash flows, we
lsubtract out sunk costs
l add back the non-incremental allocated costs (in after-tax terms)
0 1 2 3Cash Flow on Project (2,500)$ (1,000)$ (915)$ (335)$ - Sunk Costs 500$ + Non-incremental Allocated Costs (1-t) -$ -$ 85$ 94$ Incremental Cash Flow on Project (2,000)$ (1,000)$ (830)$ (241)$
9 10580$ 651$
166$ 171$ 746$ 822$

Aswath Damodaran 106
The Incremental Cash Flows
0 1 2 3 4 5 6 7 8 9 10Operating Income after Taxes (80)$ 16$ 92$ 326$ 433$ 494$ 563$ 639$ 658$ + Depreciation & Amortization 375$ 378$ 369$ 319$ 302$ 305$ 305$ 305$ 315$ - Capital Expenditures 2,000$ 1,000$ 1,150$ 706$ 250$ 359$ 344$ 303$ 312$ 343$ 315$ - Change in Working Capital 60$ 23$ 18$ 44$ 28$ 17$ 19$ 21$ 7$ + Non-incremental Allocated Expense(1-t) 85$ 94$ 103$ 114$ 125$ 137$ 151$ 166$ 171$ Cashflow to Firm (2,000)$ (1,000)$ (830)$ (241)$ 297$ 355$ 488$ 617$ 688$ 746$ 822$

Aswath Damodaran 107
To Time-Weighted Cash Flows
n Incremental cash flows in the earlier years are worth more than incrementalcash flows in later years.
n In fact, cash flows across time cannot be added up. They have to be brought tothe same point in time before aggregation.
n This process of moving cash flows through time is• discounting, when future cash flows are brought to the present
• compounding, when present cash flows are taken to the future
n The discounting and compounding is done at a discount rate that will reflect• Expected inflation: Higher Inflation -> Higher Discount Rates
• Expected real rate: Higher real rate -> Higher Discount rate
• Expected uncertainty: Higher uncertainty -> Higher Discount Rate
Aswath Damodaran 108
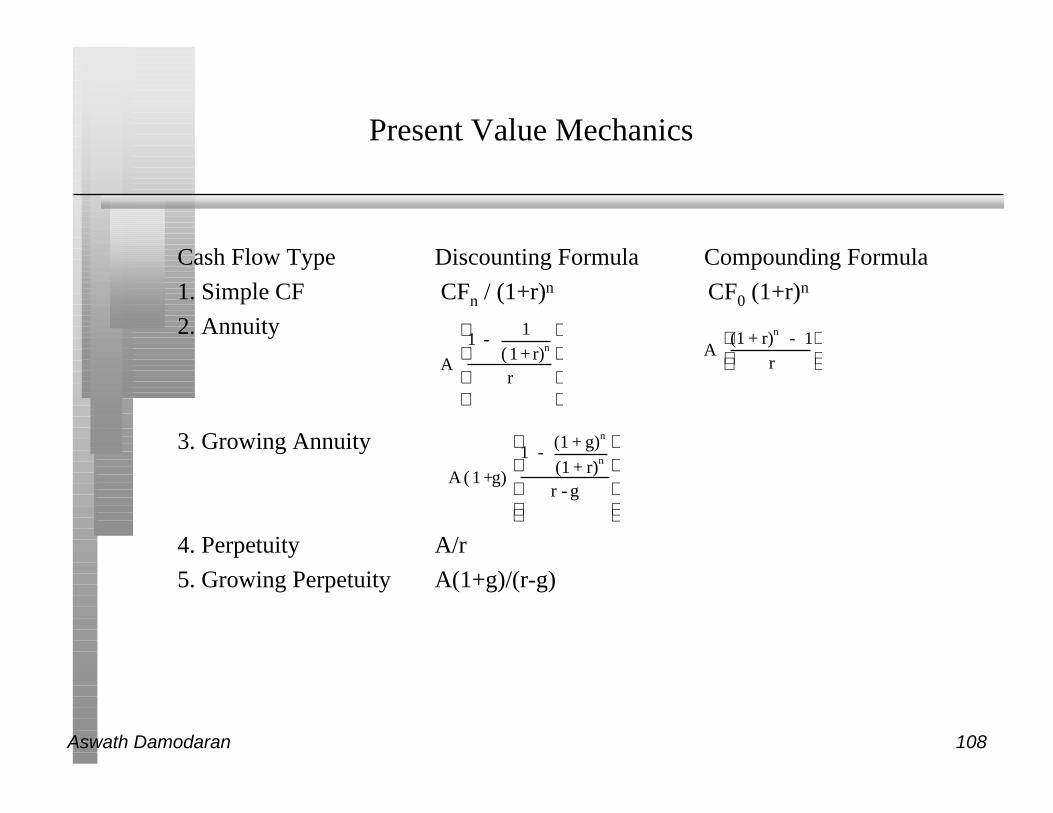
Present Value Mechanics
Cash Flow Type Discounting Formula Compounding Formula
1. Simple CF CFn / (1+r)n CF0 (1+r)n
2. Annuity
3. Growing Annuity
4. Perpetuity A/r
5. Growing Perpetuity A(1+g)/(r-g)
A
1 - 1
(1+ r)n
r
A (1 + r)n - 1
r
A ( 1 +g)
1 - (1 + g)n
(1 + r)n
r - g

Aswath Damodaran 109
Discounted cash flow measures of return
n Net Present Value (NPV): The net present value is the sum of the presentvalues of all cash flows from the project (including initial investment).
NPV = Sum of the present values of all cash flows on the project, including the initialinvestment, with the cash flows being discounted at the appropriate hurdle rate(cost of capital, if cash flow is cash flow to the firm, and cost of equity, if cashflow is to equity investors)
• Decision Rule: Accept if NPV > 0
n Internal Rate of Return (IRR): The internal rate of return is the discount ratethat sets the net present value equal to zero. It is the percentage rate of return,based upon incremental time-weighted cash flows.
• Decision Rule: Accept if IRR > hurdle rate

Aswath Damodaran 110
Closure on Cash Flows
n In a project with a finite and short life, you would need to compute a salvagevalue, which is the expected proceeds from selling all of the investment in theproject at the end of the project life. It is usually set equal to book value offixed assets and working capital
n In a project with an infinite or very long life, we compute cash flows for areasonable period, and then compute a terminal value for this project, whichis the present value of all cash flows that occur after the estimation periodends..
n Assuming the project lasts forever, and that cash flows after year 9 grow 3%(the inflation rate) forever, the present value at the end of year 9 of cash flowsafter that can be written as:
• Terminal Value = CF in year 10/(Cost of Capital - Growth Rate)
= 822/(.1232-.03) = $ 8,821 million

Aswath Damodaran 111
Which yields a NPV of..
Year Incremental CF Terminal Value PV at 12.32%0 (2,000)$ (2,000)$ 1 (1,000)$ (890)$ 2 (830)$ (658)$ 3 (241)$ (170)$ 4 297$ 187$ 5 355$ 198$ 6 488$ 243$ 7 617$ 273$ 8 688$ 272$ 9 746$ 8,821$ 3,363$
Net Present Value of Project = 818$

Aswath Damodaran 112
Which makes the argument that..
n The project should be accepted. The positive net present value suggests thatthe project will add value to the firm, and earn a return in excess of the cost ofcapital.
n By taking the project, Disney will increase its value as a firm by $818 million.

Aswath Damodaran 113
The IRR of this project
NPV Profile for Theme Park
($4,000)
($2,000)
$0
$2,000
$4,000
$6,000
$8,000
0%
2%
4%
6%
8%
10
%
12
%
14
%
16
%
18
%
20
%
22
%
24
%
26
%
28
%
30
%
32
%
34
%
36
%
38
%
40
%
Discount Rate
NPV
Aswath Damodaran 114
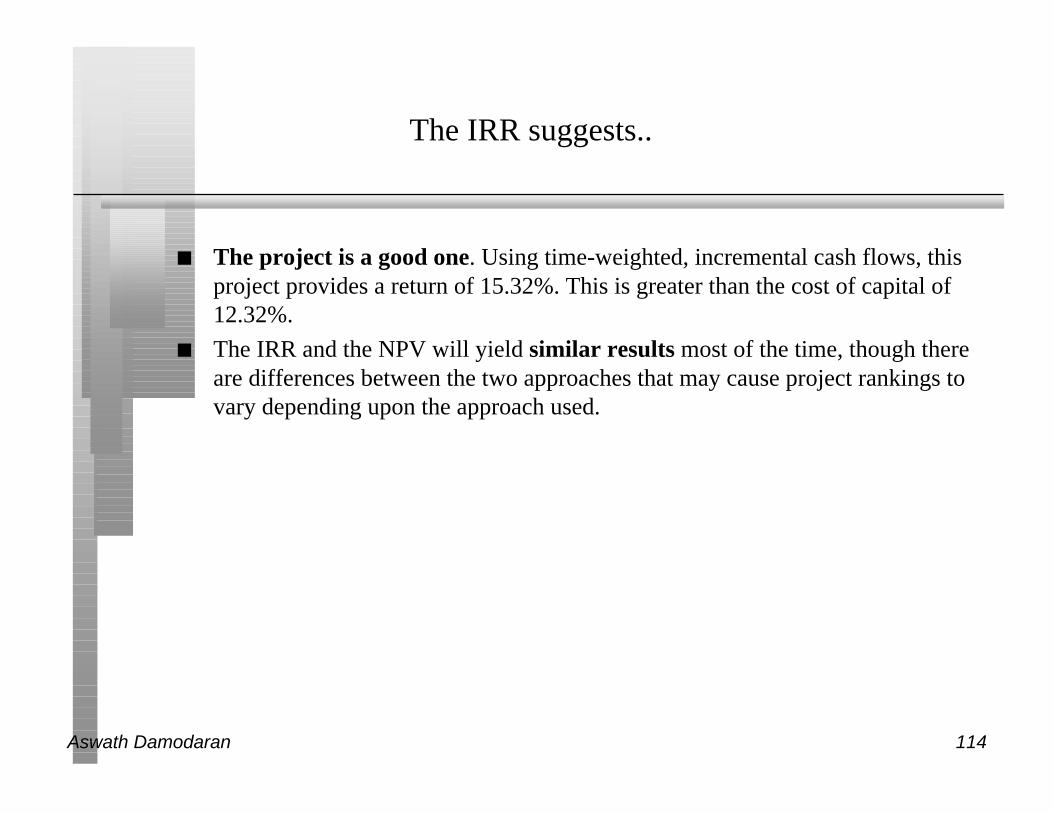
The IRR suggests..
n The project is a good one. Using time-weighted, incremental cash flows, thisproject provides a return of 15.32%. This is greater than the cost of capital of12.32%.
n The IRR and the NPV will yield similar results most of the time, though thereare differences between the two approaches that may cause project rankings tovary depending upon the approach used.

Aswath Damodaran 115
The Disney Theme Park: The Risks of InternationalExpansion
n The cash flows on the Bangkok Disney park will be in Thai Baht. This willexpose Disney to exchange rate risk. In addition, there are political andeconomic risks to consider in an investment in Thailand. The discount rate of12.32% that we used is a cost of capital for U.S. theme parks. Would you use ahigher rate for this project?
o Yes
o No

Aswath Damodaran 116
Should there be a risk premium for foreign projects?
n The exchange rate risk may be diversifiable risk (and hence should notcommand a premium) if
• the company has projects is a large number of countries (or)
• the investors in the company are globally diversified.
For Disney, this risk should not affect the cost of capital used.
n The same diversification argument can also be applied against political risk,which would mean that it too should not affect the discount rate. It may,however, affect the cash flows, by reducing the expected life or cash flows onthe project.
For Disney, this risk too is assumed to not affect the cost of capital

Aswath Damodaran 117
Domestic versus international expansion
n The analysis was done in dollars. Would the conclusions have been anydifferent if we had done the analysis in Thai Baht?
o Yes
o No

Aswath Damodaran 118
Equity Analysis: The Parallels
n The investment analysis can be done entirely in equity terms, as well. Thereturns, cashflows and hurdle rates will all be defined from the perspective ofequity investors.
n If using accounting returns,• Return will be Return on Equity (ROE) = Net Income/BV of Equity
• ROE has to be greater than cost of equity
n If using discounted cashflow models,• Cashflows will be cashflows after debt payments to equity investors
• Hurdle rate will be cost of equity
Aswath Damodaran 119
The Role of Sensitivity Analysis
n Our conclusions on a project are clearly conditioned on a large number ofassumptions about revenues, costs and other variables over very long timeperiods.
n To the degree that these assumptions are wrong, our conclusions can also bewrong.
n One way to gain confidence in the conclusions is to check to see how sensitivethe decision measure (NPV, IRR..) is to changes in key assumptions.

Aswath Damodaran 120
Side Costs and Benefits
n Most projects considered by any business create side costs and benefits forthat business.
n The side costs include the costs created by the use of resources that thebusiness already owns (opportunity costs) and lost revenues for other projectsthat the firm may have.
n The benefits that may not be captured in the traditional capital budgetinganalysis include project synergies (where cash flow benefits may accrue toother projects) and options embedded in projects (including the options todelay, expand or abandon a project).
n The returns on a project should incorporate these costs and benefits.

Aswath Damodaran 121
Back to First Principles
n Invest in projects that yield a return greater than the minimum acceptablehurdle rate.
• The hurdle rate should be higher for riskier projects and reflect the financing mixused - owners’ funds (equity) or borrowed money (debt)
• Returns on projects should be measured based on cash flows generated andthe timing of these cash flows; they should also consider both positive andnegative side effects of these projects.
n Choose a financing mix that minimizes the hurdle rate and matches the assetsbeing financed.
n If there are not enough investments that earn the hurdle rate, return the cash tostockholders.
• The form of returns - dividends and stock buybacks - will depend upon thestockholders’ characteristics.

Aswath Damodaran 122
Finding the Right Financing Mix: The CapitalStructure Decision
Aswath Damodaran
Stern School of Business

Aswath Damodaran 123
First Principles
n Invest in projects that yield a return greater than the minimum acceptablehurdle rate.
• The hurdle rate should be higher for riskier projects and reflect the financing mixused - owners’ funds (equity) or borrowed money (debt)
• Returns on projects should be measured based on cash flows generated and thetiming of these cash flows; they should also consider both positive and negativeside effects of these projects.
n Choose a financing mix that minimizes the hurdle rate and matches theassets being financed.
n If there are not enough investments that earn the hurdle rate, return the cash tostockholders.
• The form of returns - dividends and stock buybacks - will depend upon thestockholders’ characteristics.

Aswath Damodaran 124
Debt: The Trade-Off
Advantages of Borrowing Disadvantages of Borrowing
1. Tax Benefit:
Higher tax rates --> Higher tax benefit
1. Bankruptcy Cost:
Higher business risk --> Higher Cost
2. Added Discipline:
Greater the separation between managers
and stockholders --> Greater the benefit
2. Agency Cost:
Greater the separation between stock-
holders & lenders --> Higher Cost
3. Loss of Future Financing Flexibility:
Greater the uncertainty about future
financing needs --> Higher Cost

Aswath Damodaran 125
A Hypothetical Scenario
n Assume you operate in an environment, where• (a) there are no taxes
• (b) there is no separation between stockholders and managers.
• (c) there is no default risk
• (d) there is no separation between stockholders and bondholders
• (e) firms know their future financing needs

Aswath Damodaran 126
The Miller-Modigliani Theorem
n In an environment, where there are no taxes, default risk or agency costs,capital structure is irrelevant.
n The value of a firm is independent of its debt ratio.

Aswath Damodaran 127
An Alternate View
n The trade-off between debt and equity becomes more complicated when thereare both tax advantages and bankruptcy risk to consider.
n When debt has a tax advantage and increases default risk, the firm value willchange as the financing mix changes. The optimal financing mix is the onethat maximizes firm value.
Aswath Damodaran 128
Why does the cost of capital matter?
n The cost of capital has embedded in it, both the tax advantages of debt(through the use of the after-tax cost of debt) and the increased default risk(through the use of a cost of equity and the cost of debt)
n Value of a Firm = Present Value of Cash Flows to the Firm, discounted backat the cost of capital.
n If the cash flows to the firm are held constant, and the cost of capital isminimized, the value of the firm will be maximized.

Aswath Damodaran 129
Applying Approach: The Textbook Example
D/(D+E) ke kd After-tax Cost of Debt WACC
0 10.50% 8% 4.80% 10.50%
10% 11% 8.50% 5.10% 10.41%
20% 11.60% 9.00% 5.40% 10.36%
30% 12.30% 9.00% 5.40% 10.23%
40% 13.10% 9.50% 5.70% 10.14%
50% 14% 10.50% 6.30% 10.15%
60% 15% 12% 7.20% 10.32%
70% 16.10% 13.50% 8.10% 10.50%
80% 17.20% 15% 9.00% 10.64%
90% 18.40% 17% 10.20% 11.02%
100% 19.70% 19% 11.40% 11.40%

Aswath Damodaran 130
WACC and Debt Ratios
Weighted Average Cost of Capital and Debt Ratios
Debt Ratio
WA
CC
9.40%9.60%9.80%
10.00%10.20%10.40%10.60%10.80%11.00%11.20%11.40%
0
10%
20%
30%
40%
50%
60%
70%
80%
90%
100%
Aswath Damodaran 131
Current Cost of Capital: Disney
n Equity• Cost of Equity = 13.85%
• Market Value of Equity = $50.88 Billion
• Equity/(Debt+Equity ) = 82%
n Debt• After-tax Cost of debt = 7.50% (1-.36) = 4.80%
• Market Value of Debt = $ 11.18 Billion
• Debt/(Debt +Equity) = 18%
n Cost of Capital = 13.85%(.82)+4.80%(.18) = 12.22%

Aswath Damodaran 132
Mechanics of Cost of Capital Estimation
1. Estimate the Cost of Equity at different levels of debt:Equity will become riskier -> Beta will increase -> Cost of Equity will increase.
Estimation will use levered beta calculation
2. Estimate the Cost of Debt at different levels of debt:Default risk will go up and bond ratings will go down as debt goes up -> Cost of Debt
will increase.
To estimating bond ratings, we will use the interest coverage ratio (EBIT/Interestexpense)
3. Estimate the Cost of Capital at different levels of debt
4. Calculate the effect on Firm Value and Stock Price.

Aswath Damodaran 133
Process of Ratings and Rate Estimation
n We use the median interest coverage ratios for large manufacturing firms todevelop “interest coverage ratio” ranges for each rating class.
n We then estimate a spread over the long term bond rate for each ratings class,based upon yields at which these bonds trade in the market place.

Aswath Damodaran 134
Interest Coverage Ratios and Bond Ratings
If Interest Coverage Ratio is Estimated Bond Rating> 8.50 AAA
6.50 - 8.50 AA
5.50 - 6.50 A+
4.25 - 5.50 A
3.00 - 4.25 A–
2.50 - 3.00 BBB
2.00 - 2.50 BB
1.75 - 2.00 B+
1.50 - 1.75 B
1.25 - 1.50 B –
0.80 - 1.25 CCC
0.65 - 0.80 CC
0.20 - 0.65 C
< 0.20 D

Aswath Damodaran 135
Spreads over long bond rate for ratings classes
Rating Coverage gtSpreadAAA 0.20%AA 0.50%A+ 0.80%A 1.00%A- 1.25%BBB 1.50%BB 2.00%B+ 2.50%B 3.25%B- 4.25%CCC 5.00%CC 6.00%C 7.50%D 10.00%

Aswath Damodaran 136
Current Income Statement for Disney: 1996
Revenues 18,739
-Operating Expenses 12,046
EBITDA 6,693
-Depreciation 1,134
EBIT 5,559
-Interest Expense 479
Income before taxes 5,080
-Taxes 847
Income after taxes 4,233
n Interest coverage ratio= 5,559/479 = 11.61
(Amortization from Capital Cities acquistion not considered)

Aswath Damodaran 137
Estimating Cost of Equity
Current Beta = 1.25 Unlevered Beta = 1.09Market premium = 5.5% T.Bond Rate = 7.00% t=36%
Debt Ratio D/E Ratio Beta Cost of Equity0% 0% 1.09 13.00%10% 11% 1.17 13.43%20% 25% 1.27 13.96%30% 43% 1.39 14.65%40% 67% 1.56 15.56%50% 100% 1.79 16.85%60% 150% 2.14 18.77%70% 233% 2.72 21.97%80% 400% 3.99 28.95%90% 900% 8.21 52.14%

Aswath Damodaran 138
Disney: Beta, Cost of Equity and D/E Ratio
0.00
1.00
2.00
3.00
4.00
5.00
6.00
7.00
8.00
9.00
0% 10% 20% 30% 40% 50% 60% 70% 80% 90%
Debt Ratio
Beta
0.00%
10.00%
20.00%
30.00%
40.00%
50.00%
60.00%
Cost
of
Equit
y
BetaCost of Equity

Aswath Damodaran 139
Estimating Cost of Debt
D/(D+E) 0.00% 10.00% Calculation Details StepD/E 0.00% 11.11% = [D/(D+E)]/( 1 -[D/(D+E)])$ Debt $0 $6,207 = [D/(D+E)]* Firm Value 1
EBITDA $6,693 $6,693 Kept constant as debt changes.Depreciation $1,134 $1,134 "EBIT $5,559 $5,559Interest $0 $447 = Interest Rate * $ Debt 2Taxable Income $5,559 $5,112 = EBIT - InterestTax $2,001 $1,840 = Tax Rate * Taxable IncomeNet Income $3,558 $3,272 = Taxable Income - Tax
Pre-tax Int. cov ∞ 12.44 = EBIT/Int. Exp 3Likely Rating AAA AAA Based upon interest coverage 4Interest Rate 7.20% 7.20% Interest rate for given rating 5Eff. Tax Rate 36.00% 36.00% See notes on effective tax rate
After-tax kd 4.61% 4.61% =Interest Rate * (1 - Tax Rate)
Firm Value = 50,888+11,180= $62,068

Aswath Damodaran 140
The Ratings Table
If Interest Coverage Ratio is Estimated Bond Rating Default spread> 8.50 AAA 0.20%
6.50 - 8.50 AA 0.50%
5.50 - 6.50 A+ 0.80%
4.25 - 5.50 A 1.00%
3.00 - 4.25 A– 1.25%
2.50 - 3.00 BBB 1.50%
2.00 - 2.50 BB 2.00%
1.75 - 2.00 B+ 2.50%
1.50 - 1.75 B 3.25%
1.25 - 1.50 B – 4.25%
0.80 - 1.25 CCC 5.00%
0.65 - 0.80 CC 6.00%
0.20 - 0.65 C 7.50%
< 0.20 D 10.00%

Aswath Damodaran 141
A Test: Can you do the 20% level?
D/(D+E) 0.00% 10.00% 20.00% Second Iteration
D/E 0.00% 11.11% 25.00%
$ Debt $0 $6,207 $12,414
EBITDA $6,693 $6,693 $6,693
Depreciation $1,134 $1,134 $1,134
EBIT $5,559 $5,559 $5,559
Interest Expense $0 $447 $894 .078*12414=968
Taxable Income $5,559 $5,112
Pre-tax Int. cov 12.44 6.2 5559/968= 5.74
Likely Rating AAA AAA A+ A+
Interest Rate 7.20% 7.20% 7.80% 7.80%
Eff. Tax Rate 36.00% 36.00% 36.00% 36.00%
Cost of Debt 4.61% 4.61% 4.99%

Aswath Damodaran 142
Bond Ratings, Cost of Debt and Debt Ratios
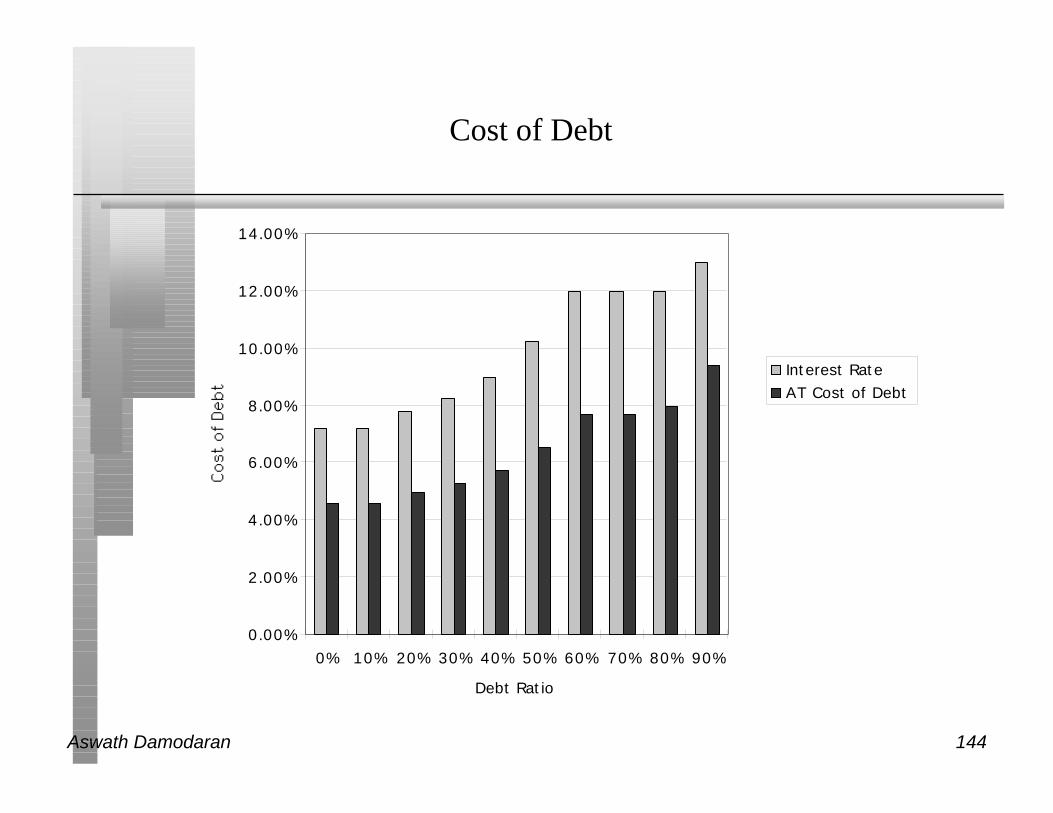
WORKSHEET FOR ESTIMATING RATINGS/INTEREST RATESD/(D+E) 0.00% 10.00% 20.00% 30.00% 40.00% 50.00% 60.00% 70.00% 80.00% 90.00%D/E 0.00% 11.11% 25.00% 42.86% 66.67% 100.00% 150.00% 233.33% 400.00% 900.00%$ Debt $0 $6,207 $12,414 $18,621 $24,827 $31,034 $37,241 $43,448 $49,655 $55,862EBITDA $6,693 $6,693 $6,693 $6,693 $6,693 $6,693 $6,693 $6,693 $6,693 $6,693Depreciation $1,134 $1,134 $1,134 $1,134 $1,134 $1,134 $1,134 $1,134 $1,134 $1,134EBIT $5,559 $5,559 $5,559 $5,559 $5,559 $5,559 $5,559 $5,559 $5,559 $5,559Interest $0 $447 $968 $1,536 $2,234 $3,181 $4,469 $5,214 $5,959 $7,262Taxable Income $5,559 $5,112 $4,591 $4,023 $3,325 $2,378 $1,090 $345 ($400) ($1,703)Tax $2,001 $1,840 $1,653 $1,448 $1,197 $856 $392 $124 ($144) ($613)Pre-tax Int. cov ∞ 12.44 5.74 3.62 2.49 1.75 1.24 1.07 0.93 0.77Likely Rating AAA AAA A+ A- BB B CCC CCC CCC CCInterest Rate 7.20% 7.20% 7.80% 8.25% 9.00% 10.25% 12.00% 12.00% 12.00% 13.00%Eff. Tax Rate 36.00% 36.00% 36.00% 36.00% 36.00% 36.00% 36.00% 36.00% 33.59% 27.56%Cost of debt 4.61% 4.61% 4.99% 5.28% 5.76% 6.56% 7.68% 7.68% 7.97% 9.42%

Aswath Damodaran 143
Stated versus Effective Tax Rates
n You need taxable income for interest to provide a tax savings
n In the Disney case, consider the interest expense at 70% and 80%70% Debt Ratio 80% Debt Ratio
EBIT $ 5,559 m $ 5,559 m
Interest Expense $ 5,214 m $ 5,959 m
Tax Savings $ 1,866 m 5559*.36 =$ 2,001m
Effective Tax Rate 36.00% 2001/5959 = 33.59%
Pre-tax interest rate 12.00% 12.00%
After-tax Interest Rate 7.68% 7.97%
n You can deduct only $5,559million of the $5,959 million of the interestexpense at 80%. Therefore, only 36% of $ 5,559 is considered as the taxsavings.
Aswath Damodaran 144
Cost of Debt
0.00%
2.00%
4.00%
6.00%
8.00%
10.00%
12.00%
14.00%
0% 10% 20% 30% 40% 50% 60% 70% 80% 90%
Debt Ratio
Interest RateAT Cost of Debt

Aswath Damodaran 145
Disney’s Cost of Capital Schedule
Debt Ratio Cost of Equity AT Cost of Debt Cost of Capital
0.00% 13.00% 4.61% 13.00%
10.00% 13.43% 4.61% 12.55%
20.00% 13.96% 4.99% 12.17%
30.00% 14.65% 5.28% 11.84%
40.00% 15.56% 5.76% 11.64%
50.00% 16.85% 6.56% 11.70%
60.00% 18.77% 7.68% 12.11%
70.00% 21.97% 7.68% 11.97%
80.00% 28.95% 7.97% 12.17%
90.00% 52.14% 9.42% 13.69%

Aswath Damodaran 146
Disney: Cost of Capital Chart
10.50%
11.00%
11.50%
12.00%
12.50%
13.00%
13.50%
14.00%
Debt Ratio
Cost of Capital

Aswath Damodaran 147
Effect on Firm Value
n Firm Value before the change = 50,888+11,180= $ 62,068WACCb = 12.22% Annual Cost = $62,068 *12.22%= $7,583 million
WACCa = 11.64% Annual Cost = $62,068 *11.64% = $7,226 million∆ WACC = 0.58% Change in Annual Cost = $ 357 million
n If there is no growth in the firm value, (Conservative Estimate)• Increase in firm value = $357 / .1164 = $3,065 million
• Change in Stock Price = $3,065/675.13= $4.54 per share
n If there is growth (of 7.13%) in firm value over time,• Increase in firm value = $357 * 1.0713 /(.1164-.0713) = $ 8,474
• Change in Stock Price = $8,474/675.13 = $12.55 per share
Implied Growth Rate obtained by
Firm value Today =FCFF(1+g)/(WACC-g): Perpetual growth formula
$62,068 = $2,947(1+g)/(.1222-g): Solve for g

Aswath Damodaran 148
A Test: The Repurchase Price
n Let us suppose that the CFO of Disney approached you about buying backstock. He wants to know the maximum price that he should be willing to payon the stock buyback. (The current price is $ 75.38) Assuming that firm valuewill grow by 7.13% a year, estimate the maximum price.
n What would happen to the stock price after the buyback if you were able tobuy stock back at $ 75.38?

Aswath Damodaran 149
The Downside Risk
n Doing What-if analysis on Operating Income• A. Standard Deviation Approach
– Standard Deviation In Past Operating Income
– Standard Deviation In Earnings (If Operating Income Is Unavailable)
– Reduce Base Case By One Standard Deviation (Or More)
• B. Past Recession Approach– Look At What Happened To Operating Income During The Last Recession. (How Much
Did It Drop In % Terms?)
– Reduce Current Operating Income By Same Magnitude
n Constraint on Bond Ratings

Aswath Damodaran 150
Disney’s Operating Income: History
Year Operating Income Change in Operating Income
1981 $ 119.35
1982 $ 141.39 18.46%
1983 $ 133.87 -5.32%
1984 $ 142.60 6.5%
1985 $ 205.60 44.2%
1986 $ 280.58 36.5%
1987 $ 707.00 152.0%
1988 $ 789.00 11.6%
1989 $ 1,109.00 40.6%
1990 $ 1,287.00 16.1%
1991 $ 1,004.00 -22.0%
1992 $ 1,287.00 28.2%
1993 $ 1,560.00 21.2%
1994 $ 1,804.00 15.6%
1995 $ 2,262.00 25.4%
1996 $ 3,024.00 33.7%
Aswath Damodaran 151
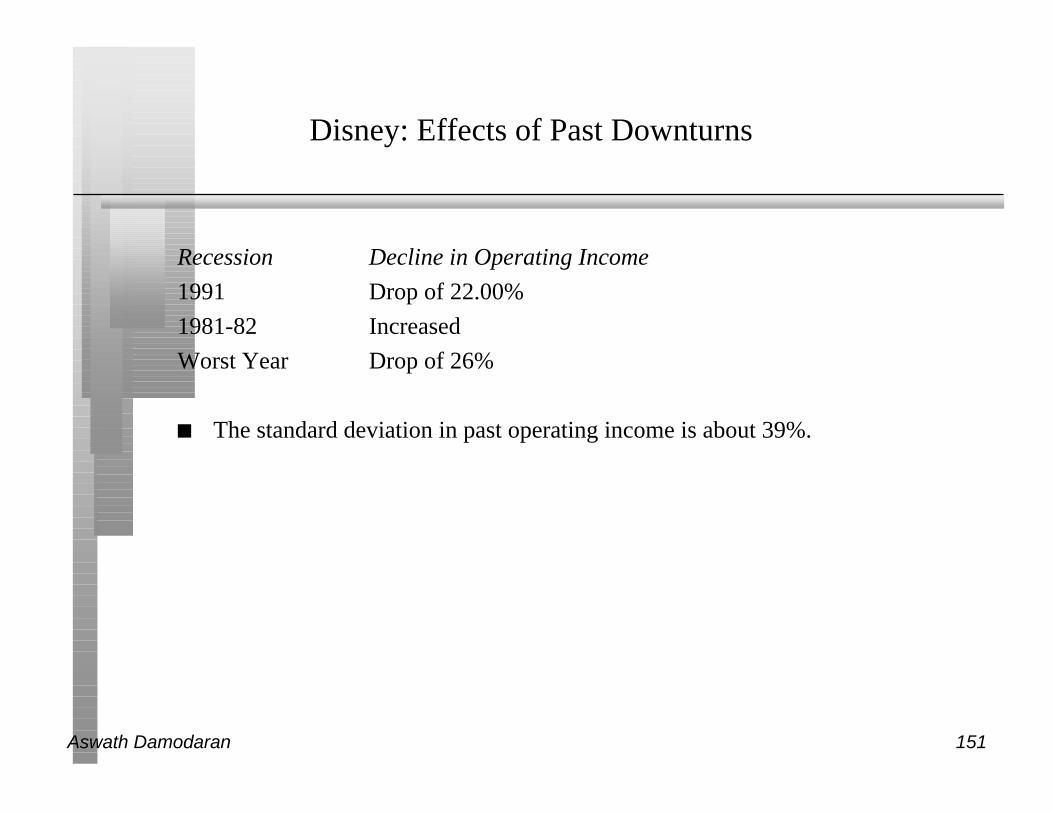
Disney: Effects of Past Downturns
Recession Decline in Operating Income
1991 Drop of 22.00%
1981-82 Increased
Worst Year Drop of 26%
n The standard deviation in past operating income is about 39%.

Aswath Damodaran 152
Disney: The Downside Scenario
Disney: Cost of Capital with 40% lower EBIT
10.00%
11.00%
12.00%
13.00%
14.00%
15.00%
16.00%
17.00%
18.00%
Debt Ratio
Cost of Capital

Aswath Damodaran 153
Constraints on Ratings
n Management often specifies a 'desired Rating' below which they do not wantto fall.
n The rating constraint is driven by three factors• it is one way of protecting against downside risk in operating income (so do not do
both)
• a drop in ratings might affect operating income
• there is an ego factor associated with high ratings
n Caveat: Every Rating Constraint Has A Cost.• Provide Management With A Clear Estimate Of How Much The Rating Constraint
Costs By Calculating The Value Of The Firm Without The Rating Constraint AndComparing To The Value Of The Firm With The Rating Constraint.
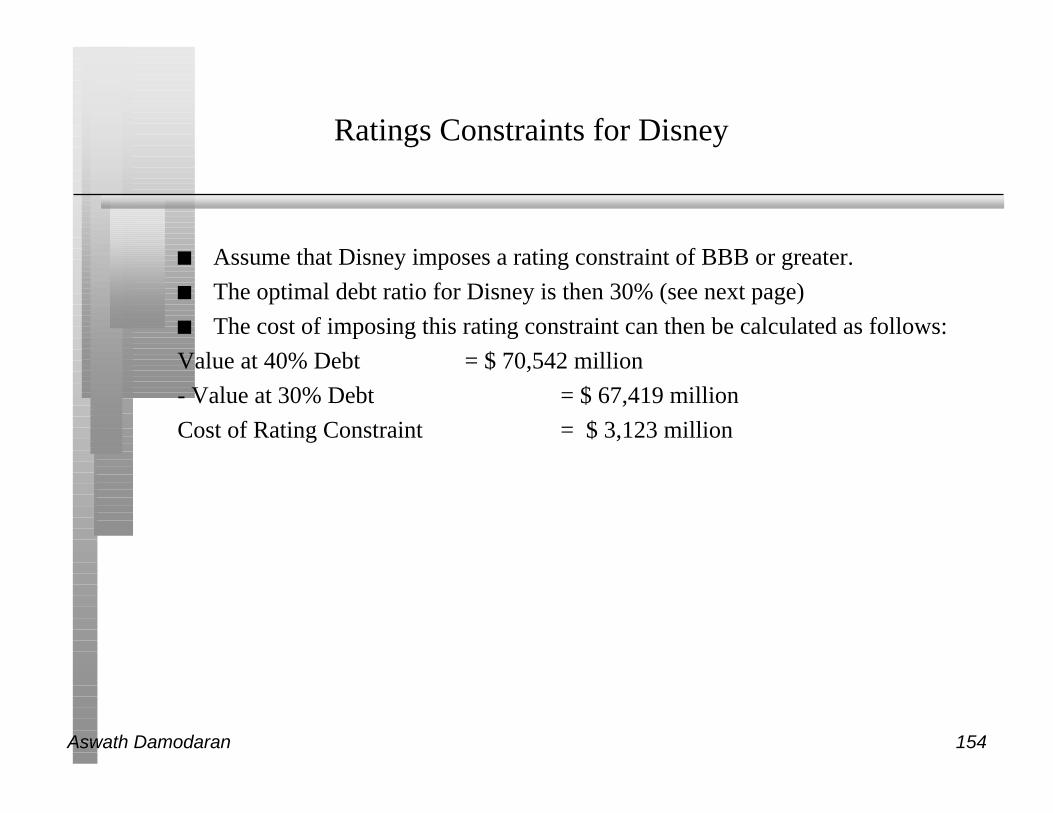
Aswath Damodaran 154
Ratings Constraints for Disney
n Assume that Disney imposes a rating constraint of BBB or greater.
n The optimal debt ratio for Disney is then 30% (see next page)
n The cost of imposing this rating constraint can then be calculated as follows:
Value at 40% Debt = $ 70,542 million
- Value at 30% Debt = $ 67,419 million
Cost of Rating Constraint = $ 3,123 million

Aswath Damodaran 155
Effect of A Ratings Constraint: Disney
Debt Ratio Rating Firm Value0% AAA $53,17210% AAA $58,01420% A+ $62,70530% A- $67,41940% BB $70,54250% B $69,56060% CCC $63,44570% CCC $65,52480% CCC $62,75190% CC $47,140

Aswath Damodaran 156
What if you do not buy back stock..
n The optimal debt ratio is ultimately a function of the underlying riskiness ofthe business in which you operate and your tax rate
n Will the optimal be different if you took projects instead of buying backstock?
• NO. As long as the projects financed are in the same business mix that thecompany has always been in and your tax rate does not change significantly.
• YES, if the projects are in entirely different types of businesses or if the tax rate issignificantly different.

Aswath Damodaran 157
Analyzing Financial Service Firms
n The interest coverage ratios/ratings relationship is likely to be different forfinancial service firms.
n The definition of debt is messy for financial service firms. In general, using alldebt for a financial service firm will lead to high debt ratios. Use only interest-bearing long term debt in calculating debt ratios.
n The effect of ratings drops will be much more negative for financial servicefirms.
n There are likely to regulatory constraints on capital

Aswath Damodaran 158
Interest Coverage ratios, ratings and Operating income
Interest Coverage Ratio Rating is Spread is Operating Income Decline
< 0.05 D 10.00% -50.00%
0.05 - 0.10 C 7.50% -40.00%
0.10 - 0.20 CC 6.00% -40.00%
0.20 - 0.30 CCC 5.00% -40.00%
0.30 - 0.40 B- 4.25% -25.00%
0.40 - 0.50 B 3.25% -20.00%
0.50 - 0.60 B+ 2.50% -20.00%
0.60 - 0.80 BB 2.00% -20.00%
0.80 - 1.00 BBB 1.50% -20.00%
1.00 - 1.50 A- 1.25% -17.50%
1.50 - 2.00 A 1.00% -15.00%
2.00 - 2.50 A+ 0.80% -10.00%
2.50 - 3.00 AA 0.50% -5.00%
> 3.00 AAA 0.20% 0.00%

Aswath Damodaran 159
Deutsche Bank: Optimal Capital Structure
Debt
Ratio
Cost of
Equity
Cost of Debt WACC Firm Value
0% 10.13% 4.24% 10.13% DM 124,288.85
10% 10.29% 4.24% 9.69% DM 132,558.74
20% 10.49% 4.24% 9.24% DM 142,007.59
30% 10.75% 4.24% 8.80% DM 152,906.88
40% 11.10% 4.24% 8.35% DM 165,618.31
50% 11.58% 4.24% 7.91% DM 165,750.19
60% 12.30% 4.40% 7.56% DM 162,307.44
70% 13.51% 4.57% 7.25% DM 157,070.00
80% 15.92% 4.68% 6.92% DM 151,422.87
90% 25.69% 6.24% 8.19% DM 30,083.27

Aswath Damodaran 160
Analyzing Companies after Abnormal Years
n The operating income that should be used to arrive at an optimal debt ratio is a“normalized” operating income
n A normalized operating income is the income that this firm would make in anormal year.
• For a cyclical firm, this may mean using the average operating income over aneconomic cycle rather than the latest year’s income
• For a firm which has had an exceptionally bad or good year (due to some firm-specific event), this may mean using industry average returns on capital to arrive atan optimal or looking at past years
• For any firm, this will mean not counting one time charges or profits

Aswath Damodaran 161
Analyzing a Private Firm
n The approach remains the same with important caveats• It is far more difficult estimating firm value, since the equity and the debt of
private firms do not trade
• Most private firms are not rated.
• If the cost of equity is based upon the market beta, it is possible that we might beoverstating the optimal debt ratio, since private firm owners often consider all risk.

Aswath Damodaran 162
7 Application Test: Your firm’s optimal financing mix
n Using the optimal capital structure spreadsheet provided:• Estimate the optimal debt ratio for your firm
• Estimate the new cost of capital at the optimal
• Estimate the effect of the change in the cost of capital on firm value
• Estimate the effect on the stock price
n In terms of the mechanics, what would you need to do to get to the optimalimmediately?

Aswath Damodaran 163
Determinants of Optimal Debt Ratios
n Firm Specific Factors• 1. Tax Rate
• Higher tax rates - - > Higher Optimal Debt Ratio
• Lower tax rates - - > Lower Optimal Debt Ratio
• 2. Pre-Tax Returns on Firm = EBITDA / MV of Firm
• Higher Pre-tax Returns - - > Higher Optimal Debt Ratio
• Lower Pre-tax Returns - - > Lower Optimal Debt Ratio
• 3. Variance in Earnings [ Shows up when you do 'what if' analysis]
• Higher Variance - - > Lower Optimal Debt Ratio
• Lower Variance - - > Higher Optimal Debt Ratio
n Macro-Economic Factors• 1. Default Spreads
Higher - - > Lower Optimal Debt Ratio
Lower - - > Higher Optimal Debt Ratio

Aswath Damodaran 164
A Framework for Getting to the Optimal
Is the actual debt ratio greater than or lesser than the optimal debt ratio?
Actual > OptimalOverlevered
Actual < OptimalUnderlevered
Is the firm under bankruptcy threat? Is the firm a takeover target?
Yes No
Reduce Debt quickly1. Equity for Debt swap2. Sell Assets; use cashto pay off debt3. Renegotiate with lenders
Does the firm have good projects?ROE > Cost of EquityROC > Cost of Capital
YesTake good projects withnew equity or with retainedearnings.
No1. Pay off debt with retainedearnings.2. Reduce or eliminate dividends.3. Issue new equity and pay off debt.
Yes No
Does the firm have good projects?ROE > Cost of EquityROC > Cost of Capital
YesTake good projects withdebt.
No
Do your stockholders likedividends?
YesPay Dividends No
Buy back stock
Increase leveragequickly1. Debt/Equity swaps2. Borrow money&buy shares.

Aswath Damodaran 165
Disney: Applying the Framework
Is the actual debt ratio greater than or lesser than the optimal debt ratio?
Actual > OptimalOverlevered
Actual < OptimalUnderlevered
Is the firm under bankruptcy threat? Is the firm a takeover target?
Yes No
Reduce Debt quickly1. Equity for Debt swap2. Sell Assets; use cashto pay off debt3. Renegotiate with lenders
Does the firm have good projects?ROE > Cost of EquityROC > Cost of Capital
YesTake good projects withnew equity or with retainedearnings.
No1. Pay off debt with retainedearnings.2. Reduce or eliminate dividends.3. Issue new equity and pay off debt.
Yes No
Does the firm have good projects?ROE > Cost of EquityROC > Cost of Capital
YesTake good projects withdebt.
No
Do your stockholders likedividends?
YesPay Dividends No
Buy back stock
Increase leveragequickly1. Debt/Equity swaps2. Borrow money&buy shares.

Aswath Damodaran 166
6 Application Test: Getting to the Optimal
n Based upon your analysis of both the firm’s capital structure and investmentrecord, what path would you map out for the firm?
o Immediate change in leverage
o Gradual change in leverage
o No change in leverage
n Would you recommend that the firm change its financing mix by
o Paying off debt/Buying back equity
o Take projects with equity/debt

Aswath Damodaran 167
Designing Debt: The Fundamental Principle
n The objective in designing debt is to make the cash flows on debt match up asclosely as possible with the cash flows that the firm makes on its assets.
n By doing so, we reduce our risk of default, increase debt capacity and increasefirm value.

Aswath Damodaran 168
Firm with mismatched debt
Firm Value
Value of Debt

Aswath Damodaran 169
Firm with matched Debt
Firm Value
Value of Debt

Aswath Damodaran 170
Design the perfect financing instrument
n The perfect financing instrument will• Have all of the tax advantages of debt
• While preserving the flexibility offered by equity
Duration Currency Effect of InflationUncertainty about Future
Growth PatternsCyclicality &Other Effects
Define DebtCharacteristics
Duration/Maturity
CurrencyMix
Fixed vs. Floating Rate* More floating rate - if CF move with inflation- with greater uncertainty on future
Straight versusConvertible- Convertible ifcash flows low now but highexp. growth
Special Featureson Debt- Options to make cash flows on debt match cash flows on assets
Start with the Cash Flowson Assets/Projects
Commodity BondsCatastrophe Notes
Design debt to have cash flows that match up to cash flows on the assets financed

Aswath Damodaran 171
Ensuring that you have not crossed the line drawn by the taxcode
n All of this design work is lost, however, if the security that you have designeddoes not deliver the tax benefits.
n In addition, there may be a trade off between mismatching debt and gettinggreater tax benefits.
Overlay taxpreferences
Deductibility of cash flowsfor tax purposes
Differences in tax ratesacross different locales
If tax advantages are large enough, you might override results of previous step
Zero Coupons
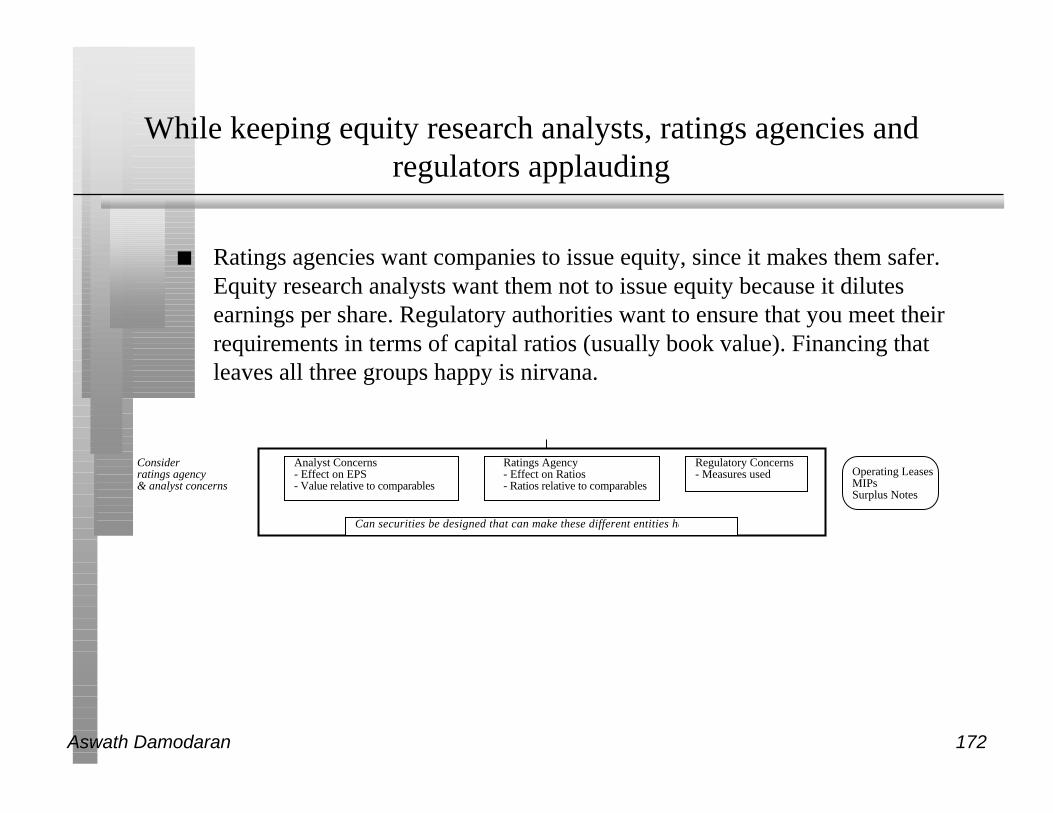
Aswath Damodaran 172
While keeping equity research analysts, ratings agencies andregulators applauding
n Ratings agencies want companies to issue equity, since it makes them safer.Equity research analysts want them not to issue equity because it dilutesearnings per share. Regulatory authorities want to ensure that you meet theirrequirements in terms of capital ratios (usually book value). Financing thatleaves all three groups happy is nirvana.
Consider ratings agency& analyst concerns
Analyst Concerns- Effect on EPS- Value relative to comparables
Ratings Agency- Effect on Ratios- Ratios relative to comparables
Regulatory Concerns- Measures used
Can securities be designed that can make these different entities happy?
Operating LeasesMIPsSurplus Notes

Aswath Damodaran 173
Debt or Equity: The Strange Case of Trust Preferred
n Trust preferred stock has• A fixed dividend payment, specified at the time of the issue
• That is tax deductible
• And failing to make the payment can cause ? (Can it cause default?)
n When trust preferred was first created, ratings agencies treated it as equity. Asthey have become more savvy, ratings agencies have started giving firms onlypartial equity credit for trust preferred.

Aswath Damodaran 174
Debt, Equity and Quasi Equity
n Assuming that trust preferred stock gets treated as equity by ratings agencies,which of the following firms is the most appropriate firm to be issuing it?
o A firm that is under levered, but has a rating constraint that would be violatedif it moved to its optimal
o A firm that is over levered that is unable to issue debt because of the ratingagency concerns.

Aswath Damodaran 175
Soothe bondholder fears
n There are some firms that face skepticism from bondholders when they go outto raise debt, because
• Of their past history of defaults or other actions
• They are small firms without any borrowing history
n Bondholders tend to demand much higher interest rates from these firms toreflect these concerns.
Factor in agencyconflicts between stockand bond holders
Observability of Cash Flowsby Lenders- Less observable cash flows lead to more conflicts
Type of Assets financed- Tangible and liquid assets create less agency problems
Existing Debt covenants- Restrictions on Financing
If agency problems are substantial, consider issuing convertible bonds
ConvertibilesPuttable BondsRating Sensitive
NotesLYONs

Aswath Damodaran 176
And do not lock in market mistakes that work against you
n Ratings agencies can sometimes under rate a firm, and markets can underprice a firm’s stock or bonds. If this occurs, firms should not lock in thesemistakes by issuing securities for the long term. In particular,
• Issuing equity or equity based products (including convertibles), when equity isunder priced transfers wealth from existing stockholders to the new stockholders
• Issuing long term debt when a firm is under rated locks in rates at levels that are fartoo high, given the firm’s default risk.
n What is the solution• If you need to use equity?
• If you need to use debt?

Aswath Damodaran 177
Designing Debt: Bringing it all together
Duration Currency Effect of InflationUncertainty about Future
Growth PatternsCyclicality &Other Effects
Define DebtCharacteristics
Duration/Maturity
CurrencyMix
Fixed vs. Floating Rate* More floating rate - if CF move with inflation- with greater uncertainty on future
Straight versusConvertible- Convertible ifcash flows low now but highexp. growth
Special Featureson Debt- Options to make cash flows on debt match cash flows on assets
Start with the Cash Flowson Assets/Projects
Overlay taxpreferences
Deductibility of cash flowsfor tax purposes
Differences in tax ratesacross different locales
Consider ratings agency& analyst concerns
Analyst Concerns- Effect on EPS- Value relative to comparables
Ratings Agency- Effect on Ratios- Ratios relative to comparables
Regulatory Concerns- Measures used
Factor in agencyconflicts between stockand bond holders
Observability of Cash Flowsby Lenders- Less observable cash flows lead to more conflicts
Type of Assets financed- Tangible and liquid assets create less agency problems
Existing Debt covenants- Restrictions on Financing
Consider Information Asymmetries
Uncertainty about Future Cashflows- When there is more uncertainty, itmay be better to use short term debt
Credibility & Quality of the Firm- Firms with credibility problemswill issue more short term debt
If agency problems are substantial, consider issuing convertible bonds
Can securities be designed that can make these different entities happy?
If tax advantages are large enough, you might override results of previous step
Zero Coupons
Operating LeasesMIPsSurplus Notes
ConvertibilesPuttable BondsRating Sensitive
NotesLYONs
Commodity BondsCatastrophe Notes
Design debt to have cash flows that match up to cash flows on the assets financed

Aswath Damodaran 178
Coming up with the financing details: Intuitive Approach
Business Project Cash Flow Characteristics Type of Financing
Creative
Content
Projects are likely to
1. be short term
2. have cash outflows are primarily in dollars (but cash inflows
could have a substantial foreign currency component
3. have net cash flows which are heavily driven by whether the
movie or T.V series is a “hit”
Debt should be
1. short term
2. primarily dollar
3. if possible, tied to the
success of movies.
Retailing Projects are likely to be
1. medium term (tied to store life)
2. primarily in dollars (most in US still)
3. cyclical
Debt should be in the form
of operating leases.
Broadcasting Projects are likely to be
1. short term
2. primarily in dollars, though foreign component is growing
3. driven by advertising revenues and show success
Debt should be
1. short term
2. primarily dollar debt
3. if possible, linked to
network ratings.

Aswath Damodaran 179
Financing Details: Other Divisions
Theme Parks Projects are likely to be
1. very long term
2. primarily in dollars, but a significant proportion of revenues
come from foreign tourists.
3. affected by success of movie and broadcasting divisions.
Debt should be
1. long term
2. mix of currencies, based
upon tourist make up.
Real Estate Projects are likely to be
1. long term
2. primarily in dollars.
3. affected by real estate values in the area
Debt should be
1. long term
2. dollars
3. real-estate linked
(Mortgage Bonds)

Aswath Damodaran 180
6 Application Test: Choosing your Financing Type
n Based upon the business that your firm is in, and the typical investments that itmakes, what kind of financing would you expect your firm to use in terms of
• Duration (long term or short term)
• Currency
• Fixed or Floating rate
• Straight or Convertible

Aswath Damodaran 181
First Principles
n Invest in projects that yield a return greater than the minimum acceptablehurdle rate.
• The hurdle rate should be higher for riskier projects and reflect the financing mixused - owners’ funds (equity) or borrowed money (debt)
• Returns on projects should be measured based on cash flows generated and thetiming of these cash flows; they should also consider both positive and negativeside effects of these projects.
n Choose a financing mix that minimizes the hurdle rate and matches theassets being financed.
n If there are not enough investments that earn the hurdle rate, return the cash tostockholders.
• The form of returns - dividends and stock buybacks - will depend upon thestockholders’ characteristics.

Aswath Damodaran 182
Returning Cash to the Owners: DividendPolicy
Aswath Damodaran

Aswath Damodaran 183
First Principles
n Invest in projects that yield a return greater than the minimum acceptablehurdle rate.
• The hurdle rate should be higher for riskier projects and reflect the financing mixused - owners’ funds (equity) or borrowed money (debt)
• Returns on projects should be measured based on cash flows generated and thetiming of these cash flows; they should also consider both positive and negativeside effects of these projects.
n Choose a financing mix that minimizes the hurdle rate and matches the assetsbeing financed.
n If there are not enough investments that earn the hurdle rate, return thecash to stockholders.
• The form of returns - dividends and stock buybacks - will depend upon thestockholders’ characteristics.

Aswath Damodaran 184
Dividends are sticky
Dividend Changes: Publicly owned firm - 1981-90
0
1000
2000
3000
4000
5000
6000
7000
800019
81
1982
1983
1984
1985
1986
1987
1988
1989
1990
Increases Decreases No Change
Aswath Damodaran 185
Dividends tend to follow earnings
Figure 10.1: Aggregate Earnings and Dividends: S & P 500 - 1960-1996
0
5
10
15
20
25
30
35
40
1960
1962
1964
1966
1968
1970
1972
1974
1976
1978
1980
1982
1984
1986
1988
1990
1992
1994
1996
Year
$
EarningsDividends

Aswath Damodaran 186
More and more firms are buying back stock, rather than paydividends...
Figure 22.1: Stock Buybacks and Dividends: Aggregate for US Firms - 1989-98
$-
$50,000.00
$100,000.00
$150,000.00
$200,000.00
$250,000.00
1988 1989 1990 1991 1992 1993 1994 1995 1996 1997 1998
Year
Stock Buybacks Dividends

Aswath Damodaran 187
Measures of Dividend Policy
n Dividend Payout:• measures the percentage of earnings that the company pays in dividends
• = Dividends / Earnings
n Dividend Yield :• measures the return that an investor can make from dividends alone
• = Dividends / Stock Price

Aswath Damodaran 188
Dividend Payout Ratios in the US
Figure 10.8: Dividend Payout Ratios for U.S. firms - September 1997
0
200
400
600
800
1000
1200
1400
1600
1800
0%
0-1
0%
10
-20
%
20
-30
%
30
-40
%
40
-50
%
50
-60
%
60
-70
%
70
-80
%
80
-90
%
90
-10
0%
>1
00
%
Dividend Payout Ratio
Num
ber
of
Fir
ms

Aswath Damodaran 189
Dividend Yields in the US
Figure 10.6: Dividend Yields for U.S. Firms - September 1997
0
200
400
600
800
1000
1200
1400
1600
1800
2000
0% 0 -1% 1 - 2% 2- 3% 3 - 4% 4 - 5% 5 - 6% 6 - 7% >7%
Dividend Yield
Num
ber
of
Fir
ms

Aswath Damodaran 190
Three Schools Of Thought On Dividends
n 1. If • (a) there are no tax disadvantages associated with dividends
• (b) companies can issue stock, at no cost, to raise equity, whenever needed
• Dividends do not matter, and dividend policy does not affect value.n 2. If dividends have a tax disadvantage,
• Dividends are bad, and increasing dividends will reduce valuen 3. If stockholders like dividends, or dividends operate as a signal of future prospects,
• Dividends are good, and increasing dividends will increase value
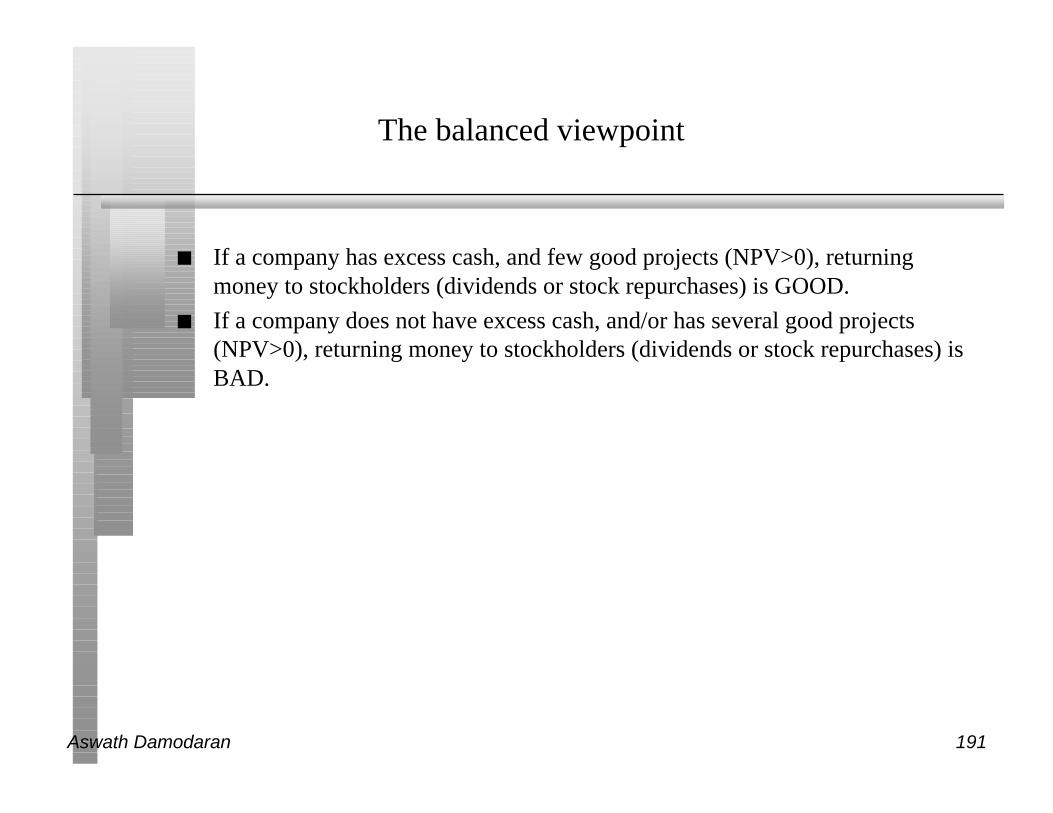
Aswath Damodaran 191
The balanced viewpoint
n If a company has excess cash, and few good projects (NPV>0), returningmoney to stockholders (dividends or stock repurchases) is GOOD.
n If a company does not have excess cash, and/or has several good projects(NPV>0), returning money to stockholders (dividends or stock repurchases) isBAD.

Aswath Damodaran 192
Questions to Ask in Dividend Policy Analysis
n How much could the company have paid out during the period underquestion?
n How much did the the company actually pay out during the period inquestion?
n How much do I trust the management of this company with excess cash?• How well did they make investments during the period in question?
• How well has my stock performed during the period in question?

Aswath Damodaran 193
A Measure of How Much a Company Could have Affordedto Pay out: FCFE
n The Free Cashflow to Equity (FCFE) is a measure of how much cash is left inthe business after non-equity claimholders (debt and preferred stock) havebeen paid, and after any reinvestment needed to sustain the firm’s assets andfuture growth.
Net Income
+ Depreciation & Amortization
= Cash flows from Operations to Equity Investors
- Preferred Dividends
- Capital Expenditures
- Working Capital Needs
- Principal Repayments
+ Proceeds from New Debt Issues
= Free Cash flow to Equity

Aswath Damodaran 194
Estimating FCFE when Leverage is Stable
Net Income
- (1- δ) (Capital Expenditures - Depreciation)
- (1- δ) Working Capital Needs
= Free Cash flow to Equity
δ = Debt/Capital Ratio
For this firm,• Proceeds from new debt issues = Principal Repayments + d (Capital Expenditures
- Depreciation + Working Capital Needs)

Aswath Damodaran 195
An Example: FCFE Calculation
n Consider the following inputs for Microsoft in 1996. In 1996, Microsoft’sFCFE was:
• Net Income = $2,176 Million
• Capital Expenditures = $494 Million
• Depreciation = $ 480 Million
• Change in Non-Cash Working Capital = $ 35 Million
• Debt Ratio = 0%
n FCFE = Net Income - (Cap ex - Depr) (1-DR) - Chg WC (!-DR) = $ 2,176 - (494 - 480) (1-0) - $ 35 (1-0)
= $ 2,123 Million

Aswath Damodaran 196
Microsoft: Dividends?
n By this estimation, Microsoft could have paid $ 2,123 Million individends/stock buybacks in 1996. They paid no dividends and bought back nostock. Where will the $2,123 million show up in Microsoft’s balance sheet?

Aswath Damodaran 197
Dividends versus FCFE: U.S.
Figure 11.1: Dividends/FCFE : NYSE Firms in 1996
0
200
400
600
800
1000
1200
1400
1600
1800
0%
0 -
10
%
10
-2
0%
20
- 3
0%
30
- 4
0%
40
-50
%
50
- 6
0%
60
-7
0%
70
- 8
0%
80
-9
0%
90
- 1
00
%
> 1
00
%
Dividends/FCFE
Num
ber
of
Fir
ms

Aswath Damodaran 198
The Consequences of Failing to pay FCFE
Chrysler: FCFE, Dividends and Cash Balance
($500)
$0
$500
$1,000
$1,500
$2,000
$2,500
$3,000
1985 1986 1987 1988 1989 1990 1991 1992 1993 1994
Year
Cas
h F
low
$0
$1,000
$2,000
$3,000
$4,000
$5,000
$6,000
$7,000
$8,000
$9,000
Cas
h B
alan
ce
= Free CF to Equity = Cash to Stockholders Cumulated Cash

Aswath Damodaran 199
6 Application Test: Estimating your firm’s FCFE
n For the most recent year, estimate the free cash flow to equity at your firmusing the following formulation
In General, If cash flow statement usedNet Income Net Income
+ Depreciation & Amortization + Depreciation & Amortization
- Capital Expenditures + Capital Expenditures
- Change in Non-Cash Working Capital + Changes in Non-cash WC
- Preferred Dividend + Preferred Dividend
- Principal Repaid + Increase in LT Borrowing
+ New Debt Issued + Decrease in LT Borrowing
+ Change in ST Borrowing
= FCFE = FCFE

Aswath Damodaran 200
A Practical Framework for Analyzing Dividend Policy
How much did the firm pay out? How much could it have afforded to pay out?What it could have paid out What it actually paid outNet Income Dividends- (Cap Ex - Depr’n) (1-DR) + Equity Repurchase- Chg Working Capital (1-DR)= FCFE
Firm pays out too littleFCFE > Dividends
Firm pays out too muchFCFE < Dividends
Do you trust managers in the company withyour cash?Look at past project choice:Compare ROE to Cost of Equity
ROC to WACC
What investment opportunities does the firm have?Look at past project choice:Compare ROE to Cost of Equity
ROC to WACC
Firm has history of good project choice and good projects in the future
Firm has historyof poor project choice
Firm has good projects
Firm has poor projects
Give managers the flexibility to keep cash and set dividends
Force managers to justify holding cash or return cash to stockholders
Firm should cut dividends and reinvest more
Firm should deal with its investment problem first and then cut dividends
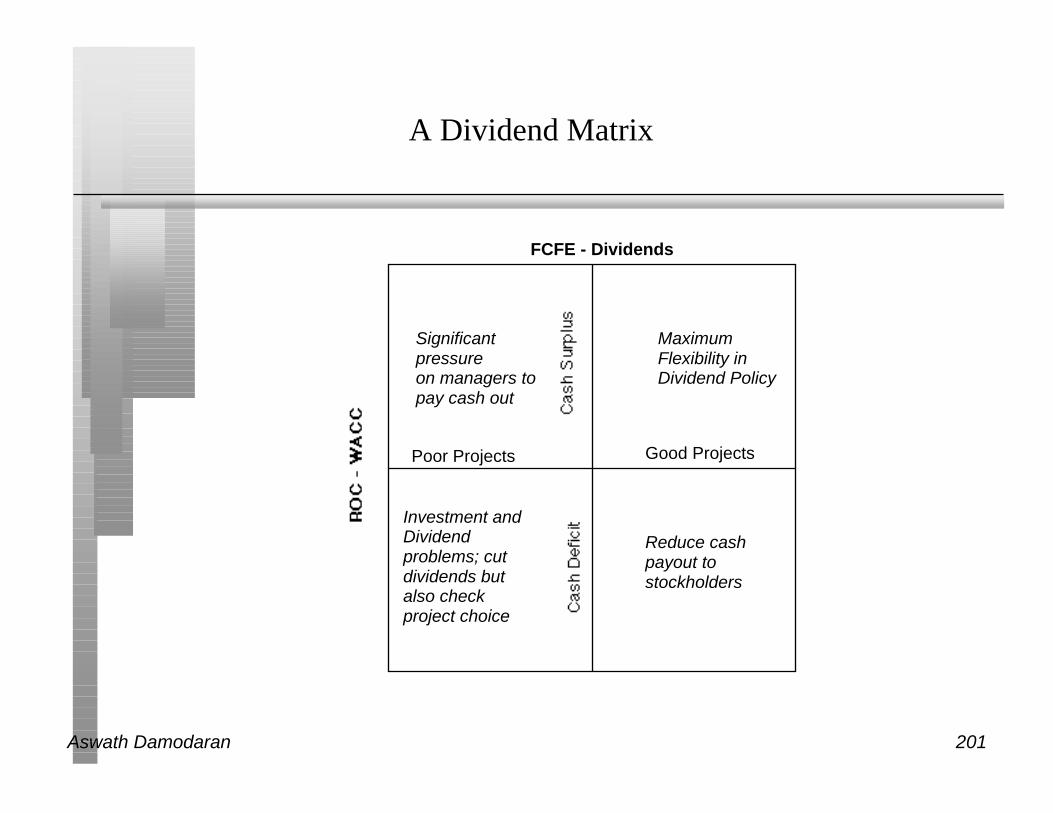
Aswath Damodaran 201
A Dividend Matrix
FCFE - Dividends
Good ProjectsPoor Projects
MaximumFlexibility in Dividend Policy
Reduce cash payout to stockholders
Significant pressureon managers to pay cash out
Investment and Dividend problems; cut dividends but also check project choice

Aswath Damodaran 202
Disney: An analysis of FCFE from 1992-1996
Year Net Income (Cap Ex- Depr) Chg in WC FCFE
(1- Debt Ratio) (1-Debt Ratio)
1992 $817 $173 ($81) $725
1993 $889 $328 $161 $400
1994 $1,110 $469 $498 $143
1995 $1,380 $325 $206 $829
1996* $1,214 $466 ($470) $1,218
Avge $1,082 $352 ($63) $667
(The numbers for 1996 are reported without the Capital Cities Acquisition)
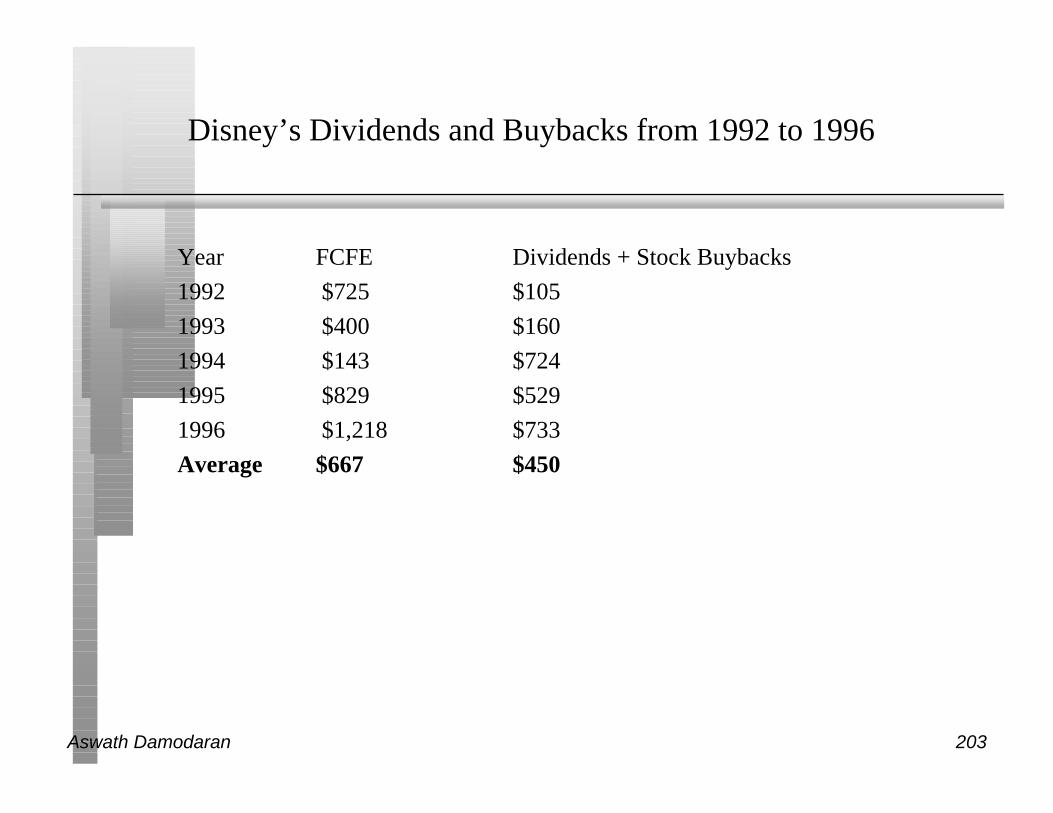
Aswath Damodaran 203
Disney’s Dividends and Buybacks from 1992 to 1996
Year FCFE Dividends + Stock Buybacks
1992 $725 $105
1993 $400 $160
1994 $143 $724
1995 $829 $529
1996 $1,218 $733
Average $667 $450

Aswath Damodaran 204
Disney: Dividends versus FCFE
n Disney paid out $ 217 million less in dividends (and stock buybacks) than itcould afford to pay out. How much cash do you think Disney accumulatedduring the period?

Aswath Damodaran 205
Can you trust Disney’s management?
n During the period 1992-1996, Disney had• an average return on equity of 21.07% on projects taken
• earned an average return on 21.43% for its stockholders
• a cost of equity of 19.09%
n Disney has taken good projects and earned above-market returns for itsstockholders during the period.
n If you were a Disney stockholder, would you be comfortable with Disney’sdividend policy?
o Yes
o No

Aswath Damodaran 206
Disney: Return Performance Trends
Returns on Equity, Stock and Required Returns - Disney
-10.00%
0.00%
10.00%
20.00%
30.00%
40.00%
50.00%
60.00%
1992 1993 1994 1995 1996
Year
ROEReturns on StockRequired Return
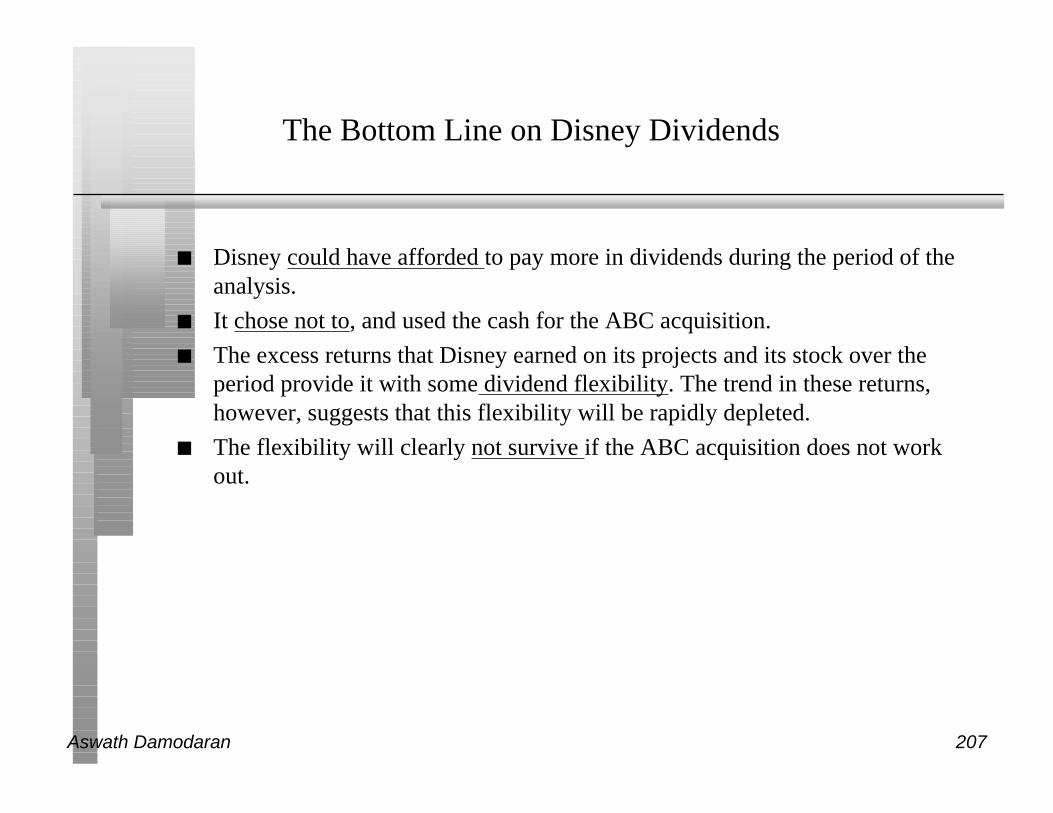
Aswath Damodaran 207
The Bottom Line on Disney Dividends
n Disney could have afforded to pay more in dividends during the period of theanalysis.
n It chose not to, and used the cash for the ABC acquisition.
n The excess returns that Disney earned on its projects and its stock over theperiod provide it with some dividend flexibility. The trend in these returns,however, suggests that this flexibility will be rapidly depleted.
n The flexibility will clearly not survive if the ABC acquisition does not workout.

Aswath Damodaran 208
Aracruz: Dividends and FCFE: 1994-1996
1994 1995 1996Net Income BR248.21 BR326.42 BR47.00 - (Cap. Exp - Depr)*(1-DR) BR174.76 BR197.20 BR14.96 - ∂ Working Capital*(1-DR) (BR47.74) BR15.67 (BR23.80) = Free CF to Equity BR121.19 BR113.55 BR55.84
Dividends BR80.40 BR113.00 BR27.00 + Equity Repurchases BR 0.00 BR 0.00 BR 0.00 = Cash to Stockholders BR80.40 BR113.00 BR27.00
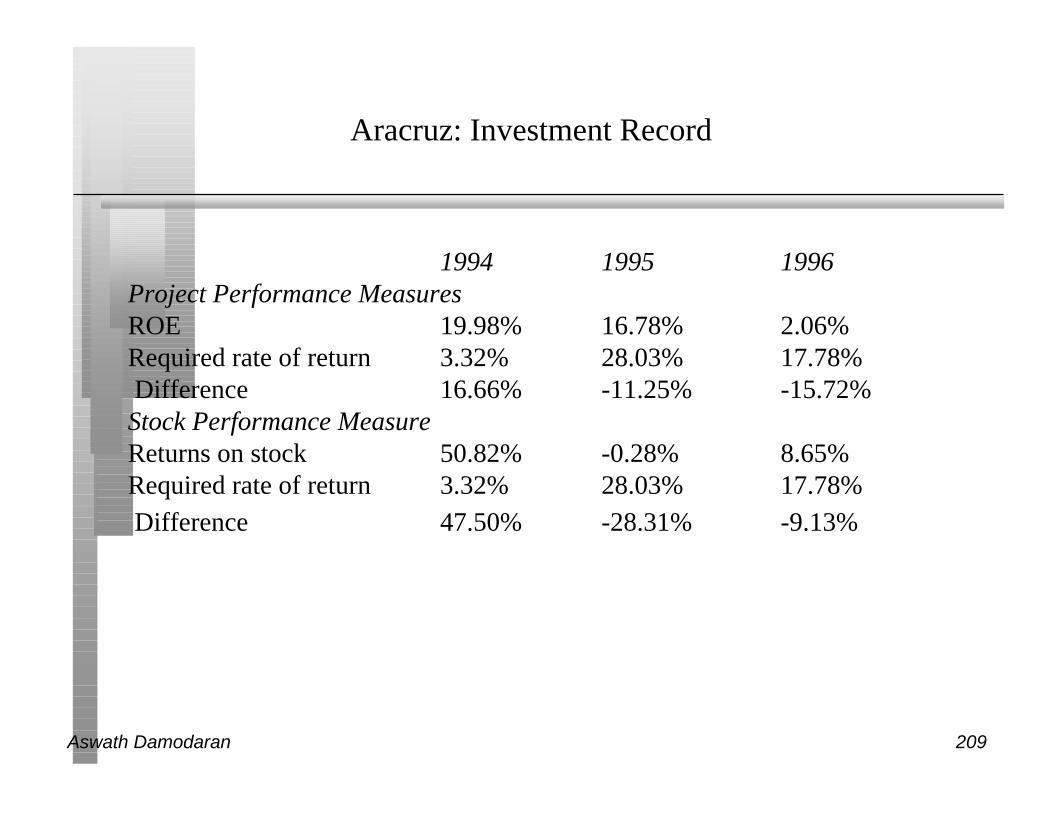
Aswath Damodaran 209
Aracruz: Investment Record
1994 1995 1996Project Performance MeasuresROE 19.98% 16.78% 2.06%Required rate of return 3.32% 28.03% 17.78% Difference 16.66% -11.25% -15.72%Stock Performance MeasureReturns on stock 50.82% -0.28% 8.65%Required rate of return 3.32% 28.03% 17.78% Difference 47.50% -28.31% -9.13%

Aswath Damodaran 210
Aracruz: Its your call..
n Assume that you are a large stockholder in Aracruz. They have a history ofpaying less in dividends than they have available in FCFE and haveaccumulated a cash balance of roughly 1 billion BR (25% of the value of thefirm). Would you trust the managers at Aracruz with your cash?
o Yes
o No

Aswath Damodaran 211
Mandated Dividend Payouts
n There are many countries where companies are mandated to pay out a certainportion of their earnings as dividends. Given our discussion of FCFE, whattypes of companies will be hurt the most by these laws?
o Large companies making huge profits
o Small companies losing money
o High growth companies that are losing money
o High growth companies that are making money

Aswath Damodaran 212
BP: Dividends- 1983-92
1 2 3 4 5 6 7 8 9 10
Net Income $1,256.00 $1,626.00 $2,309.00 $1,098.00 $2,076.00 $2,140.00 $2,542.00 $2,946.00 $712.00 $947.00
- (Cap. Exp - Depr)*(1-DR) $1,499.00 $1,281.00 $1,737.50 $1,600.00 $580.00 $1,184.00 $1,090.50 $1,975.50 $1,545.50 $1,100.00
∂ Working Capital*(1-DR) $369.50 ($286.50) $678.50 $82.00 ($2,268.00) ($984.50) $429.50 $1,047.50 ($305.00) ($415.00)
= Free CF to Equity ($612.50) $631.50 ($107.00) ($584.00) $3,764.00 $1,940.50 $1,022.00 ($77.00) ($528.50) $262.00
Dividends $831.00 $949.00 $1,079.00 $1,314.00 $1,391.00 $1,961.00 $1,746.00 $1,895.00 $2,112.00 $1,685.00
+ Equity Repurchases
= Cash to Stockholders $831.00 $949.00 $1,079.00 $1,314.00 $1,391.00 $1,961.00 $1,746.00 $1,895.00 $2,112.00 $1,685.00
Dividend Ratios
Payout Ratio 66.16% 58.36% 46.73% 119.67% 67.00% 91.64% 68.69% 64.32% 296.63% 177.93%
Cash Paid as % of FCFE -135.67% 150.28% -1008.41% -225.00% 36.96% 101.06% 170.84% -2461.04% -399.62% 643.13%
Performance Ratios
1. Accounting Measure
ROE 9.58% 12.14% 19.82% 9.25% 12.43% 15.60% 21.47% 19.93% 4.27% 7.66%
Required rate of return 19.77% 6.99% 27.27% 16.01% 5.28% 14.72% 26.87% -0.97% 25.86% 7.12%
Difference -10.18% 5.16% -7.45% -6.76% 7.15% 0.88% -5.39% 20.90% -21.59% 0.54%

Aswath Damodaran 213
BP: Summary of Dividend Policy
Summary of calculations
Average Standard Deviation Maximum Minimum
Free CF to Equity $571.10 $1,382.29 $3,764.00 ($612.50)
Dividends $1,496.30 $448.77 $2,112.00 $831.00
Dividends+Repurchases $1,496.30 $448.77 $2,112.00 $831.00
Dividend Payout Ratio 84.77%
Cash Paid as % of FCFE 262.00%
ROE - Required return -1.67% 11.49% 20.90% -21.59%

Aswath Damodaran 214
BP: Just Desserts!

Aswath Damodaran 215
The Limited: Summary of Dividend Policy: 1983-1992
Summary of calculations
Average Standard Deviation Maximum Minimum
Free CF to Equity ($34.20) $109.74 $96.89 ($242.17)
Dividends $40.87 $32.79 $101.36 $5.97
Dividends+Repurchases $40.87 $32.79 $101.36 $5.97
Dividend Payout Ratio 18.59%
Cash Paid as % of FCFE -119.52%
ROE - Required return 1.69% 19.07% 29.26% -19.84%

Aswath Damodaran 216
Growth Firms and Dividends
n High growth firms are sometimes advised to initiate dividends because itsincreases the potential stockholder base for the company (since there are someinvestors - like pension funds - that cannot buy stocks that do not paydividends) and, by extension, the stock price. Do you agree with thisargument?
o Yes
o No
Why?

Aswath Damodaran 217
6 Application Test: Assessing your firm’s dividend policy
n Compare your firm’s dividends to its FCFE, looking at the last 5 years ofinformation.
n Based upon your earlier analysis of your firm’s project choices, would youencourage the firm to return more cash or less cash to its owners?
n If you would encourage it to return more cash, what form should it take(dividends versus stock buybacks)?

Aswath Damodaran 218
First Principles
n Invest in projects that yield a return greater than the minimum acceptablehurdle rate.
• The hurdle rate should be higher for riskier projects and reflect the financing mixused - owners’ funds (equity) or borrowed money (debt)
• Returns on projects should be measured based on cash flows generated and thetiming of these cash flows; they should also consider both positive and negativeside effects of these projects.
n Choose a financing mix that minimizes the hurdle rate and matches the assetsbeing financed.
n If there are not enough investments that earn the hurdle rate, return thecash to stockholders.
• The form of returns - dividends and stock buybacks - will depend upon thestockholders’ characteristics.

Aswath Damodaran 219
Valuation
Aswath Damodaran

Aswath Damodaran 220
First Principles
n Invest in projects that yield a return greater than the minimum acceptablehurdle rate.
• The hurdle rate should be higher for riskier projects and reflect the financing mixused - owners’ funds (equity) or borrowed money (debt)
• Returns on projects should be measured based on cash flows generated and thetiming of these cash flows; they should also consider both positive and negativeside effects of these projects.
n Choose a financing mix that minimizes the hurdle rate and matches the assetsbeing financed.
n If there are not enough investments that earn the hurdle rate, return the cash tostockholders.
• The form of returns - dividends and stock buybacks - will depend upon thestockholders’ characteristics.
Objective: Maximize the Value of the Firm

Aswath Damodaran 221
Discounted Cashflow Valuation: Basis for Approach
• where,
• n = Life of the asset
• CFt = Cashflow in period t
• r = Discount rate reflecting the riskiness of the estimated cashflows
Value = CFt
(1+ r)tt =1
t = n∑

Aswath Damodaran 222
Firm Valuation
n The value of the firm is obtained by discounting expected cashflows to thefirm, i.e., the residual cashflows after meeting all operating expenses andtaxes, but prior to debt payments, at the weighted average cost of capital,which is the cost of the different components of financing used by the firm,weighted by their market value proportions.
where,
CF to Firmt = Expected Cashflow to Firm in period t
WACC = Weighted Average Cost of Capital
Value of Firm = CF to Firmt
(1+ WACC)tt=1
t=n
∑

Aswath Damodaran 223
Estimating Inputs:I. Discount Rates
n Critical ingredient in discounted cashflow valuation. Errors in estimating thediscount rate or mismatching cashflows and discount rates can lead to seriouserrors in valuation.
n At an intutive level, the discount rate used should be consistent with both theriskiness and the type of cashflow being discounted.
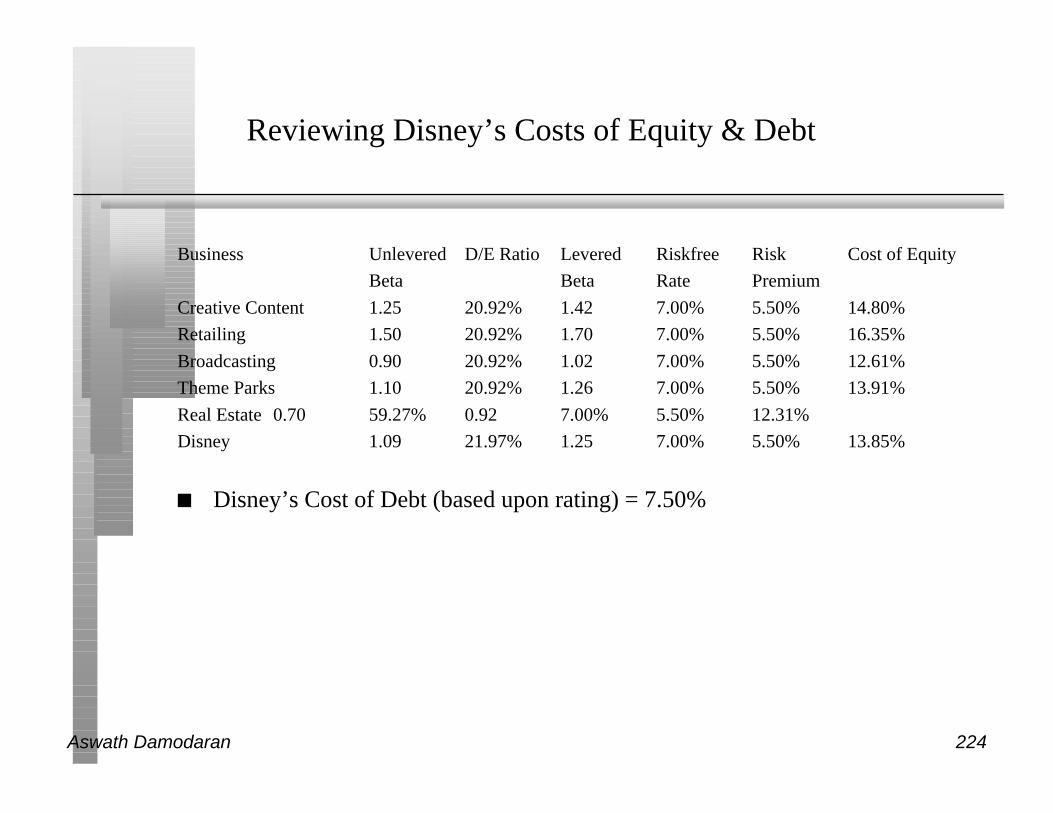
Aswath Damodaran 224
Reviewing Disney’s Costs of Equity & Debt
Business Unlevered D/E Ratio Levered Riskfree Risk Cost of Equity
Beta Beta Rate Premium
Creative Content 1.25 20.92% 1.42 7.00% 5.50% 14.80%
Retailing 1.50 20.92% 1.70 7.00% 5.50% 16.35%
Broadcasting 0.90 20.92% 1.02 7.00% 5.50% 12.61%
Theme Parks 1.10 20.92% 1.26 7.00% 5.50% 13.91%
Real Estate 0.70 59.27% 0.92 7.00% 5.50% 12.31%
Disney 1.09 21.97% 1.25 7.00% 5.50% 13.85%
n Disney’s Cost of Debt (based upon rating) = 7.50%

Aswath Damodaran 225
Estimating Cost of Capital: Disney
n Equity• Cost of Equity = 13.85%
• Market Value of Equity = $50.88 Billion
• Equity/(Debt+Equity ) = 82%
n Debt• After-tax Cost of debt = 7.50% (1-.36) = 4.80%
• Market Value of Debt = $ 11.18 Billion
• Debt/(Debt +Equity) = 18%
n Cost of Capital = 13.85%(.82)+4.80%(.18) = 12.22%

Aswath Damodaran 226
II. Estimating Current Cash Flow to the Firm
EBIT ( 1 - tax rate)
+ Depreciation
- Capital Spending
- Change in Working Capital
= Cash flow to the firm

Aswath Damodaran 227
Estimating FCFF: Disney
n EBIT = $5,559 Million
n Capital spending = $ 1,746 Million
n Depreciation = $ 1,134 Million
n Non-cash Working capital Change = $ 617 Million
n Estimating FCFFEBIT (1-t) $ 3,558
+ Depreciation $ 1,134
- Capital Expenditures $ 1,746
- Change in WC $ 617
= FCFF $ 2,329 Million

Aswath Damodaran 228
6 Application Test: Estimating your firm’s FCFF
n Estimate the FCFF for your firm in its most recent financial year:
In general, If using statement of cash flows
EBIT (1-t) EBIT (1-t)
+ Depreciation + Depreciation
- Capital Expenditures + Capital Expenditures
- Change in Non-cash WC + Change in Non-cash WC
= FCFF = FCFF
Estimate the dollar reinvestment at your firm:
Reinvestment = EBIT (1-t) - FCFF
With R&D, try this modified version
Reinvestment = EBIT (1-t) - FCFF + R&D

Aswath Damodaran 229
III. Expected Growth in EBIT And Fundamentals
n Reinvestment Rate and Return on Capital
gEBIT = (Net Capital Expenditures + Change in WC)/EBIT(1-t) * ROC= Reinvestment Rate * ROC
n Proposition 2: No firm can expect its operating income to grow over timewithout reinvesting some of the operating income in net capital expendituresand/or working capital.
n Proposition 3: The net capital expenditure needs of a firm, for a given growthrate, should be inversely proportional to the quality of its investments.

Aswath Damodaran 230
Estimating Growth in EBIT: Disney
Actual reinvestment rate in 1996 = (Net Cap Ex+ Chg in WC)/ EBIT (1-t)• Net Cap Ex in 1996 = (1745-1134)
• Change in Working Capital = 617
• EBIT (1- tax rate) = 5559(1-.36)
• Reinvestment Rate = (1745-1134+617)/(5559*.64)= 34.5%
n Forecasted Reinvestment Rate = 50%
n Return on Capital =18.69%
n Expected Growth in EBIT =.5(18.69%) = 9.35%
n The forecasted reinvestment rate is much higher than the actual reinvestmentrate in 1996, because it includes projected acquisition. Between 1992 and1996, adding in the Capital Cities acquisition to all capital expenditures wouldhave yielded a reinvestment rate of roughly 50%.

Aswath Damodaran 231
6 Application Test: Estimating Expected Growth
n Estimate the following:• The reinvestment rate for your firm
Reinvestment Rate = Reinvestment/ EBIT(1-t)
With R&D: Reinvestment Rate = (Reinvestment + R&D)/(EBIT(1-t) + R&D)
• The after-tax return on capital
• The expected growth in operating income, based upon these inputs
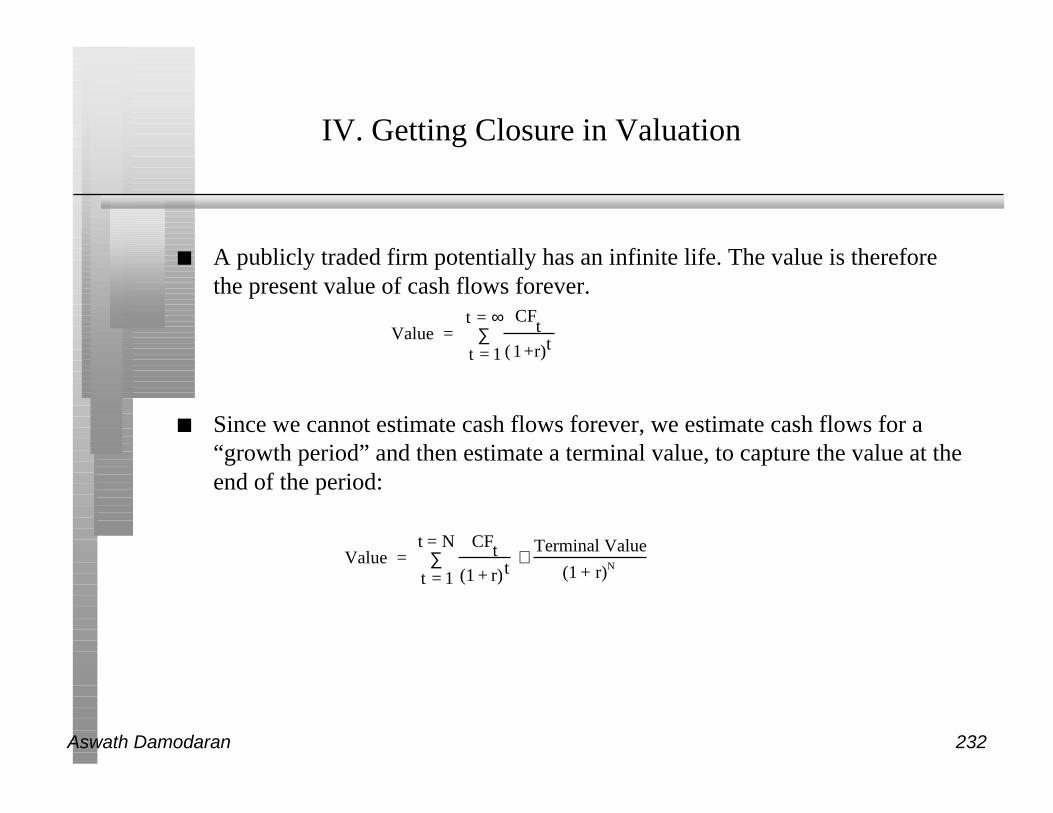
Aswath Damodaran 232
IV. Getting Closure in Valuation
n A publicly traded firm potentially has an infinite life. The value is thereforethe present value of cash flows forever.
n Since we cannot estimate cash flows forever, we estimate cash flows for a“growth period” and then estimate a terminal value, to capture the value at theend of the period:
Value = CF
t
(1+r)tt = 1
t = ∞∑
Value = CFt
(1 + r)t+
Terminal Value
(1 + r)N
t = 1
t = N∑

Aswath Damodaran 233
Stable Growth and Terminal Value
n When a firm’s cash flows grow at a “constant” rate forever, the present valueof those cash flows can be written as:
Value = Expected Cash Flow Next Period / (r - g)
where,
r = Discount rate (Cost of Equity or Cost of Capital)
g = Expected growth rate
n This “constant” growth rate is called a stable growth rate and cannot be higherthan the growth rate of the economy in which the firm operates.
n While companies can maintain high growth rates for extended periods, theywill all approach “stable growth” at some point in time.
n When they do approach stable growth, the valuation formula above can beused to estimate the “terminal value” of all cash flows beyond.

Aswath Damodaran 234
Growth Patterns
n A key assumption in all discounted cash flow models is the period of highgrowth, and the pattern of growth during that period. In general, we can makeone of three assumptions:
• there is no high growth, in which case the firm is already in stable growth
• there will be high growth for a period, at the end of which the growth rate will dropto the stable growth rate (2-stage)
• there will be high growth for a period, at the end of which the growth rate willdecline gradually to a stable growth rate(3-stage)
n The assumption of how long high growth will continue will depend uponseveral factors including:
• the size of the firm (larger firm -> shorter high growth periods)
• current growth rate (if high -> longer high growth period)
• barriers to entry and differential advantages (if high -> longer growth period)

Aswath Damodaran 235
Length of High Growth Period
n Assume that you are analyzing two firms, both of which are enjoying highgrowth. The first firm is Earthlink Network, an internet service provider,which operates in an environment with few barriers to entry and extraordinarycompetition. The second firm is Biogen, a bio-technology firm which isenjoying growth from two drugs to which it owns patents for the next decade.Assuming that both firms are well managed, which of the two firms would youexpect to have a longer high growth period?
o Earthlink Network
o Biogen
o Both are well managed and should have the same high growth period

Aswath Damodaran 236
Firm Characteristics as Growth Changes
Variable High Growth Firms tend to Stable Growth Firms tend to
Risk be above-average risk be average risk
Dividend Payout pay little or no dividends pay high dividends
Net Cap Ex have high net cap ex have low net cap ex
Return on Capital earn high ROC (excess return) earn ROC closer to WACC
Leverage have little or no debt higher leverage

Aswath Damodaran 237
Estimating Stable Growth Inputs
n Start with the fundamentals:• Profitability measures such as return on equity and capital, in stable growth, can be
estimated by looking at– industry averages for these measure, in which case we assume that this firm in stable
growth will look like the average firm in the industry
– cost of equity and capital, in which case we assume that the firm will stop earning excessreturns on its projects as a result of competition.
• Leverage is a tougher call. While industry averages can be used here as well, itdepends upon how entrenched current management is and whether they arestubborn about their policy on leverage (If they are, use current leverage; if theyare not; use industry averages)
n Use the relationship between growth and fundamentals to estimate payout andnet capital expenditures.
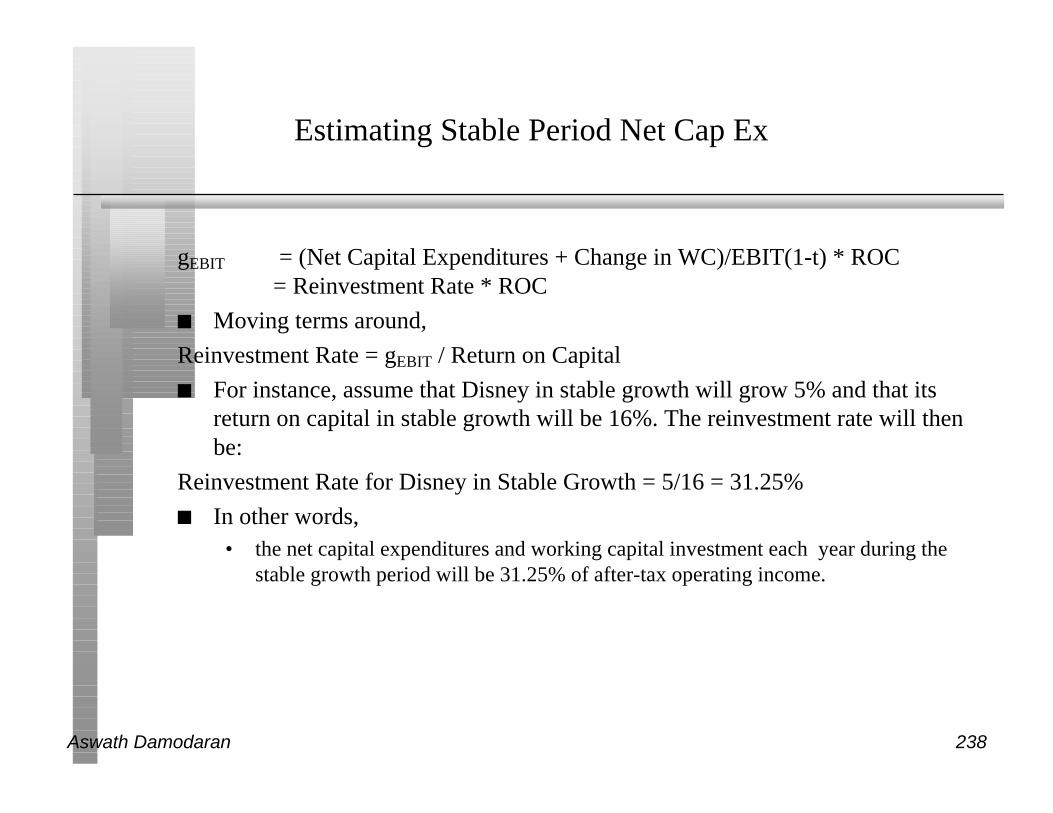
Aswath Damodaran 238
Estimating Stable Period Net Cap Ex
gEBIT = (Net Capital Expenditures + Change in WC)/EBIT(1-t) * ROC= Reinvestment Rate * ROC
n Moving terms around,
Reinvestment Rate = gEBIT / Return on Capital
n For instance, assume that Disney in stable growth will grow 5% and that itsreturn on capital in stable growth will be 16%. The reinvestment rate will thenbe:
Reinvestment Rate for Disney in Stable Growth = 5/16 = 31.25%
n In other words,• the net capital expenditures and working capital investment each year during the
stable growth period will be 31.25% of after-tax operating income.
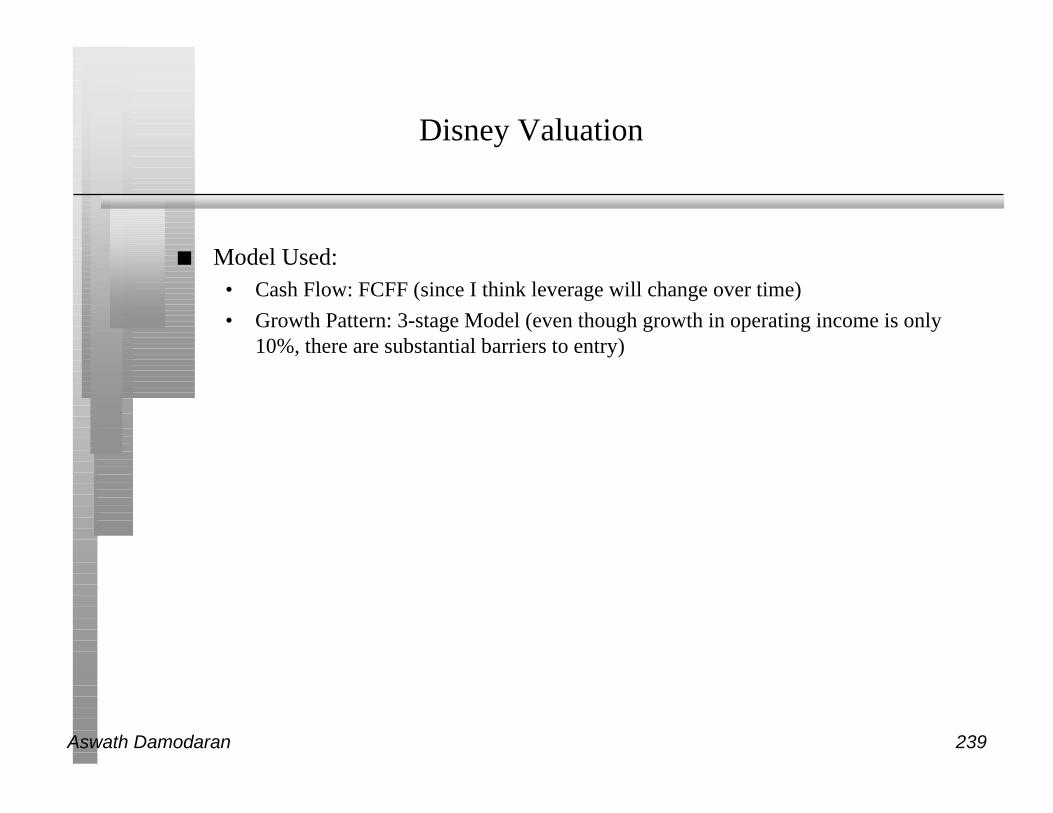
Aswath Damodaran 239
Disney Valuation
n Model Used:• Cash Flow: FCFF (since I think leverage will change over time)
• Growth Pattern: 3-stage Model (even though growth in operating income is only10%, there are substantial barriers to entry)

Aswath Damodaran 240
Disney: Inputs to Valuation
High Growth Phase Transition Phase Stable Growth Phase
Length of Period 5 years 5 years Forever after 10 years
Revenues Current Revenues: $ 18,739;
Expected to grow at same rate a
operating earnings
Continues to grow at same rate
as operating earnings
Grows at stable growth rate
Pre-tax Operating Margin 29.67% of revenues, based upon
1996 EBIT of $ 5,559 million.
Increases gradually to 32% of
revenues, due to economies of
scale.
Stable margin is assumed to be
32%.
Tax Rate 36% 36% 36%
Return on Capital 20% (approximately 1996 level) Declines linearly to 16% Stable ROC of 16%
Working Capital 5% of Revenues 5% of Revenues 5% of Revenues
Reinvestment Rate
(Net Cap Ex + Working Capital
Investments/EBIT)
50% of after-tax operating
income; Depreciation in 1996 is
$ 1,134 million, and is assumed
to grow at same rate as earnings
Declines to 31.25% as ROC
and growth rates drop:
Reinvestment Rate = g/ROC
31.25% of after-tax operating
income; this is estimated from
the growth rate of 5%
Reinvestment rate = g/ROC
Expected Growth Rate in EBIT ROC * Reinvestment Rate =
20% * .5 = 10%
Linear decline to Stable Growth
Rate
5%, based upon overall nominal
economic growth
Debt/Capital Ratio 18% Increases linearly to 30% Stable debt ratio of 30%
Risk Parameters Beta = 1.25, ke = 13.88%
Cost of Debt = 7.5%
(Long Term Bond Rate = 7%)
Beta decreases linearly to 1.00;
Cost of debt stays at 7.5%
Stable beta is 1.00.
Cost of debt stays at 7.5%

Aswath Damodaran 241
Cashflow to FirmEBIT(1-t) : 3,558- Nt CpX 612- Chg WC 617= FCFF 2,329
Expected Growth in EBIT (1-t).50*.20 = .1010.00%
1,966 2,163 2,379 2,617 2,879
Forever
Stable Growthg = 5%; Beta = 1.00; D/(D+E) = 30%; ROC=16%Reinvestment Rate=31.25%
Terminal Value 10= 6255/(.1019-.05) = 120,521
Cost of Equity13.85%
Cost of Debt(7%+ 0.50%)(1-.36)= 4.80%
WeightsE = 82% D = 18%
Discount at Cost of Capital (WACC) = 13.85% (0.82) + 4.8% (0.18) = 12.22%
57,817- 11,180= 46,637Per Share: 69.08
Riskfree Rate:Government Bond Rate = 7%
+Beta 1.25 X
Risk Premium5.5%
Unlevered Beta for Sectors: 1.09
Firm’s D/ERatio: 21.95%
Historical US Premium5.5%
Country RiskPremium0%
Disney: A ValuationReinvestment Rate50.00%
Return on Capital20%
3,370 3,932 4,552 5,228 5,957
TransitionBeta drops to 1.00Debt ratio rises to 30%
ROC drops to 16%Reinv. rate drops to 31.25%
Aswath Damodaran 242
Disney: FCFF Estimates
Base 1 2 3 4 5 6 7 8 9 10
Expected Growth 10% 10% 10% 10% 10% 9% 8% 7% 6% 5%
Revenues $ 18,739 $ 20,613 $ 22,674 $ 24,942 $ 27,436 $ 30,179 $ 32,895 $ 35,527 $ 38,014 $ 40,295 $ 42,310
Oper. Margin 29.67% 29.67% 29.67% 29.67% 29.67% 29.67% 30.13% 30.60% 31.07% 31.53% 32.00%
EBIT $ 5,559 $ 6,115 $ 6,726 $ 7,399 $ 8,139 $ 8,953 $ 9,912 $ 10,871 $ 11,809 $ 12,706 $ 13,539
EBIT (1-t) $ 3,558 $ 3,914 $ 4,305 $ 4,735 $ 5,209 $ 5,730 $ 6,344 $ 6,957 $ 7,558 $ 8,132 $ 8,665
+ Depreciation $ 1,134 $ 1,247 $ 1,372 $ 1,509 $ 1,660 $ 1,826 $ 2,009 $ 2,210 $ 2,431 $ 2,674 $ 2,941
- Capital Exp. $ 1,754 $ 3,101 $ 3,411 $ 3,752 $ 4,128 $ 4,540 $ 4,847 $ 5,103 $ 5,313 $ 5,464 $ 5,548
- Change in WC $ 94 $ 94 $ 103 $ 113 $ 125 $ 137 $ 136 $ 132 $ 124 $ 114 $ 101
= FCFF $ 1,779 $ 1,966 $ 2,163 $ 2,379 $ 2,617 $ 2,879 $ 3,370 $ 3,932 $ 4,552 $ 5,228 $ 5,957
ROC 20% 20% 20% 20% 20% 20% 19.2% 18.4% 17.6% 16.8% 16%
Reinv. Rate 50% 50% 50% 50% 50% 46.875% 43.48% 39.77% 35.71% 31.25%

Aswath Damodaran 243
Disney: Costs of Capital
Year 1 2 3 4 5 6 7 8 9 10
Cost of Equity 13.88% 13.88% 13.88% 13.88% 13.88% 13.60% 13.33% 13.05% 12.78% 12.50%
Cost of Debt 4.80% 4.80% 4.80% 4.80% 4.80% 4.80% 4.80% 4.80% 4.80% 4.80%
Debt Ratio 18.00% 18.00% 18.00% 18.00% 18.00% 20.40% 22.80% 25.20% 27.60% 30.00%
Cost of Capital 12.22% 12.22% 12.22% 12.22% 12.22% 11.80% 11.38% 10.97% 10.57% 10.19%

Aswath Damodaran 244
Disney: Terminal Value
n The terminal value at the end of year 10 is estimated based upon the free cashflows to the firm in year 11 and the cost of capital in year 11.
n FCFF11 = EBIT (1-t) - EBIT (1-t) Reinvestment Rate
= $ 13,539 (1.05) (1-.36) - $ 13,539 (1.05) (1-.36) (.3125)
= $ 6,255 million
n Note that the reinvestment rate is estimated from the cost of capital of 16%and the expected growth rate of 5%.
n Cost of Capital in terminal year = 10.19%
n Terminal Value = $ 6,255/(.1019 - .05) = $ 120,521 million

Aswath Damodaran 245
Disney: Present Value
Year 1 2 3 4 5 6 7 8 9 10
FCFF $ 1,966 $ 2,163 $ 2,379 $ 2,617 $ 2,879 $ 3,370 $ 3,932 $ 4,552 $ 5,228 $ 5,957
Term Value 120,521
Present Value $ 1,752 $ 1,717 $ 1,682 $1,649 $1,616 $ 1,692 $1,773 $ 1,849 $ 1,920 42,167
Cost of Capital 12.22% 12.22% 12.22% 12.22% 12.22% 11.80% 11.38% 10.97% 10.57% 10.19%
PV from year 7 = 3,932/[(1.1222)5 (1.118)(1.1138)]
Aswath Damodaran 246
The Investment DecisionInvest in projects that yield a return
greater than the minimum acceptablehurdle rate
The Financing DecisionChoose a financing mix that
maximizes the value of the projectstaken, and matches the assets being
financed.
The Dividend DecisionIf there are not enough
investments that earn thehurdle rate, return the cash to
the owners
CurrentEBIT(1-t) = $3,558 million
Return on Capital20.00%
Reinvestment Rate50%
Expected Growth = ROC * RR= .50 * 20%= 10%
Cost of Capital12.22%
Determine the business risk of the firm (Beta, Default Risk)
Equity:Beta=1.25
Debt::Default Risk
In stable growth:Reinvestment Rate=31.67%Return on Capital = 16%Beta = 1.00Debt Ratio = 30.00%Cost of Capital = 10.19%
Transition tostable growthinputs
Year EBIT(1-t) Reinvestment FCFF Terminal Value PV1 3,914$ 1,947$ 1,966$ 1,752$ 2 4,305$ 2,142$ 2,163$ 1,717$ 3 4,735$ 2,356$ 2,379$ 1,682$ 4 5,209$ 2,343$ 2,866$ 1,649$ 5 5,730$ 2,851$ 2,879$ 1,616$ 6 6,344$ 2,974$ 3,370$ 1,692$ 7 6,957$ 2,762$ 4,196$ 1,773$ 8 7,558$ 3,006$ 4,552$ 1,849$ 9 8,132$ 2,904$ 5,228$ 1,920$
10 8,665$ 2,708$ 5,957$ 120,521$ 42,167$ 57,817$
$11,18046,637$ 69.08$
Value of Disney =
= Value of Equity - Value of Debt =
Value of Disney/share =

Aswath Damodaran 247
First Principles
n Invest in projects that yield a return greater than the minimum acceptablehurdle rate.
• The hurdle rate should be higher for riskier projects and reflect the financing mixused - owners’ funds (equity) or borrowed money (debt)
• Returns on projects should be measured based on cash flows generated and thetiming of these cash flows; they should also consider both positive and negativeside effects of these projects.
n Choose a financing mix that minimizes the hurdle rate and matches the assetsbeing financed.
n If there are not enough investments that earn the hurdle rate, return the cash tostockholders.
• The form of returns - dividends and stock buybacks - will depend upon thestockholders’ characteristics.
Objective: Maximize the Value of the Firm


