
CORPORATE SUSTAINABILITY DATA SUPPLEMENT 2020

Corporate Sustainability Data Supplement 2020
SUSTAINABLY DRIVEN 2020 DATA SUPPLEMENTThis report covers Canadian Pacific Railway Limited (“CPRL”) and its subsidiaries’ (“CP” or the “Company”) activities and performance across our entire network in Canada and the U.S. CPRL is a holding company and is the direct parent company of Canadian Pacific Railway Company (“CPRC”). CPRC is a common carrier that conducts railway operations in Canada. CPRC has network access to the U.S. market directly through four wholly owned subsidiaries: Soo Line Railroad Company (“SOO Line”), a Class 1 railway operating in the U.S. Midwest; Dakota, Minnesota and Eastern Railroad (“DM&E”), which operates in the U.S. Midwest; Delaware and Hudson Railway Company, Inc. (“D&H”), which operates between Eastern Canada and the U.S. Northeast; and effective June 2020, Central Maine & Québec Railway US Inc. (“CMQ US”), which operates in Maine and Vermont.
For more information or questions regarding this report or sustainability at CP, contact [email protected].
• Certain figures in the following tables have been restated from previous sustainability reports to reflect new information or changes to tracking systems and/or reporting practices.
• All currency-related values are reported in Canadian dollars, except for community investment numbers and initiatives, which are reported in Canadian and U.S. dollars.
CONTENTS
02 ABOUT CP
06 SAFETY
08 OPERATIONAL EXCELLENCE
16 SOCIAL IMPACT
1

Corporate Sustainability Data Supplement 2020 2
ABOUT CP102-7 201-1 SASB TR-RA-000.A, B, D
Economic Impact Units 2016 2017 2018 2019 2020
Economic Value Generated
Total Revenues1 $ Millions 6,232 6,554 7,316 7,792 7,710
Canada $ Millions 4,473 4,667 5,232 5,675 5,829
U.S. $ Millions 1,759 1,887 2,084 2,117 1,881
Economic Value Distributed
Total Operating Expenses2 $ Millions 3,821 4,035 4,485 4,668 4,399
Canada $ Millions 2,706 2,816 3,199 3,314 3,209
U.S. $ Millions 1,115 1,219 1,286 1,354 1,190
Compensation & Benefits3 $ Millions 1,356 1,309 1,468 1,540 1,560
Capital Expenditures4 $ Millions 1,205 1,366 1,574 1,664 1,688
Payments to Providers of Capital5 $ Millions 1,932 1,121 1,890 1,964 2,367
Payments to Government6 $ Millions 438 546 442 639 708
1 Total Revenues includes all freight and non-freight revenue. Freight revenues are generated from goods or property transported. Non-freight revenues are generated from leasing certain assets; other arrangements, including logistical services and contracts with passenger service operators; and switching fees. CP’s total revenues decreased by 1% in 2020 from 2019, driven primarily by the unfavorable impact of lower fuel surcharge revenue as a result of lower fuel prices, and lower volumes as measured by revenue ton-miles (RTMs) primarily due to the impacts of COVID-19. This decrease was partially offset by higher liquidated damages, including customer volume commitments and higher freight rates.
2 Changes in freight volumes generally contribute to corresponding changes in freight revenues and certain variable expenses, such as fuel, equipment rents and crew costs.
3 Compensation & Benefits includes employee wages, salaries, fringe benefits and stock-based compensation.
4 Capital Expenditures are additions to properties. Capital Expenditures include expenditures to expand and enhance its rail network, rolling stock and other infrastructure. These expenditures are aimed at improving efficiency and safety of our operations. Such investments are also an integral part of the Company’s multi-year capital program and support growth initiatives.
5 Payments to Providers of Capital includes dividends paid to shareholders, interest paid to shareholders, interest paid to debtholders and payments for share repurchases less issuance of shares.
6 Payments to Government includes income tax paid and property tax.

Corporate Sustainability Data Supplement 2020 3
Operational Metrics Units 2016 2017 2018 2019 2020
Revenue Ton-Miles7 Millions 135,952 142,540 154,207 154,378 151,891
Gross Ton-Miles8 Millions 242,694 252,195 275,362 280,724 272,360
Carloads Transported Thousands 2,525 2,634 2,740 2,766 2,708
Intermodal Units Transported Thousands 976 997 1,026 1,046 1,050
Train Miles Travelled Thousands 30,373 30,632 32,312 32,924 30,324
7 Revenue Ton-Mile (RTM) refers to the movement of one revenue-producing ton of freight over a distance of one mile. RTMs measure the relative weight and distance of rail freight moved by the Company.
8 Gross Ton-Mile (GTM) refers to the movement of one ton of train weight over a distance of one mile. GTMs are calculated by multiplying total train weight by the distance the train moved. Total train weight comprises the weight of the freight cars, their contents and any inactive locomotives. An increase in GTMs indicates additional workload.
Employees
102-8 404-1 SASB TR-RA-000.E
Workforce Units 2016 2017 2018 2019 2020
Total Workforce9 Total Number 11,738 12,294 12,866 12,732 11,904
Total Employees10 # Employees 11,693 12,215 12,840 12,694 11,890
Canada # Employees 9,010 9,476 10,021 9,923 9,409
U.S. # Employees 2,683 2,739 2,819 2,771 2,481
Women # Employees 1,106 1,167 1,222 1,227 1,191
Men # Employees 10,587 11,048 11,618 11,467 10,699
Unionized Employees # Employees 8,760 9,173 9,618 9,390 8,587
Non-unionized Employees # Employees 2,933 3,042 3,222 3,304 3,303
Total Full-Time Employees11 # Employees 11,661 12,173 12,782 12,643 11,844
Women# Full-Time Employees
1,100 1,157 1,215 1,220 1,174
Men# Full-Time Employees
10,561 11,016 11,567 11,423 10,670
9 Total Workforce values reflect all CP employees, contractors and consultants as at Dec. 31 of each reporting year. Decrease in total workforce from 2019 to 2020 is primarily due to more efficient resource planning.
10 Total Employees refers to individuals currently engaged in full-time, part-time or seasonal employment with CP. The count is based on total number of employees as at Dec. 31 of the reporting year. The decrease in total employees from 2019 to 2020 is primarily due reduced workload as measured in GTMs and more efficient resource planning.
11 Total Full-Time Employees refers to individuals who work more than 90 percent of the full 40-hour workweek.

Corporate Sustainability Data Supplement 2020 4
Training15 Units 2016 2017 2018 2019 2020
Union StaffAvg Hours/Employee
28 40 41 65 30
Non-union StaffAvg Hours/Employee
30 49 67 55 46
Total Training Cost16 Millions 29.9 33.9 51.2 58.5 29.7
Average Spend on Training per Full-Time Employee16
$ 2,565 2,786 4,006 4,657 2,497
15 Training Hours include training related to in-class training provided by internal trainers, CP’s web-based learning management system, and external consultants. Hours do not include field based or on-the-job employee training. The decrease in CP’s training-related metrics from 2019-2020 is largely a result of the impacts from the COVID-19 pandemic on in-person training and the associated reduction in hiring.
16 Training Costs include expenses related to the management of CP’s Training, and Learning and Development departments, costs for internal trainers, CP’s web-based learning management system, external consultants, online learning platforms such as Harvard ManageMentor, and compensation for employee time while training. Costs do not include field based or on-the-job employee training.
Workforce Units 2016 2017 2018 2019 2020
Total Temporary Employees12 # Employees 23 41 57 49 44
Women # Temp Employees 4 9 6 6 16
Men # Temp Employees 19 32 51 43 28
Total Part-Time Employees13 # Employees 9 1 1 2 2
Women# Part-Time Employees
2 1 1 1 1
Men# Part-Time Employees
7 0 0 1 1
Total Contractors14 Total Number 45 79 26 38 14
12 Total Temporary Employees refers to seasonal or fixed-term individuals. All temporary employees were located in Canada during the reporting period.
13 Total Part-Time Employees refers to individuals who work between 50–90 percent of the full 40-hour workweek. All part-time employees are located in Canada.
14 CP does not currently monitor workforce-related metrics for contractors.
Corporate Sustainability Data Supplement 2020 5
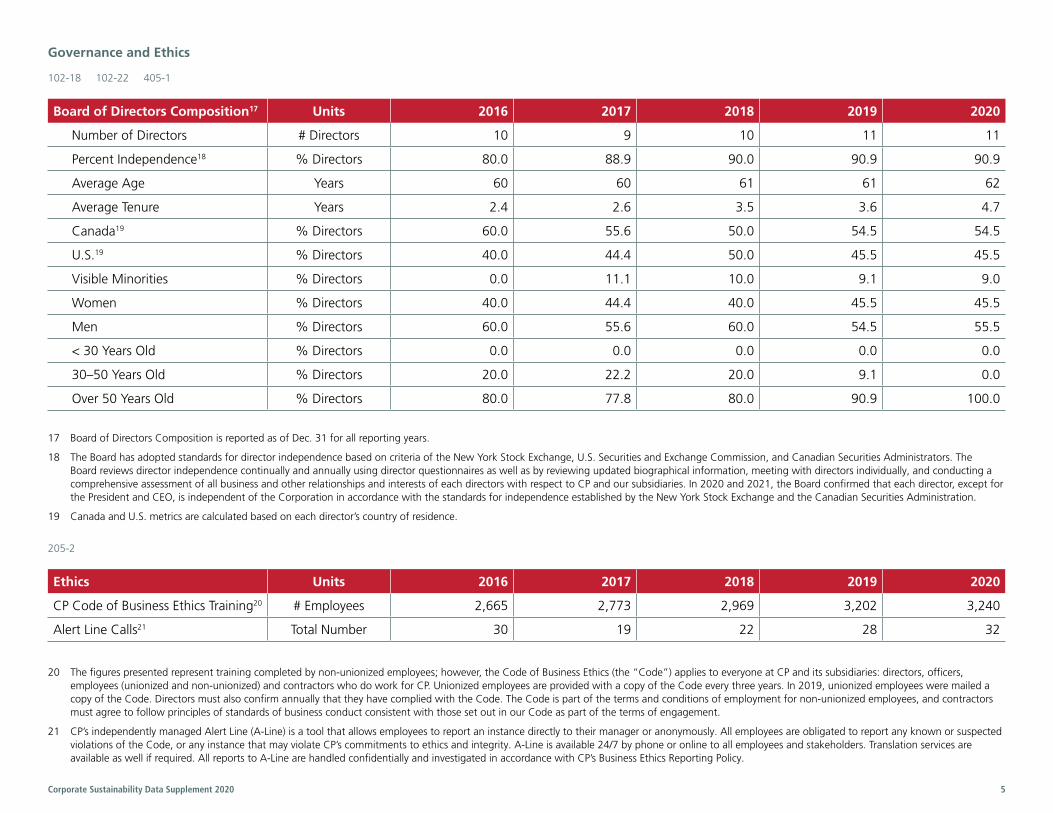
205-2
Ethics Units 2016 2017 2018 2019 2020
CP Code of Business Ethics Training20 # Employees 2,665 2,773 2,969 3,202 3,240
Alert Line Calls21 Total Number 30 19 22 28 32
20 The figures presented represent training completed by non-unionized employees; however, the Code of Business Ethics (the “Code”) applies to everyone at CP and its subsidiaries: directors, officers, employees (unionized and non-unionized) and contractors who do work for CP. Unionized employees are provided with a copy of the Code every three years. In 2019, unionized employees were mailed a copy of the Code. Directors must also confirm annually that they have complied with the Code. The Code is part of the terms and conditions of employment for non-unionized employees, and contractors must agree to follow principles of standards of business conduct consistent with those set out in our Code as part of the terms of engagement.
21 CP’s independently managed Alert Line (A-Line) is a tool that allows employees to report an instance directly to their manager or anonymously. All employees are obligated to report any known or suspected violations of the Code, or any instance that may violate CP’s commitments to ethics and integrity. A-Line is available 24/7 by phone or online to all employees and stakeholders. Translation services are available as well if required. All reports to A-Line are handled confidentially and investigated in accordance with CP’s Business Ethics Reporting Policy.
Governance and Ethics
102-18 102-22 405-1
Board of Directors Composition17 Units 2016 2017 2018 2019 2020
Number of Directors # Directors 10 9 10 11 11
Percent Independence18 % Directors 80.0 88.9 90.0 90.9 90.9
Average Age Years 60 60 61 61 62
Average Tenure Years 2.4 2.6 3.5 3.6 4.7
Canada19 % Directors 60.0 55.6 50.0 54.5 54.5
U.S.19 % Directors 40.0 44.4 50.0 45.5 45.5
Visible Minorities % Directors 0.0 11.1 10.0 9.1 9.0
Women % Directors 40.0 44.4 40.0 45.5 45.5
Men % Directors 60.0 55.6 60.0 54.5 55.5
< 30 Years Old % Directors 0.0 0.0 0.0 0.0 0.0
30–50 Years Old % Directors 20.0 22.2 20.0 9.1 0.0
Over 50 Years Old % Directors 80.0 77.8 80.0 90.9 100.0
17 Board of Directors Composition is reported as of Dec. 31 for all reporting years.
18 The Board has adopted standards for director independence based on criteria of the New York Stock Exchange, U.S. Securities and Exchange Commission, and Canadian Securities Administrators. The Board reviews director independence continually and annually using director questionnaires as well as by reviewing updated biographical information, meeting with directors individually, and conducting a comprehensive assessment of all business and other relationships and interests of each directors with respect to CP and our subsidiaries. In 2020 and 2021, the Board confirmed that each director, except for the President and CEO, is independent of the Corporation in accordance with the standards for independence established by the New York Stock Exchange and the Canadian Securities Administration.
19 Canada and U.S. metrics are calculated based on each director’s country of residence.

Corporate Sustainability Data Supplement 2020 6
SAFETY Safety Culture
403-9 SASB TR-RA-320a.1
Work-Related Injury Units 2016 2017 2018 2019 2020
Hours Worked Thousands 26,779 26,828 28,151 30,300 26,557
Total Recordable Injury Rate22 Injury Rate 3.10 3.25 3.14 2.67 2.59
FRA Personal Injury Rate Frequency23 Injury Rate 1.67 1.65 1.47 1.42 1.11
Women Injury Rate 0.00 1.40 0.92 0.93 0.68
Men Injury Rate 1.75 1.65 1.52 1.47 1.15
Contractors24 # FRA Injuries 26 30 34 20 8
Lost Time Injury Frequency Rate (Per 200,000 employee hours worked)25
Injury Rate * 1.12 0.97 0.90 0.77
Canada Injury Rate * 1.00 0.87 0.82 0.72
U.S. Injury Rate * 1.53 1.37 1.23 0.93
Women Injury Rate * 0.86 0.67 0.56 0.47
Men Injury Rate * 1.15 1.00 0.93 0.80
Lost Time Injury Frequency Rate (Per 1,000,000 employee hours worked)
Injury Rate * 5.59 4.87 4.49 3.84
Canada Injury Rate * 3.91 3.48 3.30 3.62
U.S. Injury Rate * 1.68 1.39 1.19 4.66
Women Injury Rate * 4.32 3.37 2.75 2.26
Men Injury Rate * 5.73 5.02 4.67 4.02
Representation by Health & Safety Committee
% Employees 100 100 100 100 100
22 Total Recordable Injury Rate (TRIR) is a measure of recordable injuries resulting from a discernable work-related event, to an on-duty employee and is a physical injury in nature (not incident stress or psychological in nature), including fatalities. TRIR is calculated as total number of recordable cases multiplied by 200,000, divided by total employee hours worked during the reporting period. Recordable incidents include all safety-related events reported by employees regardless of incident severity.
23 The Federal Railroad Administration (FRA) Personal Injury Rate Frequency (PIRF) reflects the frequency of personal injuries, multiplied by 200,000, divided by total employee hours. PIRF is limited to personal injuries that require employees to lose time away from work, modify their normal duties or obtain medical treatment beyond minor first aid. PIRF employee hours are the total hours worked, excluding vacation and sick time, by all employees, excluding contractors. FRA personal injuries per 200,000 employee-hours for the year ended December 31, 2018 previously reported as 1.48 was restated to 1.47 in this report. This restatement reflects new information available within specific periods stipulated by the FRA but that exceed the Company’s financial reporting timeline.
24 CP does not track contractor hours; therefore, CP cannot calculate a total recordable work-related injuries rate.
25 Lost Time Injury Frequency Rate (LTIFR) reflects an injury that results in calendar days away from work, as recommended by a physician. LTIFR is calculated as total number of injuries that result in an employee losing time away from work, multiplied by 200,000 or 1,000,000, divided by total employee-hours worked during the reporting period.

Corporate Sustainability Data Supplement 2020 7
Fatalities Units 2016 2017 2018 2019 2020
Employee Fatalities # Fatalities 1 2 3 4 0
Contract Worker Fatalities # Fatalities 1 1 0 0 0
Public Safety and Emergency PreparednessSASB TR-RA-540a.1-3
Train Accidents Units 2016 2017 2018 2019 2020
Train-Related Incidents & Accidents26 # Accidents 601 638 670 694 603
FRA Train Accident27 # Accidents 37 33 39 38 32
Train vs. Vehicle Fatalities28 # Accidents 4 10 9 8 5
Train vs. Vehicle Injuries29 # Accidents 28 29 17 26 16
Train-Related Accidents Involving the Release of Hazardous Materials30
# Accidents 1 2 3 5 2
Non-Accident Release of Hazardous Materials31
# Accidents 23 12 24 17 20
Grade Crossing Accident Rate32 # Accidents/Million
Train Miles2.81 2.60 2.73 2.58 2.23
FRA Train Accident Rate33 # Accidents/Million
Train Miles1.12 0.99 1.10 1.06 0.96
26 Train-Related Incidents & Accidents refers to any event that causes damage to mobile on-track equipment during the course of railway operations.
27 Federal Railroad Administration (FRA) Train Accident refers to a subset of reported train-related incidents and includes only those events involving damage exceeding a specific monetary value set by the FRA. The reporting threshold for 2017–2020 was US$10,700 in damage, and US$10,500 in damage for 2016.
28 Train vs. Vehicle Fatalities refers to incidents involving train and road vehicle collisions that result in a fatality.
29 Train vs. Vehicle Injuries refers to incidents involving train and vehicle collisions that result in an injury.
30 Train-Related Accidents Involving the Release of Hazardous Materials refers to incidents involving the release of hazardous materials (U.S.) or dangerous goods (Canada) from a means of containment during transportation by train.
31 Non-accident Release of Hazardous Materials refers to an unintentional release of hazardous materials (U.S.) or dangerous goods (Canada) from a means of containment during transportation. These events do not involve a train-related accident and can result from equipment failure or improperly secured materials.
32 Grade Crossing Accident Rate refers to any impact between on-track railway equipment and a highway user at a highway-rail grade crossing. Highway-rail grade crossing means: (1) a location where a public highway, road, street or private roadway, including associated sidewalks, crosses one or more railway tracks at grade; or (2) a location where a pathway explicitly authorized by a public authority or a railway carrier (dedicated for the use of non-vehicular traffic, including pedestrians, bicyclists and others), not associated with a public highway, road, street or private roadway, crosses one or more railway tracks at grade.
33 Federal Railroad Administration (FRA) Train Accident Rate reflects the number of train accidents resulting in damage exceeding a specific monetary threshold (set by FRA), multiplied by 1,000,000, divided by total train miles travelled during the reporting period. The reporting threshold for 2017–2020 was US$10,700 in damage, and US$10,500 in damage for 2016.

Corporate Sustainability Data Supplement 2020 8
Significant Spills Units 2016 2017 2018 2019 2020
Spill Events34 # Spills 37 21 34 35 38
34 Spill Events includes all reported incidents involving CP employees or contractors, which result in the unintentional release of hazardous materials or materials which may adversely impact the environment. Spills include events involving an accidental release, spill or leak, or result from the failure of means of containment. Reported values are limited to significant releases where a material has been released in excess of local regulatory reporting thresholds.
OPERATIONAL EXCELLENCEEnergy Efficiency and Emissions
Locomotive Units 2016 2017 2018 2019 2020
Total Locomotive FuelMillion U.S. Gallons 238 248 263 270 258
Million Litres 903 939 995 1,023 978
Locomotive Fuel EfficiencyU.S. Gallons/1,000
GTMs0.980 0.980 0.953 0.955 0.942
Freight Efficiency35 RTMs/U.S. Gallons 570 574 586 572 588
35 Freight efficiency represents the number of route miles one ton of revenue generating freight can be transported by a CP train on a single U.S. gallon of fuel.
302-1 302-3 302-4 SASB TR-RA-110a.3
Energy Units 2016 2017 2018 2019 2020
Total Energy Consumption36 1,000 MWh 10,401 10,758 11,384 11,625 11,073
Locomotive Diesel 1,000 MWh 9,548 9,939 10,533 10,745 10,288
Locomotive Renewable Fuel37 1,000 MWh 147 149 157 163 161
Other Liquid Fuel38 1,000 MWh 406 357 364 373 309
Natural Gas and Propane 1,000 MWh 117 128 139 150 131
Electricity Consumption 1,000 MWh 183 185 192 194 184
36 Total Energy Consumption includes all liquefied gas, fuel and electricity consumed inside the organization during the reporting year.
37 All diesel fuel supplied to the Canadian marketplace must contain an annual average of 2 percent renewable content. Locomotive — Renewable Fuel is estimated to be equivalent to 2 percent of all locomotive diesel fuel consumed in Canada during the reporting year.
38 Other Liquid Fuel includes all liquid and gaseous fuel, excluding locomotive diesel, consumed by the organization during the reporting period. Common fuel reported here includes gasoline, diesel, heating oil and liquid biofuels.
Corporate Sustainability Data Supplement 2020 9
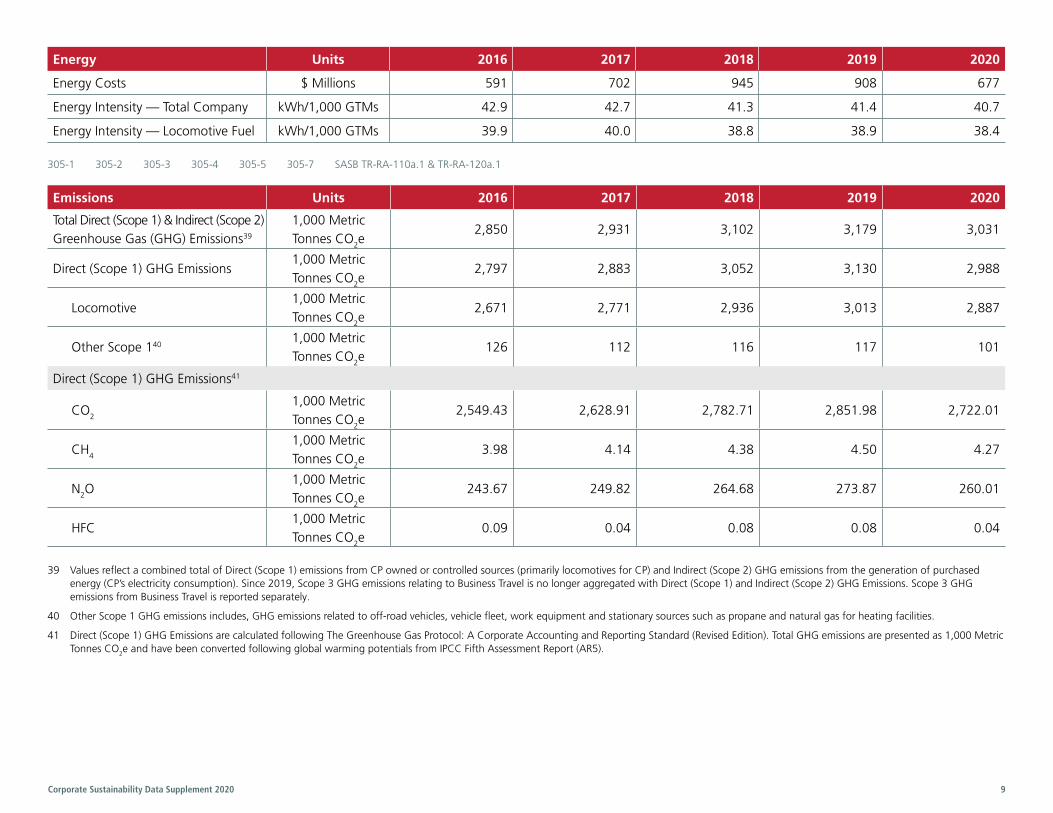
Energy Units 2016 2017 2018 2019 2020
Energy Costs $ Millions 591 702 945 908 677
Energy Intensity — Total Company kWh/1,000 GTMs 42.9 42.7 41.3 41.4 40.7
Energy Intensity — Locomotive Fuel kWh/1,000 GTMs 39.9 40.0 38.8 38.9 38.4
305-1 305-2 305-3 305-4 305-5 305-7 SASB TR-RA-110a.1 & TR-RA-120a.1
Emissions Units 2016 2017 2018 2019 2020
Total Direct (Scope 1) & Indirect (Scope 2) Greenhouse Gas (GHG) Emissions39
1,000 Metric Tonnes CO2e
2,850 2,931 3,102 3,179 3,031
Direct (Scope 1) GHG Emissions1,000 Metric Tonnes CO2e
2,797 2,883 3,052 3,130 2,988
Locomotive1,000 Metric Tonnes CO2e
2,671 2,771 2,936 3,013 2,887
Other Scope 140 1,000 Metric Tonnes CO2e
126 112 116 117 101
Direct (Scope 1) GHG Emissions41
CO2
1,000 Metric Tonnes CO2e
2,549.43 2,628.91 2,782.71 2,851.98 2,722.01
CH4
1,000 Metric Tonnes CO2e
3.98 4.14 4.38 4.50 4.27
N2O1,000 Metric Tonnes CO2e
243.67 249.82 264.68 273.87 260.01
HFC1,000 Metric Tonnes CO2e
0.09 0.04 0.08 0.08 0.04
39 Values reflect a combined total of Direct (Scope 1) emissions from CP owned or controlled sources (primarily locomotives for CP) and Indirect (Scope 2) GHG emissions from the generation of purchased energy (CP’s electricity consumption). Since 2019, Scope 3 GHG emissions relating to Business Travel is no longer aggregated with Direct (Scope 1) and Indirect (Scope 2) GHG Emissions. Scope 3 GHG emissions from Business Travel is reported separately.
40 Other Scope 1 GHG emissions includes, GHG emissions related to off-road vehicles, vehicle fleet, work equipment and stationary sources such as propane and natural gas for heating facilities.
41 Direct (Scope 1) GHG Emissions are calculated following The Greenhouse Gas Protocol: A Corporate Accounting and Reporting Standard (Revised Edition). Total GHG emissions are presented as 1,000 Metric Tonnes CO2e and have been converted following global warming potentials from IPCC Fifth Assessment Report (AR5).

Corporate Sustainability Data Supplement 2020 10
Emissions Units 2016 2017 2018 2019 2020
Indirect (Scope 2 & 3) GHG Emissions
Indirect (Scope 2) GHG Emissions42 1,000 Metric Tonnes CO2e
53 48 50 49 43
Other Indirect (Scope 3) GHG Emissions43
1,000 Metric Tonnes CO2e
* * * 1,734 1,700
Purchased Goods & Services and Capital Goods44
1,000 Metric Tonnes CO2e
* * * 631 620
Fuel & Energy-Related Activities45 1,000 Metric Tonnes CO2e
* * * 917 860
Upstream Transportation & Distribution46
1,000 Metric Tonnes CO2e
* * * 142 181
Waste Generated in Operations47 1,000 Metric Tonnes CO2e
* * * 5 4
Business Travel48 1,000 Metric Tonnes CO2e
17 16 16 21 18
Employee Commuting49 1,000 Metric Tonnes CO2e
* * * 18 17
42 Indirect (Scope 2) GHG Emissions consists of emissions from the generation of electricity purchased by CP. Canadian emissions are based on emissions factors used for Canada’s National Inventory Report. U.S. emissions are based on the U.S. EPA eGRID 2019 emissions factors. Electricity usage is based on electric utility billing data.
43 Prior to 2019, CP’s reporting on Other Indirect (Scope 3) GHG Emissions was limited to Business Travel. Beginning in 2019, CP expanded GHG reporting to include additional relevant Scope 3 emissions categories of purchased goods & services and capital goods, fuel and energy-related activities, upstream transportation and distribution, and waste generated in operations for 2019. The asterisk (*) indicates that a reporting of these categories of Other Indirect (Scope 3) GHG Emissions relevant to CP is not available for earlier reporting periods.
44 An estimate of GHG emissions related to Purchased Goods & Services and Capital Goods was derived following an economic input-output (EIO) model developed by Carnegie Mellon University. EIO categories by spend were totaled and converted into GHG emissions using factors consistent with this approach.
45 Fuel and Energy-Related Activities includes upstream emissions associated with the fuel that CP uses to operate, from fuel combusted for generation of electricity purchased by CP and transmission and distribution losses from electricity consumed.
46 GHG emissions related to the transport of purchased material, truck transport of intermodal containers, and postage and couriers. Emissions from transport of purchased material were calculated using each order’s weight and transport distance with tonne-mileage emissions factors for trucks. For all other Upstream Transportation and Distribution, an economic input-output (EIO) calculator was used to estimate emissions from purchased transportation services.
47 GHG emissions associated with annual waste generated by CP. Derived using factors from the U.S. EPA Center for Corporate Climate Leadership.
48 Emissions for Business Travel, including hotel stays, vehicle rentals and flights. Emissions factors for hotel stays from DEFRA were used to calculate GHG emissions. Emissions factors for vehicle rentals and passenger flights from the U.S. EPA Center for Corporate Climate Leadership were used to calculate GHG emissions.
49 Employee Commuting emissions were estimated using average commuting time, transportation mode and distance statistics from census data in the U.S. and Canada. Work from home adjustment factor was applied to adjust annual emissions due to increased number of employees working from home due to the COVID-19 pandemic. GHG emissions were calculated following emissions factors from the U.S. EPA Center for Corporate Climate Leadership.
Corporate Sustainability Data Supplement 2020 11
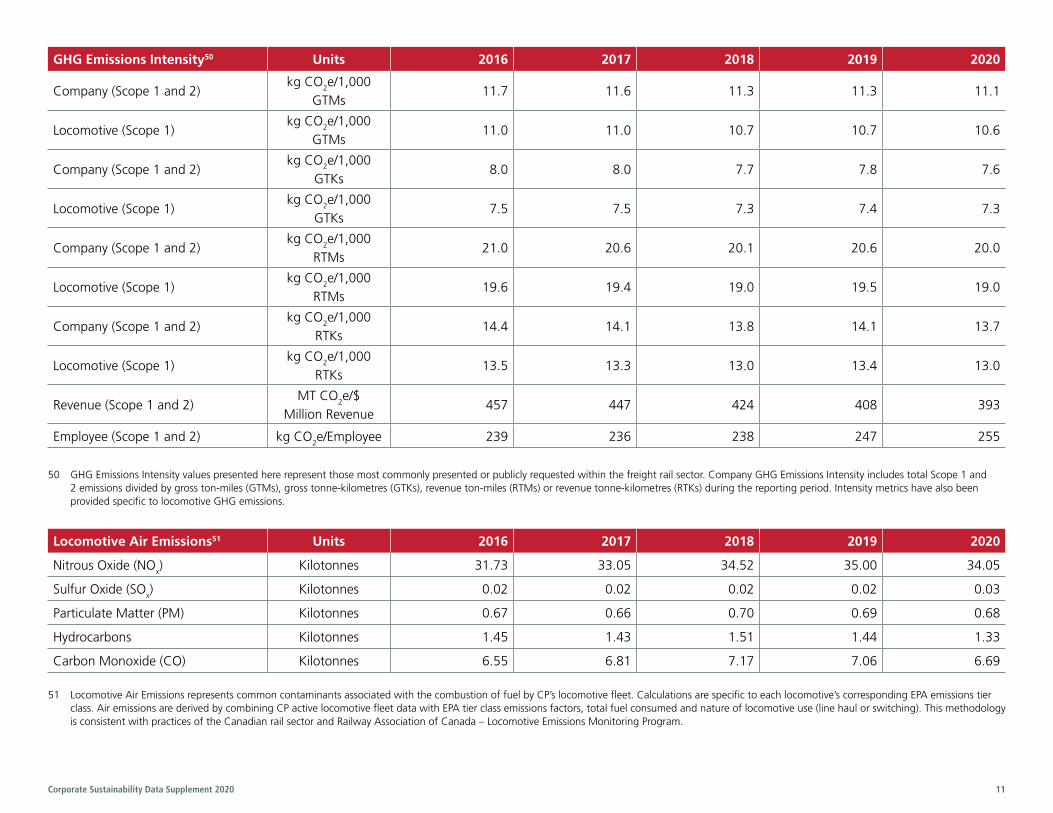
GHG Emissions Intensity50 Units 2016 2017 2018 2019 2020
Company (Scope 1 and 2)kg CO2e/1,000
GTMs11.7 11.6 11.3 11.3 11.1
Locomotive (Scope 1)kg CO2e/1,000
GTMs11.0 11.0 10.7 10.7 10.6
Company (Scope 1 and 2)kg CO2e/1,000
GTKs8.0 8.0 7.7 7.8 7.6
Locomotive (Scope 1)kg CO2e/1,000
GTKs7.5 7.5 7.3 7.4 7.3
Company (Scope 1 and 2)kg CO2e/1,000
RTMs21.0 20.6 20.1 20.6 20.0
Locomotive (Scope 1)kg CO2e/1,000
RTMs19.6 19.4 19.0 19.5 19.0
Company (Scope 1 and 2)kg CO2e/1,000
RTKs14.4 14.1 13.8 14.1 13.7
Locomotive (Scope 1)kg CO2e/1,000
RTKs13.5 13.3 13.0 13.4 13.0
Revenue (Scope 1 and 2)MT CO2e/$
Million Revenue457 447 424 408 393
Employee (Scope 1 and 2) kg CO2e/Employee 239 236 238 247 255
50 GHG Emissions Intensity values presented here represent those most commonly presented or publicly requested within the freight rail sector. Company GHG Emissions Intensity includes total Scope 1 and 2 emissions divided by gross ton-miles (GTMs), gross tonne-kilometres (GTKs), revenue ton-miles (RTMs) or revenue tonne-kilometres (RTKs) during the reporting period. Intensity metrics have also been provided specific to locomotive GHG emissions.
Locomotive Air Emissions51 Units 2016 2017 2018 2019 2020
Nitrous Oxide (NOx) Kilotonnes 31.73 33.05 34.52 35.00 34.05
Sulfur Oxide (SOx) Kilotonnes 0.02 0.02 0.02 0.02 0.03
Particulate Matter (PM) Kilotonnes 0.67 0.66 0.70 0.69 0.68
Hydrocarbons Kilotonnes 1.45 1.43 1.51 1.44 1.33
Carbon Monoxide (CO) Kilotonnes 6.55 6.81 7.17 7.06 6.69
51 Locomotive Air Emissions represents common contaminants associated with the combustion of fuel by CP’s locomotive fleet. Calculations are specific to each locomotive’s corresponding EPA emissions tier class. Air emissions are derived by combining CP active locomotive fleet data with EPA tier class emissions factors, total fuel consumed and nature of locomotive use (line haul or switching). This methodology is consistent with practices of the Canadian rail sector and Railway Association of Canada – Locomotive Emissions Monitoring Program.

Corporate Sustainability Data Supplement 2020 12
Asset and Rail Network Resiliency
SASB TR-RA-540a.4
Performance Metrics Units 2016 2017 2018 2019 2020
Average Terminal Dwell Hours 6.7 6.6 6.8 6.4 6.5
Average Train Speed Miles/Hour 23.5 22.6 21.5 22.2 22.0
Main Track Inspections52 Total Number 81,425 81,408 83,832 86,723 91,503
Main Track Miles Inspected Total Number 1,626,119 1,677,032 1,793,249 1,855,173 1,923,379
Total Main Track Miles Total Number 12,423 12,489 12,469 12,683 13,046
Frequency of Internal Railway Integrity Inspections53
Ratio 2.52 2.58 2.77 2.81 2.84
52 Main Track Inspections includes both regulatory and special track inspections.
53 Frequency of Internal Railway Integrity Inspections is calculated as the number of inspections per week, weighted for the number of main track miles on which those inspections took place. Calculated as (weekly inspections × miles of track on which they took place) / (total main track miles).
Environmental Footprint
Environmental Units 2016 2017 2018 2019 2020
Annual Spend on Remediation $ Millions 12 8 7 7 7
Provision for Environmental Remediation Programs54
$ Millions 85 80 83 81 83
Environmental Audits Completed55 # Audits 4 14 9 10 0
Number of Environmental Fines # Fines 0 0 1 0 0
Amount of Environmental Fines56 $ Total Spent 0 0 31,500 0 0
54 Provision for Environmental Remediation Programs represents an estimate of probable future obligation and includes both asserted and unasserted claims, without reduction for anticipated recoveries from third parties. Although the recorded accruals include CP’s best estimate of all probable costs, CP’s total environmental remediation costs cannot be predicted with certainty. Accruals for environmental remediation may change periodically as new information about previously untested sites becomes known, environmental laws and regulations evolve, and advances are made in environmental remediation technology.
55 CP did not complete environmental audits in 2020 due to COVID-19 travel and work restrictions.
56 The environmental penalty in 2018 was an administrative penalty for exceeding permit limits.
Corporate Sustainability Data Supplement 2020 13
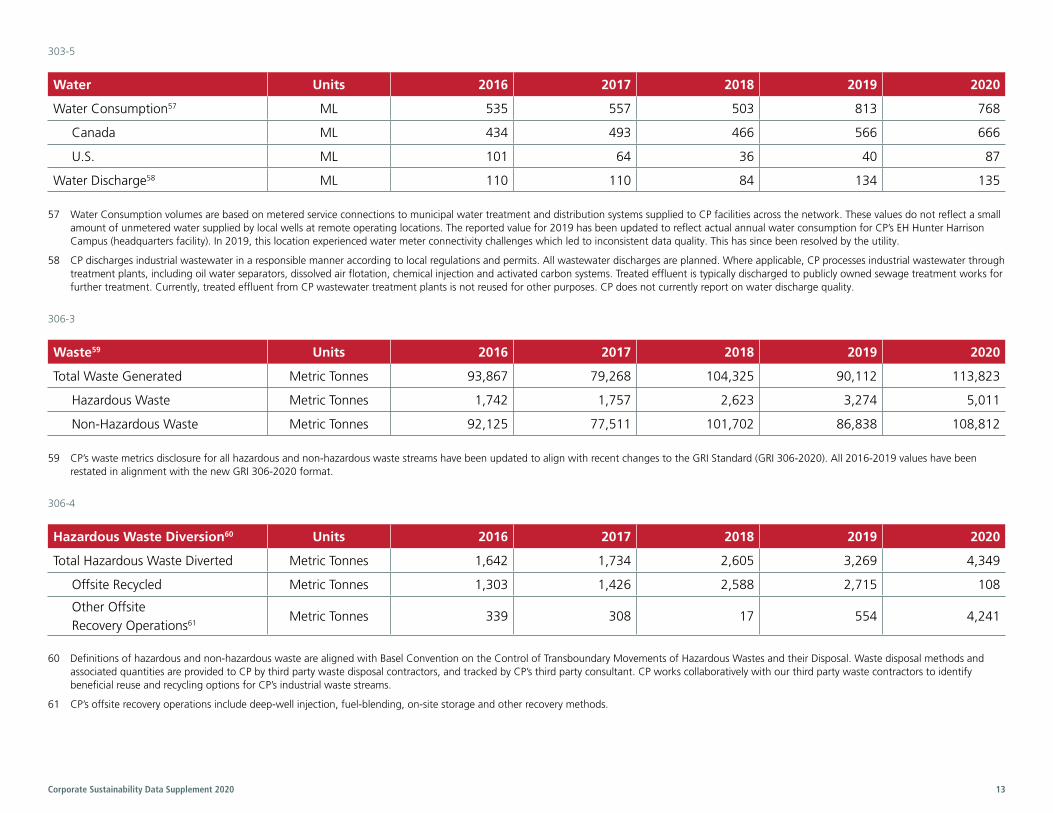
303-5
Water Units 2016 2017 2018 2019 2020
Water Consumption57 ML 535 557 503 813 768
Canada ML 434 493 466 566 666
U.S. ML 101 64 36 40 87
Water Discharge58 ML 110 110 84 134 135
57 Water Consumption volumes are based on metered service connections to municipal water treatment and distribution systems supplied to CP facilities across the network. These values do not reflect a small amount of unmetered water supplied by local wells at remote operating locations. The reported value for 2019 has been updated to reflect actual annual water consumption for CP’s EH Hunter Harrison Campus (headquarters facility). In 2019, this location experienced water meter connectivity challenges which led to inconsistent data quality. This has since been resolved by the utility.
58 CP discharges industrial wastewater in a responsible manner according to local regulations and permits. All wastewater discharges are planned. Where applicable, CP processes industrial wastewater through treatment plants, including oil water separators, dissolved air flotation, chemical injection and activated carbon systems. Treated effluent is typically discharged to publicly owned sewage treatment works for further treatment. Currently, treated effluent from CP wastewater treatment plants is not reused for other purposes. CP does not currently report on water discharge quality.
306-3
Waste59 Units 2016 2017 2018 2019 2020
Total Waste Generated Metric Tonnes 93,867 79,268 104,325 90,112 113,823
Hazardous Waste Metric Tonnes 1,742 1,757 2,623 3,274 5,011
Non-Hazardous Waste Metric Tonnes 92,125 77,511 101,702 86,838 108,812
59 CP’s waste metrics disclosure for all hazardous and non-hazardous waste streams have been updated to align with recent changes to the GRI Standard (GRI 306-2020). All 2016-2019 values have been restated in alignment with the new GRI 306-2020 format.
306-4
Hazardous Waste Diversion60 Units 2016 2017 2018 2019 2020
Total Hazardous Waste Diverted Metric Tonnes 1,642 1,734 2,605 3,269 4,349
Offsite Recycled Metric Tonnes 1,303 1,426 2,588 2,715 108
Other Offsite Recovery Operations61
Metric Tonnes 339 308 17 554 4,241
60 Definitions of hazardous and non-hazardous waste are aligned with Basel Convention on the Control of Transboundary Movements of Hazardous Wastes and their Disposal. Waste disposal methods and associated quantities are provided to CP by third party waste disposal contractors, and tracked by CP’s third party consultant. CP works collaboratively with our third party waste contractors to identify beneficial reuse and recycling options for CP’s industrial waste streams.
61 CP’s offsite recovery operations include deep-well injection, fuel-blending, on-site storage and other recovery methods.

Corporate Sustainability Data Supplement 2020 14
Non-Hazardous Waste Diversion Units 2016 2017 2018 2019 2020
Total Non-Hazardous Waste Diverted Metric Tonnes 1,897 9,304 2,323 2,198 2,306
Offsite Recycled Metric Tonnes 1,794 9,197 2,268 2,164 1,302
Offsite Compost Metric Tonnes 103 65 55 34 68
Other Offsite Recovery Operations
Metric Tonnes 0 42 0 0 936
306-5
Hazardous Waste Disposal Units 2016 2017 2018 2019 2020
Total Hazardous Waste Disposed Metric Tonnes 99 23 18 5 662
Offsite Incineration (with energy recovery)
Metric Tonnes 15 2 2 0 68
Offsite Landfilling Metric Tonnes 84 21 16 5 594
Non-Hazardous Waste Disposal Units 2016 2017 2018 2019 2020
Total Non-Hazardous Waste Disposed
Metric Tonnes 90,186 68,249 99,379 84,640 106,505
Offsite Incineration (with energy recovery)
Metric Tonnes 83,120 61,766 92,950 77,755 99,336
Offsite Landfilling Metric Tonnes 7,066 6,483 6,429 6,885 7,169
Other Waste Units 2016 2017 2018 2019 2020
Rail Ties Sent to Cogeneration Facility
# Ties 1,006,280 747,774 1,125,619 941,615 1,202,724
Rail Ties Sent to Cogeneration Facility62
Metric Tonnes 83,072 61,732 92,976 77,755 99,317
62 Annual volumes of rail ties sent to cogeneration facilities are also included in the non-hazardous waste disposal table, reported as Offsite Incineration (with energy recovery).

Corporate Sustainability Data Supplement 2020 15
301-1
Resource Consumption Units 2016 2017 2018 2019 2020
Total Steel Products Purchased Metric Tonnes 88,434 71,251 73,101 81,591 95,584
New Rail Purchased Metric Tonnes 68,972 47,289 51,293 60,741 69,828
Other Track Materials63 Metric Tonnes 19,462 23,962 21,808 20,849 25,756
Total Rail Ties Installed 1,000s Rail Ties 1,008 1,138 1,015 1,122 1,417
63 Other Track Materials includes anchors, spikes, screw spikes, rail clip fasteners, tie plates and track bolts.
Supply Chain Management
204-1
Supply Chain Management Units 2016 2017 2018 2019 2020
Total Supplier Spend $ Millions 3,132 3,555 4,042 4,269 3,005
Spending on Local Suppliers — Canada
$ Millions 1,659 1,896 2,234 2,406 1,867
Spending on Local Suppliers — U.S.
$ Millions 1,471 1,624 1,696 1,850 1,138

Corporate Sustainability Data Supplement 2020 16
SOCIAL IMPACTDiversity and Inclusion
405-1
Employee Composition64 Units 2016 2017 2018 2019 2020
Gender
Women % Employees 9.5 9.6 9.5 9.7 10.0
Men % Employees 90.5 90.4 90.5 90.3 90.0
Age
< 30 Years Old % Employees 14.0 16.2 17.9 17.1 15.7
30–50 Years Old % Employees 55.3 55.5 56.5 58.2 56.9
Over 50 Years Old % Employees 30.7 28.3 25.6 24.7 27.4
Gender & Age by Management Level
Sr. Executive Management65 # Employees 74 78 88 88 94
Women % Sr Exec Mgmt 14.9 17.9 18.2 17.0 17.0
Men % Sr Exec Mgmt 85.1 82.1 81.8 83.0 83.0
< 30 Years Old % Sr Exec Mgmt 0.0 0.0 0.0 0.0 0.0
30–50 Years Old % Sr Exec Mgmt 59.5 65.4 63.6 61.4 55.3
Over 50 Years Old % Sr Exec Mgmt 40.5 34.6 36.4 38.6 44.7
Management66 # Employees 1,825 1,925 2,001 2,053 2,100
Women % Mgmt 20.3 20.4 20.7 20.9 21.6
Men % Mgmt 79.7 79.6 79.3 79.1 78.4
< 30 Years Old % Mgmt 6.4 7.1 6.0 5.5 5.1
30–50 Years Old % Mgmt 62.9 63.7 64.6 66.5 63.6
Over 50 Years Old % Mgmt 30.8 29.2 29.4 28.0 31.3
64 Employee Composition data for 2016-2019 have been restated in alignment with 2020 presentation for comparison purposes.
65 Sr. Executive Management at CP includes all EVP, AVP, Chief, General Counsel, GM, Managing Director, SVP and VP positions.
66 Management at CP includes Director, Superintendent, Assistant Chief, Gen Superintendent, Manager, Assistant Superintendent, Trainmaster, Roadmaster, Assistant Trainmaster and Specialist positions.
Corporate Sustainability Data Supplement 2020 17
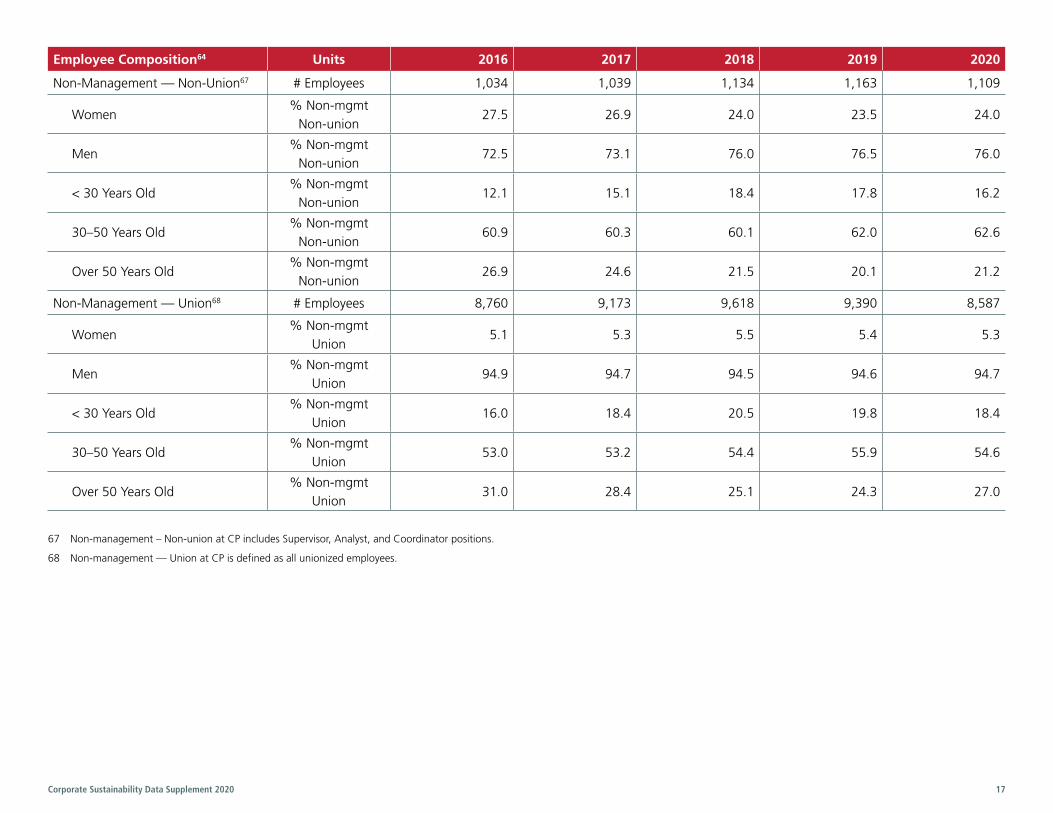
Employee Composition64 Units 2016 2017 2018 2019 2020
Non-Management — Non-Union67 # Employees 1,034 1,039 1,134 1,163 1,109
Women% Non-mgmt
Non-union27.5 26.9 24.0 23.5 24.0
Men% Non-mgmt
Non-union72.5 73.1 76.0 76.5 76.0
< 30 Years Old% Non-mgmt
Non-union12.1 15.1 18.4 17.8 16.2
30–50 Years Old% Non-mgmt
Non-union60.9 60.3 60.1 62.0 62.6
Over 50 Years Old% Non-mgmt
Non-union26.9 24.6 21.5 20.1 21.2
Non-Management — Union68 # Employees 8,760 9,173 9,618 9,390 8,587
Women% Non-mgmt
Union5.1 5.3 5.5 5.4 5.3
Men% Non-mgmt
Union94.9 94.7 94.5 94.6 94.7
< 30 Years Old% Non-mgmt
Union16.0 18.4 20.5 19.8 18.4
30–50 Years Old% Non-mgmt
Union53.0 53.2 54.4 55.9 54.6
Over 50 Years Old% Non-mgmt
Union31.0 28.4 25.1 24.3 27.0
67 Non-management – Non-union at CP includes Supervisor, Analyst, and Coordinator positions.
68 Non-management — Union at CP is defined as all unionized employees.

Corporate Sustainability Data Supplement 2020 18
Employee Composition64 Units 2016 2017 2018 2019 2020
Other Diversity Metrics69
Canada
Women % Cdn Employees 10.6 10.7 10.8 11.0 11.2
Aboriginal70 % Cdn Employees 3.4 4.0 4.2 4.5 4.2
Persons with Disabilities71 % Cdn Employees 3.0 2.7 2.4 2.8 2.9
Visible Minorities72 % Cdn Employees 8.5 10.3 11.8 12.8 13.2
U.S.
Women % U.S. Employees 5.3 5.3 4.8 5.0 5.2
Persons with Disabilities71 % U.S. Employees 1.4 1.2 1.6 1.6 1.7
Visible Minorities72 % U.S. Employees 11.3 12.5 12.5 11.8 11.6
Women in STEM Positions73 % Women in
STEM Positions12.8 14.5 15.5 17.1 18.2
Women in Revenue Generating Functions74
% Women in Revenue Generating Functions
30.0 33.6 29.5 20.7 33.9
69 Other Diversity Metrics are based on self-identification of employee status at CP.
70 Aboriginal is defined as all First Nations, Inuit, Métis and North American Indian peoples. These metrics are not tracked in the U.S.
71 Persons with Disabilities is defined as individuals who have a long-term or recurring physical, mental, sensory, psychiatric or learning impairment and who (a) consider themselves to be disadvantaged in employment by reason of that impairment, or (b) believe that an employer or potential employer is likely to consider them to be disadvantaged in employment by reason of that impairment, and includes persons whose functional limitations owing to their impairment have been accommodated in their current job or workplace.
72 Visible Minorities defines “persons, other than Aboriginal, who are non-Caucasian in race or non-white in colour.” Categories in the visible minorities variable include South Asian, Chinese, Black, Filipino, Latin American, Arab, Southeast Asian, West Asian, Korean, Japanese, visible minorities not included elsewhere, multiple visible minorities and not a visible minority.
73 Women in non-union positions in Information Services, Innovation and Business Transformation, Finance and Risk and Operations Systems teams that have roles that required a background and/or education in Science, Technology, Engineering or Mathematics (STEM) as a percentage of all such positions.
74 Women in management positions in revenue generating functions (i.e. sales and marketing) as a percentage of all such positions.

Corporate Sustainability Data Supplement 2020 19
401-1
New Hires Units 2016 2017 2018 2019 2020
Applications Received # Applicants 43,722 62,341 106,765 92,807 70,627
Total Positions Hired # Positions 1,775 3,160 4,181 3,871 2,312
New Hires # Employees 674 1,657 2,402 1,756 1,166
Internal Hires75 # Employees 1,101 1,503 1,779 2,115 1,146
Rate of Internal Hires% Total
Positions Hired62.0 47.6 42.5 54.6 49.6
Gender
Women % New Employees 13.8 11.3 9.6 11.2 10.5
Men % New Employees 86.2 88.7 90.4 88.8 89.5
Age
< 30 Years Old % New Employees 42.1 47.4 44.7 52.6 46.6
30–50 Years Old % New Employees 50.3 45.0 48.3 41.5 44.6
Over 50 Years Old % New Employees 7.6 7.6 7.0 6.0 8.8
Region
Canada % New Employees 82.2 80.9 78.6 86.0 84.0
U.S. % New Employees 17.8 19.1 21.4 14.0 16.0
75 Internal Hires is defined as an existing employee moving to a new position, including all promotions and lateral moves within the Company during the reporting year.
401-1
Employee Turnover Units 2016 2017 2018 2019 2020
Total Employee Turnover76 # Employees 2,146 1,729 1,785 1,705 1,446
Employee Turnover Rate77 % Total Employees 18.4 14.2 14.0 13.6 12.2
Voluntary Employee Turnover Rate78 % Total Employees 7.7 6.5 7.0 7.0 5.8
76 Total Employee Turnover refers to the number of workers who left CP during the reporting period. This includes retirements, voluntary and non-voluntary terminations.
77 Employee Turnover Rate is calculated as total turnover by employee category divided by the total number of employees in each category.
78 Voluntary Employee Turnover Rate refers to employees who leave the Company of their own volition, and does not include departures due to retirement. Calculated as total voluntary turnover divided by total number of employees.

Corporate Sustainability Data Supplement 2020 20
Employee Turnover Units 2016 2017 2018 2019 2020
Gender
Women% Women Employees
17.7 13.6 15.7 15.3 12.0
Men % Men Employees 18.5 14.3 13.8 13.4 12.2
Age
< 30 Years Old % Age Class 16.6 12.8 16.4 19.1 15.6
30–50 Years Old % Age Class 13.0 10.4 10.0 8.9 8.4
Over 50 Years Old % Age Class 27.6 21.5 20.0 20.7 18.1
Region
Canada% Regional Employees
18.2 14.2 13.7 13.7 11.7
U.S.% Regional Employees
19.3 14.2 15.2 13.2 13.8
Community Investment
Investment and Donations Units 2016 2017 2018 2019 2020
Canada
Community Investments by CP $ CAD 4,807,029 4,604,679 4,000,947 3,531,458 4,018,341
Monetary Donations by CP $ CAD 4,494,260 4,470,664 3,617,418 3,447,379 3,698,021
In-kind Donations by CP $ CAD 312,769 134,015 383,529 84,079 320,320
Community & Employee Donations — CP Led
$ CAD 1,055,163 1,493,153 1,367,233 1,930,783 1,671,521
U.S.
Community Investments by CP $ USD 442,768 475,240 415,086 553,676 2,174,680
Monetary Donations by CP $ USD 442,768 452,804 415,086 553,676 2,170,280
In-kind Donations by CP $ USD 0 22,436 0 0 4,400
Community & Employee Donations — CP Led
$ USD 224,297 295,354 303,459 321,261 570,530


