Submitted to the International Journal of Quality and Reliability Management
Cost of Quality: A Survey of Models and Best Practices
Andrea Schiffauerova, Vince Thomson McGill University
Abstract The objective of this article is to provide a better understanding of cost of quality (CoQ) methods by presenting a survey of published literature with specific emphasis on CoQ models and best practices, and by contributing four examples of company best practices in the area of quality management. Even though the survey shows an interest by the academic community, a CoQ approach is not utilized in most quality management programs. The outcome of a study of best practices at four Canadian companies agrees. The companies use systematic quality initiatives; however, a formal CoQ methodology was only used at one company. Companies that did adopt a CoQ approach were successful in reducing CoQ and improving product quality for the customer.
Keywords: Cost of quality, CoQ models, best practices
Introduction Many companies promote quality as the central customer value and consider it to be a critical success factor for achieving competitiveness. Any serious attempt to improve quality must take into account the costs associated with achieving quality since the objective of continuous improvement programs is not only to meet customer requirements, but also to do it at the lowest cost. This can only happen by reducing the costs needed to achieve quality, and the reduction of these costs is only possible if they are identified and measured. Therefore, measuring and reporting the cost of quality (CoQ) should be considered an important issue for managers. There is no general agreement on a single broad definition of quality costs (Machowski and Dale, 1998). However, CoQ is usually understood as the sum of conformance plus non-conformance costs. Cost of conformance is the price paid for prevention of poor quality (inspection and quality appraisal). Cost of non-conformance is the cost of poor quality caused by product and service failure (rework and returns). According to Dale and Plunkett (1995), it is now widely accepted that quality costs are the cost incurred in the design, implementation, operation and maintenance of a quality management system, the cost of resources committed to continuous improvement, the cost of system, product and service failures, and all other necessary costs and non-value added activities required to achieve a quality product or service. Quality experts have different opinions on measuring CoQ. Edward Deming, perhaps the best-known advocate of quality management, believed that the cost of non-conformance (and the resulting loss of good will) was so high that evaluating cost of quality was unnecessary. He saw absolutely no value in financial measures related to quality. While for Deming measuring CoQ was a waste of time, Joseph Juran and Philip Crosby saw a need for it. They believed that as defect prevention was increased, the cost of rework would decrease by much more than the increase in prevention costs. The net result was lower total cost, and thus “quality is free” (Crosby, 1979).
CoQ analysis links improvement actions with associated costs and customer expectations, and this is seen as the coupling of reduced costs and increased benefits for quality improvement.
Submitted to the International Journal of Quality and Reliability Management
Expenditures on improvement and prevention activities are considered as a form of investment, which should bring reduced failure costs. Time and money may be wasted on prevention activities that do not bring appropriate improvement. Deming may believe that the proper objective is to have zero defects. However, for some it may be uneconomical to have a high level of quality; they assume that absolute quality must be sacrificed to achieve other objectives, for example, reduced development cycle time. Therefore, a realistic estimate of CoQ and improvement benefits, i.e., the correct tradeoff between the level of conformance and non-conformance costs, should be considered an essential element of any quality initiative, and thus, a crucial issue for any manager.
A number of organizations are now seeking both theoretical advice and practical evidence about quality related costs and the implementation of quality costing systems. The following review of recent literature attempts to give a brief survey of research articles on the topic of CoQ. There is a large volume of literature on the importance and the principles of quality costing. Research papers were divided into three groups: CoQ models that result from various quality costing strategies, metrics used with CoQ systems, and best practices that reflect the real achievements of companies following CoQ methods. Finally, the last section presents a study of the quality efforts carried out at four Canadian companies. Their quality costing systems are described,analyzed and compared in light of CoQ models and best practices.
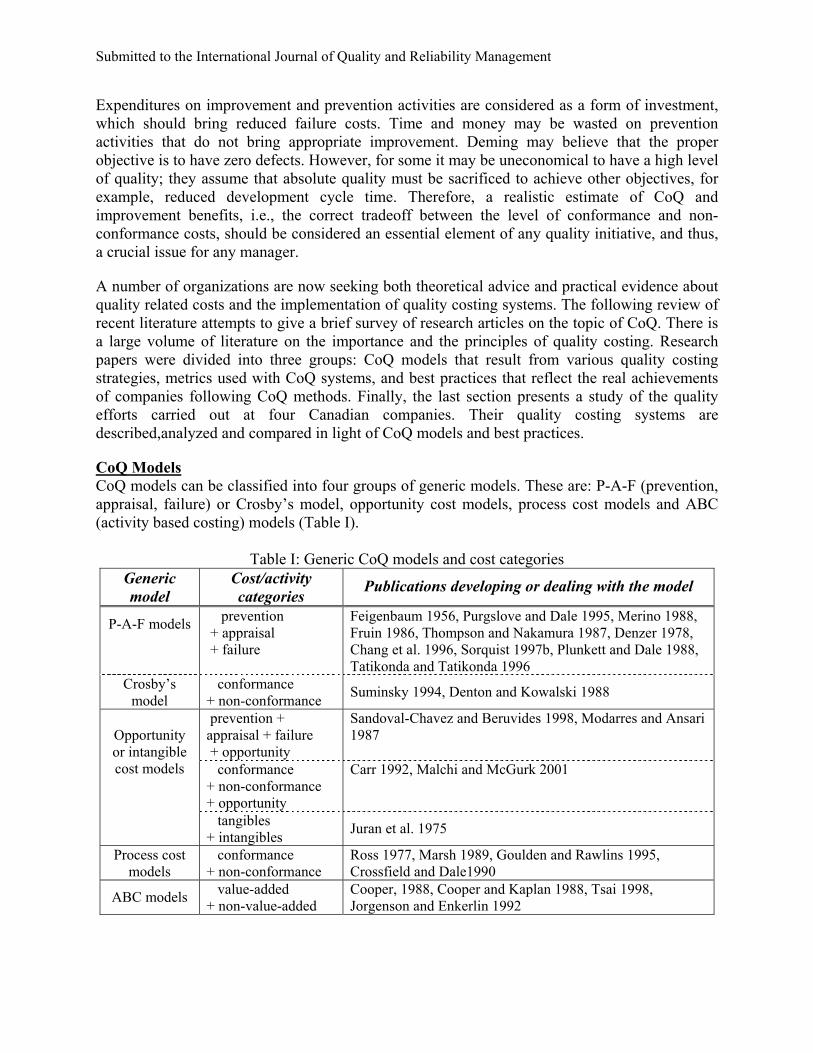
CoQ Models CoQ models can be classified into four groups of generic models. These are: P-A-F (prevention, appraisal, failure) or Crosby’s model, opportunity cost models, process cost models and ABC (activity based costing) models (Table I).
Table I: Generic CoQ models and cost categories Generic model
Cost/activity categories Publications developing or dealing with the model
P-A-F models prevention + appraisal + failure
Feigenbaum 1956, Purgslove and Dale 1995, Merino 1988, Fruin 1986, Thompson and Nakamura 1987, Denzer 1978, Chang et al. 1996, Sorquist 1997b, Plunkett and Dale 1988, Tatikonda and Tatikonda 1996
Crosby’s model
conformance + non-conformance Suminsky 1994, Denton and Kowalski 1988
prevention + appraisal + failure + opportunity
Sandoval-Chavez and Beruvides 1998, Modarres and Ansari 1987
conformance + non-conformance + opportunity
Carr 1992, Malchi and McGurk 2001
Opportunity or intangible cost models
tangibles + intangibles Juran et al. 1975
Process cost models
conformance + non-conformance
Ross 1977, Marsh 1989, Goulden and Rawlins 1995, Crossfield and Dale1990
ABC models value-added + non-value-added
Cooper, 1988, Cooper and Kaplan 1988, Tsai 1998, Jorgenson and Enkerlin 1992
Submitted to the International Journal of Quality and Reliability Management
Most cost models are based on a P-A-F classification (Plunkett and Dale 1987, Machowski and Dale 1998, Sandoval-Chávez and Beruvides 1997). It was Joseph Juran (1951) who first discussed the cost of quality analysis and became a pioneer of quality costing, and it was Armand Feigenbaum (1956) who identified four quality cost categories: prevention, appraisal and failure (internal and external). Prevention costs are associated with actions taken to ensure that a process provides quality products and services, appraisal costs are associated with measuring the level of quality attained by the process, and failure costs are incurred to correct quality in products and services before (internal) or after (external) delivery to the customer. Juran later highlighted the traditional tradeoff that contrasts prevention plus appraisal costs with failure costs (Juran, 1962). The basic suppositions of the P-A-F model are that investment in prevention and appraisal activities will reduce failure costs, and that further investment in prevention activities will reduce appraisal costs (Porter and Rayner 1992, Plunkett and Dale 1987). The objective of a CoQ system is to find the level of quality that minimizes total cost of quality. Feigenbaum’s and Juran’s P-A-F scheme has been adopted by the American Society for Quality Control (ASQC, 1970), and the British Standard Institute (BS6143, 1990) and is employed by most of the companies which use quality costing (Porter and Rayner, 1992).
The cost categories of Crosby’s model (Crosby, 1979) are similar to the P-A-F scheme. Crosby sees quality as “conformance to requirements”, and therefore, defines the cost of quality as the sum of price of conformance and price of non-conformance (Crosby, 1979). The price of conformance is the cost involved in making certain that things are done right the first time, which includes actual prevention and appraisal costs, and the price of non-conformance is the money wasted when work fails to conform to customer requirements, usually calculated by quantifying the cost of correcting, reworking or scrapping, which corresponds to actual failure costs. The model is used in companies that measure quality costs; however, most of the time it is only a different terminology describing a P-A-F model (Goulden and Rawlins, 1995), and the two costing structures are used interchangeably.
The importance of opportunity and intangible costs has been recently emphasized. Intangible costs are costs that can be only estimated such as profits not earned because of lost customers and reduction in revenue owing to non-conformance. Sandoval-Chavez and Beruvides (1998) incorporate opportunity losses into traditional P-A-F quality expenses. According to them opportunity losses may be broken down into three components: underutilization of installed capacity, inadequate material handling and poor delivery of service. He expresses total CoQ as revenue lost and profit not earned. Modarress and Ansari (1987) also advocate that the P-A-F model be expanded to accommodate extra dimensions that are identified as the cost of inefficient resource utilization and quality design cost. Carr (1992) includes opportunity cost and reports evidence of its successful use in a quality program. Quality costs are defined in three categories: the cost of conformance, the cost of non-conformance and the cost of lost opportunity. Other authors address the cost of lost costumers derived from product failures that reach the market (Tatikonda and Tatikonda 1996, Heagy 1991). Juran’s model (Juran et al., 1975) also recognizes the importance of intangibles. His CoQ scheme includes two measurable cost categories: tangible factory costs and tangible sales costs, and he suggests the inclusion of intangible internal benefits.
The process cost model developed by Ross (1977) and first used for quality costing by Marsch (1989) represents quality cost systems that focus on process rather than products or services.
Submitted to the International Journal of Quality and Reliability Management
Process cost is the total cost of conformance and non-conformance for a particular process. The cost of conformance is the actual process cost of producing products or services first time to the required standards by a given specified process, whereas cost of non-conformance is the failure cost associated with the process not being executed to the required standard. These costs can be measured at any step of the process. Accordingly, it can be determined whether high non-conformance costs show the requirement for further expenditure on failure prevention activities or whether excessive conformance costs indicate the need for a process redesign (Porter and Rayner, 1992).
The process modeling method called IDEF (the computer-aided manufacturing integrated program definition methodology) developed by Ross (1977) is useful for experts in system modeling; nevertheless, for common use by managers or staff it is too complex. Simpler methods were developed to overcome this limitation. Crossfield and Dale (1990) suggest a method for the mapping of quality assurance procedures, information flows and quality-related responsibilities. Goulden and Rawlins (1995) utilize a hybrid model for process quality costing where flowcharts are used to represent the main processes.
The use of a process cost model is suggested as a preferred method for quality costing within total quality management (TQM) as it recognizes the importance of process cost measurement and ownership, and presents a more integrated approach to quality than a P-A-F model (Porter and Rayner, 1992). Goulden and Rawlins (1995) also suggest that analysts place emphasis on the cost of each process rather than on an arbitrarily defined cost of quality under a P-A-F model. Moreover, the quality cost categorization is simpler and some researchers (Porter and Rayner, 1992) argue that it is also more relevant than the P-A-F scheme. The process model has wider application in that it facilitates the collection and analysis of quality costs for both direct and indirect functions. However, the process cost model is not in widespread use (Goulden and Rawlins, 1995).
Existing accounting systems are usually considered as poorly fitted for generating reports on quality measurements (Tatikonda and Tatikonda 1996, Sorqvist 1997a). They do not provide appropriate quality related data and benefits resulting from improved quality are not measured (Merino, 1988). Although most CoQ measurement methods are activity/process oriented, traditional cost accounting establishes cost accounts by the categories of expenses instead of activities. Thus, many CoQ elements need to be estimated or collected by other methods. There is no consensus method on how to allocate overheads to CoQ elements and no adequate method to trace quality costs to their sources (Tsai, 1998). An activity-based costing (ABC) model was developed by Cooper and Kaplan (Cooper 1988, Cooper and Kaplan 1988) to solve this problem. Under ABC accurate costs for various cost objects are achieved by tracing resource costs to their respective activities and the cost of activities to cost objects. The ABC approach is actually not a CoQ model. It is an alternative approach that can be used to identify, quantify and allocate quality costs among products, and therefore, helps to manage quality costs more effectively. Tsai (1998) proposes an integrated CoQ-ABC framework, in which ABC and CoQ systems are merged and share a common database in order to supply various cost and non-financial information for related management techniques. The long-term goal of ABC systems is to eliminate non-value added activities and to continuously improve processes, activities and quality so that no defects are produced.
Submitted to the International Journal of Quality and Reliability Management
CoQ Parameters
There are many possible parameters that can be used in CoQ models. Johnson (1995) has published a large list of example elements, which could be included. However, since there is no set structure and no accounting standard for quality costing, the decision on the cost structure of the CoQ model is left to the judgment of quality managers or even quality data collectors. Therefore, the elements included in CoQ models of various companies differ substantially. The same elements are often placed into different cost categories or they are even defined in a different way in order to fit the particular needs of a company (Sorqvist 1997a, Johnson 1995). In order to identify cost of quality elements, some organizations benchmark or borrow elements from other companies, which have established CoQ programs (Bemowski, 1991). Nevertheless, most quality experts say that CoQ programs should be tailor-made for each organization such that they are integrated into a company’s organizational structure and accounting system rather than just being borrowed (Campanella 1990, Johnson 1995, Salm 1991). Campanella (1990) emphasizes that decisions regarding which cost elements should be part of CoQ and to which cost category they should belong are not as important as consistency. According to him companies should have a consistent set of comparisons that are made from period to period as the CoQ program evolves; quality cost elements should be developed, deleted, modified, or combined as seems reasonable.
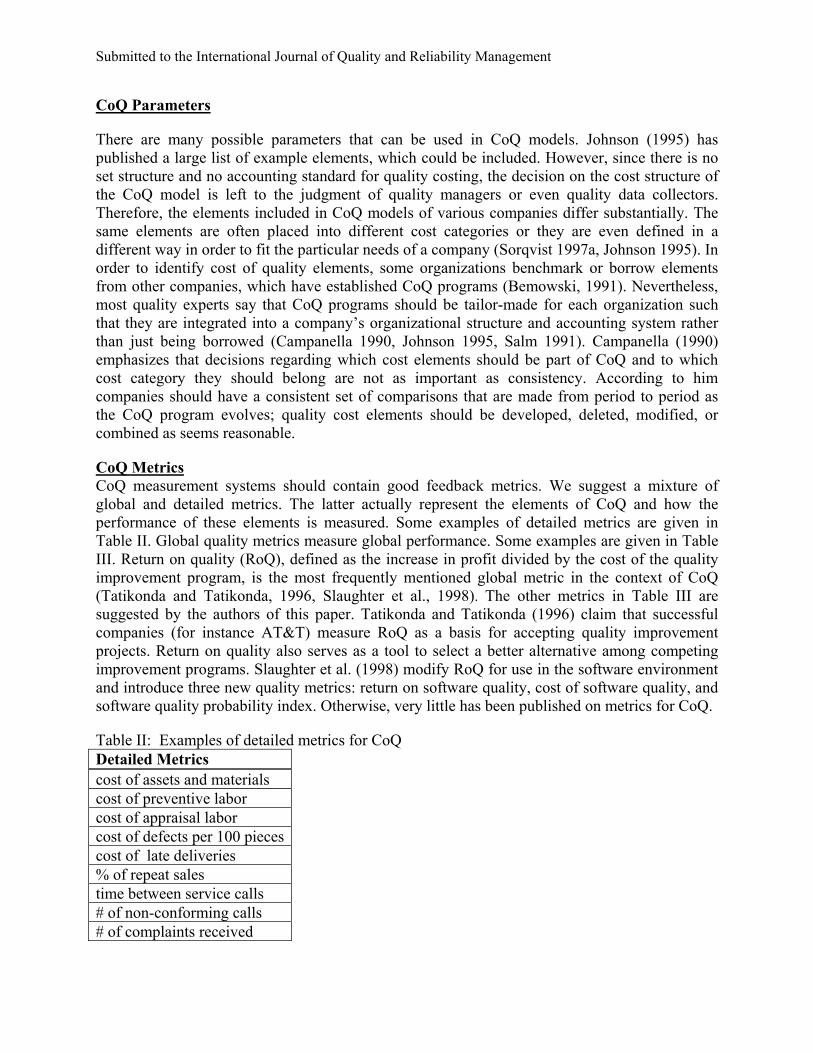
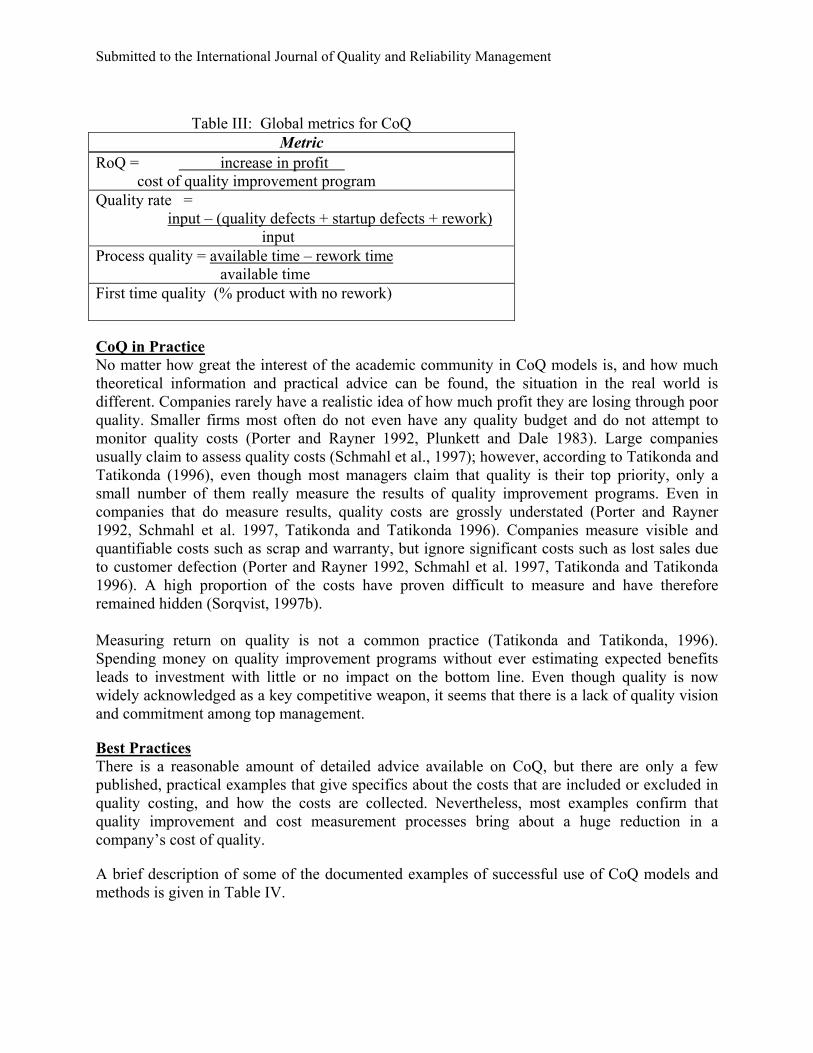
CoQ Metrics CoQ measurement systems should contain good feedback metrics. We suggest a mixture of global and detailed metrics. The latter actually represent the elements of CoQ and how the performance of these elements is measured. Some examples of detailed metrics are given in Table II. Global quality metrics measure global performance. Some examples are given in Table III. Return on quality (RoQ), defined as the increase in profit divided by the cost of the quality improvement program, is the most frequently mentioned global metric in the context of CoQ (Tatikonda and Tatikonda, 1996, Slaughter et al., 1998). The other metrics in Table III are suggested by the authors of this paper. Tatikonda and Tatikonda (1996) claim that successful companies (for instance AT&T) measure RoQ as a basis for accepting quality improvement projects. Return on quality also serves as a tool to select a better alternative among competing improvement programs. Slaughter et al. (1998) modify RoQ for use in the software environment and introduce three new quality metrics: return on software quality, cost of software quality, and software quality probability index. Otherwise, very little has been published on metrics for CoQ.
Table II: Examples of detailed metrics for CoQ Detailed Metrics cost of assets and materials cost of preventive labor cost of appraisal labor cost of defects per 100 pieces cost of late deliveries % of repeat sales time between service calls # of non-conforming calls # of complaints received
Submitted to the International Journal of Quality and Reliability Management
Table III: Global metrics for CoQ
Metric RoQ = increase in profit cost of quality improvement program Quality rate = input – (quality defects + startup defects + rework) input Process quality = available time – rework time available time First time quality (% product with no rework)
CoQ in Practice No matter how great the interest of the academic community in CoQ models is, and how much theoretical information and practical advice can be found, the situation in the real world is different. Companies rarely have a realistic idea of how much profit they are losing through poor quality. Smaller firms most often do not even have any quality budget and do not attempt to monitor quality costs (Porter and Rayner 1992, Plunkett and Dale 1983). Large companies usually claim to assess quality costs (Schmahl et al., 1997); however, according to Tatikonda and Tatikonda (1996), even though most managers claim that quality is their top priority, only a small number of them really measure the results of quality improvement programs. Even in companies that do measure results, quality costs are grossly understated (Porter and Rayner 1992, Schmahl et al. 1997, Tatikonda and Tatikonda 1996). Companies measure visible and quantifiable costs such as scrap and warranty, but ignore significant costs such as lost sales due to customer defection (Porter and Rayner 1992, Schmahl et al. 1997, Tatikonda and Tatikonda 1996). A high proportion of the costs have proven difficult to measure and have therefore remained hidden (Sorqvist, 1997b). Measuring return on quality is not a common practice (Tatikonda and Tatikonda, 1996). Spending money on quality improvement programs without ever estimating expected benefits leads to investment with little or no impact on the bottom line. Even though quality is now widely acknowledged as a key competitive weapon, it seems that there is a lack of quality vision and commitment among top management.
Best Practices There is a reasonable amount of detailed advice available on CoQ, but there are only a few published, practical examples that give specifics about the costs that are included or excluded in quality costing, and how the costs are collected. Nevertheless, most examples confirm that quality improvement and cost measurement processes bring about a huge reduction in a company’s cost of quality.
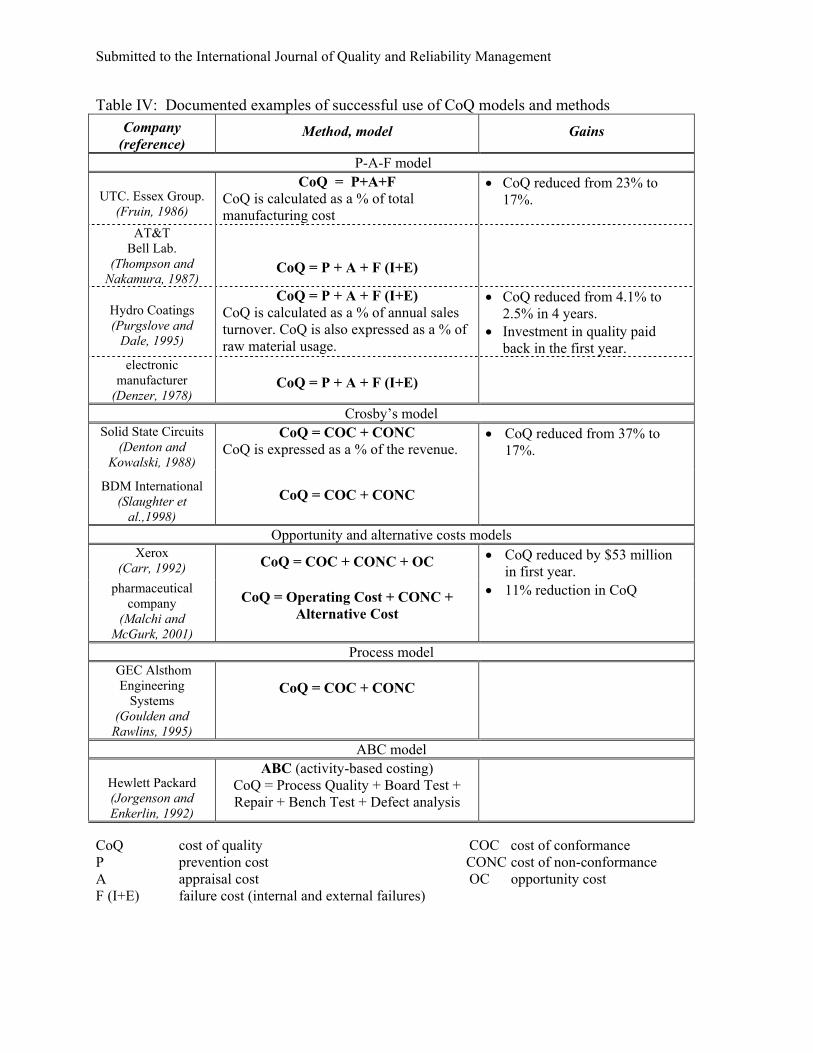
A brief description of some of the documented examples of successful use of CoQ models and methods is given in Table IV.
Submitted to the International Journal of Quality and Reliability Management
Table IV: Documented examples of successful use of CoQ models and methods Company
(reference) Method, model Gains
P-A-F model
UTC. Essex Group. (Fruin, 1986)
CoQ = P+A+F CoQ is calculated as a % of total manufacturing cost
• CoQ reduced from 23% to 17%.
AT&T
Bell Lab. (Thompson and
Nakamura, 1987)
CoQ = P + A + F (I+E)
Hydro Coatings (Purgslove and
Dale, 1995)
CoQ = P + A + F (I+E) CoQ is calculated as a % of annual sales turnover. CoQ is also expressed as a % of raw material usage.
• CoQ reduced from 4.1% to 2.5% in 4 years.
• Investment in quality paid back in the first year.
electronic manufacturer
(Denzer, 1978)
CoQ = P + A + F (I+E)
Crosby’s model Solid State Circuits
(Denton and Kowalski, 1988)
CoQ = COC + CONC CoQ is expressed as a % of the revenue.
• CoQ reduced from 37% to 17%.
BDM International (Slaughter et
al.,1998) CoQ = COC + CONC
Opportunity and alternative costs models Xerox
(Carr, 1992) CoQ = COC + CONC + OC • CoQ reduced by $53 million in first year.
pharmaceutical company
(Malchi and McGurk, 2001)
CoQ = Operating Cost + CONC + Alternative Cost
• 11% reduction in CoQ
Process model GEC Alsthom
Engineering Systems
(Goulden and Rawlins, 1995)
CoQ = COC + CONC
ABC model
Hewlett Packard (Jorgenson and Enkerlin, 1992)
ABC (activity-based costing) CoQ = Process Quality + Board Test + Repair + Bench Test + Defect analysis
CoQ cost of quality COC cost of conformance P prevention cost CONC cost of non-conformance A appraisal cost OC opportunity cost F (I+E) failure cost (internal and external failures)
Submitted to the International Journal of Quality and Reliability Management
Table IV shows that the companies whose best practices are documented in this paper most often implement their CoQ programs in accordance with the universally accepted Feigenbaum’s costing structure (Feigenbaum, 1956). United Technologies Corporation, Essex Telecommunication Products Division, established CoQ measurement based on a P-A-F model and five years of implementation have yielded an improvement of 26% in CoQ measured against cost of goods produced. Specific accomplishments as well as elements of the cost of quality calculation and their relationship to financial performance are examined in detail by Fruin (1986). Thompson and Nakamura (1987) also follow P-A-F quality costing structure and propose a plan, which is currently being used to collect and report CoQ data from several development projects at AT&T Bell Laboratories, Transmission Systems Division. They suggest that managing CoQ in the R&D process is an effective way to improve product development. The work of Purgslove and Dale (1995) discusses the development and operation of a system of quality costing at a manufacturer of coatings for industrial applications. Their CoQ measurement system implementation is based on the P-A-F model as well. They report that the investment made in quality improvement was paid back within the first year. Denzer (1978) presents a description of a P-A-F cost of quality system used in an electronics manufacturing facility and indicates significant quality cost reduction. Moreover, he shows that the collection and use of quality costs are an aid to management and are accompanied by improvement of quality.
As indicated earlier, Crosby’s model (Crosby, 1979), in which CoQ is expressed as the\ sum of cost of conformance and cost of non-conformance, is considered technically the same as Feigenbaum’s, and the terminology of both is often used together in one model. Crosby’s model is documented to have been successfully used for quality improvement programs at several companies. Solid State Circuits, a manufacturer of printed circuits boards, has designed new methods of measuring conforming and non-conforming costs and the use of such methods has led to the identification of causes of error and the devising of means of correcting them. Denton and Kowalski (1988) describe this quality improvement and measurement process and report a drop from 37% to 17% in the company’s cost of quality. Slaughter et al. (1998) have carried out a detailed study on the economics of software quality at BDM International, a major information technology company. They use marginal analysis of non-conformance costs to identify the greatest cost impacts of defect reduction during their quality initiatives and present their successful results. The paper includes a number of important insights for software managers who are interested in improving their decisions on software quality expenditures.
Use of opportunity or intangible costs for CoQ improvement programs has already provided sound results in industry. Xerox was the first company to use opportunity cost in order to determine the CoQ. Carr (1992) describes a program adopted by Xerox, which consists of a system of quality cost measures and cost of quality concepts adapted to service. The cost of lost opportunities category is defined as profit not earned owing to lost customers and reduction in revenue because of non-conformance. CoQ was reduced by $53 million in the first year of the program implemented at Xerox. Malchi and McGurk (2001) discuss the methodology of measuring the CoQ, which includes so-called alternative costs in the total CoQ. Alternative costs are hidden costs, and examples are lost sales, extra inventory, delays and unidentified scrap. They present a case study of implementation of this CoQ program in a pharmaceutical manufacturing facility, where implementing this methodology resulted in an 11% reduction in the cost of quality.
Submitted to the International Journal of Quality and Reliability Management
A quality costing system using the process approach has been successfully designed and implemented within the power systems division of GEC Alsthom Engineering Systems. Goulden and Rawlins (1995) describe this hybrid process model, which uses flowcharts. These were found to be most effective process modeling tools as they facilitated understanding and better interdepartmental communication.
Since activity-based costing (ABC) is considered more compatible with quality cost measurement systems than traditional accounting, its use for a CoQ determination is an appealing alternative. Jorgenson and Enkerlin (1992) describe how a Hewlett-Packard manufacturing operation utilized its ABC system to identify, quantify and allocate quality costs among its products. Having this information allowed product teams to simulate and reduce quality costs earlier in the product design phase.
These documented examples of CoQ improvement programs were successful. They brought about sufficient savings to justify CoQ measurement expenses, and they yielded a good productivity gain and reduction in quality costs. More importantly, they identified target areas for cost reduction and quality improvement.
Four Examples of Best Practice Since organizations are now seeking practical advice and evidence about quality related costs and developing quality costing systems, further investigation into best practices is needed. Four companies realizing the importance of quality in achieving a competitive edge agreed with McGill University to arrange a benchmarking session on cost of quality. The following summarizes the information on quality activities presented by the four companies during the workshop.
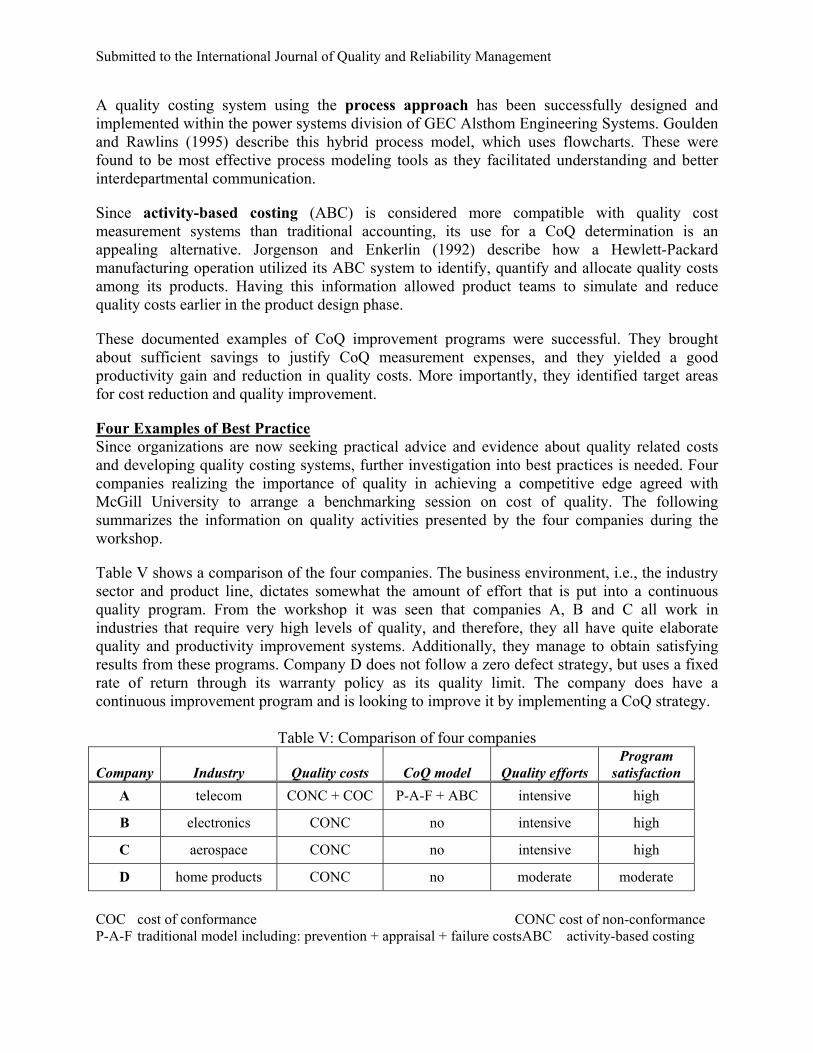
Table V shows a comparison of the four companies. The business environment, i.e., the industry sector and product line, dictates somewhat the amount of effort that is put into a continuous quality program. From the workshop it was seen that companies A, B and C all work in industries that require very high levels of quality, and therefore, they all have quite elaborate quality and productivity improvement systems. Additionally, they manage to obtain satisfying results from these programs. Company D does not follow a zero defect strategy, but uses a fixed rate of return through its warranty policy as its quality limit. The company does have a continuous improvement program and is looking to improve it by implementing a CoQ strategy.
Table V: Comparison of four companies
Company
Industry
Quality costs
CoQ model
Quality efforts Program
satisfaction A telecom CONC + COC P-A-F + ABC intensive high
B electronics CONC no intensive high
C aerospace CONC no intensive high
D home products CONC no moderate moderate
COC cost of conformance CONC cost of non-conformance P-A-F traditional model including: prevention + appraisal + failure costsABC activity-based costing
Submitted to the International Journal of Quality and Reliability Management
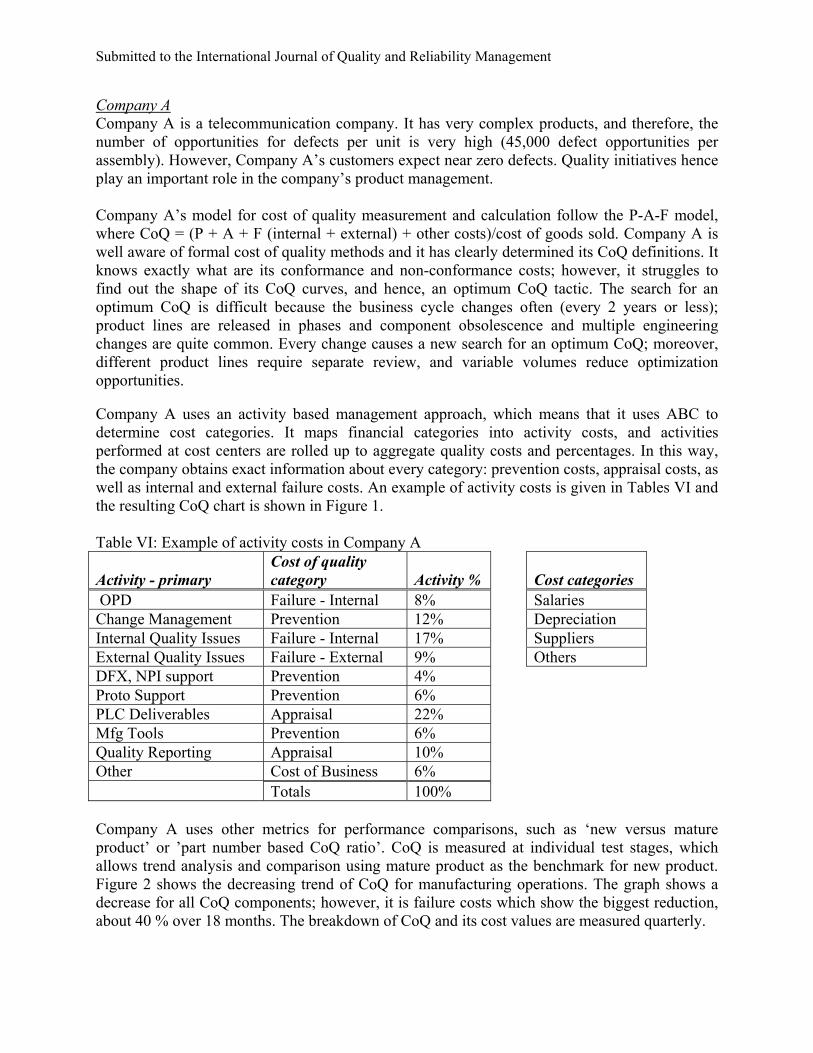
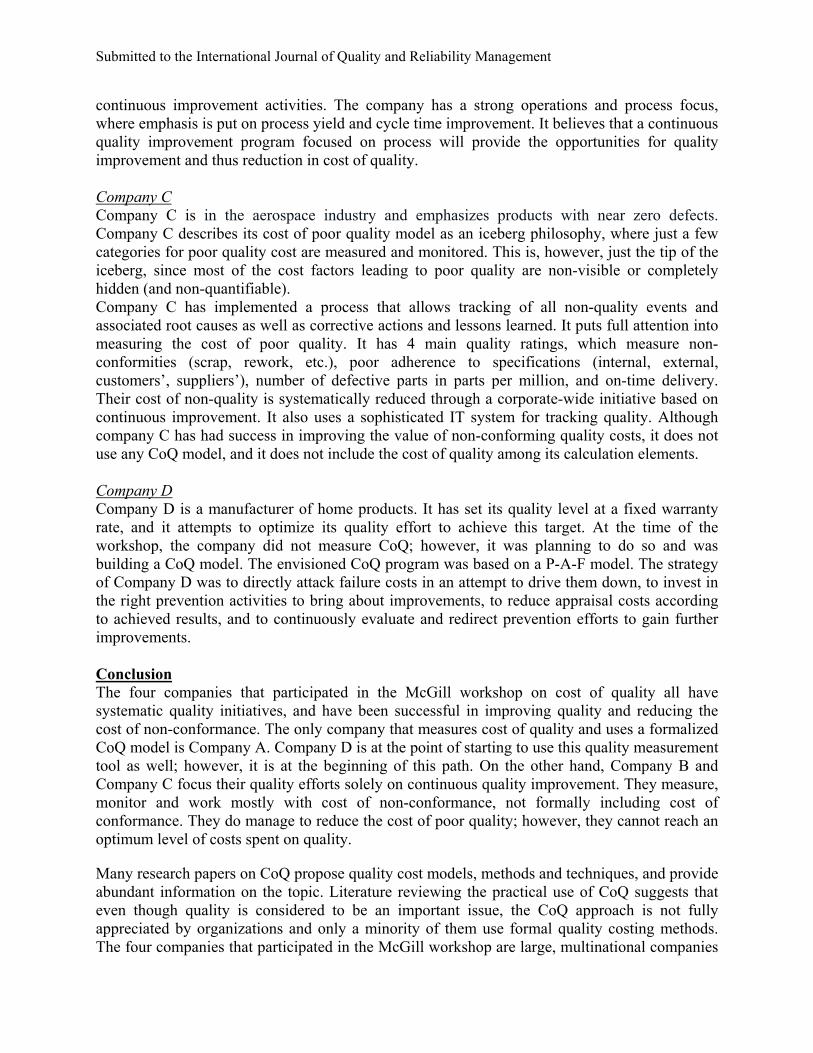
Company A Company A is a telecommunication company. It has very complex products, and therefore, the number of opportunities for defects per unit is very high (45,000 defect opportunities per assembly). However, Company A’s customers expect near zero defects. Quality initiatives hence play an important role in the company’s product management. Company A’s model for cost of quality measurement and calculation follow the P-A-F model, where CoQ = (P + A + F (internal + external) + other costs)/cost of goods sold. Company A is well aware of formal cost of quality methods and it has clearly determined its CoQ definitions. It knows exactly what are its conformance and non-conformance costs; however, it struggles to find out the shape of its CoQ curves, and hence, an optimum CoQ tactic. The search for an optimum CoQ is difficult because the business cycle changes often (every 2 years or less); product lines are released in phases and component obsolescence and multiple engineering changes are quite common. Every change causes a new search for an optimum CoQ; moreover, different product lines require separate review, and variable volumes reduce optimization opportunities. Company A uses an activity based management approach, which means that it uses ABC to determine cost categories. It maps financial categories into activity costs, and activities performed at cost centers are rolled up to aggregate quality costs and percentages. In this way, the company obtains exact information about every category: prevention costs, appraisal costs, as well as internal and external failure costs. An example of activity costs is given in Tables VI and the resulting CoQ chart is shown in Figure 1. Table VI: Example of activity costs in Company A Activity - primary
Cost of quality category
Activity %
Cost categories
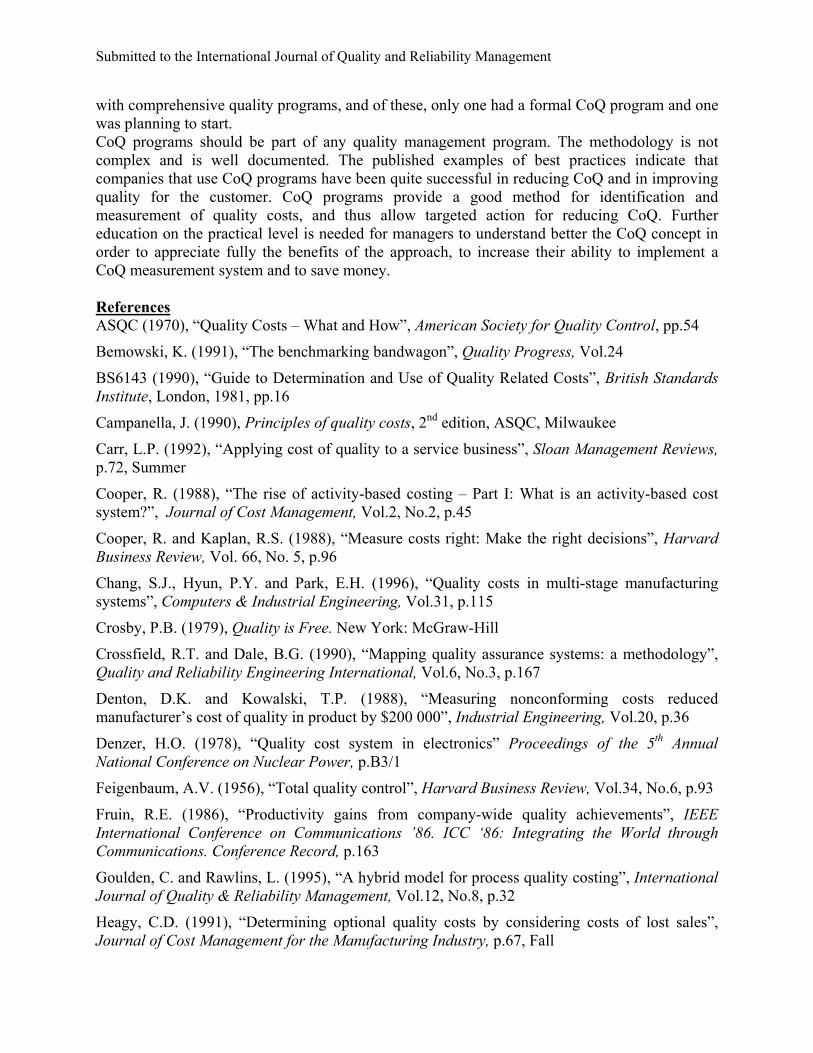
OPD Failure - Internal 8% Salaries Change Management Prevention 12% Depreciation Internal Quality Issues Failure - Internal 17% Suppliers External Quality Issues Failure - External 9% Others DFX, NPI support Prevention 4% Proto Support Prevention 6% PLC Deliverables Appraisal 22% Mfg Tools Prevention 6% Quality Reporting Appraisal 10% Other Cost of Business 6% Totals 100% Company A uses other metrics for performance comparisons, such as ‘new versus mature product’ or ’part number based CoQ ratio’. CoQ is measured at individual test stages, which allows trend analysis and comparison using mature product as the benchmark for new product. Figure 2 shows the decreasing trend of CoQ for manufacturing operations. The graph shows a decrease for all CoQ components; however, it is failure costs which show the biggest reduction, about 40 % over 18 months. The breakdown of CoQ and its cost values are measured quarterly.

Submitted to the International Journal of Quality and Reliability Management
Company A has been using their CoQ methodology successfully. The company declares savings in quality costs, has quality improvement in every part of their process and achieves very aggressive improvement targets. Moreover, the end customer directly benefits from the in-house quality initiative. As a result, customer satisfaction is increasing.
Figure 1. CoQ chart for Company A
Figure 2: Manufacturing operations CoQ for Company A shown on a relative cost scale.
Company B Company B is a multinational microelectronics company, which dedicates a lot of effort to quality improvement. Their far-reaching and successful quality improvement program is the main axis of their quality initiatives. The program includes continuous improvement focused on process as well as extensive education and training on quality for all employees. Despite the fact that there is a great interest in reducing non-conformance cost, Company B does not measure, report or chart CoQ. It does not use any formal CoQ model and does not try to optimize cost of quality. Nevertheless, it does reduce cost due to poor quality through its
Submitted to the International Journal of Quality and Reliability Management
continuous improvement activities. The company has a strong operations and process focus, where emphasis is put on process yield and cycle time improvement. It believes that a continuous quality improvement program focused on process will provide the opportunities for quality improvement and thus reduction in cost of quality. Company C Company C is in the aerospace industry and emphasizes products with near zero defects. Company C describes its cost of poor quality model as an iceberg philosophy, where just a few categories for poor quality cost are measured and monitored. This is, however, just the tip of the iceberg, since most of the cost factors leading to poor quality are non-visible or completely hidden (and non-quantifiable). Company C has implemented a process that allows tracking of all non-quality events and associated root causes as well as corrective actions and lessons learned. It puts full attention into measuring the cost of poor quality. It has 4 main quality ratings, which measure non-conformities (scrap, rework, etc.), poor adherence to specifications (internal, external, customers’, suppliers’), number of defective parts in parts per million, and on-time delivery. Their cost of non-quality is systematically reduced through a corporate-wide initiative based on continuous improvement. It also uses a sophisticated IT system for tracking quality. Although company C has had success in improving the value of non-conforming quality costs, it does not use any CoQ model, and it does not include the cost of quality among its calculation elements. Company D Company D is a manufacturer of home products. It has set its quality level at a fixed warranty rate, and it attempts to optimize its quality effort to achieve this target. At the time of the workshop, the company did not measure CoQ; however, it was planning to do so and was building a CoQ model. The envisioned CoQ program was based on a P-A-F model. The strategy of Company D was to directly attack failure costs in an attempt to drive them down, to invest in the right prevention activities to bring about improvements, to reduce appraisal costs according to achieved results, and to continuously evaluate and redirect prevention efforts to gain further improvements. Conclusion The four companies that participated in the McGill workshop on cost of quality all have systematic quality initiatives, and have been successful in improving quality and reducing the cost of non-conformance. The only company that measures cost of quality and uses a formalized CoQ model is Company A. Company D is at the point of starting to use this quality measurement tool as well; however, it is at the beginning of this path. On the other hand, Company B and Company C focus their quality efforts solely on continuous quality improvement. They measure, monitor and work mostly with cost of non-conformance, not formally including cost of conformance. They do manage to reduce the cost of poor quality; however, they cannot reach an optimum level of costs spent on quality.
Many research papers on CoQ propose quality cost models, methods and techniques, and provide abundant information on the topic. Literature reviewing the practical use of CoQ suggests that even though quality is considered to be an important issue, the CoQ approach is not fully appreciated by organizations and only a minority of them use formal quality costing methods. The four companies that participated in the McGill workshop are large, multinational companies
Submitted to the International Journal of Quality and Reliability Management
with comprehensive quality programs, and of these, only one had a formal CoQ program and one was planning to start. CoQ programs should be part of any quality management program. The methodology is not complex and is well documented. The published examples of best practices indicate that companies that use CoQ programs have been quite successful in reducing CoQ and in improving quality for the customer. CoQ programs provide a good method for identification and measurement of quality costs, and thus allow targeted action for reducing CoQ. Further education on the practical level is needed for managers to understand better the CoQ concept in order to appreciate fully the benefits of the approach, to increase their ability to implement a CoQ measurement system and to save money. References ASQC (1970), “Quality Costs – What and How”, American Society for Quality Control, pp.54
Bemowski, K. (1991), “The benchmarking bandwagon”, Quality Progress, Vol.24
BS6143 (1990), “Guide to Determination and Use of Quality Related Costs”, British Standards Institute, London, 1981, pp.16
Campanella, J. (1990), Principles of quality costs, 2nd edition, ASQC, Milwaukee
Carr, L.P. (1992), “Applying cost of quality to a service business”, Sloan Management Reviews, p.72, Summer
Cooper, R. (1988), “The rise of activity-based costing – Part I: What is an activity-based cost system?”, Journal of Cost Management, Vol.2, No.2, p.45
Cooper, R. and Kaplan, R.S. (1988), “Measure costs right: Make the right decisions”, Harvard Business Review, Vol. 66, No. 5, p.96
Chang, S.J., Hyun, P.Y. and Park, E.H. (1996), “Quality costs in multi-stage manufacturing systems”, Computers & Industrial Engineering, Vol.31, p.115
Crosby, P.B. (1979), Quality is Free. New York: McGraw-Hill
Crossfield, R.T. and Dale, B.G. (1990), “Mapping quality assurance systems: a methodology”, Quality and Reliability Engineering International, Vol.6, No.3, p.167
Denton, D.K. and Kowalski, T.P. (1988), “Measuring nonconforming costs reduced manufacturer’s cost of quality in product by $200 000”, Industrial Engineering, Vol.20, p.36
Denzer, H.O. (1978), “Quality cost system in electronics” Proceedings of the 5th Annual National Conference on Nuclear Power, p.B3/1
Feigenbaum, A.V. (1956), “Total quality control”, Harvard Business Review, Vol.34, No.6, p.93
Fruin, R.E. (1986), “Productivity gains from company-wide quality achievements”, IEEE International Conference on Communications ’86. ICC ‘86: Integrating the World through Communications. Conference Record, p.163
Goulden, C. and Rawlins, L. (1995), “A hybrid model for process quality costing”, International Journal of Quality & Reliability Management, Vol.12, No.8, p.32
Heagy, C.D. (1991), “Determining optional quality costs by considering costs of lost sales”, Journal of Cost Management for the Manufacturing Industry, p.67, Fall
Submitted to the International Journal of Quality and Reliability Management
Johnson, M.A. (1995), “The development of measures of the cost of quality for an engineering unit”, International Journal of Quality & Reliability Management, Vol.12, No.2, p.86
Jorgenson, D.M. and Enkerlin, M.E. (1992), “Managing quality costs with the help of activity-based costing”, Journal of Electronics Manufacturing, Vol.2, p.153
Juran, J.M. (1951), Quality Control Handbook, 1st edition, McGraw-Hill, New York
Juran, J.M., Gryna, F.M. and Bingham, R. (1975), Quality Control Textbook, 3rd edition, McGraw-Hill, New York
Machowski, F. And Dale, B.G. (1998), “Quality Costing: An examination of knowledge, attitudes and perceptions”, Quality Management Journal, Vol.5, No.3, p.84
Malchi, G. and McGurk, H. (2001), “Increasing value through the measurement of the cost of quality (CoQ) – A practical approach”, Pharmaceutical Engineering, Vol.21, No.3, p.92
Marsh, J. (1989), “Process modeling for quality improvement”, Proceedings of the Second International Conference on Total Quality Management, p.111
Merino, D.N. (1988), “Economics of quality: Choosing among prevention alternatives”, International Journal of Quality & Reliability Management, p.13, September
Modarres, B. and Ansari, A. (1987), “Two new dimensions in the cost of quality”, International Journal of Quality & Reliability Management, Vol.4, No.4, p.9
Plunkett, J.J. and Dale, B.G. (1983), “Quality costing: a study in the pressure vessel fabrication section of the process plant industry”, Quality Assurance, Vol.9, p.93
Plunkett, J.J. and Dale, B.G. (1987), “A review of the literature on quality-related costs”, International Journal of Quality & Reliability Management, Vol.4, No.1, p.40
Plunkett, J.J. and Dale, B.G. (1988), “Quality costs: A critique of some ‘economic cost of quality’ models”, International Journal of Production Research, Vol.26, p.1713
Porter, L.J. and Rayner, P. (1992), “Quality costing for total quality management”, International Journal of Production Economics, Vol. 27, p.69
Purgslove, A.B. and Dale, B.G. (1995), “Developing a quality costing system: Key features and outcomes”, Omega, Vol.23, p.567
Ross, D.T. (1977), “Structured analysis (SA): A language for communicating ideas”, IEEE Transactions on Software Engineering, Vol.SE-3, No.1, p.16
Salm, J.L. (1991), “Examining the cost of quality”, Manufacturing Systems, Vol.9, No.4
Sandoval-Chavez, D.A. and Beruvides, M.G. (1998), “Using opportunity costs to determine the cost of quality: A case study in a continuous-process industry”, Engineering Economist, Vol.43, p.107
Schmahl, K.E., Dessouky, Y. and Rucker, D. (1997), “Measuring the cost of quality”, Production and Inventory Management Journal, Vol.38, p.58
Shank, J.K. and Govindarajan, V. (1994), “Measuring the cost of quality: A strategic cost management perspective”, Journal of Cost Management, Vol.8, No.2, p.5
Submitted to the International Journal of Quality and Reliability Management
Slaughter, S.A., Harter, D.E. and Krishnan, M.S. (1998), “Evaluating the cost of software quality”, Communications of the ACM, Vol.41, p.67
Sorqvist, L. (1997a), “Difficulties in measuring the cost of poor quality”, European Quality, Vol.4, No.2, p.40
Sorqvist, L. (1997b), “Effective methods for measuring the cost of poor quality”, European Quality, Vol.4, No.3, p.42
Suminsky Jr.,L.T. (1994), “Measuring cost of quality”, Quality Digest, Vol.14, No.3, p.26
Tatikonda, L.U. and Tatikonda, R.J. (1996), “Measuring and reporting the cost of quality”, Production and Inventory Management Journal, Vol.37, p.1
Thompson Jr.,W.G. and Nakamura, S. (1987), “Measuring cost of quality in the development process”, IEEE International Conference on Communications ’87: Communications-Sound to Light. Proceedings, p.1770
Tsai, W.H. (1998), “Quality cost measurement under activity-based costing”, International Journal of Quality and Reliability Management, Vol.15, No.6, p.719
Autobiographical Note Andrea Schiffauerova, PhD student For her PhD, Ms. Schiffauerova is studying methods that consider how scope, technology, cost, risk, etc. impact product development projects. She has also participated in projects in cost of quality, risk management and engineering change.
McGill University, Department of Mechanical Engineering 817 Sherbrooke Street West Montreal, QC, Canada, H3A 2K6 tel: 1-450-462-5778 email: [email protected]
Vince Thomson, Werner Graupe Professor of Manufacturing Automation Dr. Thomson has been involved in manufacturing and information technology related research for the past 25 years at McGill University and the National Research Council (Canada). His research has ranged from shop floor control and production scheduling to the present interest in real-time control and process management in manufacturing. His process management research has focused on new product introduction, concurrent engineering and manufacturing support in terms of coordination, metrics, and process principles.
McGill University, Department of Mechanical Engineering 817 Sherbrooke Street West Montreal, QC, Canada, H3A 2K6 tel: 1-514-398-2597 fax: 1-514-398-7365 email: [email protected] http://www.mcgill.ca/mecheng/staff/academic


