Costing Human Resources
The Financial Impact of Behavior in OrganizationsWayne F. Cascio
Costing Human Resources First recognized approach was
developed by R.G. Barry Corp. of Columbus OH in 1967.
Department managers measured on five costs: Recruiting Acquisition Formal Training Informal Training Development
“People are our most valuable asset.”

Asset Based Strategies
Historical Cost Replacement Cost Present Value of Future Earnings Value to the Organization

Historical Cost
Assets are placed on the books at acquisition cost.
Assets are depreciated of their anticipated useful life.
Maintenance costs for the assets are expensed during each operating period.
Replacement Cost
A reasonable substitute for market value.
Confounded by cost of acquisition (inefficient hiring).
Often, turnover is low enough to make replacement cost only an educated guess.
A projection of a person’s future compensation in today’s dollars.
Limited by forecasting the contribution based on average output.
Limited by measuring worth as cost, not contribution to revenue or profit.
Present Value of Future Earnings
Value is determined by internal competition of managers to obtain services of that individual.
Difficult to implement.
Value to the Organization
Strengths/Weaknesses Investment is tracked and is
appropriate for external reporting. Dollar is not stable over time. Write-offs of failed programs is
subjective. People, as assets, are not saleable,
value is not confirmed in the marketplace.
Only costs are measured, not value to the current organization.
People are thought to gain value with experience.
People measures are usually behavioral and statistical, rather than financial.
Economic measures of people are typically cost-based, rather than asset based.
Strengths/Weaknesses
Behavioral Costing
Effective measurement must include the value of employee output, as well as cost.
Cascio’s Approach

Behavioral Costing
Effective measurement must include the value of employee output, as well as cost.
Effective measurement must include variability of output and cost by individual and group.
Cascio’s Approach
Behavioral Costing
Effective measurement must include the value of employee output, as well as cost.
Effective measurement must include variability of output and cost by individual and group.
Many organizations do not want to measure and be accountable for how well they manage people.
Cascio’s Approach
Focus on dollar value of behavioral outcomes in organizations.
Cascio’s Approach
Behavioral Costing
Focus on dollar value of behavioral outcomes in organizations.
Do not focus on the value of the individual, but on the economic consequences of behavior.
Cascio’s Approach
Behavioral Costing

Focus on dollar value of behavioral outcomes in organizations.
Do not focus on the value of the individual, but on the economic consequences of behavior.
This is an expense model, not an asset model.
Cascio’s Approach
Behavioral Costing
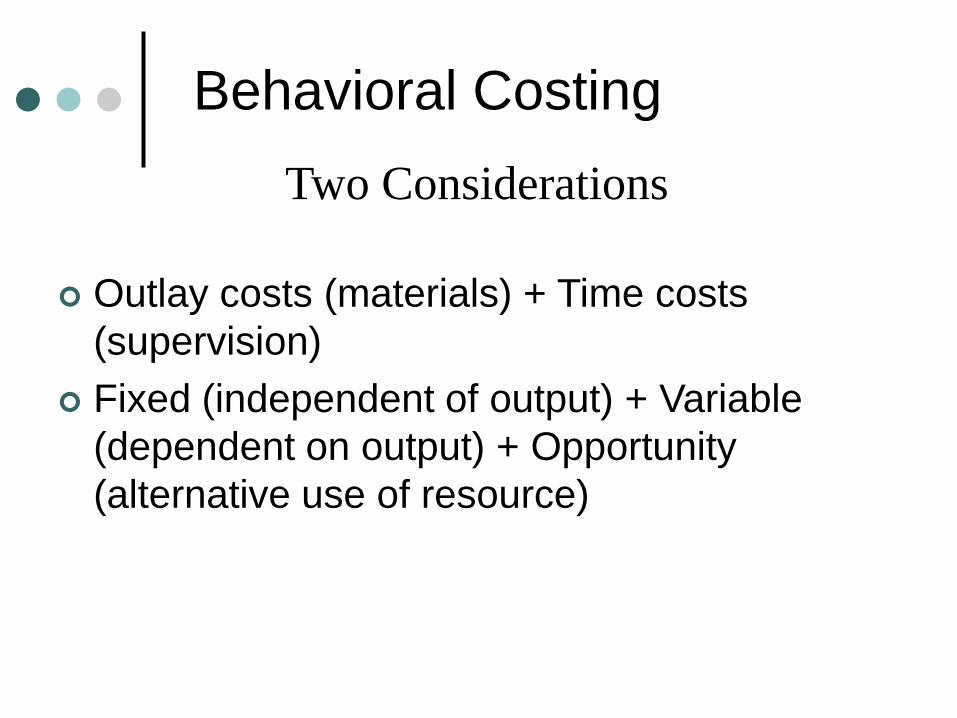
Outlay costs (materials) + Time costs (supervision)
Fixed (independent of output) + Variable (dependent on output) + Opportunity (alternative use of resource)
Two Considerations
Behavioral Costing
Behavioral Costing
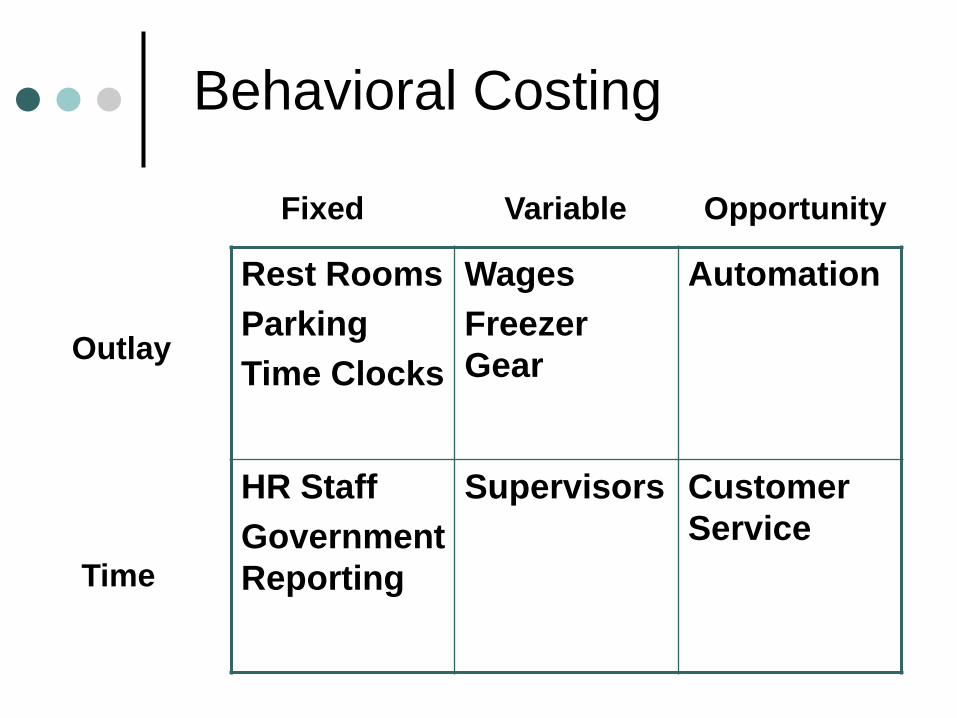
Rest RoomsParkingTime Clocks
WagesFreezer Gear
Automation
HR StaffGovernment Reporting
Supervisors Customer Service
Outlay
Time
Fixed Variable Opportunity

No methods of measurement. Top management believes the cost is
unquantifiable. Some managers want to avoid measurement. Past efforts have failed.
Challenges
Behavioral Costing
Compensation Programs Benefits Personnel Taxes Recruiting and Training Affirmative Action/Selection Turnover Safety
Cost Impact Categories
Behavioral Costing
Turnover

Turnover
Turnover = (Separations/Average Work Force Size) X 100
VoluntaryInvoluntary
Employee – ConductEmployer – Operations
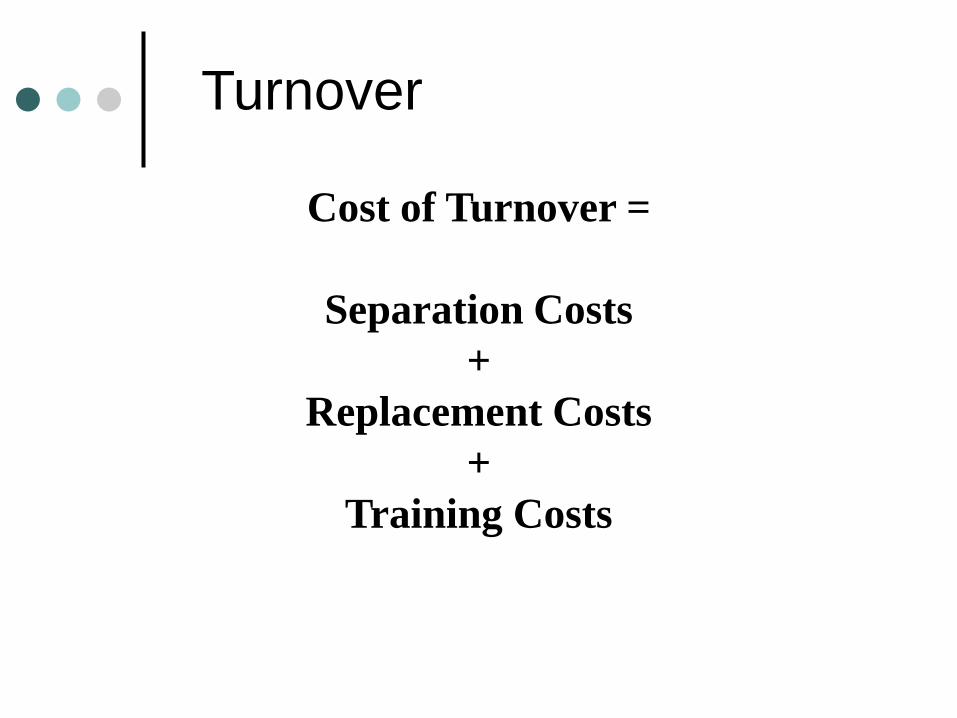
Cost of Turnover =
Separation Costs+
Replacement Costs+
Training Costs
Turnover

Exit Processing $ 35 Plant Staff (1x$25) Payroll (.5x$20)
Separation Pay $ 0 Unemployment Tax Impact $ 6,750 20 Weeks x $320 ESD, WA 2011
Separation Costs
Turnover

Communication of Vacancy $ 85 Pre-employment Admin (2x$25) $ 50 Selection Interviews (.5x$100) $ 50 Testing – Fit for Duty + Drug $ 170 Orientation (1x$25) $ 25 Relocation Expense $ 0
Replacement Costs
Turnover
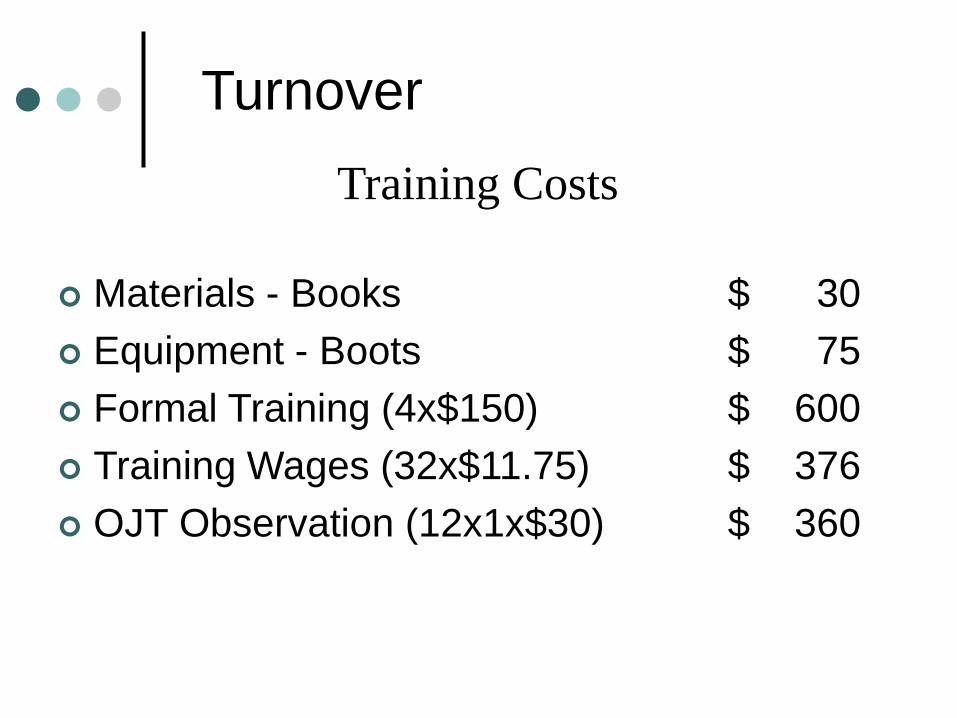
Materials - Books $ 30 Equipment - Boots $ 75 Formal Training (4x$150) $ 600 Training Wages (32x$11.75) $ 376 OJT Observation (12x1x$30) $ 360
Training Costs
Turnover
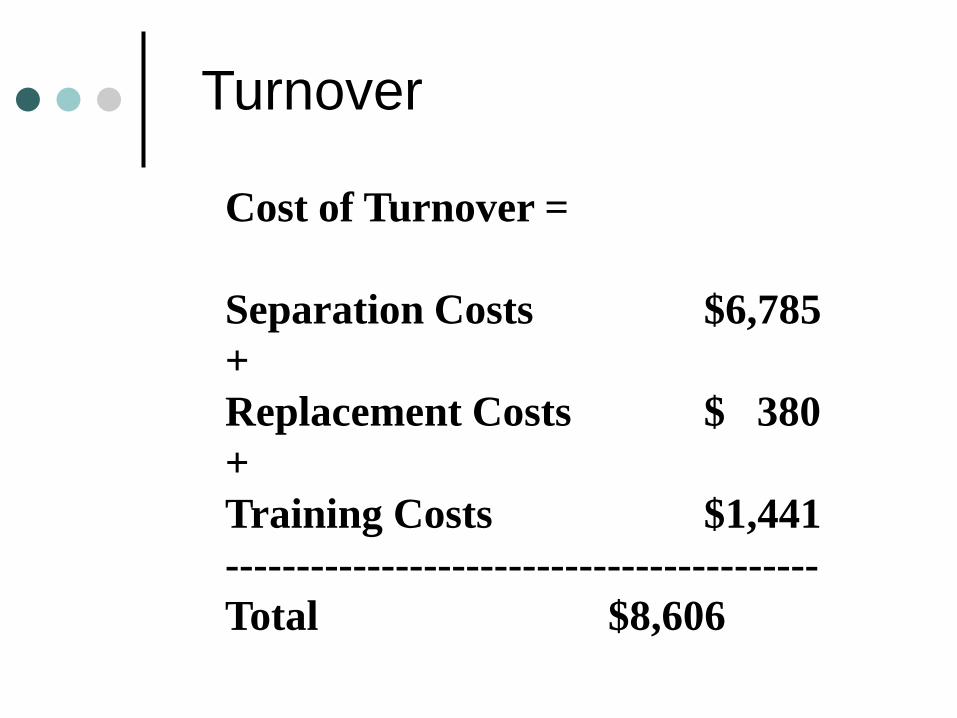
Cost of Turnover =
Separation Costs $6,785+Replacement Costs $ 380+Training Costs $1,441------------------------------------------Total $8,606
Turnover

Cost of Turnover =
Average Work Force 420XTurnover Rate .15XTurnover Costs $8,606------------------------------------------Total $542,178
Turnover

Difference in Performance =
Pay:(RateLeaver – RateReplacement) X Hours
Productivity:(RateLeaver – RateReplacement) X Cost/Unit
Turnover
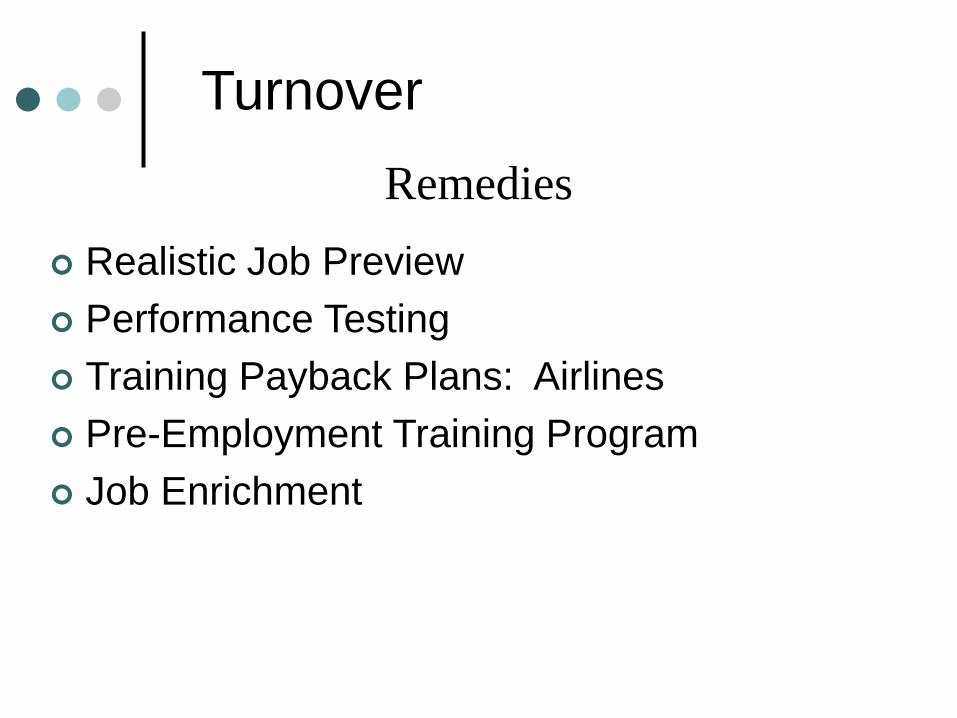
Realistic Job Preview Performance Testing Training Payback Plans: Airlines Pre-Employment Training Program Job Enrichment
Remedies
Turnover

Job Enrichment
Hackman & Oldham – Job Diagnostic Survey Travelers Insurance, data entry workers
High internal work motivation High work performance High work satisfaction Low absenteeism and turnover
Expected Outcomes
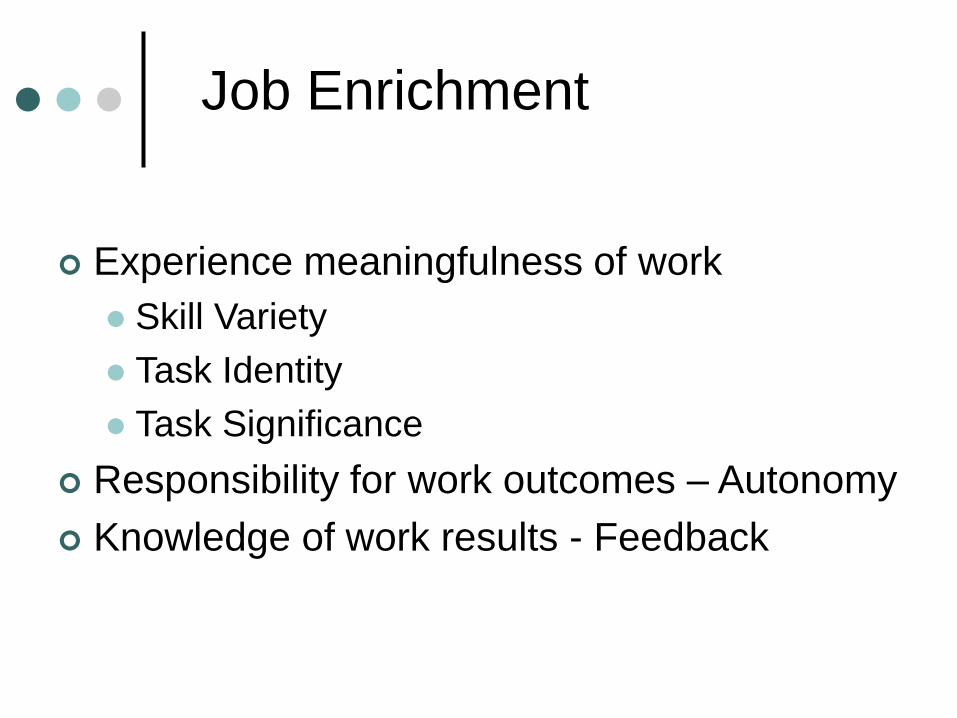
Experience meaningfulness of work Skill Variety Task Identity Task Significance
Responsibility for work outcomes – Autonomy Knowledge of work results - Feedback
Job Enrichment

Combining Tasks Skill Variety
Natural Work Units Task Identity
Client Relationships Task Significance
Vertical Loading Autonomy
Communication Feedback
Job Enrichment
Absenteeism
Absenteeism
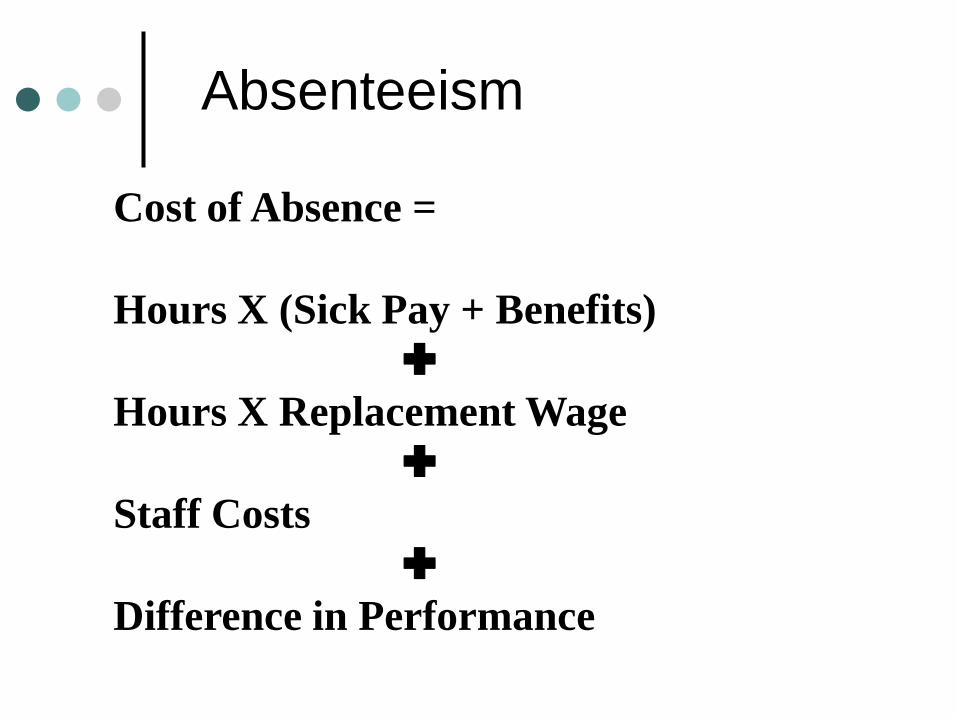
Cost of Absence =
Hours X (Sick Pay + Benefits)
Hours X Replacement Wage
Staff Costs
Difference in Performance

Cost of Absence = @2% $708/employee
40 Hours X ($0 Sick Pay + $7 Benefits)
40 Hours X .5 X $17 Replacement Wage
5 X .2 X $20 Staff Costs
40 X .1 X $17 Difference in Performance
Absenteeism
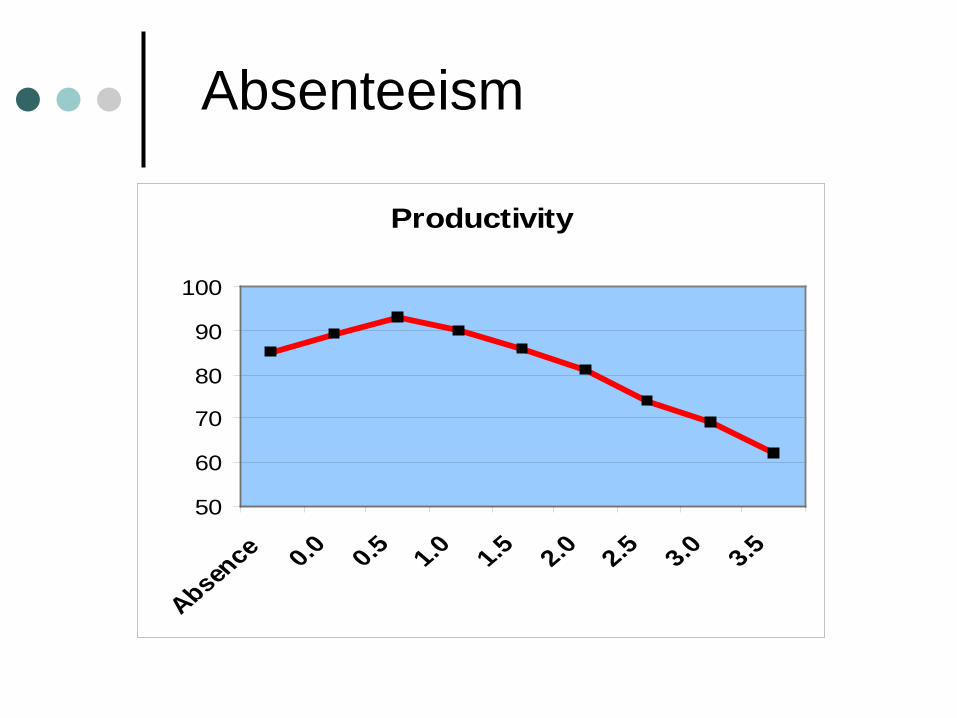
Productivity
50
60
70
80
90
100
Absence 0.0 0.5 1.0 1.5 2.0 2.5 3.0 3.5
Absenteeism
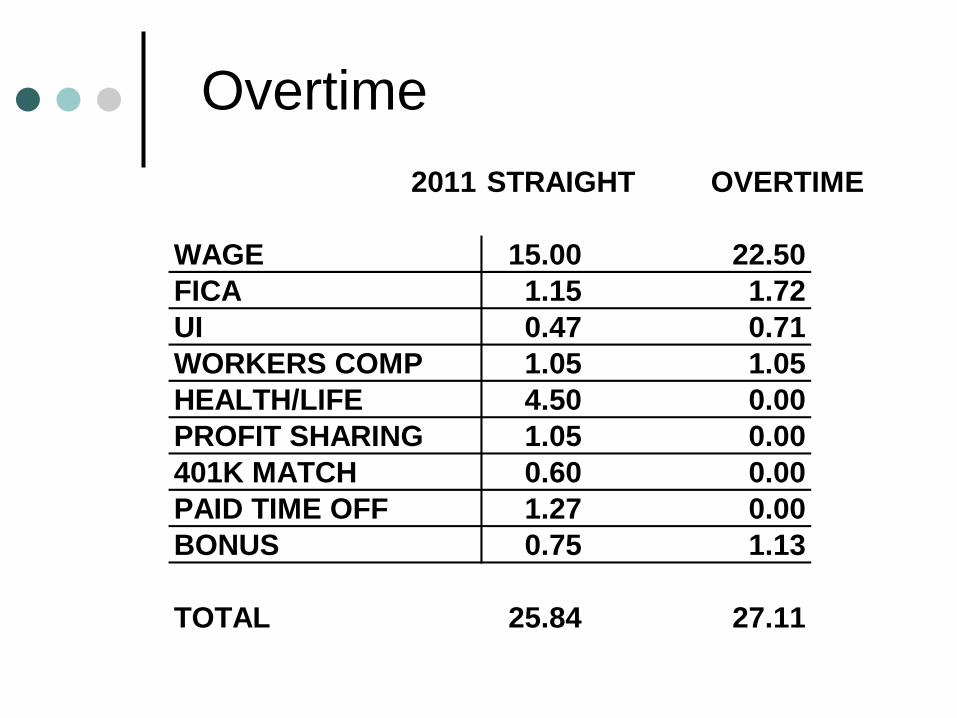
Overtime2011 STRAIGHT OVERTIME
WAGE 15.00 22.50FICA 1.15 1.72UI 0.47 0.71WORKERS COMP 1.05 1.05HEALTH/LIFE 4.50 0.00PROFIT SHARING 1.05 0.00401K MATCH 0.60 0.00PAID TIME OFF 1.27 0.00BONUS 0.75 1.13
TOTAL 25.84 27.11
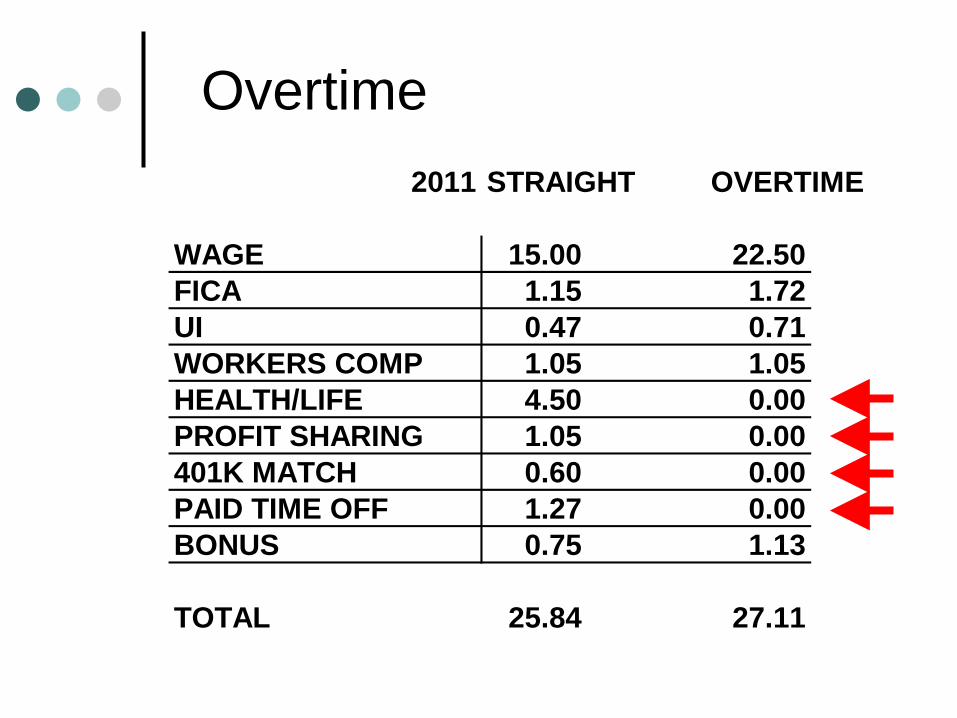
Overtime2011 STRAIGHT OVERTIME
WAGE 15.00 22.50FICA 1.15 1.72UI 0.47 0.71WORKERS COMP 1.05 1.05HEALTH/LIFE 4.50 0.00PROFIT SHARING 1.05 0.00401K MATCH 0.60 0.00PAID TIME OFF 1.27 0.00BONUS 0.75 1.13
TOTAL 25.84 27.11

Productivity

Productivity
Wage (Pounds/Hour) = Cost/CWT Pay for Longevity can be a cost trap.
Standard Deviation $.02/CWT
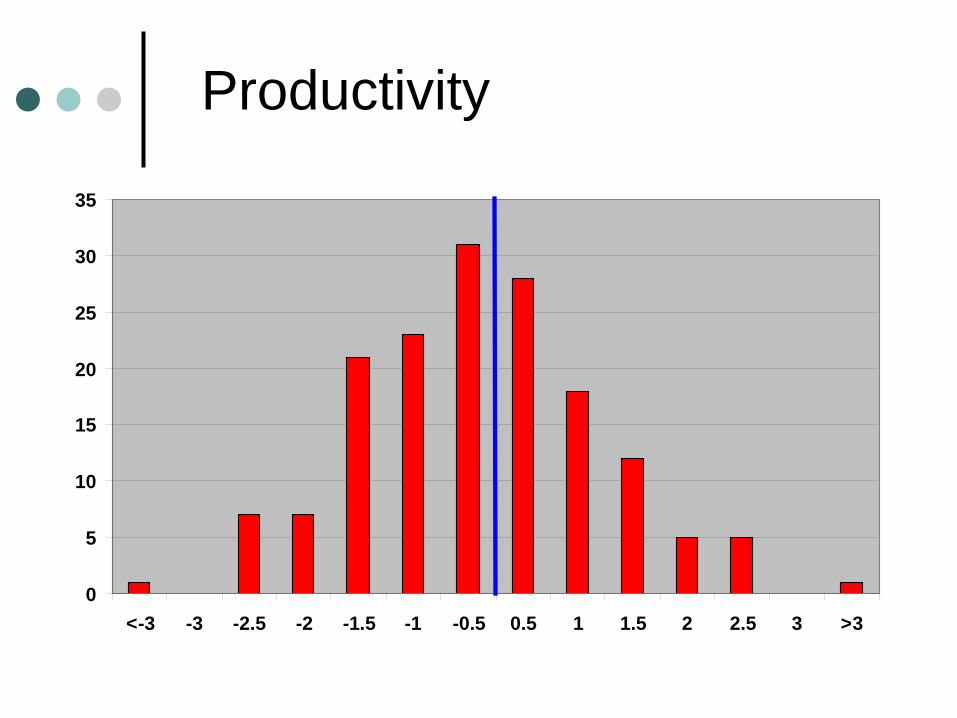
Productivity
0
5
10
15
20
25
30
35
<-3 -3 -2.5 -2 -1.5 -1 -0.5 0.5 1 1.5 2 2.5 3 >3
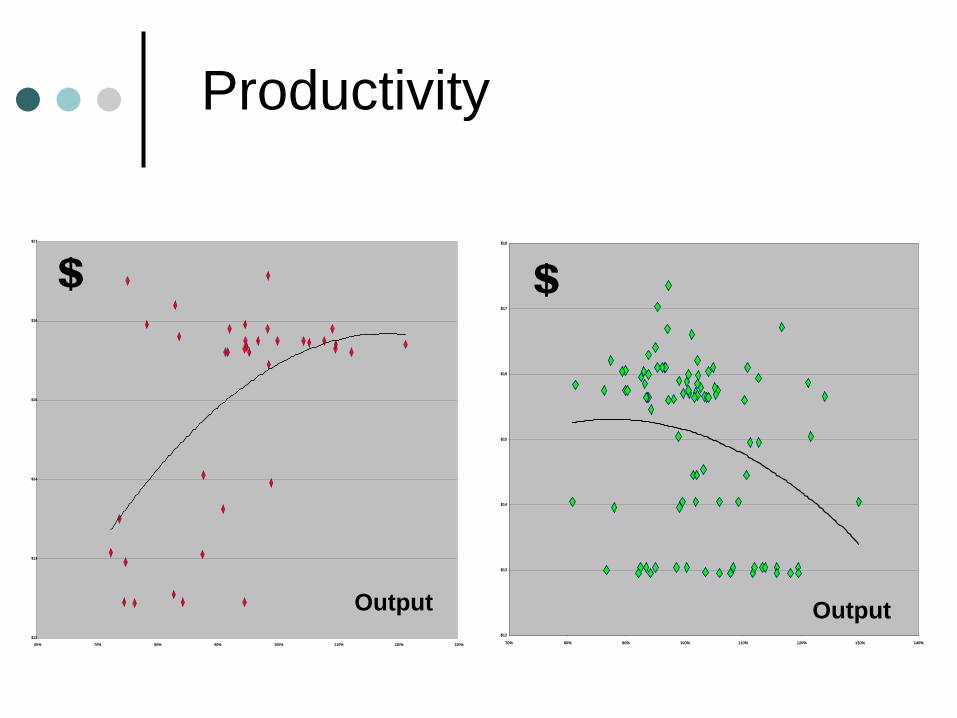
Productivity
$12
$13
$14
$15
$16
$17
60% 70% 80% 90% 100% 110% 120% 130%
Output
$
$12
$13
$14
$15
$16
$17
$18
70% 80% 90% 100% 110% 120% 130% 140%
Output
$
Productivity

Attitudes Attitudes have 3 elements: Cognition – Knowledge of the focal
object Emotion – Feeling toward the focal
object Action Tendency – Readiness to
respond Attitude→Behavior→Outcome Performance = Attitude X KSAO’s

Attitudes
One method of costing uses correlations between attitude survey response and unit cost of production
Weaknesses: Vulnerable to confounding variables Attitude-Behavior relationships may
not be stable over time
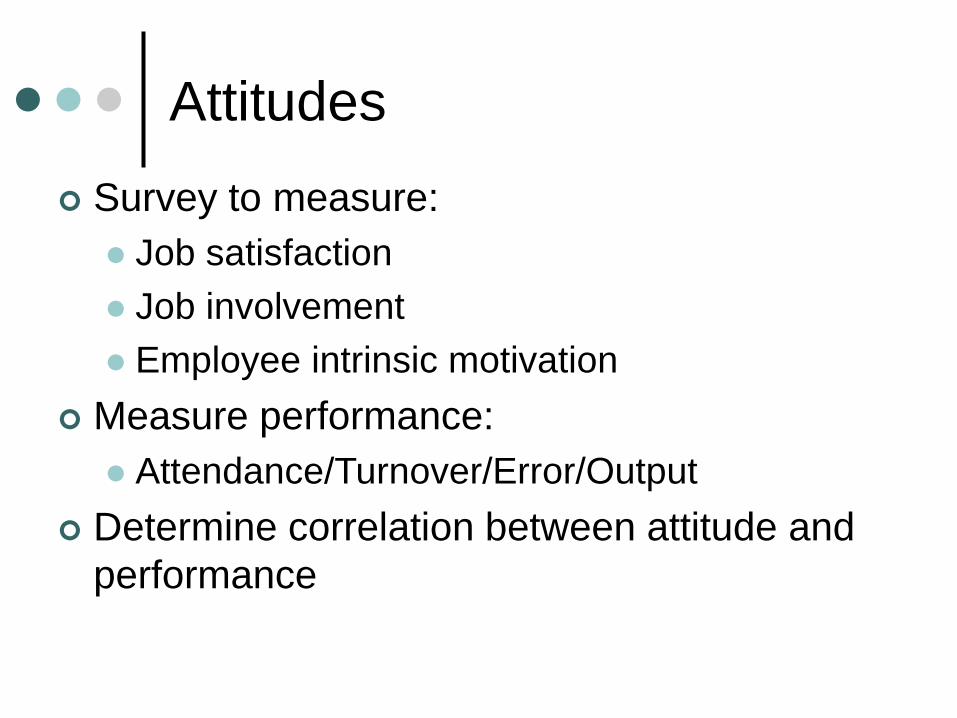
Survey to measure: Job satisfaction Job involvement Employee intrinsic motivation
Measure performance: Attendance/Turnover/Error/Output
Determine correlation between attitude and performance
Attitudes
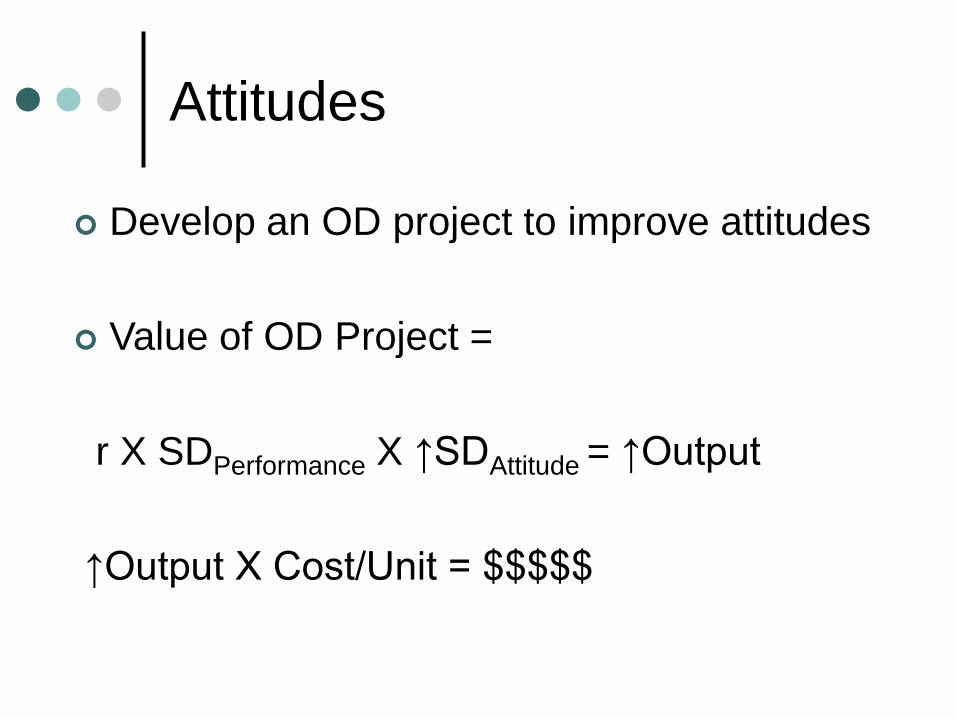
Develop an OD project to improve attitudes
Value of OD Project =
r X SDPerformance X ↑SDAttitude = ↑Output
↑Output X Cost/Unit = $$$$$
Attitudes

Attitudes
Example:Motivation – Mean 70, SD 10Performance – Mean 8,000, SD 700Correlation – r = .20
.20 X 700 X .5 = 70 Pounds / Hour70 X 1,800 X $.0021 = $265

Attitudes
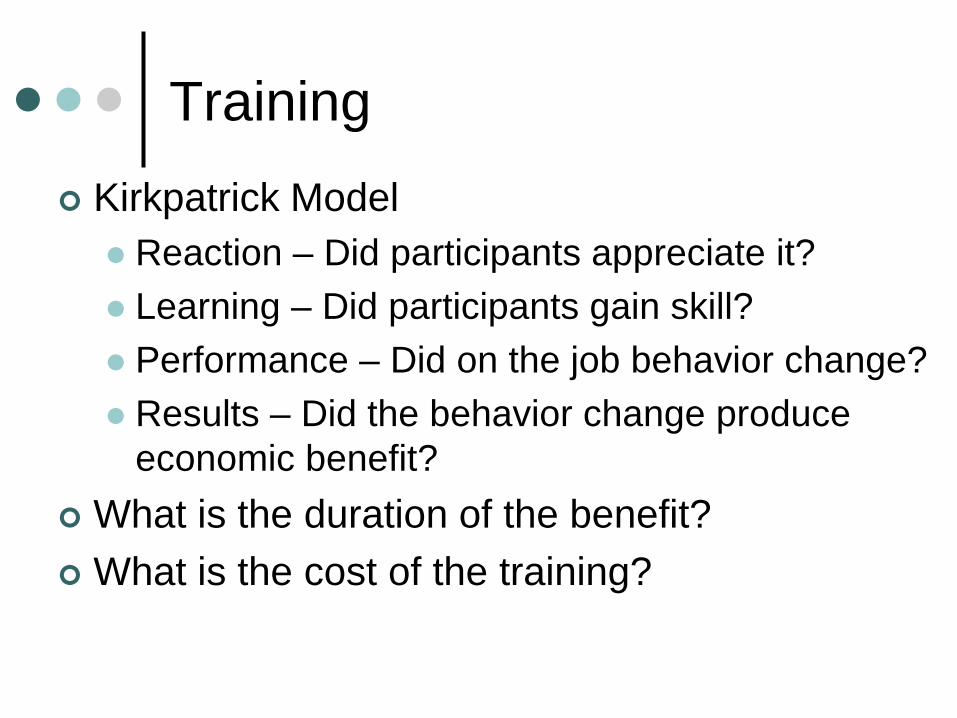
Training Kirkpatrick Model Reaction – Did participants appreciate it? Learning – Did participants gain skill? Performance – Did on the job behavior change? Results – Did the behavior change produce
economic benefit? What is the duration of the benefit? What is the cost of the training?

Further Study
Performance Management Dr. Aubrey C. Daniels
Analyzing Performance Problems Dr. Robert F. Mager
accountingforpeople.org Human Potential Accounting Dr. Michael Reddy
Questions?


