
David Granatstein WSU CSANR
Wenatchee, WA
In collaboration with Joan Davenport, Elizabeth Kirby, Michel Wiman, Amos
Kukes, Kent Mullinix
Cover Crops for Orchards

Neilsen and Neilsen, 2003
Apple Root Density

Standard System
Herbicide strip, grass alley
Mini Tatura Trellis on M.9 Washington

Orchard Cover Crops Cover crops affect:
• Weeds
• Soil and orchard temperature
• Soil moisture, physical properties
• Soil C, N, other nutrients (root exudates)
• Soil biology, food web
• Tree performance
• Pests (insect, disease, rodents)
• N fixation (legumes)

Cover Crop Choices Age of orchard, rootstock
Fruit harvest date
Irrigation system, water
Alley, tree row, ‘Sandwich’
Legume, grass, broadleaf
Species, cultivar
Annual or perennial
Nematode host?
Insect pest host?
Mulch?

Orchard Floor Management Review Microclimate: • soil temperature inverse to the amount of herbage or mulch • plant mulch dampens extremes of daily soil temperature • plant cover reduces minimum air temperature by 0.5-1.0oC • bare, compacted wet soil raised minimum air temperature by as much as 2oC • effects on humidity and disease? Russet? (Skroch & Shribbs, 1986)

Orchard Floor Management Review
Soil quality: • avoid cultivation • favorable soil effects: legumes > grass > mulch > bare ground > cultivation Water: • soil moisture availability: mulch > bare soil > minimal cultivation > grass > legumes > continuous cultivation • mowing decreases water use (Skroch & Shribbs, 1986))
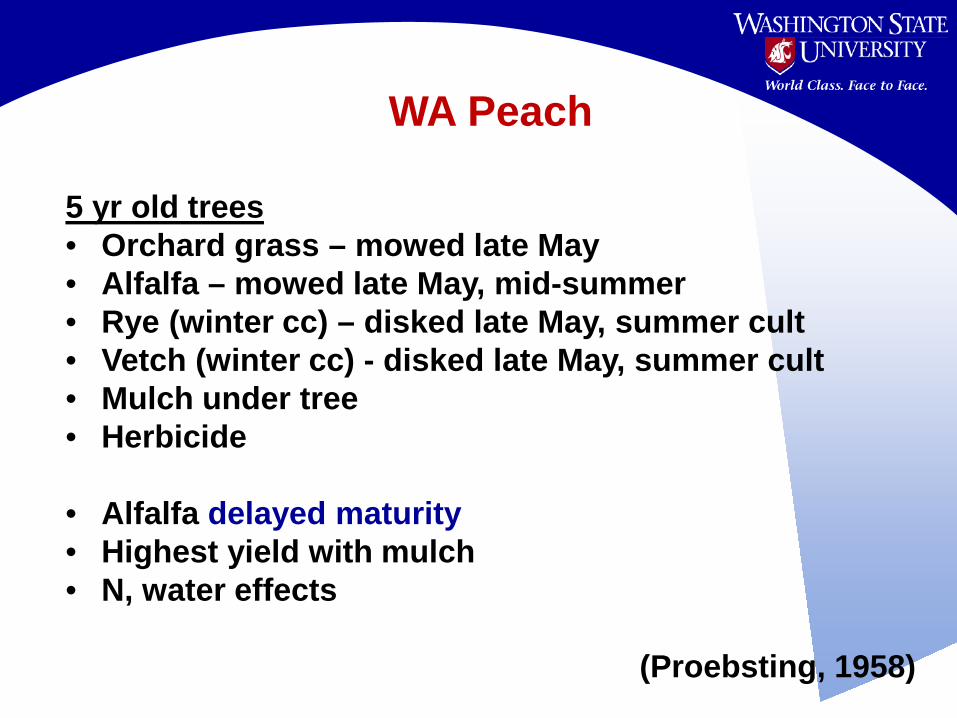
WA Peach 5 yr old trees • Orchard grass – mowed late May • Alfalfa – mowed late May, mid-summer • Rye (winter cc) – disked late May, summer cult • Vetch (winter cc) - disked late May, summer cult • Mulch under tree • Herbicide • Alfalfa delayed maturity • Highest yield with mulch • N, water effects
(Proebsting, 1958)
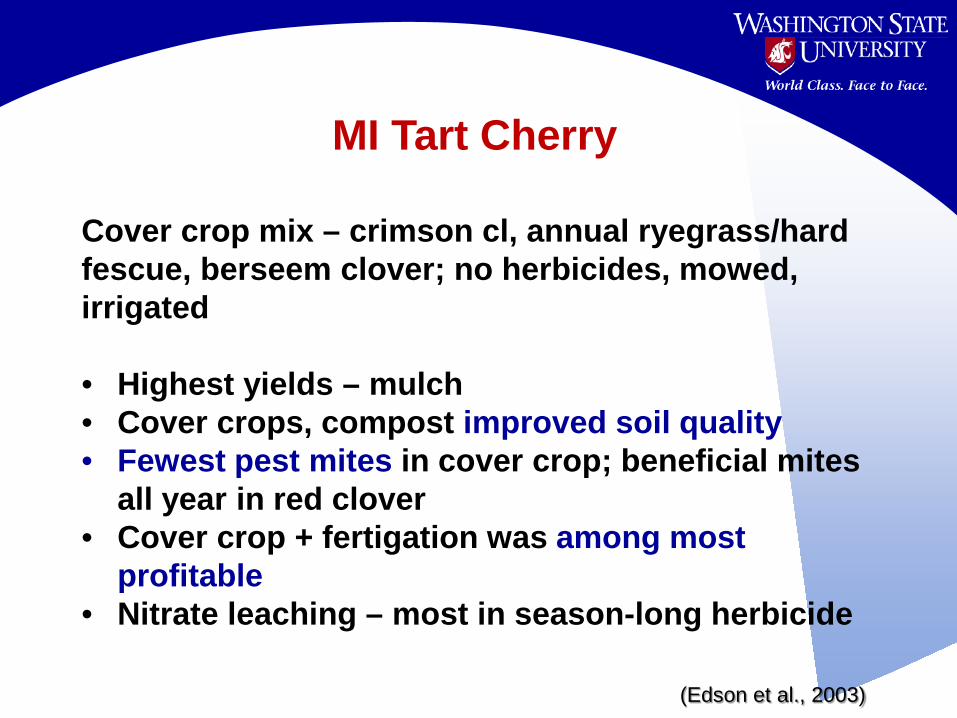
MI Tart Cherry
Cover crop mix – crimson cl, annual ryegrass/hard fescue, berseem clover; no herbicides, mowed, irrigated • Highest yields – mulch • Cover crops, compost improved soil quality • Fewest pest mites in cover crop; beneficial mites
all year in red clover • Cover crop + fertigation was among most
profitable • Nitrate leaching – most in season-long herbicide
(Edson et al., 2003)

MI Tart Cherry
(Edson et al., 2003)

NZ Apple • 8 yr old apple trees • Several species mixes • Fixed N can replace harvest and leaching
removal (15N method)
Annual N fixed by understory kg N/ha Red clover 33-84 Herb ley 12-105
(Goh et al., 1995)
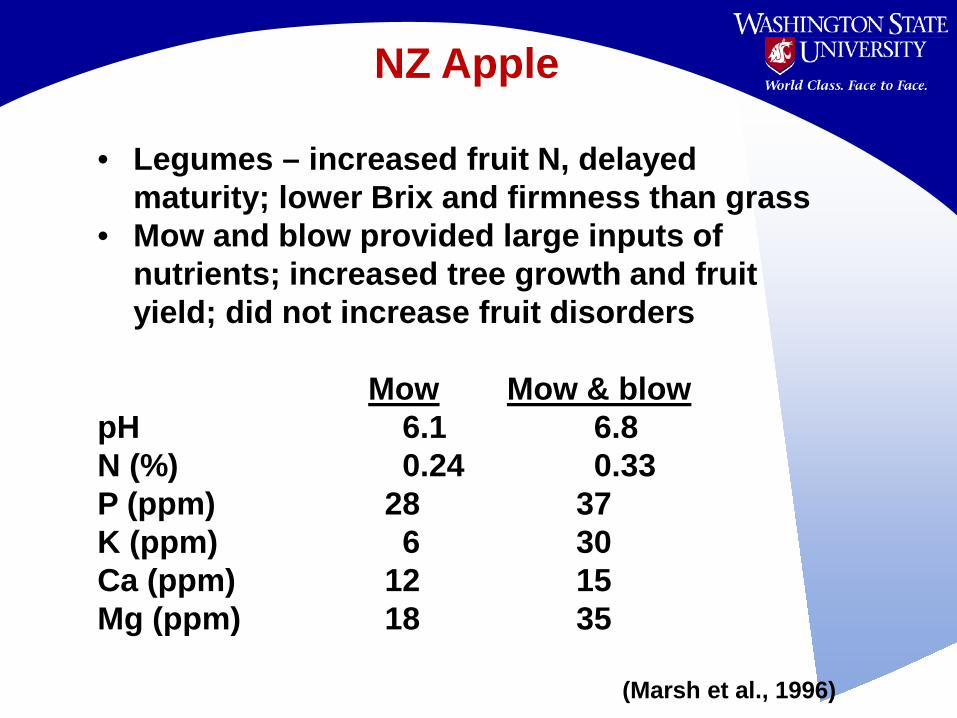
NZ Apple • Legumes – increased fruit N, delayed
maturity; lower Brix and firmness than grass • Mow and blow provided large inputs of
nutrients; increased tree growth and fruit yield; did not increase fruit disorders
Mow Mow & blow pH 6.1 6.8 N (%) 0.24 0.33 P (ppm) 28 37 K (ppm) 6 30 Ca (ppm) 12 15 Mg (ppm) 18 35
(Marsh et al., 1996)

Legume Cover Crops Rio Negro, Argentina
5 yr old apple; 3.2 m drive alleys, mowed twice a year Leaf N TCSA Fruit Yield (%) (cm2) (tons/ha)
Strawberry Clover 1.98 a 113 a 54 a
Alfalfa/fescue 1.85 b 108 a 58 a
Vetch 2.00 a 105 a 57 a
Control 1.86 b 94 b 45 b
2 tons/ha 5-5-5 fertilizer
(Sanchez et al., 2007)
Fall-planted Dwarf white clover
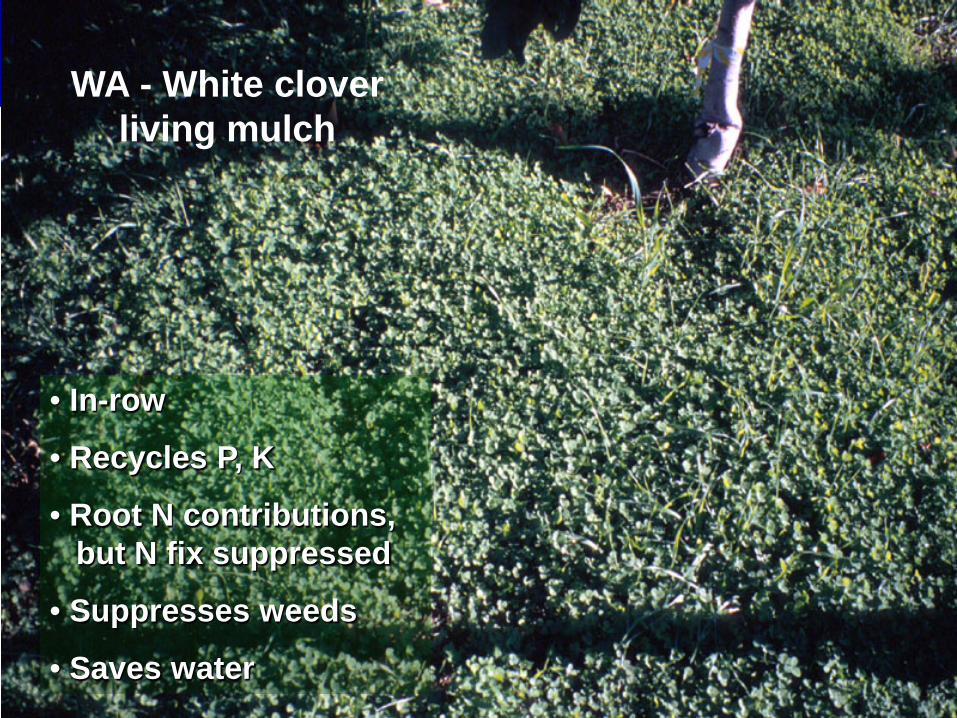
WA - White clover living mulch
• In-row
• Recycles P, K
• Root N contributions, but N fix suppressed
• Suppresses weeds
• Saves water

Soil Nitrate
020406080
100
A B C D E F
kg N
/ha 7/24/2001
7/32/2001
8/7/2001
Grow Your Own N
A – control plot; tube + cover; no clover D – clover plot; tube – cover, clover clippings added B – control plot; tube + cover; clover clippings added. E – control plot; no tube C – clover plot; tube + cover, clover clippings added F – clover plot, no tube
Nitrogen release over 3 weeks from ambient soil with and without clover, root exclusion tubes, and tube covers.
7/31/2001 46% of clover N mineralized
Tree growth, fruit yield enhanced

Late summer 2000 Early spring 2002
Rodents – the weak link for clover.

Vole Trail Length WA IMM Trial, Winter 05/06 (Winter 06/07, too few to analyze)
0
50
100
150
200
250
300
350
LML
LMNL
SWL
SWNL
WC
CTLW
W
trail
leng
th (c
m/m
2 )
11/05 trails 2/06 trails
Galium (sweet woodruff)
Other living mulches

Sweet Woodruff (Galium odoratum)
Thyme
Wenatchee area

Mow and Blow Alley Cover Crop

2008 Trial – Qunicy, WA • Legumes direct seeded in drive
alley (4’ swath) – May 19 Alfalfa cv. Radiant Jumbo Ladino white clover Kura clover Birdsfoot trefoil cv. Norcen
• SPRAY or NO SPRAY prior to seeding
• Mow and blow before apple harvest
No-till drill
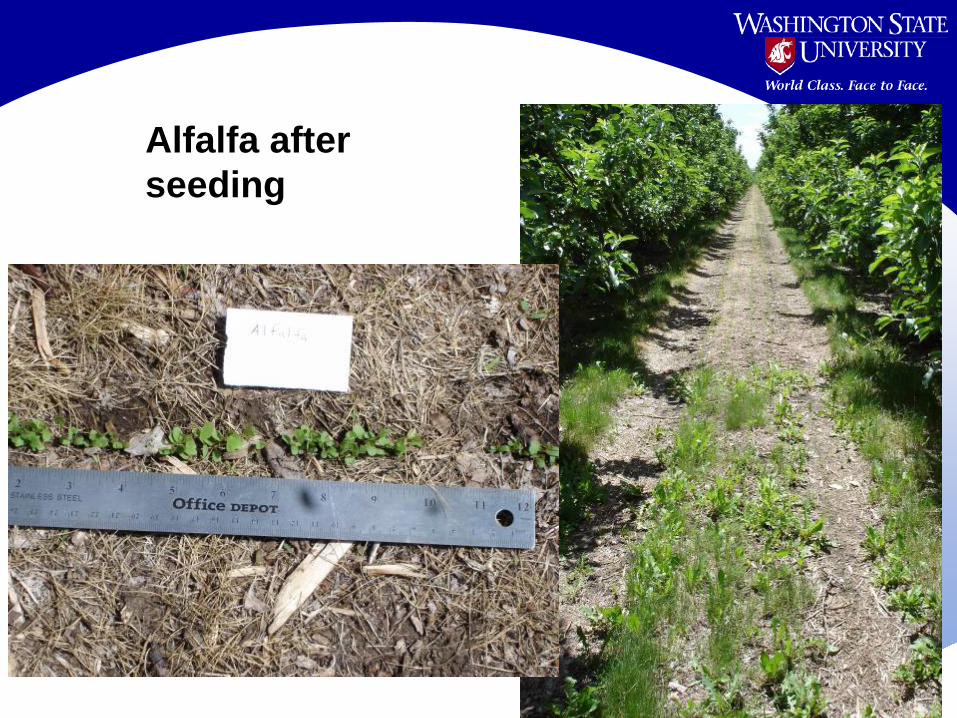
Alfalfa after seeding

Single pass
Double pass
Drill - 8” spacing; narrower would be better

Alfalfa tractor Alfalfa no tractor
Before mowing

Spray
No spray
Ladino clover
Year 1

Ladino Clover – May, Yr 2

Alfalfa – May, Yr 2

Legume residue in tree row after mow and blow
Mow and Blow

0
200
400
600
800
1000
1200
Alfalfa Trefoil Ladino Kura Grass
Bio
mas
s (D
M k
g/ha
)
27-May 1-Jul 10-Aug 1-Oct
Legume Biomass (Yr 2, 2009, 4 cuttings)
% N of DM 4.1% 3.4% 3.9% 3.1% 2.3%

Sum of 8/08, 7/09, 8/09 cuttings
Legume only, 7/09
Sprayed Unsprayed Sprayed Unsprayed
- - - - - - - - - Dry matter (kg/ha) - - - - - - - -
Alfalfa 759 a 685 a 157 a 105 b Ladino 701 a 719 a 191 a 131 b Trefoil 783 a 716 a 141 a 74 b Kura 476 a 486 a 56 a 18 a
Effect of Pre-seeding Treatment on Biomass

Alfalfa Trefoil
Year 3, 2010
39 days after mowing

Morgan Orchard, Cover Crop Biomass 2010- Spray
0
200
400
600
800
1000
1200
1400
1600
1800
2000
Alfalfa Trefoil Ladino Kura Grass
Bio
mas
s (D
M k
g/ha
)
6-May 14-Jun 12-Jul 24-Aug 24-Sep
Cover Crop Biomass, Yr 3

Cover Crop Biomass, 2008-10
0
500
1000
1500
2000
2500
3000
Alfalfa Grass Kura Ladino Trefoil Alfalfa Grass Kura Ladino Trefoil
Spray No spray
Bio
mas
s D
M (k
g/ha
)
2008 2009 2010
Morgan Orchard
Cumulative Cover Crop Biomass

Morgan Orchard 2008-10, Kura clover
0
10
20
30
40
50
60
70
80
90
100C
over
(%)
Spray
No Spray
June - Oct2008
May - Oct2009
April - Aug2010
Morgan Orchard 2008-10, Alfalfa
0
10
20
30
40
50
60
70
80
90
100
Gro
und
Cov
er (%
)
Spray
No Spray
June - Oct2008
May - Oct2009
April - Aug2010
Morgan Orcahrd 2008-10, Birdsfoot trefoil
0
10
20
30
40
50
60
70
80
90
100
Cov
er (%
)
Spray
No Spray
June - Oct2008
May - Oct2009
April - Aug2010
Morgan Orchard 2008-10, Ladino clover
0
10
20
30
40
50
60
70
80
90
100
Cov
er (%
)
Spray
No Spray
June - Oct2008
May - Oct2009
April - Aug2010
% Cover of Legumes in Drive Alley
Kura clover
Ladino clover Trefoil
Alfalfa

Grower Application • Grafted ‘Fuji’ Young apple block • Seeded mid May of 2010 • Direct seed drill directly into existing vegetation of grasses and weeds (flailed before seeding) -- double pass, high seeding rate • Excellent establishment; ~7’ swath
Alfalfa White clover
Photos June 16, 2010
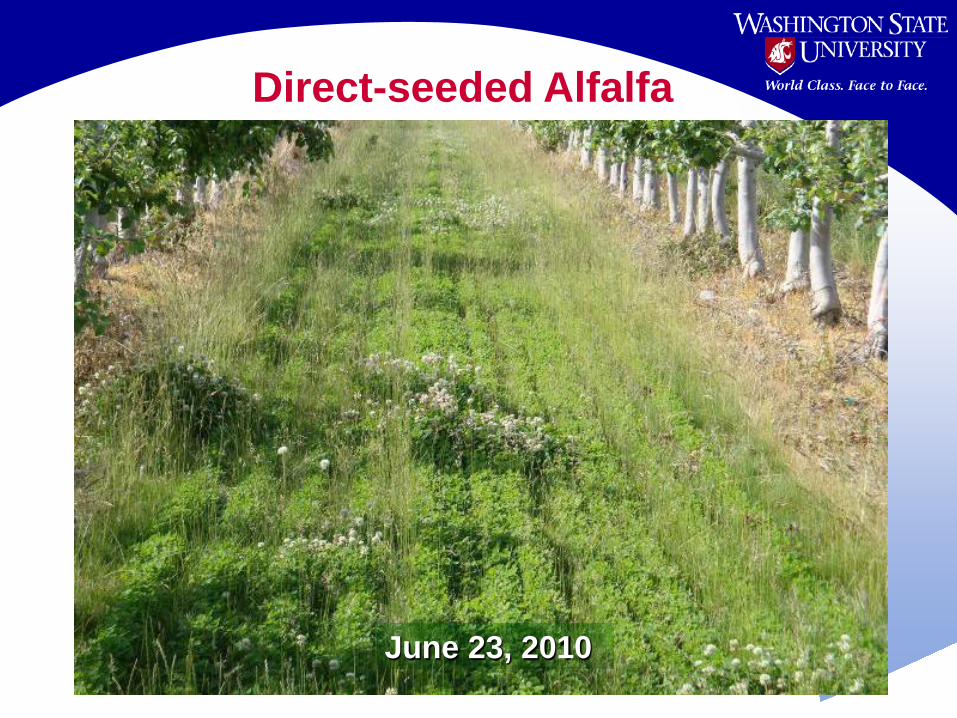
Direct-seeded Alfalfa
June 23, 2010
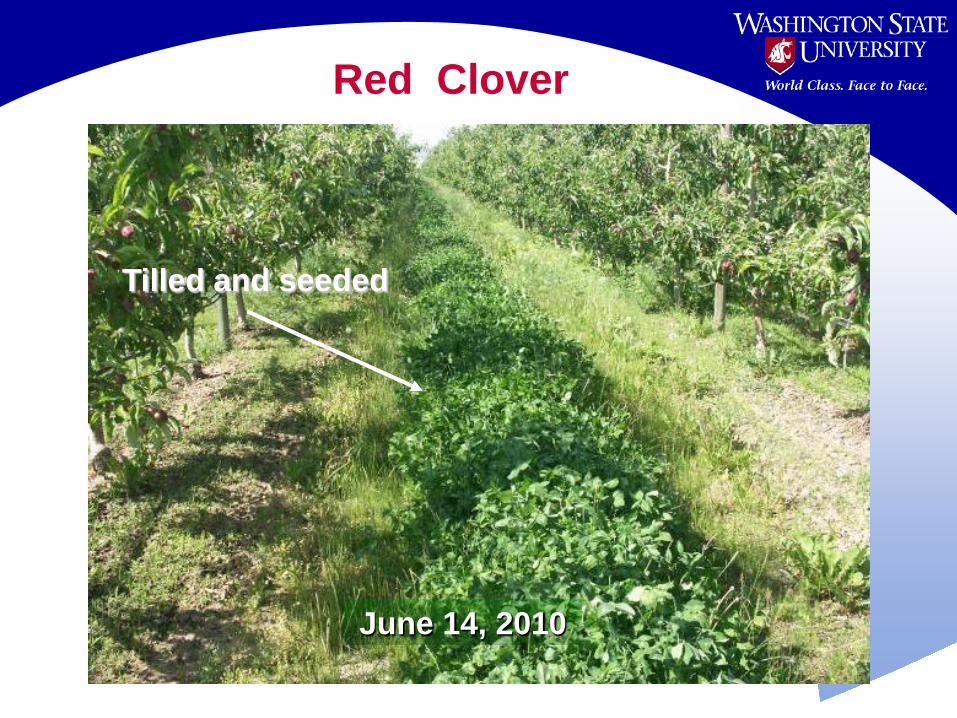
Red Clover
June 14, 2010
Tilled and seeded

Biomass N 2009
Soil PRS 2009
Ave. Dry Matter*
2009 Tissue N
Ave. N Added
(lb N/ac) (ppm NO3-N)
(ton/ac/yr) (%) (lb N/ac/yr)
Alfalfa 38 251 3.56 4.11 46.9
Trefoil 26 179 3.60 3.40 39.2
Ladino 25 173 2.62 3.92 32.8
Kura 14 132 2.72 3.07 26.7
Grass 15 103 3.28 2.30 24.2
*Ave. 2009 and 2010. Yield on a full acre basis; actual strips are 0.16 of area (2.2’ strip)
N Contribution

Economics Costs per acre of orchard, 4’ swath
Herbicide 7.15 Tractor/sprayer 14.85 Tractor/seeder 29.70 Seed 32.00 Total 83.90
Planting good for at least 5 yr - $21/yr cost
Alfalfa – 3.5 ton/ac/yr @ 4% N = 280 lb N Width N content Fert. Valuea 5’ 101 $71 4’ 81 $57 3’ 59 $41
Over 4 yr, $84 cost / 130 lb Nb = $0.65/lb aEstimate N fertilizer at $0.70/lb
b40% avail., accounting for Nmin (50-70%), losses [ 4’ swath, 81 lb N/yr x 4 yr x 0.4 avail = 130 ]

Sampling Percent cover Point intersect – stiff wire with 20 pts; place at 45o to seeding rows; at least 3 representative spots per plot Biomass Quadrat frame – 3-4 representative samples per plot; cut at mower height; dry, weigh; convert to lb/ac DM; can weigh wet sample first for moisture content estimate and future wet basis sampling

See OSU cover crop sampling instructions

Sampling Nitrogen Ideal – C,N analyzer, by combustion
% N C:N
Alfalfa 4.06 10.6
Ladino 3.77 11.2
Trefoil 3.36 13.0
Kura 2.83 14.9
Grass 2.15 18.8
Non-legume 2.32 17.7
Mow and Blow trial, Year 1 Tissue N

Sampling Nitrogen Ideal – C,N analyzer, by combustion Total N analysis – reported as %N; e.g. alfalfa 4.11% N content = 0.0411 x 7120 lb/ac DM = 293 lb N/ac Need to adjust for area – 4’ strip, 14’ row spacing; 4/14 = 0.2857 x 293 = 83.6 lb N/ac of orchard Need to adjust for N mineralization Get C:N from tissue test e.g. alfalfa 10.6 83.6 lb x 0.40 = 33 lb avail N/ac orchard

http://smallfarms.oregonstate.edu/calculator
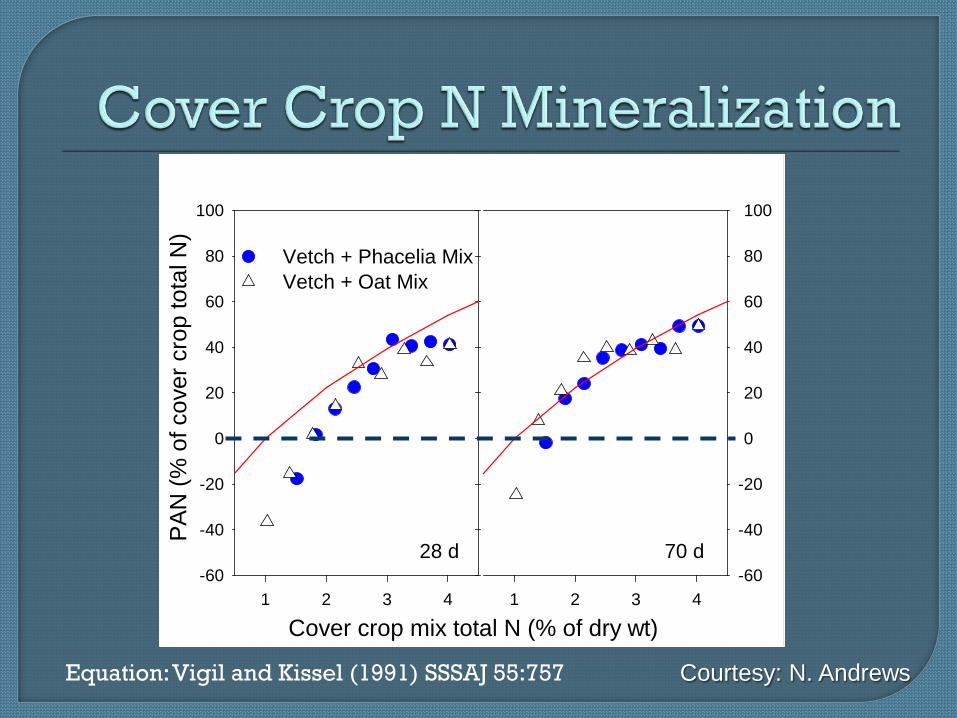
Cover crop mix total N (% of dry wt)1 2 3 4
PAN
(% o
f cov
er c
rop
tota
l N)
-60
-40
-20
0
20
40
60
80
100
Vetch + Phacelia Mix Vetch + Oat Mix
28 d
1 2 3 4-60
-40
-20
0
20
40
60
80
100
70 d
Equation: Vigil and Kissel (1991) SSSAJ 55:757 Courtesy: N. Andrews

Could perennial cover crop roots contribute more available nitrogen?
Residues on surface, not incorporated. After 40 days surface applied legumes
provided about 20% of the nitrogen provided by incorporated legumes.
Orchard floor PAN release is probably lower than calculator estimates.
Less control over timing of PAN release, e.g. decomposition slower on dry surface.
Courtesy: N. Andrews

Material C/N Hairy vetch tops 10 Hairy vetch roots 25-30 Break even point for short term N-mineralization
~20
Adapted from Kuo et al (1997). Soil Science Society of America Journal, 61: 1392-1399.
Courtesy: N. Andrews

• Legume C/N ~10-15 • Cereal C/N ~ 20-40 • Mixtures~ 15-25 • Suggests that orchard floor residues may lose 0-5% of the total %N as NH3
Dutch lab research, 37 day duration. Ruijter et al (2010). Atmospheric Environment 44, 3362-3368. Courtesy: N. Andrews
Perennial Cover Crops – mowed, left on surface

What we learned so far … Need multiple years to assess species;
many novel species to test
Shade, traffic affecting growth
Spraying out grass helped, but all legumes had reasonable stands; compensate with double pass, higher seed rate
Need greater growing surface to boost N contribution; net ~3’ with tires
Combinations ? Alfalfa + ladino + kura?
Thanks to USDA Organic Research Special Grant for funding.

Resources UC Davis SAREP http://www.sarep.ucdavis.edu/ccrop/ - Cover Cropping in Vineyards Midwest Cover Crops Council http://www.mccc.msu.edu/ USDA SARE Program http://www.sare.org/ - Managing Cover Crops Profitably WSU - EB 2010 – Cover Crops for PNW Vineyards - Orchard floor management http://www.tfrec.wsu.edu/pages/organic/Orchard_Floor


