Dynamics of Supply Chain
Failure.
Karsten Cox BA (Hons) MBA.
Thesis submitted to the University of Nottingham for the
Degree of Doctor of Philosophy.
September 2017.
Abstract. In today’s highly competitive global manufacturing industries, the reality facing most
prime or focal manufacturing organisations around the world is one where resources
have been reduced, inventory has been drained, technology spending curtailed, and
processes that are not core to an organisation’s business have been scaled back and / or
outsourced. In competitive global marketplaces prime manufacturers simply cannot
afford to have any area of their operations compromised. Supply chain operations need
to be robust and resilient in order to retain and increase market share. Supply chain
failure is a phenomenon that can potentially cause major issues for many organisations,
especially when failure becomes persistent.
Supply chains may under-perform or fail in different ways. Here we are
concerned with a particular kind of supply chain failure, persistent failure over time,
which occurs when a supplier fails persistently to provide the level of quality and
delivery performance originally expected or specified in an agreed contract. The
phenomenon is observed in industries where there is a lack of substitute suppliers with
adequate design and production capability and / or capacity, potentially high switching
costs, and regulatory and accreditation issues. The goal of this research is to provide
managers at prime manufacturing organisations with an effective way to understand
their supply environment and provide insights to help identify and resolve supply
problems that might otherwise become persistent failures.
In this research project, we seek to understand and rationalize what persistent
supply chain failure is, identify why it happens and what influences it. This is achieved
by conducting new primary empirical research to examine the ‘mechanisms’ and
‘dynamics’ of persistent failure and how organisations react to persistent adversity in
supply chains. Multiple case studies have been conducted in the Aerospace Industry to
understand and explain the nature of the phenomenon of persistent failure. An analysis
of the extensive empirical evidence collected has enabled a new model of persistent
supply chain failure be developed using causal loop diagrams. The ‘Persistent Failure’
model helps to understand the causes of the phenomenon and helps to identify
mitigating strategies that can limit its emergence in supply chain relationships. The
empirical study, the qualitative and quantitative analyses, and the causal loop model of
persistent failure provide a significant contribution to the body of knowledge in
purchasing, supply chain and operations management.

ii | P a g e
Acknowledgements. I would like to take this opportunity to express my extreme gratitude to Prof. Bart
MacCarthy and Dr Katri Kauppi whose unwavering guidance, supervision and general
belief in this difficult research topic was a strong driving force behind the eventual
completion of this research study. Their commitment and encouragement (and
persistence!) provided me with the emphasis and momentum to reach the finish line.
Without their motivational support, this may not have happened due to work
commitments that involved numerous international assignments both inside and outside
of Europe during the course of this research project.
I would also like to offer my sincere thanks and gratitude to both Ian Brierley
and Andy Braithwaite in equal measure. Without their support throughout the duration
of this project the participation and contributions given by the research volunteers from
both the prime and first tier suppliers would not have been as fruitful due to the emotive
topic of study. Without their help and assistance, the opportunity to conduct a workshop
at the prime’s main facility in order to validate the model would simply not have
happened.
In addition I would like to thank all of the supply chain professionals who took
part in the exploratory phase of the research and also the validation workshop. Without
their rich, valuable and honest insights on supply chain / operations management topics
that affect them on daily basis, this research would not have generated the results that
it did. Further to this I would like to thank all of my previous employers who I worked
for throughout the course of this project. Without their support and understanding this
study would have been very difficult to complete.
Last, but absolutely not least, I would like to thank my close family and friends
who have provided nothing but positive support and motivation throughout the entire
PhD experience. I would also like to thank them for their patience when things were
tough and not going as well as hoped.
iii | P a g e
Contents Page. Abstract. ............................................................................................................. i
Acknowledgements. ......................................................................................... ii
Contents Page. ................................................................................................. iii
List of Figures. ............................................................................................... viii
List of Tables. ................................................................................................... x
List of Abbreviations. .................................................................................... xii
Chapter 1 – Introduction. ................................................................................ 1
1.0 Background and motivation. .............................................................................. 1
1.1 Research background. .......................................................................................... 5
1.2 Research aims, objectives and expected contributions. ....................................... 7
1.3 Overview of research methodology and design. .................................................. 8
1.3.1 Research phase one: Exploratory study and data collection. .................................. 9
1.3.2 Research phase two: Analysis. ............................................................................... 10
1.3.3 Research phase three: Validation. ........................................................................ 10
1.5 Structure of the Thesis. ...................................................................................... 11
Chapter 2: Literature Review. ...................................................................... 13
2.1 Literature Domains. ........................................................................................... 13
2.2 Supply Chain Management. ............................................................................... 14
2.3 Risk Management in the Supply Chain.............................................................. 15
2.3 Supply Chain Quality Management. .................................................................. 19
2.4 Power, Leverage and Dependency in the Supply Chain. ................................... 22
2.5 Supplier Development. ...................................................................................... 25
2.6 Performance Management in the Supply Chain. ............................................... 28
2.7 Relationship Management in the Supply Chain. ................................................ 31
2.8 Project and Program Management. .................................................................... 35
2.9 System Dynamics. .............................................................................................. 37
2.10 Service Recovery. ............................................................................................ 39
2.11 Characteristics of supply in the Gas Turbine / Aerospace Industry. ................ 40
2.12 Gaps in the Literature and Justification of Research Questions. ..................... 41
Chapter 3: Research Methodology and Research Design. ......................... 47
3.1 Philosophical Approach. .................................................................................... 47
3.2 Research Design. ................................................................................................ 49
iv | P a g e
3.2.1 Unit of Analysis. ..................................................................................................... 50
3.2.2 Research Design Process. ...................................................................................... 50
3.2.3 Rationale for Adopted Research Design. ............................................................... 51
3.2.4 Justification for Conducting Case Studies as a Method of Research. .................... 52
3.2.5 Challenges in Conducting Case Studies. ................................................................ 53
3.3 Introduction to the Exploratory Case Studies (Research Phase One). ............... 54
3.3.1 Phase One Stage One – First Tier Supplier Data Collection Protocol. ................. 54
3.3.1.1 First tier Supplier Selection. .............................................................................. 54
3.3.1.2 The Pilot Study – Supplier A.............................................................................. 55
3.3.1.3 Case Study Supplier B. ...................................................................................... 57
3.3.1.4 Case Study Supplier C. ...................................................................................... 57
3.3.1.5 Case Study Supplier D. ...................................................................................... 58
3.3.1.6 Case Study Supplier E. ...................................................................................... 59
3.3.1.7 First Tier Supplier Participant Roles and Responsibilities. ................................ 60
3.3.2 Phase One Stage Two – Prime Manufacturer Data Collection Protocol. ............. 62
3.3.2.1 Prime Manufacturer Participant Roles and Responsibilities. ........................... 65
3.3.3 Phase One Semi-Structured Interview Protocol. .................................................... 67
3.3.3.1 Risk and Contingency Management. ............................................................... 68
3.3.3.2 Quality Management. ...................................................................................... 69
3.3.3.3 Power and Relationship Management............................................................. 70
3.3.3.4. Supplier Development. .................................................................................... 71
3.3.3.5 Performance Management. ............................................................................. 71
3.3.3.6 Service Recovery. .............................................................................................. 71
3.3.4 Differences between Interview Topics. ................................................................... 72
3.4 Research Phase Two – Analysis. ....................................................................... 72
3.4.1 Brief Outline of the Qualitative Analysis Process. ................................................. 72
3.4.2 Stage One Qualitative Analysis. ............................................................................. 73
3.4.3 Stage Two – Causal Analysis. ................................................................................ 74
3.4.3.1 The Use of Systems Dynamics – Causal Loop Diagrams. ................................. 75
3.5 Introduction to Research Phase Three – Validation. ......................................... 77
3.5.1 Pilot Testing the Persistent Failure Model. ........................................................... 78
3.5.2 Semi-Structured Interview Data - First Tier Suppliers and Prime Participants. ... 79
3.5.3 Prime Workshop – Model Validation and Workshop Strategy............................... 80
3.6 Chapter Summary. ............................................................................................. 81

v | P a g e
Chapter 4: Exploratory Study, Phase One – Empirical Evidence and
Analysis. .......................................................................................................... 83
4.1 Research Phase One – Exploratory Phase observations. ................................... 83
4.1.1 Risk and Contingency Management – First Tier Suppliers Perspective. ............... 84
4.1.2 Risk and Contingency Management – The Prime Perspective. .............................. 87
4.1.3 Quality Management – First Tier Suppliers Perspective. ...................................... 90
4.1.4 Quality Management – The Prime’s Perspective. .................................................. 93
4.1.5 Power and Relationship Management – First Tier Suppliers Perspective. ........... 96
4.1.6 Power and Relationship Management – The Prime Perspective. .......................... 98
4.1.7 Supplier Development – First Tier Suppliers Perspective. .................................. 101
4.1.8 Supplier Development – The Prime Perspective. ................................................. 104
4.1.9 Performance Management – First Tier Suppliers Perspective. ........................... 107
4.1.10 Performance Management – The Prime Perspective. ........................................ 109
4.1.11 Service Recovery – First Tier Suppliers Perspective. ........................................ 112
4.1.12 Service Recovery – The Prime Perspective. ....................................................... 115
4.2 Empirical Evidence and its relationship with the literature. ............................ 117
4.2.1 Empirical Evidence and the Risk Management Literature. .................................. 118
4.2.2 Empirical Evidence and the Quality Management Literature.............................. 118
4.2.3 Empirical Evidence and Power and Relationship Management Literature. ........ 119
4.2.4 Empirical Evidence and the Supplier Development Literature. ........................... 121
4.2.5 Empirical Evidence and the Performance Management Literature. .................... 122
4.2.6 Empirical Evidence and the Service Recovery Literature. ................................... 122
4.3 Exploratory Phase – Emergence of Persistent Failure. .................................... 124
4.3.1 Summary of Key Identified Dominant and Sub–Themes. ..................................... 124
4.4 Summary. ......................................................................................................... 127
Chapter 5: Causal Analysis. ........................................................................ 129
5.1 Validation of First Tier Supplier and Prime Interview Scripts. ....................... 129
5.2 Development of Causal Loop Variables. ......................................................... 130
5.3 Quality Adherence. .......................................................................................... 131
5.3.1 The Quality Adherence Loop. ............................................................................... 131
5.3.2 The Disruption Loop. ........................................................................................... 134
5.3.3 Sub-Tier Capability Loop. .................................................................................... 137
5.4 Dependency. ..................................................................................................... 139
5.4.1 The Dependency Loop. ......................................................................................... 139
5.4.2 The Spend Relationship Loop. .............................................................................. 143

vi | P a g e
5.4.3 The Strategy Mitigation Loop............................................................................... 146
5.5 Supply Chain Risk Management. .................................................................... 147
5.5.1 The Supply Chain Flexibility Loop. ...................................................................... 147
5.5.2 The Demand Planning Loop................................................................................. 150
5.5.3 The Contingency Risk Loop. ................................................................................. 152
5.6 Relationship Management. .............................................................................. 155
5.6.1 The Communication Loop. ................................................................................... 155
5.6.2 The Relationship Management Loop. ................................................................... 157
5.6.3 Information Delay Loop. ...................................................................................... 159
5.7 The Core Failure Persistent Loop. ................................................................... 161
5.8 Developing the Persistence Failure Model. ..................................................... 164
5.9 Glossary Defining the Chosen Variables. ........................................................ 166
5.10 Chapter Summary. ......................................................................................... 168
Chapter 6 Causal Model Validation Phase. ............................................... 170
6.1 Prime Validation and critique of the Failure Persistence Model. .................... 170
6.1.1 The Quality Adherence Loop. ............................................................................... 172
6.1.2 The Disruption Loop. ........................................................................................... 173
6.1.3 Sub-Tier Capability Loop. .................................................................................... 175
6.1.4 The Dependency Loop. ......................................................................................... 176
6.1.5 The Spend Relationship Loop. .............................................................................. 178
6.1.6 The Strategy Mitigation Loop............................................................................... 179
6.1.7 The Supply Chain Flexibility Loop. ...................................................................... 180
6.1.8 The Demand Planning Loop................................................................................. 182
6.1.9 The Risk / Contingency Loop. ............................................................................... 184
6.1.10 Communication Loop. ........................................................................................ 185
6.1.11 Relationship Loop. ............................................................................................. 186
6.1.12 Information Delay Loop. .................................................................................... 188
6.1.13 Failure Persistence Loop. .................................................................................. 189
6.2 Section Summary. ............................................................................................ 191
6.3 Post Workshop Persistent Failure Model. ........................................................ 193
6.4 Post Workshop Persistent Failure Model. ........................................................ 194
6.4.1 Changes to the Quality Adherence Loops. ........................................................... 195
6.4.2 Changes to the Dependency Loops. ..................................................................... 197
6.4.3 Changes to the Risk / Contingency Management Loops. ..................................... 199
6.4.4 Changes to the Relationship Management Loops. ............................................... 200

vii | P a g e
6.4.5 Post Workshop Persistent Failure Model – Glossary. ......................................... 202
6.5 Chapter Summary. ........................................................................................... 204
Chapter 7 – Discussion. ............................................................................... 205
7.1. Supplier Performance. ..................................................................................... 205
7.2 Dependency. ..................................................................................................... 209
7. 3 Risk / Contingency Management. ................................................................... 213
7. 4 Relationship Management............................................................................... 214
7.5 The Persistent Failure Model. .......................................................................... 216
7.6 Managerial and Business Implications. ........................................................... 217
7.6.1 Implications of the Supplier Performance Loops. ................................................ 218
7.6.2 Implications of the Dependency Loops. ............................................................... 219
7.6.3 Implications of the Risk Management Loops........................................................ 220
7.6.4 Implications of the Relationship Management Loops. ......................................... 222
7.6.5 Implications of the Persistent Failure Model. ...................................................... 223
7.6.6 Using the Model to Mitigate against Persistent Failure. ..................................... 224
7.7 Research Conclusions. ..................................................................................... 226
7.7.1 Addressing Research Question One. .................................................................... 227
7.7.2 Addressing Research Question Two. .................................................................... 228
7.7.3 Addressing Research Question Three. ................................................................. 229
7.8 Chapter Conclusions. ....................................................................................... 230
Chapter 8: Conclusion. ................................................................................ 232
8.2 Limitations of Multiple Case Study Research. ................................................ 234
8.3 Opportunities for further research. ................................................................... 237
8.4 Wider Application of the Persistence Failure Model. ...................................... 239
References. .................................................................................................... 241
Appendix 1 – Draft Pilot Case Study Protocols ........................................ 268
Appendix 2 – Level 1: questions asked of specific interviewees .............. 274
Appendix 3 – Summary of the Coding File Findings. ............................... 297
Appendix 4 – First Quality Causal Loop Diagram. .................................. 299
Appendix 5 – Understanding Supply Chain Failure Presentation. ......... 301
Appendix 6 – Research Stage 3 Validation Design. .................................. 315

viii | P a g e
List of Figures.
Figure 3.1 Research Design Process. ........................................................................... 50
Figure 3.2 Coding Process for the Development of Causal Loop Diagrams. .............. 74
Figure 3.3 Birth Rate Causal Loop Diagram (Morecroft, 2009). ................................ 76
Figure 3.4 Research Phase Three - Validation Process. .............................................. 78
Figure 3.5 Construction of the Causal Loop Model Explained in Sequence. .............. 79
Figure 5.1 The Quality Adherence Loop. .................................................................. 132
Figure 5.2 Disruption Loop. ....................................................................................... 135
Figure 5.3 Sub - Tier Capability Loop. ...................................................................... 138
Figure 5.4 Dependency Loop. .................................................................................... 140
Figure 5.5 Spend Relationship Loop. ........................................................................ 143
Figure 5.6 Strategy Mitigation Loop. ........................................................................ 146
Figure 5.7 Supply Chain Flexibility Loop. ................................................................ 148
Figure 5.8 Demand Planning Loop. ........................................................................... 151
Figure 5.9 Contingency Risk Loop. ........................................................................... 153
Figure 5.10 Communication Loop. ............................................................................ 156
Figure 5.11 Relationship Loop. ................................................................................. 157
Figure 5.12 Information Delay Loop. ........................................................................ 160
Figure 5.13 Failure Persistence Loop. ....................................................................... 162
Figure 5.14 Failure Persistence Model. ..................................................................... 165
Figure 5.15 Failure Persistence Model Key Themes. ................................................ 169
Figure 6.1 Quality Adherence Loop. ......................................................................... 172
Figure 6.2 Disruption Loop. ....................................................................................... 174
Figure 6.3 Sub - Tier Capability Loop. ...................................................................... 175
Figure 6.4 Dependency Loop. .................................................................................... 177
Figure 6.5 Spend Relationship Loop. ........................................................................ 178
Figure 6.6 Strategy Mitigation Loop. ........................................................................ 180
Figure 6.7 Supply Chain Flexibility Loop. ................................................................ 181
Figure 6.8 Demand Planning Loop. ........................................................................... 182
Figure 6.9 Risk / Contingency Loop. ......................................................................... 184
Figure 6.10 The Communication Loop. ..................................................................... 185
Figure 6.11 Relationship Loop. ................................................................................. 186
Figure 6.12 Information Delay Loop. ........................................................................ 188
ix | P a g e
Figure 6.13 The Failure Persistence Loop. ................................................................ 190
Figure 6.14 Persistent Failure Model. ........................................................................ 193

x | P a g e
List of Tables.
Table 3.1 Adapted from Perry et al., (1997, pp.547). .................................................. 48
Table 3.2 Overview of Case Study First Tier Suppliers. ............................................. 61
Table 3.3 First Tier Supplier Participant Information.................................................. 61
Table 3.4 Demographic of the Prime Organisation. .................................................... 64
Table 3.5 Prime Interview Participant Information. .................................................... 66
Table 4.1A Prime Participants – Risk Management. ................................................... 88
Table 4.2 First Tier Suppliers - Quality Management. ................................................ 90
Table 4.2A Prime Participants – Quality Management. .............................................. 93
Table 4.3 First Tier Suppliers - Power and Relationship Management. ...................... 96
Table 4.3A Prime Participant – Power and Relationship Management. ...................... 99
Table 4.4 First Tier Supplier - Supplier Development............................................... 102
Table 4.4A Prime Participants – Supplier Development. .......................................... 105
Table 4.5 First Tier Suppliers – Performance Management. ..................................... 107
Table 4.5A Prime Participants – Performance Management. .................................... 110
Table 4.6 First Tier Suppliers - Service Recovery. .................................................... 112
Table 4.6A Prime Participants – Service Recovery. .................................................. 116
Table 4.7 Exploratory Phase One - Summary of Key Themes and Sub - Themes. ... 125
Table 5.1 Quality Adherence. .................................................................................... 132
Table 5.2 Disruption. ................................................................................................. 135
Table 5.3 Sub-Tier Capability. ................................................................................... 138
Table 5.4 Dependency................................................................................................ 140
Table 5.5 Spend Relationship. ................................................................................... 143
Table 5.6 Strategy Mitigation. ................................................................................... 146
Table 5.7 Supply Chain Flexibility. ........................................................................... 148
Table 5.8 Demand Planning. ...................................................................................... 150
Table 5.9 Contingency Risk. ...................................................................................... 153
Table 5.10 Communication. ....................................................................................... 155
Table 5.11 Relationship Management. ...................................................................... 157
Table 5.12 Information Delay. ................................................................................... 159
Table 5.13 Failure Persistence Model Glossary. ....................................................... 166
Table 6.1 Type of Issues Captured during the workshops. ........................................ 171
Table 6.2 Quality Adherence Loop Group Feedback. ............................................... 172
xi | P a g e
Table 6.3 Disruption Loop Group Feedback. ............................................................ 174
Table 6.4 Sub-Tier Capability Loop Group Feedback. .............................................. 175
Table 6.5 Dependency Loop Group Feedback. ......................................................... 177
Table 6.6 Spend Relationship Loop Group Feedback. .............................................. 178
Table 6.7 Strategy Mitigation Loop Group Feedback. .............................................. 180
Table 6.8 Supply Chain Flexibility Group Feedback. ............................................... 181
Table 6.9 The Demand Planning Loop Group Feedback. ......................................... 182
Table 6.10 Risk / Contingency Loop Group Feedback. ............................................. 184
Table 6.11 Communication Loop Group Feedback. .................................................. 185
Table 6.12 Relationship Loop Group Feedback. ....................................................... 187
Table 6.13 Information Delay Loop Group Feedback. .............................................. 188
Table 6.14 Failure Persistence Loop Group Feedback. ............................................. 190
Table 6.15 Post Workshop Persistent Failure Model. ................................................ 194
Table 6.16 Post Workshop Persistent Failure Model Glossary. ................................ 202

xii | P a g e
List of Abbreviations. OEM Original Equipment Manufacturer.
NTSB National Transport Safety Board.
SME Small Manufacturing Enterprise.
SABRe Quality Management System used by the Prime.
IMP International Marketing and Purchasing.
SORB Sales Order Review Board.
IPR Intellectual Property Rights
PFMEA Process Failure Mode Effects Analysis.
NPI New Product Introduction.
PPAP Parts Productions Approval Process.
MRPC Material Requirements Planning Controller.
C Class Consumable Class Part.
NADCAP National Aerospace and Defence Accreditation.
Programme.
FMCG Fast Moving Consumable Goods.

Chapter 1 – Introduction.
1.0 Background and motivation. This work is concerned with supply chain failure in manufacturing industries.
Preventing supply chain failure from happening and the required actions and
organisational transformations involved are the subject of numerous literature and
research articles, covering a number of literature domains. The research literature
considers supply chain failures in two broad streams. The first examines events that are
out of the control of the supply chain such as natural disasters, civil unrest as an example
(e.g. Natarajarathinam et al., 2009). Such significant events may be anticipated to some
degree but generally cannot be predicted. The second stream concerns failure in the
operation of the supply chain such as process failures (e.g. Craighead et al., 2004).
These types of failures may potentially be identified and dealt with by manufacturers
conducting internal and external audits of their suppliers and taking appropriate
corrective action (e.g. Power and Terziovski, 2007). However, in this work we are
concerned with a third type of supply chain failure: understanding what happens when
an organisation can identify and observe supply chain failure happening but seems
incapable of preventing the failure from re-occurring. Such failures may become much
more damaging than an isolated incident. They may become a persistent failure that can
seriously harm an organisation’s ability to successfully produce and deliver its
products, and with this cause harm to its reputation and its ability to secure repeat
business.
In this work we are particularly concerned with the inbound supply chains of
large industrial manufacturing companies, typically labelled as OEMs, primes, or focal
supply chain organisations. The related concepts of OEM (Original Equipment
Manufacturer), prime and focal organisations are considered for instance, in studies by
Harland (1996), Harland et al., (2004) and Clivillé and Berrah (2012) and refer to the
‘major player’ in a supply chain that may be the most powerful entity, possibly the
largest entity, and typically the designer and controller of the supply chain. In this study
we use the term ‘prime manufacturer’, or simply ‘the prime’, for this type of industrial
organisation throughout the thesis.
In today’s highly competitive global manufacturing industries, the reality facing
most prime manufacturing organisations is one where resources have been reduced,
inventory has been drained, technology spending curtailed, and processes that are not

2 | P a g e
core to an organisation’s business are scaled back and / or outsourced. In an uncertain
recovery, supply chain operations need to be more scalable and flexible (Wu and Olson,
2010). In competitive global marketplaces prime manufacturers cannot afford to fail in
any area of their operations (Choi and Krause, 2006). Supply chain failure is a
phenomenon that can potentially cause major issues for many prime manufacturing
organisations, especially if failure becomes persistent.
In order to save costs and remain competitive, macro-economic conditions have
forced large scale and complex prime manufacturers that would traditionally have
produced parts, sub-assemblies, components and systems in-house, to re-evaluate how
they do business. This involves making decisions to source particular parts, sub-
assemblies, systems, and products from external supply chains. However, this activity
has been found to equate to greater risks in meeting production planning timescales and
achieving the required levels of quality and delivery (Flynn et al., 2016). The risks to a
prime manufacturer are increased when reliance is switched from internally controlled
processes to externally managed processes in the supply chain (Zsidisin and Wagner,
2010). In high tech and complex project-based manufacturing, organisations may face
more risks related to supply chain failure because of the limited number of companies
that are capable of supplying the type of technology that a prime company may need.
This type of industry may also be less attractive or prohibitive to small manufacturing
companies because of the high manufacturing investment, set up, and development
costs, which means that barriers to entry are very high (Grundy, 2006), further limiting
the number of potentially capable suppliers.
A recent example that demonstrates how outsourcing components can lead to
supply chain failure is the case of Boeing’s problems in the development and
subsequent very late launch and delivery of the Dreamliner 787 aircraft (Kotha et al.,
2013). It promised to offer a revolutionary change in airframe design with greater
operating efficiency and a reduction in environmental impact. Boeing’s 787 strategy
was to outsource a higher proportion of production than had ever previously been the
case (Piercy, 2009). However, the supply chain problems experienced by Boeing
eventually led to very extensive delays and subsequent in-service safety issues. The
most highly publicised incident was that caused by faulty batteries, which resulted in a
fire on an ANA aircraft in the US. In fact all of the initial operators of the aircraft

3 | P a g e
experienced the same problem (NTSB Report, 20131). These issues led to a global
grounding of all Dreamliner aircraft. Out-of-service aircraft can cost airlines many
thousands of pounds every day due to disruption costs (Elahi et al., 2014).
This example highlights the potential risks that organisations face when they
decide to outsource components and systems that have historically been manufactured
and developed in house (Tang, 2006). In this case, significant technical problems were
encountered from systems that were acquired from external suppliers within Boeing’s
first tier supply chain such as the on-board batteries, electrical wiring and particularly
the composite material used to create the skin of the aircraft (Kotha and Srikanth, 2013).
The problems encountered by Boeing also resulted in the company being forced to push
back its initial scheduled first deliveries of the Dreamliner at least three years later than
originally planned resulting in very significant profit implications for Boeing with
compensation payments to its customers and to those suppliers that could supply on
time. Even so, this was not enough time for Boeing to prevent the issues from re-
occurring when the aircraft were initially in production and service.
Such scenarios are not just a concern in the most complex project-based
manufacturing (Ambulker et al., 2015). The automotive industry is not immune to
failures emanating from their suppliers. Famous automotive brands have been hit with
a number of high profile quality failures in recent years resulting in embarrassing
product recalls and subsequent losses of revenue (Choi and Chung, 2013). In particular,
a major portion of such failures has been attributed to parts that were sourced externally
(Natarajarathinam et al., 2009) and significantly, it seems that no auto-producer is
immune to such supply chain failures. Even the staunchest advocate of effective
supplier management – Toyota - has been affected in recent years (Hammond, 2013).
Toyota’s ‘sticking accelerator pedal’ issue caused three separate recalls over a
three year period. The company responsible for supplying the electronic accelerator
pedals to Toyota (CTS Corporation) had also experienced issues with Chrysler vehicles
who recalled 35,000 Dodge and Jeep models due to ‘sticky gas’ pedals (Dyer and
Nobeoka, 2000). Overall, the disruption is estimated to have cost Toyota two billion
dollars in lost revenue (Hammond, 2013). A major reason that the issue went on to
become a critical problem for Toyota was because it was not identified within the
1 NTSB Report – Auxiliary Power Unit Battery Fire Japan Airlines Boeing 787-8, JA829J Boston,
Massachusetts January 7, 2013.

4 | P a g e
manufacturing testing procedure during initial product development and supplier
contracting or in early production. Due to contractual obligations and conducting
lengthy standard industry procedures for detailed root cause analyses, the issue had
already manifested itself as a persistent problem for Toyota in volume production. It
should have been important for Toyota to resolve the issue as quickly as possible since
the cost of attracting new customers is significantly higher than retaining existing ones
(Fornell and Wernerfelt, 1987). Unfortunately for Toyota, they failed to capture and
mitigate the problem in time to prevent the issue from seriously damaging the
company’s legendary reputation for quality, lean manufacturing methods, and supplier
management (Dyer and Nobeoka, 2000; Choi and Chung, 2013).
Some years prior to Toyota’s much publicised problems another case of supply
chain failure that persisted within the automotive industry was that of the Firestone
tyres fitted to Ford’s Explorer, Mercury and Mountaineer models. High failure rates of
the Firestone tyres fitted to these models were identified between 1990 and 2000
(Biggemann and Buttle, 2008). By the end of 2000 there was a significant death toll
attributed to this by regulatory authorities in the United States. This was estimated at
more than two hundred and fifty, with some three thousand incidents in total being
associated with the ‘defective’ Firestone tyres (Moll, 2003). The subsequent approach
adopted by Ford and Firestone to manage the crisis not only severely damaged their
century-old relationship but also enabled other parties to exploit the failure for their
own commercial gain. The consequences resulting from these organisations’ inability
to deal with persistent failure included significant impacts on each company’s bottom
line, as well as damage to their brand reputations (Biggemann and Buttle, 2008).
Great efforts have been made by manufacturing organisations, large and small,
in almost every industry in recent decades to adopt strategies that seek to make
themselves as efficient, streamlined and competitive as possible in order to survive and
prosper. The methods required to do this have been widely researched and much talked
about in the literature (Holweg, 2007; Kaplan and Norton, 2008). The ability to achieve
effective recovery from failure is an important responsibility of the operations and
supply functions in manufacturing companies and one that has also been addressed by
service organisations (Miller et al., 2000). However, the phenomenon of persistent
supply chain failure is one area within purchasing, supply chain and operations
management that has received little or no attention. As will become evident from the

5 | P a g e
review of literature in Chapter 2, there are gaps in the literature seeking to understand
and explain why organisations in some manufacturing sectors seem powerless to
resolve supply chain problems in a quick and responsive manner, resulting in failure
persisting in the supply chain. The absence of specific research literature on a topic that
is prominent in the practitioner world is conspicuous.
This research project is being conducted in order to investigate, analyse and
evaluate the phenomenon of persistent supply chain failure. The work seeks to
understand what persistent supply chain failure is, what causes it, and its effects on
prime manufacturing organisations with extensive supply bases. The initial research
conception for the study defined persistent supply chain failure as:
“Persistent supply chain failure results when a supplier consistently fails to
provide the level of quality and delivery performance originally expected or
specified within an agreed contract. Due to a lack of substitutes with adequate
design and manufacturing capability or capacity, and potentially high switching
costs, opportunities to source components, sub-assemblies or systems or to
develop new capability elsewhere are not economically viable and / or are
extremely time consuming; thus resulting in the persistence of supply chain
failure” (MacCarthy et al., 2014). 2
The above paragraph highlights some of the characteristics of operating
environments where the phenomenon of persistent failure may occur, in particular long
timescale industries such as aerospace where the product lifecycle is extensive in terms
of design and development, supplier contracting and production, often measured in
decades.
1.1 Research background. A comprehensive review and analysis of the supply chain management literature has
been conducted. Key supply chain research literature topics were identified and
examined to determine if they contained questions, information, findings or insights
that were relevant to situations or scenarios that could contribute to, or be causes of
persistent failure in the supply chain. The research literature domains examined in the
study comprised: Supply Chain Management; Risk Management in the Supply Chain;
Supply Chain Quality Management; Supplier Development; Power, Leverage and
2 MacCarthy, B. L, Kauppi, K and Cox, K (2014) “The Dynamics of Supply Chain Failure”, 21st International
Annual EurOMA Conference, Palermo, Italy, 20-25 June 2014, "Operations Management in an Innovation
Economy".

6 | P a g e
Dependency in the Supply Chain; Performance Management in the Supply Chain;
Relationship Management in the Supply Chain; Project and Programme Management;
and Service Recovery. Literature on System Dynamics was also investigated once it
was decided that causal loop diagrams would be a valuable method to examine and
illustrate the cause and effect relationships that may result in persistent supply chain
failure.
An outcome of the literature review was that little or no literature was found
that identifies or focuses specifically on the phenomenon of persistent supply chain
failure. A contributory factor to this may be that organisations will make efforts to hide
such failings from the outside world to prevent negative information from reaching
potential customers or the media. The examples given in the introductory section
became well-publicised because of the global prominence of the organisations
involved, the publicity associated with these failures, and the interest of the media and
business sources in how the issues had arisen and how they would be resolved.
The literature examined for this study tends to focus on related but different
types of scenarios, for example how organisations identify and attempt to mitigate
failure before it happens and how they deal with previously identified failures quickly
once they happen (Zsidisin et al., 2000). Such research often portrays a positive image
of an organisation. The message it tends to give is – the organisation has failed but got
it right in the end, and here is how. The phenomenon of persistent supply chain failure
does not show this kind of positivity. As will be evident in the empirical study for this
research, the language of practitioners leans much more towards understanding and
developing coping strategies – getting by somehow.
Much of the supply chain management literature asserts that the long-term
success and sustainability of an organisation at least partly depends on the reliability of
its suppliers and the level of satisfaction reported by its customers. In other words, the
entire supply chain must be successful (Chandra and Kumar, 2000) for a company to
grow and be competitive. It is rare that an organisation will admit that it does not have
control of its supply chain (Flynn and Flynn, 2005) as strong supplier management
capability is often sought by potential customers. The supply chain literature does not
tackle issues concerning failures that persist and do not go away no matter how much
attention and resources a prime manufacturer commits to resolving the problem. By
attempting to capture and define key events that come together to cause persistent

7 | P a g e
supply chain failure, this research will help to gain a better understanding of those
factors and events and to develop ways of managing them, i.e. to identify the most
appropriate supply chain strategies that are needed to adequately deal with persistent
failure.
1.2 Research aims, objectives and expected contributions. The principal aim of this research is to understand what persistent supply chain failure
is and to understand why and how it happens. The work seeks to examine and
understand the ‘mechanisms’ and ‘dynamics’ of how organisations react to this kind of
adversity in supply chains. The study will focus on large hi–tech industrial prime
manufacturers and their suppliers. A key component of the research framework
formulation process has been to identify and then specify a set of research questions
that capture the essence of what we seek to study in this research. Pertinent questions
help the researcher to determine how data collection and subsequent analyses should be
conducted, structured and developed so that meaningful and informed findings and
insights are obtained. The research questions for this study have been posed following
an extensive literature review covering a range of both academic and practitioner
literatures. The outcome of the review was that there are indeed gaps in the literature
concerning the research topic. To adequately capture, understand and explain the
phenomenon of persistent supply chain failure, three research questions have been
formulated:
Research question one (RQ1): What is persistent supply chain failure and how can
it be understood?
Research question one is the primary question the study aims to answer - an exploration
of the origins of persistent failure and its effect on an organisation. By studying the
literature and comparing it against empirical findings, an understanding of the
phenomenon and why it happens or rather, is allowed to persist, will be gained.
Research question two (RQ2): What factors drive persistent supply chain failure
and what are the interrelationships between them?
Research question two seeks to identify the causal factors and understand how they are
related. By conducting new empirical research and analysing the data obtained in an
appropriate way, a causal model explaining the persistence of supply chain failure will
be developed to enable greater understanding of the phenomenon.

8 | P a g e
Research question three (RQ3): What supply chain strategies can be adopted to
help resolve different types of persistent failures effectively?
Answering these research questions will contribute and add new knowledge to
the existing literature in supply chain and operations management. Identifying what
persistent supply chain failure is, the factors that cause it, how they are linked, and the
mitigation strategies that are available will generate an understanding of how and why
persistent failure happens in large hi–tech prime manufacturers and will provide
insights for purchasing and supply chain managers on how to mitigate against this type
of failure.
1.3 Overview of research methodology and design. The work has been conducted with organisations operating in the aerospace supply
chain, an application domain where persistent supply chain failure is observed. Given
the content of the research questions a case study methodology utilizing qualitative
research techniques (Yin, 2009) was chosen to provide the empirical evidence to allow
further analysis of the phenomenon under study.
The study was conducted with one prime aerospace manufacturer and multiple
first tier suppliers. The research approach aimed for a dyadic supply chain perspective
on supply chain failure to enhance the richness of the research in the context of the
contemporary research literature. Case studies were conducted with multiple
interviewees in five first tier supplier organisations and with key supply chain managers
from the prime manufacturer. The research questions provided a framework to
undertake the qualitative case studies.
To understand and answer research question 2, an approach from Systems
Dynamics - causal loop modelling (Morecroft, 2009) – was selected. Causal loop
diagrams have been created to capture and illustrate linkages between activities that
could develop and result in persistent supply chain failure. Causal loop diagrams are
constructed using a process of coding of empirical raw data (Stall–Meadows and Hyle,
2010). Causal loop diagrams show strong emergent themes as linkages between key
variables (Sterman, 2000). In coding raw data, key variables attributed to cause and
effect of failure are identified. Each loop aims to provide a visual representation to
explain how persistent supply chain failure occurs. Capturing mental models of the
participants, which is a technique from Systems Dynamics modelling (Groesser and
Schaffernicht, 2012), was used to assist in creating causal loop diagrams for each theme

9 | P a g e
based on the findings from the semi-structured interviews. An understanding of the
casual mechanisms and dynamics of persistent supply chain failure can help managers
within an organisation. The usefulness of the research and subsequent output will be
described so that the implications for wider industrial use of the model can be examined.
The work has been conducted in three stages as briefly explained below.
1.3.1 Research phase one: Exploratory study and data collection.
The research approach encompasses a case study design as proposed by Yin (2009),
incorporating a research instrument and protocol design, data collection, analyses,
followed by validation. Research phase one has been split into two stages, the first
involving semi-structured interviews conducted with participants from the aerospace
first tier supply chain followed by a repeat process with participants from a leading
aerospace manufacturer’s global supply chain management division. All interviews
were conducted on site at the suppliers’ and prime manufacturer’s facilities. In total,
five first tier suppliers participated in the study. They were chosen on the basis of their
relationship with the prime and because they had at various points in the recent years
been strongly associated with persistent supply chain failure by the prime. Nineteen
supplier participants were interviewed at each first tier supplier covering every topic
making a total of thirty five interviews. Eleven employees from the prime participated
covering fourteen interviews making a total of thirty participants with a total of forty
nine interviews conducted in stage one. It must be noted that due to the sensitivity of
the issues being investigated (i.e. issues around failure) this was not an easy activity to
carry out as all participating suppliers were currently contracted and conducting
business with the prime.
Prior to commencing the semi-structured interviews at both the supplier and
prime manufactures’ facilities, protocol documents3 were established in order to give
the process the required structure, rigour and research robustness. This was put in place
to enable the best possible opportunity for capturing rich data and also to provide
protection for all interview participants in terms of confidentiality. All interviews were
recorded and subsequently transcribed.
The purpose of conducting semi-structured interviews was to concentrate the
research on identifying linkages with findings made from the literature review and to
adequately answer the research questions. Stage two focused on strengthening the
3 Example – Provided in Appendix One.
10 | P a g e
exploratory phase findings with views and insights from business and supply chain
management professionals from the prime in order to gain perspective from both sides
of the supply chain relationship.
1.3.2 Research phase two: Analysis.
Research phase two has also been separated into two distinct stages. The first involves
qualitative analysis, which was conducted in order to identify common themes of
causality related to persistent supply chain failure as identified during research phase
one and to examine links between the interview findings and the literature. An axial
coding technique was adopted (Strauss and Corbin, 1990; Yin, 2009) as a systematic
method for analysing and interpreting the interview data. This was carried out in order
to tease out emergent themes from the data. The aim was to identify both consistencies
and differences in responses to the interview questions from both sides of the dyad. It
was hoped that key themes would emerge through consistent answers to the interview
questions. Differences in perspective, are also important in understanding the
phenomenon being studied. The identified issues and captured themes were also
assessed against the current literature in order to identify and establish the contribution
that the research could make to the state of knowledge on the phenomenon under study.
For stage two, a causal analysis has been conducted using causal loop diagrams
to visually demonstrate how variables interact to cause an effect that either reinforces
the problem or balances / reduces it (Sterman, 2001). An initial version of the supply
chain persistent failure model was developed in stage 2.
1.3.3 Research phase three: Validation.
The purpose of research phase three was to test and validate the causal loop diagrams
and the initial persistent failure model. Research phase three began with a complete
review of all previously obtained data including each of the original interviews with
participants from both the first tier suppliers and the prime. Each original participant
was given the opportunity to review the information they provided in the exploratory
phase of the research. This validation process was carried out to ensure that the
information originally collected was still relevant and topical after the passing of time.
The process formed a pre-requisite to the major critique of the model. Validation of the
persistent failure model was carried out by conducting a workshop with supply chain
management professionals. It was a significant stage of the research process and was
carried out to strengthen both the methodological rigour and the overall validity of the

11 | P a g e
model and the process resulted in an amended final version of the supply chain
persistent failure model.
1.5 Structure of the Thesis. The thesis consists of eight Chapters, which provide the reader with a detailed
description of events that happened throughout the research process. The overall
structure of the thesis aims to guide the reader towards an understanding of the
contribution to knowledge given and the managerial implications that this entails.
In Chapter 2 (Literature Review) a detailed analysis of the relevant literature is
provided covering various aspects of the operations and supply chain management
domain. The review focuses on the literature domains that have been analysed to gain
knowledge and understanding of supply chain failure. Against each case, the cause and
effect and subsequent mitigation strategies of supply chain failure adopted by industry
have been examined. The key literature domains examined draw on a range of subject
areas that are related to the cause and effect of persistent failure. The analyses provide
justification of the research questions by identifying gaps in the literature. The analysis
highlights where the literature is currently silent on each issue, focusing where the
research and design methodology process needs to concentrate in order to confirm, add
to, or refute the literature.
Chapter 3 (Methodology and Research Design) provides a detailed description
of the research method and design adopted throughout the research process. Activities
described in the Chapter include the first tier semi-structured interview method and the
protocol design adopted to manage each case study. General information is provided
about the first tier suppliers that took part in the study and information on the interview
participants from both the first tier suppliers and the prime. In keeping with a rigorous
research process, the method adopted for first tier suppliers was replicated for the prime
manufacturer. The Chapter discusses the qualitative analysis design and method and
provides a description of causal analysis and how it was conducted. The Chapter
concludes with a description of how the work was validated.
Chapter 4 (Qualitative Analysis) provides a commentary on the findings from
both the first tier and prime semi-structured interviews during the exploratory phase of
the study. An explanation of the emergent themes from both research streams is then
given based on first order coding analysis. The description of this process is followed
12 | P a g e
by a discussion of the empirical findings in the context of the literature, which focuses
on comparing each captured theme and the contemporary literature.
Chapter 5 (Causal Analysis) provides a thorough description and justification
of the development of the causal loop variable names using the captured themes that
were described during Chapter four. A brief description is then given of how each of
the variables link together, followed up by an illustration of each loop. Once each loop
is highlighted, the first major iteration of the causal loop model demonstrating persistent
supply chain failure is presented.
Chapter 6 (Validation) describes the findings and observations from the
validation workshop conducted at the prime. It includes findings from the first tier and
prime participants by re-examining the interview data captured during the exploratory
phase. The model is dissected from the bottom up in order to present the participants’
observations and critique of the model. This is done to show the methodological rigour
of the research process that permeated the entire data collection and analysis sections.
As a consequence of the critique of the model from the validation workshop, Chapter 6
shows the final iteration of the persistent failure model. A description of the model and
how it was developed is subsequently provided giving a brief explanation and
justification of what changed and what remained the same.
Chapter 7 (Discussion) presents a detailed discussion of the persistent supply
chain failure model in the context of the literature. For each loop in the model, whether
the literature is confirmed or refuted is discussed. Additionally, throughout the Chapter,
an identification of whether the literature is currently silent on each captured issue is
given, providing clarification about where and how the study and the model add to
existing knowledge.
Chapter 8 (Conclusions) concludes the thesis with a detailed evaluation of each
research question in relation to the study. Key research findings culminating in a
consolidation of the theoretical and management contributions that the research study
has provided are then given. The Chapter concludes with an examination and evaluation
of the limitations of the study and areas of potential further research are provided.

13 | P a g e
Chapter 2: Literature Review. The purpose of Chapter 2 is to provide a comprehensive review of literature relevant to
the study of persistent supply chain failure. The Chapter aims to identify and clarify
key gaps in the existing literature and to justify the research questions proposed in
Chapter 1. Importantly, this Chapter seeks to clearly define the topic of study (Baker,
2000) and justify the need for the research to be conducted. The Chapter also aims to
identify the principal themes that will guide the research design and methodology used
in the study.
A wide breadth of literature was reviewed during the study because there
appeared to be little or no subject areas or research streams specifically focusing on
persistent supply chain failure. Hence, a range of subjects that could potentially
influence the research and help to underpin relevant research questions had to be
explored. After an extensive review of the literature, research focusing specifically on
persistent supply chain failure appeared to be non–existent, providing a major
motivation for the present study.
The review commences with a brief general overview of Supply Chain
Management (e.g. Lambert and Cooper, 2000) followed by a detailed investigation of
a number of key literature streams: Risk Management in the supply chain (e.g. Zsidisin
et al., 2000); Supply Chain Quality Management (e.g. Yeung, 2008); Power, Leverage
and Dependency in the supply chain (e.g. Cox (2001); Supplier Development (e.g.
Krause and Ellram, 1997); Performance Management in the supply chain (e.g.
McAdam et al., 2008) and Relationship Management in the supply chain (e.g.
Håkannson and Ford, 2004). Included within the section on risk is discussion of
Contingency Management (e.g. Donaldson, 2001). Further literature domains were also
examined because it was anticipated that they would also provide useful insights to the
research and help answer the research questions. They included Project and Programme
Management (e.g. Rodrigues and Bowers, 1996); System Dynamics (e.g. Sterman,
2000) and finally Service Recovery (e.g. Tax et al., 1998). The flow of the literature
review has sought to highlight and reflect these subject crossovers.
2.1 Literature Domains. The main purpose for conducting a literature review is to avoid ‘calamities of
ignorance’ and the reinvention of what is already known (Baker, 2000 p.220). In order
to conduct a thorough review of the literature, the following process was adapted from
14 | P a g e
Hart (1998, p. 32): define the topic; think about the scope of the topic; think about the
outcomes; think about the housekeeping; plan the sources to be searched; search the
sources listed.
The next stage in the process was to identify the key literature subjects that
would help define and provide adequate coverage for the chosen topic. The main
purpose of this activity is to build an understanding of related theoretical concepts and
terminology (Rowley and Slack, 2004). The next step was to identify peer reviewed
research journals most relevant for the research topic (Webster and Watson, 2002).
Although the search parameters were not constrained, the main targeted journals
initially consisted of: Journal of Operations Management; International Journal of
Production Economics; International Journal of Production Research; Journal of
Supply Chain Management; International Journal of Project Management; Supply
Chain Management: An International Journal; Journal of Purchasing and Supply
Management; International Journal of Operations and Production Management.
2.2 Supply Chain Management. Christopher (1992) argued that leading edge companies came to a realisation that real
competition is not ‘company against company’, but rather ‘supply chain’ against
‘supply chain’ (Mentzer et al., 2001). But what is a supply chain? According to Mentzer
et al., (2001 p. 4) the term ‘Supply Chain’ is defined as: “A set of three or more entities
(organisations or individuals) directly involved in the upstream and downstream flows
of products, services, finance, and / or information from a source to a customer”.
In earlier work, Cooper and Ellram (1993) described supply chain management
as the management of the distribution flow from supplier to the end user. However,
despite being adopted by organisations in various different ways since the early
nineteen eighties, a universally accepted definition of the terms ‘supply chain
management’ and what they encompass has not yet been agreed within the literature
(Ellram and Cooper, 2014). Mentzer et al., (2001) suggested that the terminology
‘supply chain management’ caused confusion for those who studied it (Mentzer et al.,
2001 p. 5). Notwithstanding, the continuing trends of outsourcing and globalisation has
forced prime manufacturers to investigate and identify effective methods for
coordinating the flow of materials with suppliers in order to ensure components are
delivered on time, at the correct quality level, and at minimum cost, thus enabling
competitiveness (Ellram and Cooper, 2014). This has resulted in the practice of supply
15 | P a g e
chain management being widely used throughout industry with almost all
manufacturing organisations having some dedicated functions or departments that
concentrate on managing external suppliers in some way. The extent to which supply
chain management is emphasised within manufacturing organisations depends on the
proportion and amount of components that are sourced externally. Tan et al., (1998)
explain how supply chain management ‘brings together trading partners with a
common goal of optimisation and efficiency’. They describe this as the purchasing /
supply perspective and suggest that it is the lead organisation that attempts to manage /
coordinate the processes and operations of separate organisations to achieve one goal
(Tan et al., 1998).
Echoing Christopher (1993), Lambert and Cooper (2000) developed a
framework for supply chain management that showed how modern organisations no
longer compete as autonomous businesses but rather supply chains. Their research
indicated that managing the supply chain involves three interrelated elements: (1) the
supply chain network structure; (2) supply chain business processes; and (3) the
management of components (Lambert and Cooper, 2000 p.81). The framework was
later updated to include relationships and networks of large major organisations
(Clivillé and Berrah, 2012), noting that processes were cross functional (Lambert and
Enz, 2017 p. 5). The relationships and networks share innovative information and learn
from each other (Harland, 1996). Harland et al., (2004) developed a model that
identifies nine different types of inter organisational networking and collaboration
activities within the supply network which included Partner Selection; Resource
Integration; Information Processing; Knowledge Capture; Social Co-ordination; Risk
and Benefit Sharing; Decision Making; Conflict Resolution and Motivation (Harland et
al., 2004).
Research on supply chain management has identified how strategic
collaborations and issues concerning relationship management between buyers and
suppliers is a key to reducing the risk of failure and improving performance (Teller et
al., 2016).
2.3 Risk Management in the Supply Chain. The concept of Risk Management has received considerable attention over the past few
years within the operations and supply chain management literature (e.g. Zsidisin et al.,
2000; Kleindorfer and Saad, 2005; Sharma and Bhat, 2014; Ho et al., 2015). Risk

16 | P a g e
management research that focuses on how organisations seek to identify and mitigate
against the cause and effects of supply chain disruptions is also quite extensive (e.g.
Kleindorfer and Saad, 2005; Bode and Wagner 2015; Kauppi et al., 2016; Busse et al.,
2017). According to Zsidisin et al., (2004) supply chain risk can be defined as: “The
probability of an incident associated with inbound supply from individual supplier
failures or the supply market occurring in which its outcomes result in the inability of
the purchasing firm to meet customer demand or cause threats to customer life and
safety”. Research describes how purchasing organisations may not be able to reduce
the uncertainties associated with suppliers, and must instead construct buffers to protect
against the effects of manifested uncertainties (Zsidisin et al., 2000 p. 187).
Arguably the most significant contributor to literature on risk management in
the supply chain is Paul Kleindorfer, his work spanning a forty five year career. His
biggest contribution to the field concerned the challenges of managing risks in
operational settings (Cohen and Kunreuther, 2007), concentrating on supply chain
disruption risk and its potential causes (Kleindorfer and Saad, 2005). Kleindorfer
examined risk management issues from a number of perspectives such as linking risk
assessments with risk management themes for low probability, high consequence
events, risk management of natural hazards and catastrophic risks (Cohen and
Kunreuther 2007) and studies investigating supply chain resilience to supply and
demand disruption (Bakshi and Kleindorfer, 2009). His key study resulted in a
conceptual framework for risk analysis, which characterised the importance of
identifying linkages between risk assessments, risk perceptions and the development of
risk management strategies (Cohen and Kunreuther, 2007 p.526).
Another consistent contributor to research on supply chain risk management is
George. A Zsidisin. His research, conducted over a fifteen year period, has focused on
the tools and techniques that organisations use to assess what their risks are, and the
probability of them occurring. The research found that key tools adopted by
organisations to manage risks are based around risk assessments (Zsidisin et al., 2000).
When conducting a risk assessment, key stakeholders are invited to participate in the
process. All of the identified risks then require a mitigation plan. The research
highlighted how adoption and effectiveness of risk management tools such as risk
assessment methodologies depend on the size of the organisation with SME’s being
unlikely to adopt risk management processes (Zsidisin and Wagner, 2010). Sharma and

17 | P a g e
Bhat (2014) identified that many companies invest minimal time and resources into
capturing and mitigating supply chain risks. This could be due to limited resources and
the inability to assess all possible risks (Mandal, 2011).
Organisational approaches to outsourcing products are also reviewed from a risk
management perspective. Topics that are commonly explored in the area of risk consist
of approaches to managing global risks and the subsequent impact on issues such as
hidden cost, lead time pressure and buying organisation to first tier supplier integration
problems (e.g. Ritchie and Brindley, 2000; Auden et al., 2006; Manuj and Mentzer,
2008; Antelo and Bru, 2010; Christopher et al., 2011; Vedel and Ellegaard, 2013).
Previous studies have sought to identify the characteristics of supply chains in relation
to frequency of disruption (e.g. Choi and Krause, 2006; Craighead, 2007). Bode and
Wagner (2015) found a positive relationship among organisations with higher
complexity in skills and knowledge, hierarchical levels and geographical spread with
the frequency of supply chain disruptions. Essentially, the greater the size of the
organisations that operate within a supply chain then the greater the complexity, which
in turn increases the risk of supply chain disruptions.
Organisational approaches to outsourcing have also spawned research focusing
on supply chain agility and supply chain resilience. This is concerned with how
organisations respond in a timely and effective manner to market volatility and other
uncertainties, allowing buying organisations to maintain a competitive position (Gligor,
2014). Literature on supply chain agility and resilience is closely related to studies that
investigate the effect of demand uncertainties that can exist within supply chains (e.g.
Tang and Tomlin, 2008; Kerkkänen et al., 2009; Rossetti and Unlu, 2011; Kaman et al.,
2013; Ho and Fang, 2013; Gligor, 2014; Pereira et al., 2014; Xie et al., 2014; Ambulker
et al., 2015; Jabbarzadeh et al, 2017). Studies found that demand fluctuations and
supply variations can result in increased inventory levels and delayed deliveries
resulting in a reduction in supply chain agility and resilience. Flynn et al., (2016)
identified that decision makers rarely have demand information when making inventory
decisions, which can increase the risk of high inventory through the buffering of stock.
The buffering of stock is a strategy used to mitigate against the risk of demand
uncertainties and late deliveries (Mishra et al., 2016).
The concept of Contingency Management is an area of risk management related
to the macro–economic environment (Donaldson 2001). The main difference between

18 | P a g e
the two research streams is that although they both essentially examine risk in its
differing forms, contingency management focuses on how organisations proactively
manage crises in supply chains that are out of their control (Natarajarathinam et al.,
2009). Research has found that smaller manufacturing companies tend not to have
defined structures in place to explicitly manage contingency risks but can monitor the
macro environment through observing relevant media channels (Tenhiälä, 2011).
Therefore, it is usually the larger prime manufacturers who are concerned with ensuring
that first tier suppliers make adequate provisions for contingency management in return
for being awarded contracts. This includes examining the type of risks faced by
manufacturing organisations and identifying how they can affect supply chains (e.g.
Chopri and Sodhi, 2004; Sheffi and Rice, 2005; Ellis et al., 2010; Zsidisin and Wagner,
2010; Bode et al., 2011; Ambulkar et al., 2015 and Kim et al., 2015).
Other research on contingency management analyses event-based issues and
focuses on significant disasters and recovery from subsequent supply chain disruptions.
The main issues covered are those events that have been caused either by well
documented natural or man-made disasters or events that have occurred internally
within a manufacturing plant, for example, events that resulted in large scale
organisational disruption such as fire, equipment failure or industrial accidents and
natural disasters (e.g. Donaldson, 2001; Norrman and Jansson, 2004; Natarajarathinam
et al., 2009; Ergun et al., 2010; Hammond, 2013; Elahi et al., 2014; Morrice et al.,
2016). A notable consequence of having dramatic and often catastrophic events being
publicised in the media and popular press is that organisations are now explicitly aware
that these events can and do happen (Bode et al., 2011). One such incident that has been
discussed in the literature refers to events that affected the mobile phone giant Ericsson
in the early noughties after a fairly innocuous fire at one of their sub- tier suppliers. The
incident, despite being described in the literature as a relatively inauspicious one, cost
Ericsson a reported $11bn to $21bn in lost sales due to the fact that production had to
stop because of the lack of an alternative source (Norrman and Jansson, 2004). At that
time, it was identified that Ericsson neither had alternative sources nor was prepared
for the kind of incident that occurred (Sheffi and Rice, 2004). Ericsson were publicly
criticized for the way they handled the aftermath (Marley et al., 2014). The disruption
caused by the fire led Ericsson to re-evaluate its entire philosophy on risk and
contingency management. The more general supply chain management research
19 | P a g e
literature and that focusing on supply chain risk and contingency management clearly
acknowledge that supply chain failures occur but do not discuss or address issues
related to persistent supply chain failure.
2.3 Supply Chain Quality Management.
An area of the literature that is related to the study of persistent supply chain failure
focuses on understanding whether stringent approaches to quality management within
a buying organisation can lead to improved supply chain performance (e.g. Power and
Terziovski, 2007; Yeung, 2008; Basu, 2014; Quang et al., 2016). A second area focuses
on how quality management practices affect risk in the supply chain (e.g., Clemons and
Slotnick 2016) and a third examines quality management practices adopted by buying
organisations including evaluations of the overall effectiveness of quality management
within the supply chain (e.g. Foster 2008; Zu et al., 2008; Han et al., 2011; Kim et al.,
2012; Zhang et al., 2012 and Barouch and Ponsignon 2016).
The literature has sought to obtain insights into the effectiveness of quality
management with studies that examine how quality management practices affect supply
chain performance (e.g. Kuei et al., 2001; Flynn and Flynn, 2005; Soltani et al., 2011
and Narasimhan and Schoenherr, 2012). The literature describes how a method for
improving quality management performance begins with rigorous supplier selection
activities (Ramudhin et al., 2008). Organisations should measure competing suppliers
on the basis of product quality, delivery lead times and price (Ekici, 2013). There is
also recognition that achieving improvements in quality performance throughout the
supply chain is resource intensive and time consuming for all organisations, hence the
extensive literature and studies on supplier selection processes (González et al., 2004).
However, it has been noted that due to complexity and diversity of the real world, a
methodological framework for operating an effective supplier selection model had yet
to be developed (Chai et al., 2013).
Improvement of quality management adherence throughout all supply chain
processes leads to cost reduction, improves resource utilisation and increases process
efficiency (Fernandes et al., 2017). Studies have been conducted in order to identify the
costs of quality that supply chain organisations have to absorb in order to improve
quality (Wee and Wu, 2009). The literature highlights how buying organisations
succeed when they are able to reduce the costs of quality and as a consequence,
disruption (Elahi et al., 2014). Ramudhin et al., (2008) developed a model that sought

20 | P a g e
to calculate all of the costs attributed to improving quality in supply chain network
design. They found that their model was able to identify suppliers with high cost of
quality implications for buying firms. Reducing additional costs of quality failures
helps significantly to increase performance and with it profit margin (Ramudhin et al.,
2008). Attempting to reduce the cost of quality leads companies into further developing
quality processes and procedures that improve quality performance throughout the
supply chain.
The literature highlights the importance of supply chain participants adopting
the quality management processes and procedures of hi-tech complex manufacturing
organisations (Fernandes et al., 2017). Research has also identified that collaborative
relationships between buyer and suppliers are key to ensuring adequate supply chain
performance from outsourced systems and components (Quang et al., 2016). The
literature challenges the notion that the existence of a well-established quality control
certification held by a prospective first tier supplier guarantees that the supplier has
control over their processes and procedures. Studies suggest that it is often the case that
they do not (Diaye et al., 2014). To reduce the risk of supply chain management failure,
ISO 9000 4certification is a requirement within the sourcing process for many
organisations throughout many industries (specifically AS9100 for the aerospace
sector5). A study by Yeung (2008) found that while ISO 9000 serves as a foundation in
purchasing management as a minimum quality level standard, it does not necessarily
reduce the risk of failure or support strategic supply management, which he found to be
a fundamental element of improving performance and reducing the cost of quality.
However, later research conducted by Diaye et al., (2014) highlighted how the existence
of ISO certifications within the supply chain can improve performance, even with
suppliers who do not possess the certification but interact closely with suppliers who
do (Diaye et al., 2014 p. 5409).
The literature investigates how buying organisations monitor adherence to
quality management systems within supply chains. Research has found that buying
organisations are conducting ever more onerous capability audits in order to reduce the
risk of failure. The success of a capability audit often depends on how it is conducted
and what is uncovered (Salama et al., 2009). The aim is to not simply improve quality
4 ISO 9000 – International Standard for Quality Management Systems. 5 AS9100 – The aerospace industry version of the ISO quality process standard.

21 | P a g e
adherence of the supplier, which is a cost to the buying organisation (Tse and Tan,
2012), but to ensure that such improvements are self-perpetuating and sustainable over
time (Sancha et al., 2015). Power and Terziovski (2007) conducted research that looks
at how organisations have increasingly started to carry out audits that look to gauge the
effectiveness of quality management systems within manufacturing organisations. Part
of their research expands on this notion by identifying the perceptions that clients have
on the way auditors conduct their work. Buying organisations deploy auditors to
conduct assessments aimed at monitoring compliance and look to evaluate the
operational capability of their suppliers. The buying organisation seeks to quantify the
level of risk posed by the supplier to judge if capability in the supply chain matches
their or the end customer’s requirements (Yim, 2014). If potential issues are not
identified then the risk of failure is likely to increase, resulting in repeat audits later on.
To add value, audits need to be capturing key issues at an early stage, otherwise the
chances of failure are increased. Buying organisations want to ensure that suppliers do
not pose a risk to continuity of supply and potentially cause disruption to the wider
organisation (Chopra and Sodhi, 2004). The auditor is requested to examine a supplier’s
compliance to the company’s own quality management system and ensure that they also
fulfil industry requirements. It is therefore no surprise that Power and Terziovski (2007)
found that companies felt they were being audited for compliance rather than for
continuous improvement opportunities. Their findings suggest that, in general, auditors
believe they are promoting continuous improvement methodologies at the organisations
they are auditing and are contributing to improved performance.
Quang et al., (2016) conducted a recent study of the empirical literature that
sought to identify correlations between quality management initiatives led by the
buying organisation and improvements in supply chain management performance.
They found that such research was still limited. Flynn and Flynn (2005) is one of the
studies that specifically looks at whether the existence of a quality management
function within an organisation improves supply chain management performance. They
identify how organisations have a symbiotic relationship with their supply chain that
recognises that each contributes to the others success, describing this as the ‘Horizontal
Effect’, which is encouraged by the adoption of quality management practices (Flynn
and Flynn 2005 p.3434).

22 | P a g e
Morrison (2015) investigated the effect of ‘workarounds’ carried out by
organisations to limit disruption caused by product quality issues. These are short term
‘quick fixes’ conducted by manufacturers to essentially circumvent their own quality
management systems in order to resolve problems more expediently (Morrison, 2015).
This could happen due to a lack of available resources needed to quickly mitigate
failures. Some research attempts to rationalise the causes of such failures (Tse and Tan,
2012). An earlier study conducted by Repenning and Sterman (2001) found that despite
a number of tools and techniques widely available to organisations giving guidance on
how to improve product quality there had been little improvement in the ability of
organisations to incorporate these innovations into their daily activities (Repenning and
Sterman 2001).
Although the supply chain quality literature is substantial, the issue of persistent
supply chain failure has not been addressed either explicitly or implicitly.
2.4 Power, Leverage and Dependency in the Supply Chain. The concept of ‘Power’ has been described as ‘Bargaining Power’ or ‘Power
Asymmetry’ in studies regarding its effects on relationships in a supply chain and its
impact on supply chain performance (e.g. Cox et al., 2001; Crook and Combs, 2007;
Sheu and Gao, 2014). Leverage has been described as ‘using what you have for
maximum advantage’ and is commonly associated with the identification of supplier
positioning in a buyer supplier relationship with respect to how important one party is
to the other in terms of turnover or spend (Cox et al., 2004 p.347). Dependency, or
‘interdependency’ as it is often described in the literature, is seen as the level of reliance
that two parties have on each other in order to survive (Krause and Ellram, 2014). The
literature also describes ‘lock in’ situations, which refer to instances where one party is
very heavily dependent on the other (Narasimhan et al., 2009).
There is much debate about the best way for buyers to manage business
relationships with suppliers (Cox, 2004). Approaches that seek to explain how the
concept of power influences one party in the buyer / supplier relationship over the other
is discussed in the literature. The power perspective focuses on how competence in
procurement and supply management must start from an understanding of the bases of
supplier power and business strategy (Cox 2001). Cox et al., (2001) define how four
basic dyadic structures form a power matrix, which are: (i) buyer dominance, (ii)
supplier dominance, (iii) buyer-supplier interdependence, and (v) buyer-supplier

23 | P a g e
independence. These are intended to help buyers identify the type of relationship most
likely to develop and form the backbone of the power perspective (Cox, 2001). Later
work by Cox et al., (2004) looks beyond the original contribution made with the power
matrix and considers the interactions within an extended network of business
relationships. This is referred to as a power regime (Cox, 2004). Power regimes are
composed of a number of interlocking, but discrete, management sub-regimes.
Identifying how to manage the buyer / supplier relationships appropriately through the
identification of relationship power regimes may be cyclical with changing market
trends.
As the purchasing business function has developed and grown in strategic
significance and understanding, further questions have been asked about which party
appropriates the most value out of a relationship. This is an area where buyers from
large organisations may become unstuck and where the power regime may begin to
shift from the buyer to the supplier, thus potentially causing higher costs and lower
performance in the future (Forslund and Jonsson, 2009). There is an acknowledgement
by Cox (2004 p.346) in the literature that: “Buyers need a guide to action when they
confront the universe of real world circumstances that can occur when managing
supply and suppliers. This is what is meant by ‘appropriateness’ or the art of the
possible”.
Identification needs to be made of the relationship with the supplier and how
they view the buyer in their plans strategically in the future (Meehan and Wright, 2012).
From this starting point it is possible to explain why it is only by analysing supply chain
networks (and the power regimes operating within) that buyers can fully understand the
relationship management choices available to them, and make appropriate choices
between alternatives should the need arise (Cox et al., 2004). The literature also
suggests that managing power regimes appropriately requires buyers to consistently
monitor the relationship between themselves and the supplier, especially in times when
organisations want to limit the cost of a relationship (Acharyulu, 2012). For a buyer to
develop a successful relationship with a supplier, the buyer has to decide the most
appropriate way to manage commercial transactions with suppliers (Crook and Combs,
2006). Best practice rejects the historic focus on adversarial buyer relationships with
suppliers in favour of a long-term collaborative approach based on trust and partnership
/ alliances (Nyaga et al., 2013).
24 | P a g e
At the opposite end of the relationship management spectrum is the
International Marketing and Purchasing Project (2004) championed by Håkansson
since 1982. They focus on how four elements: products, services, money and society
form the basis of a clear set of roles and responsibilities that the buyer and the supplier
need to carry out (Metcalf et al., 1990). Their studies are also widely referenced in the
literature on power with regard to the importance of evolved relationships (Håkansson
and Ford, 2004). They emphasise the notion that many approaches to understanding
and managing business relationships are based on the false idea that relationships are
some kind of management technique that can be employed by managers at their
discretion (Håkansson and Ford, 2004 p.248). It is formulated on the notion that the
business world is viewed as an atomistic structure of independent actors within markets
(Håkansson and Ford, 2004 p.249). The research suggests that business relationships
are instead an inevitable outcome from the nature of business and hence beyond the
complete control of either participating company (Vaaland and Håkansson, 2003). This
is a contrasting perspective to the work by Cox et al., (2004) who believe that supplier
relationships are based on leverage, alignment, and organisational positioning, factors
which can be manufactured or created whereas Håkansson’s research suggest that the
relationships in supply networks are far more naturally formed. A more recent study by
Hou et al., (2016) sought to examine how organisations react when exposed to different
power positions. They found that buyers or customers who are perceived as exploitative
and use coercive power can harm relationships and prompt suppliers to use protective
behaviour against them.
Research on the subject of power often leads to the conclusion that whoever
holds the leverage in a relationship then has an advantage in the relationship (Bastl et
al., 2013 p.9). During difficult circumstances, if a buyer does not hold leverage with a
supplier and the interaction becomes negative for the buyer, they will seek to end the
relationship and go elsewhere if possible (Benton and Maloni, 2005). However, there
are circumstances where the buyer does not have this option for many reasons such as
a lack of substitute products and / or limited suppliers within the supply chain (Wallace
and Choi, 2011). Historically, a common method of identifying market leverage used
by practitioners is carried out by analysing market position using the Kraljic matrix
(Kraljic, 1983). For example it would seem logical that a dominant buying organisation
would have an advantage over a smaller supplier and would hold a good degree of

25 | P a g e
leverage (Handley and Benton, 2012) because of the potential size of the business they
could offer. However, the smaller first tier supplier could be the sole manufacturer and
/ or hold intellectual property rights for a key component in the buying organisation’s
product. The buying organisation may be the only customer for that product (Kähkönen,
2014); therefore they are equally reliant on each other.
Understanding the buyer–supplier relationship is essential in understanding the
exchange relationship from a strategic perspective (Møller et al., 2002). Buyers need to
understand the circumstance they are in and what scope exists for them to augment their
power relative to that of suppliers. Mechanisms of interdependencies that exist within
supply chain relationships are important in identifying the potential effects of a
misaligned relationship when one player is heavily more dependent on the other
(Narasimhan et al., 2009; Lacoste and Johnson, 2015). By investigating social exchange
theory, Narasimham et al., (2009) identified how dependencies can develop within
supply chain relationships and one party can become essentially locked into the
relationship. This can affect performance and relationships in the event that the buyer
does not have the opportunity to resolve the problems quickly due to limited options in
the supply chain. If a buying organisation finds itself in this position then over time
they can become overly dependent on their supplier (Crook and Combs, 2006).
However, it has been found that paradigms of power do exist between suppliers and
buying organisations that have an effect on value in the supply chain (Kähkönen et al.,
2015). The supplier could be strategically aligned to another customer or competitor
where they are consistently the high performing supplier (Pulles et al., 2016). Although
the power, leverage and dependency literatures do not address the issue of persistent
supply chain failure directly, they do give pointers to important factors that affect the
nature of supply chain relationships and may therefore help to illuminate the causes of
the phenomenon.
2.5 Supplier Development. Supplier Development has been defined by Krause and Ellram (1997 p.39) as: “Any
effort of a buying firm with a supplier to increase its performance and / or capabilities
and meet the buying firm’s short and / or long-term supply needs”. Supplier
development has been described within the literature as a method adopted by buying
organisations for improving supplier performance (Wen–Li et al., 2003).

26 | P a g e
The study of supplier development utilises many different methodologies,
including exploratory empirical studies and multiple case studies conducted at many
different organisations throughout the world (Sánchez-Rodríguez et al., 2005). Much
of the literature aims to understand how organisations adopt such methods by
implementing initiatives with the intention of improving performance (e.g. Wen – Li et
al., 2003; Humphreys et al., 2004; Wagner, 2006; Sánchez-Rodríguez et al., 2005;
Krause et al., 2007; Carr and Keynak, 2007; Routroy and Pradham, 2011). The literature
provides key insights into the activities that organisations carry out to achieve improved
performance through supplier development. The findings highlight how factors such as
senior management involvement and alignment of strategic goals between the buyer
and suppliers are frequently reasons underpinning successful supplier development
initiatives leading to improved performance (Humphreys, et al., 2004). Identification
of the critical success factors help buyers to develop competitive advantage within the
supply chain (Routroy and Pradham, 2013). The literature also suggests that
improvement initiatives are most successful when the business relationship between the
buyer and supplier is mature and suppliers can obtain preferred status (Negati and
Robelledo, 2013). Wagner (2010) examines the effect of social capital theory on the
success of supplier development initiatives, finding that successfully deployed
initiatives occur when the buying organisation is willing to invest in long term
relationships. He also found that this has a positive effect on the outcome of a supplier
development initiative and its effect on the supply chain performance. By persevering
with initiatives, buying organisations are much more likely to experience an
improvement in supply chain performance over the long term (Williams, 2007).
Arroyo-López et al., (2012) identified that a major issue with supplier development
initiatives is the tendency for buying organisations to abandon them far too early in the
process if implementations do not result in an immediate improvement. Their research
also identified how initiatives that take longer to complete may prove to be less
successful (Arroyo-López et al., 2012). This is dependent on whether the initiatives
have been intentionally implemented to mitigate against short term failure rather than
to improve strategic suppliers over a longer period of time (Watts and Hahn 1993;
Krause and Ellram, 1997).
Studies seek to examine how supplier development is carried out operationally
by buying organisations and highlights the conditions that motivate organisations to

27 | P a g e
implement improvement initiatives (e.g. Krause et al., 1997; Chan and Kumar, 2005
and Friedl and Wagner, 2012). Further studies seek to understand why supplier
development initiatives are implemented by the buying organisation. The literature
examines the causality of the implementations and provides an examination of whether
the outcome of initiatives do actually result in increased sustainable performance over
time (e.g. Wagner, 2011 p.277; Busse et al., 2016). Sánchez-Rodríguez et al, (2005)
found that the implementation of improvement initiatives can help to predict purchasing
performance. The aim of their research was to help buying organisations utilize supplier
development initiatives in order to identify target suppliers versus those to eliminate.
They found that suppliers who are less likely to improve after the introduction of
development initiatives are those which could be considered for elimination (Sánchez-
Rodríguez et al., 2005). Friedl and Wagner (2012) also conducted research that sought
to identify which suppliers the buying organisations should choose to develop versus
those suppliers that need to be switched. However, they found that the conditions of the
supply chain could be improved if the buyer organisation chooses to develop the
supplier when the switching costs are high instead of finding a new supplier each time.
There is recognition within the supplier development literature, that suppliers
play a crucial role in the success and continuity of a relationship between the buyer and
the seller (e.g. Williams, 2007; Mortensen and Arlbjørn, 2012 and Pulles et al., 2016).
Wagner (2006 p.554) contends that: “To compete and survive in industries where
capable suppliers are limited to only a few, firms must seek, build up and maintain
relationships with capable suppliers and extract the maximum value through such
relationships”. Organisations that supply to these types of industries come in all shapes
and sizes. A large proportion of suppliers may be far smaller than the organisations they
are supplying but they protect themselves because they own intellectual property rights
for components or specific processes (Williams, 2007). According to Krause and
Ellram (1996 p.39), Supplier Development can be seen as being important to
organisations due to the fact that: “In order to compete in their respective markets,
buying firms must ensure that suppliers’ performance, capabilities and responsiveness
equals, or surpasses that experienced by the buying firm’s competitors”.
The literature on supplier development includes case studies conducted by
Wagner (2006) that investigates a variety of manufacturing industries in Germany. The
literature also incorporates further studies that examine large multinational

28 | P a g e
manufacturers, some of which have a reputation for embracing a culture of continuous
improvement such as Toyota and Honda (e.g. Govindan et al., 2010; Marksberry,
2012). In a situation where a supplier happens to be a larger organisation than the
customer, it can be an extremely difficult endeavour for a buying organisation to try
and develop the supplier in areas such as quality, delivery and cost or conduct training
(Mortensen and Albjørn, 2012). This might be because the supplier is strategically
aligned to another industry or a larger competitor within the market. Linkages between
supplier development success, improved performance and supplier relationships in
terms of relationship length are a further sub category of the research on supplier
development (e.g. Wagner, 2006; Wagner and Krause, 2009 and Wagner, 2010). These
studies have all identified that supplier development initiatives perpetrated by the
buying organisation are all necessary to improve supply chain performance and reduce
risk of failure from occurring in the future. The research has shown that closer
collaborative causal relationships between buyers and suppliers is key to ensuring the
success of supplier development initiatives (Busse et al., 2016). Although not dealing
directly with persistent supplier failure, the supplier development literature does
acknowledge that a supplier may need to develop and improve its capabilities. There
are various studies that provide rich evidence and insights on when this is needed and
the likelihood of success.
2.6 Performance Management in the Supply Chain. Due to the added attention given to it by practitioners, there is a considerable amount
of research conducted on performance management activities within the supply chain
between the buying organisation and its suppliers (Thorpe and Beasley, 2004). The
empirical literature examines the effects of performance management processes and
procedures across many industries. As such, performance management is considered
one of the key literature domains in the study on supply chain failure. This is because
performance management is the principal method used by buying organisations and
their suppliers to gain the necessary visibility required to understand the performance
gap between agreed service levels, current performance and best practice (Choy et al.,
2007). The literature identifies how buying organisations often have multiple systems
and mechanisms in place to highlight issues that suppliers may exhibit that could cause
disruption for the buying firm. Performance management processes and procedures are
meant to act as early warning systems and provide buyers with visibility on how

29 | P a g e
suppliers are performing versus agreed metrics (De–Waal and Counet, 2009). Aside
from acting as a mechanism for ensuring agreed performance is maintained,
performance management topics cover a wide spectrum of industrial scenarios. Some
literature seeks to identify how processes and procedures carried out by buying
organisations have an effect on the performance of their suppliers and if it assists key
suppliers to improve performance (Schaltegger and Burritt, 2014). More commonly,
studies provide a description of the systems being used by organisations to manage
performance either internally or throughout the supply chain (Merschmann and
Thonemann, 2011).
A key part of the literature concerns studies that highlight potential gaps in the
effectiveness of performance management systems, which represent the most risk to
the buying organisation (Koufteros et al., 2014). Such systems need to provide
organisations with an appropriate level of operational visibility enabling greater
collaboration between the buyer and supplier. Greater visibility and understanding of
how a supplier is performing is a fundamental factor for the development of good
commercial relationships between organisations within the supply chain (Corsten et al.,
2011). Benchmarking studies of organisations considered to be world class
manufacturers have found evidence that the implementation of performance measures
and systems throughout the supply chain facilitates greater visibility for buying
organisations (e.g. Lockamy and Spencer, 1998; Maestrini et al., 2017). Should
managers at the buying organisation not be provided with accurate information, their
ability to align actual supply chain performance with agreed performance levels is
reduced (Pongatichat and Johnson, 2008). The resulting effect can cause negative
metrics to be displayed against suppliers. Another negative effect of disparities between
information being received by buying organisations could be that the picture presented
of performance is not representative of actual reality (McAdam et al., 2008). Misaligned
performance management systems that fail to provide managers with a true reflection
of reality can be very disruptive to the supply chain and can result in buying
organisations placing unnecessary resources and focus on the supplier. Alternatively,
insufficient focus may be placed on a supplier (Meng, 2012). Either way, there is a risk
that long term damage or disruption could be caused to the buying organisation and the
associated supplier (Koufteros et al., 2014).

30 | P a g e
It is important to make the distinction between performance management and
performance measurement as the two subjects, although related, do not necessarily
address the same things. McAdam et al, (2008) identified the need for more studies that
would attempt to measure and benchmark activities or practices upstream within the
supply chain. Considerable attention is given in the literature to defining Performance
Metrics, commonly referred to as Performance Measurement (e.g. Cook and Hagey,
2003; Koufteros et al., 2014 and Laihonen and Pekkola 2016).
Literature on performance measurement primarily consists of five activities;
selecting performance variables, defining metrics, setting targets, measuring and
analysing performance (Forslund, 2014). Managers at buying organisations require the
flexibility that real-time information can provide in order to ensure that supply chain
performance does not fall below agreed limits. Laihonen and Pekkola (2016) conducted
a study that sought to identify whether a new type of performance measurement system
that focuses on knowledge transfer throughout the supply chain could add value and
lead to improved performance. They found improved supply chain performance
measurement could be achieved through shared learning combined with knowledge
transfer.
A recognised and frequently practiced application of a performance
measurement system adopted by many organisations is that of the balanced scorecard
(Kaplan and Norton, 1996). The methodology involves a multitude of measures and
metrics that seek to show managers how the organisation and its supply chain are
performing. The usefulness of a balanced scorecard is judged on the expediency and
accuracy of available data (Barnabe, 2011). However, for some, this has represented a
massive undertaking based on the size of the organisation and the sheer diversity of
metrics and measures being analysed. Negative consequences of an underdeveloped
performance measurement system include buyers spending too much time reporting
issues rather than managing resolutions (Germain et al., 2008). The resultant time
delays can force the buying organisation into becoming reactive (Barnabe 2011, p.453).
The effect of outsourcing activities on firm performance is also an element of
performance management research that has received some attention (Kroes and Ghosh,
2010). Lahiri (2016) conducted empirical research by investigating articles that directly
discuss outsourcing activities conducted by firms over a twenty year period. The study
found that the effects of outsourcing on firm performance were inconclusive with some

31 | P a g e
reporting positive, others negative, and some mixed results. This is important because
outsourcing non-core activities is an established practice throughout many different
industries in order to reduce costs and is often considered an important strategy to
ensure improved performance (Prahalad, 1993). However, alternative research findings
are now revealing a contradictory perspective on the long term success of outsourcing
strategies. It has been recognised that outsourcing components into the supply chain
can increase the risk of a failure occurring (Demeter, 2014). Outsourcing strategies have
now moved beyond simply non-core and non-value added activities and has moved into
key components and services (Corsten et al., 2011). Although the performance
management and measurement literature is wide and varied, the issue of persistent
supply chain failure has not been addressed.
2.7 Relationship Management in the Supply Chain. The subject of relationship management consists of research with a high level of
diversity (Lettice et al., 2010). Studies that are related to the topic of persistent supply
chain failure range from how relationship management influences performance (e.g.
Møller et al., 2003; Forslund and Jonsson 2009; Cadden et al., 2010; Lui et al., 2012;
Lambert and Shwieterman, 2012; Forslund 2014 and Zou et al., 2014), to research on
how organisations interact with each other to gain advantages in the market (e.g. Choi
et al., 2002; Hornibrook et al., 2009; Singh and Power, 2009; Zhang et al., 2009;
Knoppen et al., 2010 and Rebolledo and Nollet, 2011). Many supply chain management
topics have links with relationship management issues that occur between buyer and
supplier (Fynes et al., 2008). Observations from the literature suggest that the
performance levels of the supplier are to some extent characterised by the type of
relationship that exists between the buyer and supplier (Lee and Johnson, 2012).
Studies that seek to understand how relationship management affects
performance typically analyse the factors, processes and strategies that generate mutual
successes in the industry (Cadden et al., 2010). These are reported as ‘win–win’
collaborations that exhibit the alignment of organisational goals, cultural fit, embedding
information systems and resources into both parties’ organisations (Wilding and
Humpries, 2006). This aspect of the literature tends to be descriptive, focusing on ‘how’
and ‘why’ relationships work effectively between two companies. In this type of
scenario, Forslund and Jonsson (2009), highlighted how suppliers can become
complacent over time if they begin redirecting efforts towards new and more lucrative

32 | P a g e
commercial opportunities. This can become a significant issue for the buyer as
described later by Forslund (2014), who subsequently found a correlation with the type
of relationship between buyers and suppliers and logistics (delivery) performance.
Overall, she found that positive performance can depend on a good relationship (Teller
et al., 2016) although there is contradictory research suggesting that placing too much
emphasis on supplier relationships can lead to buying organisations wasting time, effort
and resources that result in a reduced performance if not managed correctly (Zhang et
al., 2009).
Studies have shown that despite the advances in information technology and
supply chain visibility, key interactions between organisations within the supply chain
are still managed by employees; therefore relationship management issues remain
significant (e.g. Ik–Whan et al., 2005; Roh et al., 2008 and Williams et al., 2013).
Williams et al., (2013) found that a higher level of supply chain visibility does not
necessarily improve responsiveness or the quality of information. Instead they found
that greater integration between buyers and suppliers was more likely to improve
relationships and increase responsiveness (Williams et al., 2013). The main focus is on
identifying how communication influences information flows and improves visibility
through increased leverage and responsiveness (Williams et al., 2013). In fact the
significance of the Williams et al., (2013) study can be extended throughout the supply
chain. It has been identified that improved cooperation and information transparency
can result in increased supply chain performance (Wadhwa et al., 2010). Jacobs et al.,
(2016) in a study that incorporated survey results from 214 China-based manufacturing
companies, observed how positively perceived internal communication within the
organisation actually facilitated positive communication with suppliers.
Trust has been defined as the belief that another company will perform actions
that will result in positive outcomes for the buying firm as well as not take unexpected
actions that will result in negative outcomes (Anderson and Narus, 1990). The presence
of trust between buyer and supplier plays an important role in strategic relationships
resulting in improved supply chain performance (Terpend and Ashenbaum, 2012).
When trust is absent, one of the parties may be reluctant to share information or feel
less motivated to learn about how to work with the other party (Fynes et al., 2008). A
topic discussed in other literature domains suggests that the development of trust is an
important relationship management strategy (Ik-Whan et al., 2005). In the situation that

33 | P a g e
a supplier and its customers do not trust each other, then it is unlikely that they will be
willing to share key information or communicate effectively (Lui et al., 2012). If such
events do occur, organisations struggle to align their organisational goals and systems
effectively, potentially leading to supply chain failure. Following a study conducted on
101 captive suppliers in the aviation industry, Clauss and Speith (2016) found that
strategic alignment and effective governance, has a positive effect on buyer and supplier
performance. The literature investigates how suppliers can form relationships with
other suppliers, which then has an effect on the buyer supplier relationship if used to
the suppliers’ advantage (Choi et al., 2002). This does to some extent drive the way in
which buying organisations communicate with, and manage relationships with the
external supply chain (Møller et al., 2003).
Further examination of the literature describes a concept defined as supplier de–
selection or dissolution. The term ‘dissolution’ has been defined as: “The act of
formally ending or dismissing an assembly, partnership, or official body: ‘The
dissolution of the marriage’ (Oxford English Dictionary, 2016)”. Chen et al., (2013)
have described dissolution metaphorically as when buyer and supplier get ‘divorced’,
ending their established relationship. Significantly, dissolution could be considered
during the next stage in the process after supply chain failure has occurred. This
literature is related to the considerable amount of research carried out on understanding
the ease of moving from one supplier to another once a relationship has reached its
conclusion and the effect this has on buyer-supplier power (e.g. Kraljic, 1983; Cox,
1999; Gelderman and Weele, 2003; Grundy 2006). Research on dissolution, however,
is probably less frequent due to the emotive subject of failure. It is far more difficult for
would-be researchers to find participants willing to divulge such sensitive information
(Ellegaard and Anderson, 2015). When prime manufacturers experience failing
performance, they are faced with the choice to either commit resources to resolve
problems with suppliers or to end the relationship and place resources into developing
new supply chains (Krause et al., 1998). The ability to switch suppliers expediently is
dependent on a number of factors because not all industries have an abundance of
substitute suppliers (Gelderman and Weele, 2005). In these circumstances, sometimes
the only option buying organisations may have is to develop existing suppliers and
attempt to fix problems. It is in these situations that supplier positioning and power
dominance can have an effect on the buyer (Cox, 2004). The risk to the buying

34 | P a g e
organisation is perpetuated when the supplier is one of only a handful of sources able
to supply the product.
The body of literature that exists on this topic shows that relationships between
buyer and suppliers can be dynamic and may be temporary, resulting in strategies aimed
at dissolving partnerships (Krause and Ellram, 2014 pp.206). The literature investigates
what has been described as the ‘dark side’ of buyer-supplier relationships (Villena et
al., 2011). This hints at a plethora of reasons why relationships fail including a lack of
adequate information being provided throughout the supply chain through to weak
communication or participants who do not wish to alter behaviour irrespective of the
need to do so because of changing conditions (Wagner and Krause, 2009). Changing
economic conditions is viewed as a cause for a strategic rethink that may require
relationship dynamics to change also (Autry and Golicic, 2010). Added to this, the
power dynamic between buyer and supplier shows that supply chain relationships and
/ partnerships do not always align on all issues (Gelderman and Weele, 2005). Key work
into this subject area shows that relationship management and in particular traditional
methods of communication such as talking on the telephone rather than modern
methods such as email, can have a critical bearing on how relationships play out (Carr
and Kaynak, 2007).
Managers have been actively encouraged to create more competition and
position themselves against suppliers and competitors (Crook and Combs, 2007). The
result is that organisations tend to now have a blend of suppliers from which they single
source or have too many suppliers, often described as tail spend6. In these cases they
may be looking to end relationships in order to consolidate and cut down on resource
costs (Krause and Ellram, 2014). Another dynamic comes when relationship
breakdown is caused by cost or perceived un-competitiveness on the part of the buyer.
Alert suppliers will be aware of their position in the market and may position
themselves in an area of strength so that the buyer simply cannot move supply quickly
(Kähkönen, 2014). Seeking to place themselves into a position of strength for
competitive advantage is utilised by every supplier to some extent (Lacoste and
Johnson, 2015). Although not dealing directly with persistent supply chain failure, the
6 Tail Spend – Multiple supplier’s with limited supply of parts and low spend. These suppliers
represent a variable cost to the buyer.
35 | P a g e
performance management and relationship management literatures potentially provide
insights on many aspects of the topic.
2.8 Project and Program Management. In conducting the review of the contemporary literature, a body of project management
literature was identified that examines key characteristics of project management
failures (e.g. Lindahl and Rehn, 2007; Sanderson 2012). The basic literature typically
defines project failures as ‘failure to achieve cost, time and quality targets’ (Sage et al.,
2014). Project management failures frequently concern project planning where project
timelines are significantly underestimated (Sage et al., 2014). A further common project
management failure is the inability to satisfy key stakeholders (Sutterfield et al., 2006).
Such failures may occur when project managers fail to manage key project stakeholders
because of ineffective communication skills (Sanderson 2012).
There are similarities between project planning and aspects of manufacturing
planning. In a construction project for example, demand may be fixed but the project
can still experience changing requirements from the customer (Germain et al., 2008).
Similarly, in manufacturing, especially project-based manufacturing, demand
requirements change because of uncertain customer requirements at the outset and / or
production re-schedules. The importance of effective planning in both disciplines is
critical to successful delivery (Turner and Zolin, 2012 p.95). Further to these
observations, ambiguous business needs and unclear vision have also been highlighted
as causes of project management failure (Yeo, 2002). A further link between project
management and manufacturing failures is the issue of poor or inadequate definitions
of requirements and scope (Yeo, 2002 p.245). If the requirements are not fit for purpose
in the first instance then problems with quality, time delays, and costs are likely to occur
and potentially reoccur later.
Unsurprisingly, projects of any kind may be accompanied with significant
elements of risk (Aritua et al., 2011). A major topic in the project management literature
is its relationship with risk management (e.g. Raz and Michael, 2001; Aritua et al.,
2011; Sanderson, 2012). Research studies have aimed to understand how risks are
identified, managed and mitigated in large scale projects. All potential risks should be
examined in order to identify potential causes leading to future project management
failure such as pressure to reduce time and cost whilst simultaneously improving quality
(Cagliano et al., 2012). These pressures also occur in manufacturing and often

36 | P a g e
determine the competitiveness of organisations in their respective markets (Zwikael and
Smyrk, 2015). An analysis of the project management literature in relation to the supply
chain management risk literature, shows that major project management failures can
also be attributed, at least to some extent, to inadequate risk analysis and incorrect
assumptions regarding risk analysis (Haji-Kazemi et al., 2013). Managing key project
stakeholders effectively is viewed in the literature on project management risk as
critical to the success of a project (Dainty et al., 2002).
An early study conducted by Elonen and Artto (2003) at two organisations in
Finland found that special tasks requiring urgent attention on a project such as
identifying and recovering from a serious failure are often given to an existing member
of staff rather than employing a project manager (Elonen and Artto, 2003). From this
point onwards they will adopt a ‘pseudo role’ similar to that of a project manager and
are expected to deliver the project on behalf of the organisation as well as their normal
role (Engwall and Jerbrant, 2003). The literature suggests the practice of organisations
delegating key projects to existing members of staff rather than appointing professional
project managers is not uncommon. Organisations often favour appointments from
within to remedy a failure (Van de Merwe, 1997). As a result of selected individuals
conducting such work in addition to their normal jobs, the capability and capacity to
identify and resolve the root cause of a problem may be diminished. A very early study
by Avots (1969) found that personnel picked to lead projects within an organisation are
often not paid any more than their normal package for conducting project work. Avots
(1969) suggested this was one reason why projects failed. It was later observed that
should a project succeed then the reward will be either a promotion or more money but
this is never guaranteed (Turner and Mueller, 2003).
The project management literature also contains studies that focus on how
System Dynamics can be used to identify and illustrate characteristics of project failure
and can be used to help project managers to learn from project mistakes (e.g. Rodrigues
and Bowers, 1996; Chapman 1998; Lyneis and Ford 2007; Boateng et al., 2012; Wang
et al., 2017). Project management researchers have been utilising System Dynamics
methodologies to illustrate research findings in relation to feedback from practitioners
over a number of years (Lyneis and Ford, 2007). Systems Dynamics has been used by
project management researchers specifically to identify and understand common areas
of failure within a project. These include identifying resource bottlenecks and where

37 | P a g e
issues have occurred or could occur in the future (Snyder and Cox, 1985). Research has
highlighted conceptual frameworks using simulations and the causes and effects of
failures determined through empirical studies (Rodrigues and Bowers, 1996).
2.9 System Dynamics.
System Dynamics and System Thinking was developed in the 1950’s as a result of work
first carried out by J. W Forrester who began using computer-aided models to simulate
cause and effect systems within supply chains. The field of research was initially known
as Industrial Dynamics (Angerhofer and Angelides 2000). The research highlighted
effects such as feedback, time delays and oscillatory behaviour within supply chains.
Forrester devised a simulation called the ‘Beer Game’, which he used to demonstrate
these effects on supply chains. The game simulates a typical supply chain (Sterman
2005) and demonstrates to the players how unstable supply chains can be despite
complete visibility by all of the participants of what is going on during the game. The
game demonstrates how the participants often fail to comprehend time delays leading
to stock outs in parts of the supply chain and excess inventory in others, thus increasing
costs and lead times despite a constantly stable demand flow from the customer. The
game is used to highlight the ‘bullwhip effect’ (Lee et al., 1997), which is the effect of
demand signal distortion and the instability it causes throughout the supply chain
(Sterman 2005).
System Dynamics has been extensively used to model supply chains (e.g.
Forrester 1961; Morecroft, 1985; Lee et al., 1997; Akkermans et al., 1999; Sterman
2000; Anderson et al., 2000; Dogan and Sterman 2005). The research covers a range of
studies that seek to contribute to theory building to solve supply chain problems, as well
as work to improve the modelling approach (Angerhofer and Angelides 2000).
Research by Akkermans et al., (1999) using Systems Dynamics helps to inform the
study on persistent supply chain failure because it investigates how and why attempts
at achieving effective supply chain management can be so difficult and fraught with
challenges. Through the development of causal loop diagrams they investigate the
underlying mechanisms that result in vicious cycles for some companies and virtuous
for others (Akkermans et al., 1999). Likewise, the case study conducted by Anderson
et al., (2000) on the American machine tool industry sought to simulate the effects of
production volatility on the supply chain. This stream of research helps to inform the
study on persistent supply chain failure because it advocates the improvement of
38 | P a g e
communication and collaboration as a means to reduce supplier volatility from the
effects of demand signal distortion (Anderson et al., 2000).
System Dynamics concepts and tools have been used by researchers in a variety
of domains to provide a systematic management view of strategic and operational issues
in organisations (Rodrigues and Bowers, 1996). System Dynamics models have been
used to identify major causal factors that link together to significantly influence the
success or failure of a project (e.g. Love et al., 2002; Jalili and Ford, 2016). By
conducting System Dynamics simulations before the commencement of major
construction projects, important interrelationships between all functions of the project
can be captured and mapped (Kapsali, 2011). It has been demonstrated that System
Dynamics can be used to identify where a major project had gone off track and the
actions needed to give project managers insights into where and how to get the project
moving in a positive direction (Yang and Yeh, 2014). Such models incorporated the
use of causal loop diagrams to show cause and effect of factors that link together to
create or result in particular outcomes. Formulating System Dynamics causal loop
diagrams may give project managers the ability to focus and plan specific areas of a
project (Lyneis and Ford, 2007). The ability to visually capture and demonstrate
interactions between critical factors can positively influence the outcome of a major
project. In addition, the greater visibility that System Dynamics potentially provides
may enable project managers to significantly improve important facets of the project
management process such as stakeholder management (Chapman, 1998). A significant
reason for this is that Systems Dynamics can highlight the existence of inherent
‘systems’ within projects that develop naturally as a consequence of past decisions or
actions and that, if not remedied, may reinforce factors that ultimately result in failure
(Lyneis et al., 2001). A further potential benefit of this method is that the effect of
actions taken by management to counteract systemic effects can be modelled before
costly disruptions occur as a consequence of the change (Howick and Eden, 2004). The
project management literature does deal with failures that persist over the course of a
project, particularly large projects, and therefore it is natural to consider its relevance
in the context of persistent supply chain failure. Equally the application of Systems
Dynamics thinking and causal loop diagramming to understand project management
dynamics may provide insights to further understand and analyse persistent supply
chain failure.

39 | P a g e
2.10 Service Recovery. Service Recovery refers to those actions designed to resolve problems, alter negative
attitudes of dissatisfied customers and to ultimately retain those customers in service
operations (Miller et al., 2000). Studies that investigate the concept of service recovery
have been carried out in order to understand how organisations attempt to improve
service operations and performance or mitigate against failure (Williams and Moore,
2007).
One such outcome is where studies attempt to understand how organisations
regain customer satisfaction and confidence after significant failure and / or disruption
has been caused (e.g. Tax et al., 1998; Hocutt et al., 2006; De Matos et al., 2007;
Bhandari et al., 2007 and Huang, 2011). Studies on service recovery have sought to
analyse the initial customer responses to failure and seek to characterise the emotions
that motivate the buyer towards repeat business with the seller’s organisation (e.g.
Chebat and Slusarczyk, 2003, Rio–Lanza et al., 2009 and Edvardsson et al., 2011).
The outcome of the initial research into service recovery motivated others to
attempt to understand how effective the service recovery initiatives have been (Tax et
al., 1998; Miller et al., 2000). It has been observed that fulfilling specific criteria such
as a perceived high recovery effort by the seller with some form of compensation can
result in significantly positive effects for the seller (Augustus de Matos et al., 2007). In
addition, the literature identifies corrective actions that enable sellers to recover from
failure by ensuring that they do not lose dissatisfied customers. The studies have shown
that in order to regain satisfaction, sellers need to solicit a social recovery in the form
of etiquette such as an apology (Krishna et al., 2011; Hur and Jang, 2016). However, a
key strategy to reduce the impact of service failure is to ensure that failures are dealt
with expediently and that the buyer / supplier interface is efficient (Sousa and Voss
2009). The type of failures that are examined tend to be dealt with directly between the
manufacturer or ‘seller’ and the customer (Edvardsson et al., 2011).
A research stream of particular interest is that on the ‘Service Recovery
Paradox’. A notable contribution to this phenomenon came from McCollough and
Bharadwaj (1992) in their research on post-recovery satisfaction. They made the
observation that effective recovery strategies can lead to the customer rating a service
encounter or provider more favourably than if no problem had occurred in the first place
(Tax et al., 1998 p.64). These observations have sparked numerous studies aimed

40 | P a g e
seeking to identify whether there were sufficient foundations to the theory (e.g. Miller
et al., 2000; Magnini et al., 2007; Michel and Meuter, 2008; Michel et al., 2009). One
subsequent study carried out by Michel and Meuter (2008) concluded that the recovery
paradox could exist but only in extremely rare circumstances. Failure can give the seller
or service provider the opportunity to successfully recover in turn creating loyalty and
trust with the buyer (Krishna et al., 2011). However, both service success and failure of
recovery are very much the result of operational activities of the organisation (Miller et
al., 2000 p.388). If the industry is highly competitive and has plenty of substitute
products for customers to choose then the task of retaining dissatisfied customers
becomes much harder to achieve. The key ingredients required to solicit a recovery
paradox are shown to be clear and concise communication, timeliness, and
empowerment of staff by enabling them to have the authority to make quick decisions
that affect the outcome of the recovery (Bhandari et al., 2007). Perspectives from
service operations management may help to inform the study of persistent failure in
supply chains, particularly in relation to the service recovery paradox.
2.11 Characteristics of supply in the Gas Turbine / Aerospace Industry. The commercial aerospace industry is valued in the region of $300bn globally, which
includes production, maintenance, repair and overhaul (Richter and Walther 2017). Due
to rapid growth, the sector has doubled in size over the past five years with 89% of the
industry being based in the United States and Europe (Aviation Week Network, 2015).
The industry is largely controlled by a very small number of global players in both the
airframe and engine businesses. Due to the safety critical nature of the products
produced within the industry, each sector is highly regulated across the supply chain at
all levels to ensure that the products supplied are ultimately airworthy and safe in use.
The sector is characterised by high-tech engineered products that consequently involve
very large scale and complex supply networks. Therefore, the issue of strategic fit
between suppliers of all components throughout the supply chain is an important one
within the gas turbine manufacturing industry (Routroy and Pradham, 2011).
Typically, due to the high level of complexity required for each component,
there are only a relatively small number of capable suppliers globally that can
manufacture to the required standards. Pulles et al., (2016) in their study on preferential
resource allocation, describe how managers from the buying organisation need to
identify the significance of effectively securing resources from the supplier as they

41 | P a g e
could be competing for this with competitors. The gas turbine manufacturing industry
does not have the same level of competition within the supply chain compared with
industries such as automotive or with larger manufacturers in terms of high volume of
components per year. The attractiveness of the gas turbine manufacturing industry
comes due to the potential longevity of the supply contracts, a feature that is uncommon
in other industries. However, for some, this represents a risk to the buying organisations
because suppliers may not necessarily be incentivised to support a supplier
development programme where the return benefits will be experienced and spread over
a number of years (Matook et al., 2009). However, potential new entrants to the gas
turbine industry are usually attracted by the length of contracts on offer due to the
extensive aftermarket business that is typical of the industry (Nagati and Robelledo,
2013). Therefore, suppliers are incentivised to develop strategies that ensure they are
able to retain business on large scale projects without the threat of rival competition
(Crook and Combs, 2007).
However, persistent supply chain failure is a real issue that continues to cause
significant disruption for the major aerospace / gas turbine manufacturers. The example
of Boeing was noted in the introductory Chapter. Key players such as Pratt and Whitney
are experiencing problems with their new turbo fan gas turbine engine which has caused
delivery disruption for the new Airbus A320 Neo aircraft, whilst problems with cabin
the equipment supplier Zodiac of France is holding up production of the Airbus A350
aircraft (Hollinger, 2016).
2.12 Gaps in the Literature and Justification of Research Questions. An important objective of this literature review was to establish the need to research
the phenomenon of persistent supply chain failure and identify appropriate research
questions based on clear gaps in the literature. The intention was to examine the
literature and then use the findings to lay the foundations of the study and help to
develop the methodology and research design, discussed in Chapter 3. The analysis has
provided the required information needed to clarify what and where the gaps are in the
contemporary research literature. Table 2.1 provides a summary of the literature
domains examined including key contributors and interview topics created to
investigate the identified gaps in the literature and the need to answer the research
questions during the exploratory phase.

42 | P a g e
Table 2.1 Key Literature Themes Investigated During The Empirical Research. 1
Literature Concept Example Key Papers Exploratory Phase
Interview Topics
Supply Chain Management Lambert and Cooper
(2000)
Mentzer et al, (2001)
Cooper and Ellram
(1993)
Supply Chain
Management Practices
Risk and Contingency
Management in the Supply
Chain
Zsidisin., Panelli &
Upton (2000)
Kleindorfer & Saad
(2005)
Capar & Narayanan
(2009)
Descriptions of Risks
Demand Management
in Relation to Risk
Sourcing Risks
Contingency Risks
Supply Chain Quality
management
Flynn & Flynn (2005)
Power & Terziovski
(2007
Yeung (2008)
Understanding Quality
approaches
Examination of Quality
practices
Quality Management
Risks
Power, Leverage and
Dependency in the Supply
Chain and Relationship
Management in the Supply
Chain
Cox (2001)
Hakannson & Ford
(2004)
Forslund and Jonsson
(2009)
Understanding effects
of Power and Leverage
Identification of
Dependency
Effect of Relationship
Management on
Performance
The Effect of
Communication
Strategic Alignment
and Trust
Supplier Development
Krause and Ellram
(1996)
Humphreys & Chan
(2004)
Wagner (2005)
Supplier Development
Processes
Supplier Development
Challenges
Performance Management in
the Supply Chain Thorpe & Beasley
(2004)
McAdam, Hazlett &
Gillespie (2008)
Koufteras et al, (2014)
Performance
Measurement
Performance Risks
Aligning
Organisational
Requirement with
Capability
Supplier Development
Activities
Project and Programme
Management
Rodrigues and
Williams (1998)
Chapman (1998)
Sanderson (2012)
Not Included
System Dynamics Sterman (2001)
Morecroft, 2009
Kampman (2012)
Not included

43 | P a g e
The key gap in the literature is the lack of research that seeks to evaluate
persistent failure that continues to disrupt prime manufacturing organisations in some
industries over a period of time. This leads to the first research question for this
research:
RQ1 ‘What is persistent supply chain failure and how can it be understood?’
It was also clear from the review of the literature that many issues can influence
each other in relation to supply chain failure. Therefore, it is necessary to understand
which factors interact to increase the chances of persistent failure. This has led to the
second research question for this study:
RQ2: ‘What factors drive persistent supply chain failure and what are the
interrelationships between them?’
In order to develop a legitimate model that could be used by managers to
understand and potentially mitigate against persistent supply chain failure it was
important to investigate and identify supply chain recovery strategies, which lead to the
third and final research question:
RQ3: ‘What supply chain strategies can be adopted to help resolve different types of
persistent failures effectively?’
Gaps in the literature on risk and contingency management contributes to the
justification of RQ1 and RQ2. The contemporary literature focusing on Risk and
Contingency Management within the supply chain is an important theme because it
provides an examination of how both buyers and suppliers identify potential failures
and how they mitigate them. However, despite the research focus, studies do not analyse
the relationships between variables that can link together to eventually cause failures
that recur and persist over an extended period of time. For example, research does not
examine how key operational risks can link together to become so volatile that, over
time, if not remedied, become more difficult and costly for buying organisations to
mitigate without experiencing disruption. In addition, there are notable differences
between the research that focuses on sourcing risks and the concept of supply chain
failure. The differences can be seen through examining the methods developed to
Service Recovery Tax, Brown and
Chandrashekaran
(1998)
Miller et al, (2000)
Craighead et al,
(2004)
Recovering from
Failure

44 | P a g e
identify potential risks. These tend to focus on preventing failure from happening in the
first instance (Giunipero and Eltantawy, 2003). It is the supply chain’s reaction to
failures that have already happened which is interesting for the research on persistent
supply chain failure.
Literature on supply chain quality management identifies a number of concepts
that resonate with the research on persistent supply chain failure and contribute to
justifying RQ1. Much of the current empirical research focuses on identifying what a
robust quality system looks like (Zhang et al., 2012) and how buying organisations seek
to measure supply chain performance. The literature does not examine the
characteristics of an ineffective quality management system and what effect this has on
supply chain performance over time. In contrast, this research on persistent supply chain
failure addresses a gap in the literature by clarifying the role that inadequate quality
management systems and practices play in both causing persistent supply chain failure
and the activities that buying organisations can use to address this.
Literature that examines the concept of buyer and supplier power and the effects
these have on business relationships and strategy is also important for understanding
potential causes of failure in the supply chain. This literature contributes towards
framing and justifying RQ1 and RQ2. Although many studies have been conducted that
attempt to identify and describe the effect of buyer–supplier power asymmetry,
leverage and interdependency on supply chain management performance, none
consider persistent failure. Some studies attempt to understand how dependencies
between two parties in a supply chain relationship can ultimately lead to commercial
lock-in, which increases the effect of an adversarial relationship (Narasimhan et al.,
2009). However, an identified gap in the literature centres around how current research
has not yet been expanded to investigate the effect that buyer–supplier dependencies
can have on the supply chain (Nair et al., 2011). Existing literature does not investigate
if or how dependency can become a cause of persistent failure and its ramifications for
key relationships within the supply chain when problems persist. The research on
persistent supply chain failure seeks to identify these effects.
The majority of the literature on supplier development has concentrated on
understanding the circumstances that lead to improvement initiatives being conducted
with chosen suppliers. Answering RQ1, RQ2 and RQ3 will help to address gaps in the
supplier development literature. The current literature seeks to address ways in which

45 | P a g e
buying organisations utilize improvement initiatives to improve performance (Nagati
and Rebolledo, 2013). However, there is limited research that attempts to understand
how buyers manage improvement initiatives when both parties fail to mitigate against
disruption in the short term (Morrison, 2015) or if failure persists despite improvement
initiatives being instigated. A further identified gap in the research is the identification
of whether supplier development initiatives can actually cause increased problems for
the intended recipient over a period of time should an initiative prove unsuccessful.
Literature investigating supply chain performance management systems
adopted by buying organisations was found to be extensive and covers a wide subject
area. There is no apparent research that explicitly investigates how buying organisations
react to supply chain failure once it has been identified through their performance
management system. The literature does not address the actions that buying
organisations take to mitigate against a failure that is already causing disruption
persistently, nor does it seek to understand the point at which the buying organisation
takes action to mitigate against failure. A further related topic that could potentially
contribute to persistent supply chain failure is the misalignment of performance
management systems and the effects that this may have on organisations within the
supply chain (Busi et al., 2006). The research examines the cause of performance
measurement misalignment and suggests that this can exacerbate the risk of failure
throughout the supply chain (Johnston and Pongatichat, 2008). However, the current
literature does not investigate the specific effects this has on the buying organisation or
suppliers’ behaviours.
Further significant gaps identified in the literature review concern relationship
management in the supply chain. The findings from the literature review on this topic
further justify RQ1, RQ2 and RQ3. Some literature investigates cause and effect of
strained relationships but does not extend to cover what happens when the buying
organisation has no immediate substitutes to resource from, therefore delaying a
possible exit from the failing supplier (Meehan and Wright, 2011). In an acrimonious
relationship, a lack of sourcing options could become a serious issue and may contribute
to persistent supply chain failure. Closely related research examines the effectiveness
of communication between buyer and suppliers, investigating the type of
communication that can lead to improved supply chain performance (e.g. Ruey–Jer et
al., 2010; Jacobs et al., 2016). However, the empirical literature fails to adequately

46 | P a g e
address the effect of minimal communication throughout the supply chain and how this
can potentially reduce a supplier’s performance. There is literature that describes how
a lack of communication can create tensions with suppliers whose business is not seen
as critical or core to the buyer (Ellegaard and Anderson, 2015) but it does not investigate
how the effects can contribute towards supply chain failure. Some related studies within
the relationship management domain investigate circumstances surrounding when
buying organisations decide to end a longstanding relationship with a supplier and why
(Pressey and Qui, 2007) but does not address the issue of the buyer being unable to
source from elsewhere quickly.
Some similarities have been identified in the literature on project management
that specifically concentrates on the causes and effects that influence large scale project
failures and also practices that are associated with project success (Turner and Zolin,
2012). The literature describes characteristics of failures that occur during large scale
projects and investigates project risks and uncertainties (Sanderson 2012). The
literature also highlights how lessons learnt from case studies conducted on
manufacturing organisations has influenced studies on project management (Sage et al.,
2014 p. 543).
The service recovery literature concentrates on the direct customer to seller
interaction within service based industries and examines how sales representatives
manage customers from a state of dissatisfaction to a position where an irate customer
becomes very satisfied and the business is therefore retained (Craighead et al., 2004).
This literature from the service domain further justifies RQ2 and RQ3 because the
current supply chain literature does not explore how the process works in a supply chain
management scenario. However, it is clear that existing service recovery literature in
service operations management incorporates a very different set of characteristics to
those being managed in complex manufacturing supply chain contexts such as
measuring the performance of the seller based on how expedient and effective the
problem is dealt with (Cho et al., 2012 p.802). Within the service recovery literature,
failures are either dealt with immediately in order to stand a chance of retaining
businesses or the customer’s business is lost.
Thus, overall, the literature review shows an absence of research on persistent
supply chain failure but does highlight a number of key research themes that are
relevant to, and that should inform a study into the topic.

47 | P a g e
Chapter 3: Research Methodology and Research Design. Chapter 2 has reviewed the supply chain and operations management literature and
identified research questions for the topic under investigation in this work. The review
has provided a clear justification for the research questions by highlighting key gaps in
the literature. A further motivation for the review was to identify the most appropriate
type of research that could help to answer the research questions. The purpose of
Chapter 3 is to justify and describe in detail the research process that was adopted and
followed throughout the study to address the research questions posed (Singh, 2015).
The Chapter includes:
A review of the structure selected for the research study.
A description of the research setting including information about the participants
and their associated companies.
Analysis of the data gathering process and protocols for different types of
participants in the study (first tier suppliers7and the prime manufacturer8)
(Barrett et al., 2011 pp.333).
A review of the steps taken to validate the research findings and ensure that the
methods applied are rigorous, robust and repeatable (Borgström, 2012 pp.845).
The data collection phases, which consisted of several phases and stages
(Beverland and Lindgreen, 2010 pp.60), are explained.
Section 3.1 briefly presents the philosophical perspective adopted for the study.
Section 3.2 explains the research design. Section 3.3 provides a comprehensive
discussion of the research methods and the two stages of research phase one
(Exploratory). Section 3.4 describes research phase two (Analysis), which is also
divided into two stages. How the data analysis and model formulation processes were
conducted is described. Finally section 3.5 addresses research phase three (Validation),
describing the validation processes conducted with first tier suppliers and with the
prime manufacturer.
3.1 Philosophical Approach. Table 3.1, adapted from Perry et al., (1997, pp.547), highlights the potential paradigms
that could have been utilized for the research methodology. The table briefly describes
7 To be referred to as ‘First tier supplier’ throughout this research. 8 To be referred to as ‘The prime’ throughout this research.

48 | P a g e
how ontological, epistemological and other methodological assumptions are interpreted
by the four most common paradigms used for qualitative research (Perry et al., 1997).
2 Table 3.1 Adapted from Perry et al., (1997, pp.547).
The philosophical approach taken for this research project is that of critical
realism (Bryman and Bell, 2011). The decision to adopt this paradigm as a
philosophical stance stems from the need to capture and analyse real life events or
occurrences (Roberts, 2014). According to Easton (2010 pp.119): “Critical Realism
assumes transcendental realist ontology, an eclectic realist interpretivist epistemology
and a general emancipatory axialogy”. The table explains how the critical realism
paradigm suggests that participants assume their thoughts and observations on the
reality they exist within are real (Adamedis et al., 2012). However, this can only be
considered from each participant’s own perspective and is therefore considered
imperfect even if what they are conveying is comprehensible (Easton, 2010). This
suggests the paradigm’s compatibility and relationship to the ontological ‘reality’ that
events being observed are real, but it is not obvious to those who exist within them
(Hodgkinson and Starkey, 2012). Participants will describe what they perceive to be
Paradigm
Element Positivism Critical Theory Constructivism Realism
Ontology The reality being
studied is real and
apprehensible
The reality is
“Virtual” and
shaped by social,
economic, ethnic,
political, cultural,
and gender values
crystallized over
time.
There are a
series of
multiple local
and specific
“constructed”
realities.
The reality being
investigated is “real”
but only imperfectly
and probabilistically
apprehensible.
Epistemology Objectivist: The
findings of the study
are considered true.
Subjectivist: Value
mediated findings.
Subjectivist:
Created
findings.
Modified objectivist:
The findings from the
study are probably true.
Common
Methodologies
Experimental/surveys:
The verification of
hypothesis is chiefly
conducted by using
quantitative methods.
Dialogue/dialectical
: The researcher is a
“transformative
intellectual” who
changes the social
world within which
participants live.
Hermeneutical/
Dialectical: The
researcher is a
“passionate
participant”
within the world
being
investigated.
Case studies/convergent
interviewing: The use of
triangulation to interpret
research issues by
qualitative and by some
quantitative methods
such as structural
equation modelling.
49 | P a g e
reality; therefore, it must be assumed that observations will be slightly different each
time they are made. As such, identification and emergence of general themes from
interview data for instance will involve an amount of considered interpretation in order
to understand, interpret and categorize observations.
The same can be said for epistemology, as a qualitative researcher following a
critical realism paradigm can only assume that the insights and observations captured
during the research are true (Rotaru et al., 2014). The epistemological positioning
described by critical realism also fits well as the most pertinent method to follow in
order to derive an appropriate methodology for case study research (Buch – Hanson,
2014). This has been achieved by obtaining evidence from real life examples and
scenarios that are perceived as being true by the participants but again, not immediately
visible.
Table 3.1 also demonstrates how a common methodology used by researchers
adopting a critical realism paradigm is to conduct case studies. This approach was
adopted during the empirical phase of the study of persistent supply chain failure as a
method of capturing real life data. It was evident that a suitable method would be to
conduct case studies as a way to identify and extract meaningful and insightful
information and to capture the ‘hidden systems and activities’ that lead to cause and
effect relationships, i.e. ‘the way things are around here’ (Levitt and March, 1988). In
general, case studies are a common method of capturing real life data from a critical
realism philosophical stance in social science research (Yin, 2009). An overview of the
overall research design is given first below, followed by a detailed description of each
aspect of the research process, including the case study methods used.
3.2 Research Design. Development of a robust research process is key to ensuring that sound methodological
rigour is achieved (Meredith, 1998 pp.448). It was therefore important in this study to
first identify gaps in the literature and then design a research study that would reliably
fulfil the key motivation behind the study which is to identify and understand key cause
and effect relationships of persistent supply chain failure. The research design was
developed as a consequence of the need to address the research questions and the gaps
identified in the literature.

50 | P a g e
3.2.1 Unit of Analysis.
The principal unit of analysis for this research study on persistent supply chain failure
is the dyad comprising a prime manufacturer and a first tier supplier. In seeking
to identify and understand persistent supply chain failure, the unit of analysis
chosen includes implicitly the first tier supplier's sub-tier supply chain because the first
tier supplier is deemed responsible by the prime for all sub-tier suppliers from which
they source sub-components that may be used to produce a component supplied to the
prime.
3.2.2 Research Design Process.
This process was influenced by recommendations from Yin (2009). Figure 3.1
summarises the research approach, phases, stages and sequence adopted for this study.
1 Figure 3.1 Research Design Process.
The research design consists of three phases. Each phase in the design builds on
the information gathered from the previous phase, providing a guiding framework for
the research (Stuart et al., 2002). Research phase one entitled the ‘Exploratory Phase’
consists of empirical study conducted through case studies in two stages. Stage one
adopts a multiple case study approach conducted with five first tier suppliers. All
Critique, test and validate the qualitative and causal analysis using a workshop setting.
Research Phase 3 – Validation
Stage 2 – Causal Analysis
Stage 1 – Qualitative Analysis
Research Phase 2 – Analysis
Stage 2 Prime – Semi Structured Interviews.
Stage 1 First - tier Semi Structured Interviews.
Research Phase 1 – ExploratoryLiterature Review

51 | P a g e
participating first tier suppliers are important suppliers to the prime company and all
have manufacturing facilities in the UK. Stage two consists of one case study with
multiple participants carried out with the prime manufacturer from the gas turbine
manufacturing industry in order to obtain a dyadic perspective incorporating buyer and
suppliers. Key aspects of the research phase one protocol documents are discussed
throughout this section.
Phase two entitled ‘Analysis’ is an analysis of the data obtained from the case
studies conducted throughout research phase one. It includes an explanation of the
coding approach used to identify the key themes and factors related to the antecedents
and explanatory factors of supply chain failure. Research phase two was also divided
into two stages carried out in sequence i.e. a qualitative analysis of the data from phase
one and followed by a causal analysis of the data. Phase two will also provide
explanation of the techniques adopted to develop causal loop diagrams, which have
been used to capture and illustrate supply chain failure processes.
Research phase three entitled ‘Validation’ involved review and critique by
suppliers of the original findings, and a workshop process carried out with the prime
manufacturer in order to validate the persistent failure model that was developed as a
consequence of research phases one and two. Phase three was divided into three parts.
The first part is a re–validation of all interview data captured during phase one. This
was followed by a pilot study test run that ultimately leads to a description of the
workshop validation exercise.
3.2.3 Rationale for Adopted Research Design.
This research identifies, defines and describes a phenomenon that is not apparently
evident in the contemporary operations and supply chain management literature –
persistent failure (Stuart et al., 2002 pp.420). The aim is to contribute to research
knowledge by developing an understanding of the causes and subsequent effects of
persistent failure. From a practice perspective, the research aims to provide purchasing
and supply chain managers with a model that will assist them in developing strategies
to avoid persistent failure over the long term or mitigate its effects.
The focus for business and management research is new theory development,
i.e. exploring a new theme for research using qualitative data to ascertain new theory
(Eisenhardt, 1989). Therefore, the starting point is to establish a baseline for the
research (McCutcheon et al., 2002). The exploratory nature of the research requires data

52 | P a g e
collection strategies that are free from the constraints of quantitative analysis (Wacker,
1998) as real life scenarios need to be captured and interpreted that are out of the control
of the researcher (Easton, 2010). At the outset there are no initial boundaries or
parameters in which to position the work. The exploratory nature of the research means
that these have to be established as the research progresses (Yin, 2009). According to
Voss et al., (2002), the most appropriate way in which to ascertain information that is
rich in newly identified insights and that provides an opportunity for analysis is to use
a case study approach.
3.2.4 Justification for Conducting Case Studies as a Method of Research.
McCutcheon and Meredith (1993, pp.241) note the unique strengths of case study
research for developing new theories and examining unfamiliar situations. The
exploratory nature of the research also means that there could be key elements or facets
to the subject that are not immediately apparent (Flynn et al., 1990). Any further
insights could potentially develop into significant answers or propositions needed to
explain or justify findings that are significant in answering the research questions
(Stuart et al., 2002). Yin (2009) refers to case studies that are designed to determine
“how” or “why” events occur as explanatory studies. Gaining access to experienced
practitioners was a critical element for this study. Practitioners are often influential or
may be responsible for the actions that determine events. The capture of insightful
information provides the researcher with the potential to obtain first hand and explicit
insights through observations that may not have been possible using other methods of
data collection (McCutcheon and Meredith, 1993). This has the potential to assist in the
identification of common themes and sub–themes, as well as differences in
perspectives, which will help to formulate answers to the research questions in a
rigorous way.
Case studies, and in particular semi-structured interviews, also represent a
flexible way in which to elicit useful information because they can be extended to
include additional participants or functions that provide greater detail to support the
research propositions, should this requirement emerge from the initial data collection
exercises. Should such details emerge, then case studies are generally flexible enough
to accommodate the additional research design structure (Eisenhardt, 1989). However,
these activities need to be controlled because of the potential pitfalls of case study
analysis, which includes an unmanageably large amount of data (Yin, 2009).

53 | P a g e
Establishing key themes and trends from a vast amount of recorded data originating
from a plethora of semi-structured interview research participants can be an extremely
onerous task (McCutcheon and Meredith, 1993 pp.244). However, despite the risk of
failing to identify saturation (O’Reilly and Parker, 2012), additional participants can be
assimilated into a research study provided that the case study protocol is consistent and
the structure of the research is easy to replicate (Yin, 2009).
Making sense of large volumes of data combined with being able to adequately
replicate the study are essentially the key areas of criticism against using case study
research from academics that prefer the use of other data collection and analysis
techniques (Thomson and McLeod, 2015). Therefore, methodological rigour through
solid research design is one of the most important aspects of case study research
(McCutcheon and Meredith, 1993 pp.247).
3.2.5 Challenges in Conducting Case Studies.
Given the sensitive nature of the research topic examined in this study, choosing to first
conduct case studies as a means of exploratory research is wholly appropriate for a
number of theoretical and practical reasons. To retain focus for the research, it was
decided that the most appropriate course of action was to conduct multiple case studies
on suppliers who were or have in recent times been connected with supply chain failures
that had caused protracted disruption for the prime manufacturer. The approach
presented its own set of challenges as every participating supplier was supplying
products to the prime throughout the research process. In particular it was a significant
challenge to persuade potential participants to take part in semi-structured interviews
on a difficult subject and to ensure open and honest answers were provided.
Five companies (including a pilot study) kindly agreed to facilitate and
participate in the interviews. All five suppliers were initially approached by email
followed up by a telephone call in order to confirm meeting arrangements. During the
calls, more details regarding the purpose of the study and its desired outcomes were
given. The fact that the lead researcher was an employee of the prime at the time of the
research also provided further challenges. However, there were also benefits to being
an employee of the prime because, without the prior network and industry contacts,
getting permission and organising extensive interviews would have been much more
difficult given the focus of the study on failure.

54 | P a g e
3.3 Introduction to the Exploratory Case Studies (Research Phase One). In planning phase one it became clear that there was a need for the study to address
perspectives from both sides of the supply chain dyad (Ellram and Henrick, 1995). This
approach was adopted to understand more fully the nature of the interactions between
the buyer and supplier and to help identify if themes raised by one party were
corroborated or not by the other. Identification of corroborated themes from both sides
strengthens the findings of the study. Identification of differences in perspectives also
yields interesting insights to be examined.
3.3.1 Phase One Stage One – First Tier Supplier Data Collection Protocol.
The semi-structured interview protocol for participants from first tier suppliers was
adapted from Yin’s (2009) case study protocol. A review of case study literature found
that the first step in conducting case study research is to ensure and guarantee the
protection of employees at each case study site (Yin, 2009). In this study the principal
protection that was needed was to reassure participants that the observations and the
views recorded would not be used in any written reports, presentations, or verbal
discussions on the research in any way that identified the participants or their
organisations. To ensure the protection of employees, full anonymity was guaranteed
should the participants not want to be named. An ethics plan was drawn up and
approved by the School’s ethics board prior to the interviews.
In order to test the case study protocol document (Ravenswood, 2011) the first
case study investigation was classed as a pilot study (Voss et al., 2002). The reason for
this was to identify any issues that arose in operating the protocol and addressing these
in subsequent interviews. This acknowledges that the protocol could potentially change
and evolve from case to case but the purpose of the pilot was to eliminate glaring errors
that could threaten the methodological rigour of the research process.
3.3.1.1 First tier Supplier Selection.
The first tier suppliers targeted to participate in the study manufacture different parts,
assemblies and systems that go into a variety of final products produced by the prime.
The systems are brought together during manufacturing to assemble a gas turbine
engine. In this study the targeted suppliers manufacture parts, assemblies and systems
with varying degrees of engineering complexity. A proportion of the supplier base is
classified by the prime as a ‘design owner’ because the supplier owns the intellectual
property rights (IPR) and are the design authority for the products they supply. The

55 | P a g e
remaining suppliers produce parts from designs that are developed and owned by the
prime and are classified as ‘make to print’ suppliers. The targeted companies also
supply different volumes of products depending on the number of engine types their
component is used on and the quantity per engine. The criteria and justification for
eventual selection included:
First tier suppliers currently experiencing consistently poor performance.
First tier suppliers with a history of poor performance over the previous five
years.
First tier supplier availability i.e. those available to participate in the research.
Interest and willingness to participate in the research.
Each of the participating first tier supplier doing business with the prime has in
recent years been subject to measures put in place to improve their performance. The
central purpose of this strategy is to enable the suppliers to become reliable and
eventually class leading. The prime manufacturer in this study operates a supplier
management system called SABRe, which is an intrinsic part of the prime’s quality
management system. All suppliers to the prime are governed by the processes and
procedures specified by SABRe documentation and are mandated to adhere to the
processes specified within the system. Each supplier agrees to 100% compliance to
SABRe when entering into a contract to supply goods or services to the prime.
Importantly, through this process first tier suppliers are obligated to manage their own
sub-tier suppliers using processes and procedures that are specified in SABRe. The
research on supply chain failure is influenced by SABRe because if a product is
supplied by a first tier supplier that does not comply too the specifications mandated
within the system then the prime will deem this to be a supply chain failure.
3.3.1.2 The Pilot Study – Supplier A.
The first company to agree to participate in this research project also became the pilot
study organisation. Supplier A is an experienced manufacturer of high pressure rigid
pipe equipment used for hydraulic controls and oil flow on a gas turbine engine. The
main objective of supplier A is to be a significant player in various sectors of the markets
in which they participate, including airframe, power plant, fixed and rotary wing
encompassing extensive civil and military projects. Due to its size (based on number of
employees and annual turnover) it can be classed as a small manufacturing enterprise
(SME) with specialist capabilities in aerospace components. It has facilities in the south
56 | P a g e
of the UK where it produces fabricated structures, pipe assemblies and ducts. The site
is staffed by one hundred employees and generates 40% of their UK revenue. They also
have a further site situated in the UK Midlands producing rigid and flexible pipes,
manifolds and reference tubes for the aerospace industry. The site employs 154 people.
Approximately 80 of those employees work in their machine shop producing flanges,
bosses and machined casted elbows. The Midlands site represents 60% of supplier A’s
UK revenue. Supplier A has also acquired a machining facility in China. This was done
at the request of the prime in order to reduce costs of production. This site currently
employs 95 people. Supplier A’s plan was to gradually transfer more work to China as
their capability increased.
Supplier A has been supplying the prime on existing engine programmes for
eight years. Notably, from all of the first tier supplier participants, supplier A was the
organisation that was considered to be one of the most serious problems for the prime
at the time the research was initiated in terms of consistently failing to meet agreed
quality and delivery targets. Supplier A had been placed into an escalation process,
called ‘Red Flag’, specifically due to poor performance. The red flag process consists
of the prime enforcing major improvement activities and initiatives on the
underperforming supplier and mandating that these needs to be completed within a
specified timeframe. At supplier A the initiatives had been in place for a period of four
years at the supplier’s cost. However, it was mentioned by a participant from supplier
A that minimal improvement in performance had actually been made. During the time
that the case study research was carried out, supplier A was experiencing significant
operational disruptions in its interactions with the prime manufacturer. Disruptions had
been occurring for a number of years and as a result the relationship had become very
strained.
Supplier A was initially approached and asked if they would be willing to be a
case study organisation and potentially share some of their experiences and opinions on
the causes of supply chain failure. The situation was very sensitive for the prime as
supplier A was a key provider of rigid pipes on a number of key engine programmes for
which it had a very strong pipeline of orders from Air framers. Fortunately, after
consultation with the Managing Director, the supplier A contact person was able to
confirm their participation in the study.

57 | P a g e
The research took place at Supplier A’s Midlands based manufacturing facility.
A total of five employees participated. All of the participants held managerial positions
within the company, including the Sales Director, Quality Manager, Commercial
Manager, Purchasing Manager and Operations Manager.
3.3.1.3 Case Study Supplier B.
Supplier B has a 90 year history as a bearing producer supplying to large original
equipment manufacturers within the aerospace industry such as Rolls Royce Plc, Pratt
& Whitney and General Electric (GE). They have been a supplier to the prime for the
past 15 years, becoming a preferred supplier in 2003. Supplier B is positioned within
the aerospace division of its parent company, which is a global organisation that supplies
bearings to the manufacturing, construction, agriculture, automotive, pulp and paper,
aircraft maintenance, marine and mining industries throughout the globe. The group
consists of 140 sites situated in 32 countries with a total of circa 50,000 employees
worldwide. Supplier B manufactures multiple bearings on all of the prime’s key engine
programmes. They also provide bearings to the prime’s subsidiary in Germany that
works on older engine programmes.
Supplier B was placed into delivery and quality red flag during 2010 as a result
of consistently sub-standard performance on the prime’s supply chain balanced
scorecard. Throughout the duration of the research, the supplier was still being managed
by the prime via the red flag escalation process. However, the effect of the red flag
process has been inconsistent because overall performance had fluctuated between
periods of sustained improvement through to periods of sustained under performance.
As such, Supplier B met the criteria for investigation and was invited to participate in
the study. Initial contact was made by email and then arranged by telephone. The
research took place at Supplier B’s UK manufacturing facility. Overall, five employees
were interviewed including an Operations Manager, Quality Manager, Sales Manager,
Commercial Manager, Buyer (Strategic and Operational combined).
3.3.1.4 Case Study Supplier C.
Supplier C has been providing products for aerospace applications for over 90 years
since the beginning of aircraft and aero-engine manufacture in the UK. They also
provide heat management systems consisting of radiators and cooling plates to the
electronic / avionics, motorsport and power generation industries including a range of
integrated heat transfer and fluid management products for the commercial and military

58 | P a g e
markets. The products supplied include the design and manufacture of a small range of
heat management and fluid system components specifically tailored for the prime’s
applications. Their products are used on both airframes and engines for fixed wing
aircraft and helicopters.
Supplier C is part of an American owned multi-national engineering
conglomerate. The intellectual property rights for the systems they design are all owned
and patented by the supplier. That means the prime has a strategy of purchasing supplier
C’s product designs and incorporating them onto their own applications.
Supplier C has been maintaining a stable level of performance with the prime
for the past five years. Prior to being bought out by an American conglomerate, their
performance was well below the required agreed standard with the prime. However, as
a consequence of their subsequent improvement, they have since been able to win
further contracts with the prime. The performance levels of Supplier C have fluctuated
over time, therefore they were asked to participate in the study.
Initial contact was made via email and then arrangements for the case study data
collection activity including dates and times were made over the telephone. Requests
for the roles and responsibilities of potential employee participants were sent by email.
The contact then formulated the chosen day’s interview schedule around the
participant’s availability. The event took place at their main manufacturing facility on
the outskirts of Wolverhampton in the UK. In total, four employees were able to
participate in the study. All of them held leadership / managerial positions within the
company, including an operations manager, quality manager, sales manager, and
commercial manager.
3.3.1.5 Case Study Supplier D.
Supplier D forms part of an international group providing complex engineering systems
to key organisations within the aerospace and defence markets. They provide
technological solutions to the aerospace and defence industry in manufacturing
processes such as fabrications and machining. They operate a global supply chain to
support complex aero-engine component manufacture and repair. They are focused
specifically on aerospace OEM customers such as Rolls Royce Plc, Boeing (defence),
Pratt and Whitney and the GE group. Supplier D has a policy of placing sites close to
their key customers in North America and Europe. Over recent years, they have
invested significant resources into their engineering capability coupled with similar

59 | P a g e
investment to increase capacity. The group currently supply more than 1500 part
numbers to the prime.
Commencing in February 2012 the manufacture of key components was
transferred to Scotland from their production site in Lancashire in the UK. Supplier D
has endured significant issues with quality performance since then. In recent times,
supplier D has suffered from an inconsistent quality score against the agreed contracted
performance indicators, which has affected delivery reliability. The main contributor
has been the unstable performance of their key manufacturing facility in Scotland. The
quality problems are compounded by an indifferent delivery score resulting in
fluctuating performance levels. The continuing problems they have experienced since
2012 has contributed to a rich and insightful case study.
Unlike suppliers A, B and C, contact was established through a colleague
currently working at the prime who had recent experience of managing the supplier as
part of their day to day responsibilities. Therefore, initial contact was made by
telephone, followed by planning of the event through email. Again, requests for targeted
roles and responsibilities of potential employee participants were made. The agenda
was developed to accommodate this in order to ensure the most relevant participants
could contribute. The research eventually took place at their UK supply chain
management office in Derby situated close to one of the prime’s main administration
buildings. Four employees participated. All of the participants held managerial
positions within the company, including the companies managing director, operations
manager (based at the Scottish facility), quality manager, and commercial / project
manager.
3.3.1.6 Case Study Supplier E.
Supplier E is a manufacturer of precision machined and fabrication parts supplied
predominantly to aerospace customers. Approximately 90% of their turnover is
generated directly through business with the prime. Now in their 35th year, supplier E
has been a strategic supplier on major aero-engine programmes for the prime since the
late nineties. The company is based in Derby in close proximity to the prime’s main
UK facility, which has provided them with a number of advantages over larger
organisations who compete with them to supply the prime. With just over one hundred
employees working in their Derby facility supplier E can also be classified as an SME.

60 | P a g e
Despite this they hold more approval certificates with the prime than companies of far
greater size and reputation.
However, the relationship between Supplier E and the prime has been a
turbulent one over the years since the commercial relationship started. There have been
periods of significant poor quality and delivery performance that have resulted in
sanctions being imposed by the prime similar to the red flag process, the latest being
five years ago. The sanctions resulted in a much closer working relationship with the
prime. As such, Supplier E has since put measures in place to improve their
performance and aspire to become a class leading supplier.
Supplier E was invited to participate in the research because they had been a
consistently failing supplier that has since managed to turn poor performance into
periods of good performance. It was hoped that these experiences would be shared by
the participants during the semi-structured interview process in order to provide insights
into why the organisation were consistently failing and what it took for them to recover
and achieve a level of stability against agreed performance targets.
Contact and arrangements for the case study were organised via email. The
research took place at Supplier E’s supply chain management office in Derby situated
a couple of miles away from the prime’s main UK manufacturing facility. On this
occasion only one person was permitted to participate in the interviews. The participant
was the company’s Managing Director. The main reason for this was because the
company felt they could not afford to allow other employees time away from their
duties during the working week. However, the Managing Director had been with the
company since the beginning and due to its relatively small size, had an extremely good
view of all aspects of the relationship with the prime manufacturer and therefore proved
to be a rich source of information.
3.3.1.7 First Tier Supplier Participant Roles and Responsibilities.
Table 3.2 provides a brief overview of each of the first tier suppliers that agreed to
participate in the study including the number of parts supplied to the prime and the
complexity involved. Labelled A to E, 19 supply chain professionals, covering all five
companies were interviewed. As is evident from the above discussion, the participating
employees occupied a range of positions and levels within each organization.

61 | P a g e
3 Table 3.2 Overview of Case Study First Tier Suppliers.
Company Product type Number of
Parts Complexity
Number of Personnel
Interviewed
Supplier A
(Pilot) Rigid & Flexible Pipes High Low 5
Supplier B Bearing Manufacturer Med High 5
Supplier C Heat Transfer
Technology Med Med 4
Supplier D Forged Rings (Supply
chain Integrator) High Med 4
Supplier E General Machining Med Low 1
The aim during each case study was to obtain a wide ranging set of views and
perspectives from across the whole spectrum of the participating organization on the
issues being investigated. Due to the nature of the research and its aims, there were a
number of roles within each organization that could contribute to the semi-structured
interviews. A list of targeted job roles and level of responsibility was provided to the
main internal contacts from each participating company during the planning stages of
each case study. It was important to specifically target positions within each company
in order to involve employees who were best suited to answer the individual interview
script and to avoid time wasting. Table 3.3 gives the actual job titles held by employees
from each case study that participated in the research. The topics on which each
participant was interviewed were based on their functional relationship with the
interview subject themes under examination.
4 Table 3.3 First Tier Supplier Participant Information.
Job Title Case
Study
Abbreviation Responsibilities Justification for Interview
Managing
Director
Supplier
D
Supplier
E
MD Accountable for the
organization.
Knowledge of organizational
performance / competitiveness
in the market. Knowledge of
future vision / strategy of the
organization in line with
customers’ strategy and future
market forecasts.
Sales Director
/ Manager
Supplier
A
SDM Accountable for all
sales and new
business
development.
Knowledge of market trends
and future business potential.
Project
Manager
Supplier
D
PrM Project manage
specific customer
contracts.
Direct interface with the
customer. First point of
contact and tasked with

62 | P a g e
3.3.2 Phase One Stage Two – Prime Manufacturer Data Collection Protocol.
To avoid an unbalanced one-sided viewpoint, a dyadic exchange (Cox et al., 2001)
featuring the prime’s perspective on the issues being researched was a critical
requirement for this study. This involved inviting specific employees from the prime to
participate in semi-structured interviews at the prime’s Derby facility. The case studies
were conducted separately from the supplier case studies. It was a deliberate strategy
not to link the prime participants with specific suppliers in order to avoid adversarial or
defensive issues arising.
solving all problems / issues to
ensure supplier consistently
achieves the agreed
commercial targets.
Operations
Manager
Supplier
A
Supplier
B
Supplier
C
Supplier
D
OM Accountable for
production,
manufacturing
quality and delivery
to customer.
Can provide overall picture of
organizational performance
i.e. quality / manufacturing
improvements and efficiency
programs. Be aware of best
practice / standards within
industry and within alternative
industries.
Commercial
Manager
Supplier
A
Supplier
B
Supplier
C
CM Contract
management for
both sales and
procurement.
Detailed knowledge of
customer requirements vs
supply chain capability.
Should understand where the
organizations strengths and
weaknesses lie within their
supply chain management
function and how it affects
their ability to be competitive
within the markets they serve.
Quality
Manager
Supplier
A
Supplier
B
Supplier
C
Supplier
D
QM Owner and
gatekeeper of the
organization’s
quality process.
Should provide perspective on
current sub-tier / market
quality capability in line with
company standards.
Purchasing
Manager
Supplier
A
Supplier
B
Supplier
C
PM Overall
responsibility for
quality, delivery and
cost from a supply
chain performance
perspective.
Overall knowledge of strength
and weaknesses of operational
purchasing and existing
supply chain. Will also
understand company
objectives in line with vision.
Buyer
(Operational
and Strategic)
Supplier
B
BO / BS Responsibility for
commercial
relationships with
suppliers and day to
day contract
management.
Overall knowledge of strength
and weaknesses of operational
purchasing and existing
supply chain. The buyer will
have understanding of all
issues concerning quality,
delivery and cost.

63 | P a g e
Table 3.4 briefly describes the prime’s organisational structure and its global
footprint along with key supply chain / purchasing statistics. The purchasing / supply
chain functions provide cross functional support to all divisions of the company. All of
the purchasing / supply chain activities are managed by teams based in different parts
of the world depending on where the suppliers are located. These purchasing teams
provide support for all engine programs covering all commodities in the aerospace, land
and sea parts of the business.

64 | P a g e
5 Table 3.4 Demographic of the Prime Organisation.
Aerospace
Land and Sea
Civil
Large
Engines
Civil
Small and
Medium
Engines
Defence Supply
Chain
Controls
and Data
Services
Strategy and
Future
Programmes
Marine Power
Systems
Energy
Geographical Presence of the Prime Organisation (Including Supply Chain)
Americas Europe, Middle East and Africa Asia Pacific
United States
Brazil
Canada
Mexico
United Kingdom
Africa
Austria
Belgium
Croatia
Czech Republic
Germany
Finland
Denmark
France
Italy
Norway
Poland
Russia
Saudi Arabia
Sweden
Turkey
UAE
Australia
China
Hong Kong
India
Indonesia
Japan
Malaysia
New Zealand
Singapore
South Korea
Thailand
Vietnam
Supply Chain Management Key Statistics
Supply Chain includes 25 major supply partners
80% of engine is procured through the supply chain
Handle 200,000 part numbers per year – 260 million individual parts
Manage a total of 15,000 first tier suppliers across 70 different countries
The main objective of the global purchasing function is to develop and deploy
purchasing strategies that deliver reliable, safe and cost-competitive supply chain
solutions across market sectors. That involves developing optimum solutions within the
supply chain ensuring that quality and delivery are agreed and consistently achieved by
first tier suppliers. Along with eliminating waste and developing breakthrough
technologies, there is also a large focus on reducing costs and increasing
65 | P a g e
competitiveness within the gas turbine industry. Therefore, effective management of
suppliers is critical to achieving that aim.
The purpose of this stage of the research was to identify whether or not the
perspectives of the prime’s participants on supply chain failure and why it persists,
agreed and correlated with the observations and perceptions from the first tier suppliers.
Comparisons would significantly strengthen the conclusions drawn from the first tier
participants and importantly the literature identified during Chapter 2. The overall
dyadic findings from the exploratory phase sought to enrich the findings from the first
set of case studies and strengthen the development of the causal loop model.
3.3.2.1 Prime Manufacturer Participant Roles and Responsibilities.
Due to the research aims and the subsequent interview questions being asked, there was
a wide breadth of employees within the prime’s organisation who could have
potentially have contributed to the study. The methods adopted for the collection of
data was to target experienced supply chain professionals with knowledge of all
processes and procedures carried out by the prime in conjunction with the supply chain.
Ideally all participants would have experience of working with at least one of the first
tier participants from the first tier case study research, especially during times of
consistent failure. It was hoped that they would therefore be able to reveal and articulate
cause and effects of failure from the buyer’s perspective.
In order to gain access to potential participants, the author contacted two
previous colleagues (both former managers of the author) and asked if they would be
interested and willing to participate in the research and also to help identify and enlist
appropriate individuals with the requisite experience and occupying target positions to
participate in the research. Both contacts agreed to help and between them they
managed to enlist a group of 11 supply chain professionals from the prime to take part
in the interviews. The roles and responsibilities of the participants who took part in the
study are documented in table 3.5.

66 | P a g e
6 Table 3.5 Prime Interview Participant Information.
Job Title Abbreviations Responsibilities Justification for Interview
Regional
Purchasing
Executive
RPE Overall responsibility for
quality, delivery and
commercial
performance. Reporting
status to senior
management.
Overall knowledge of strength
and weaknesses of operational
purchasing and existing supply
chain. Will also understand
company objectives in line with
vision.
Regional
Purchasing
Manager
RPM Responsibility for
quality, delivery and
commercial performance
of a designated
commodity.
Knowledge of strength and
weaknesses of operational
purchasing for a designated
category.
Purchasing
Development
Manager
PDM Responsible for
identifying and
improving all aspects of
the purchasing process.
Overall knowledge of strength
and weaknesses of current
process and systems being
utilized within the supply chain.
Production
Planning and
Control
Manager
PPCM Accountable for the
complete production plan
for designated
commodities including
original equipment,
spares and new product
introduction.
Responsible for meeting
customer requirements on
designated commodities. This
includes the creation and
deployment of business
continuity plans.
Buyer Team
Leader
BTL Responsible for
managing a team of
buyers within a specific
system / category.
Overall knowledge of strength
and weaknesses of Operational
purchasing for a designated
supply chain. The buyer will
have understanding of all issues
concerning quality, delivery and
cost with the supplier.
Buyer
B Relationship owner with
supplier
The buyer will have detailed and
topical understanding of all
issues concerning quality,
delivery and cost with suppliers
within their designated
commodity team.
Material
Requirements
Planner
(MRPC)
MRP Manages customer
demand profile with the
supplier
Knowledge of all processes
associated with delivery and
manages the demand profile with
the supplier for the prime. All
fluctuations in demand are
managed and communicated by
the MRPC into the supply chain.
Quality Director QD Owner and gatekeeper of
organizations quality
process.
Should provide perspective on
current market quality capability
in line with company standards
and alternate industry
capabilities.
Supplier
Development
Manager and
Technical
Manager
SDTM Is accountable for all
supplier improvement
projects in line with
company business
process deployment plan.
Can provide overall picture of
supplier improvement projects in
line with the future direction of
the organization i.e. supplier
selection criteria vs. existing
supplier improvement programs.
They should be aware of best
practice / standards within

67 | P a g e
industry and within alternative
industries.
Global
Commodity
Leader
GCL Commercial link
between procurement
and sales within the
organization.
Detailed knowledge of
organizations requirements vs.
supply chain capability. Should
understand where the
organizations strengths and
weaknesses lie within their
supply chain management
function and how it affects their
ability to be competitive within
the markets they serve.
Engineering
Project Manager
EPM Accountable for
engineering projects
related to production,
manufacturing quality
and delivery to customer.
Drive projects that directly affect
the future direction of the
organization i.e. quality /
manufacturing improvements and
efficiency programs. They should
be aware of best practice /
standards within industry and
within alternative industries.
All of the participants were representatives of the prime’s supply chain
management division although some were functionally aligned to other departments
such as the production planning and control manager (production planning and control),
quality director (supplier quality), supplier development and technical manager
(supplier quality) and engineering project manager (engineering). Due to the matrix
structure of the organisation, all participants interact with other functions most notably
with engineering, supplier quality and production planning and control but also spares
/aftermarket, logistics and operations management / manufacturing. Therefore, the
participants who volunteered to take part represented a wide spectrum from across the
organisation with regard to the interview topics and could potentially provide valuable
and rich insights to the research project.
3.3.3 Phase One Semi-Structured Interview Protocol.
The key aim of phase one was to seek understanding, insights and clarifications in
relation to the research questions presented in Chapters 1 and 2 by conducting semi-
structured interviews at both the first tier suppliers and the prime manufacturer. The
construction of interview questions was also informed by the literature review. The
following points demonstrate the objectives for the interview process during both the
first tier suppliers’ and the prime manufacturers perspectives:
Understand and document how organisations manage supply chain failure with
a particular focus on failure that persists over a considerable time period.
Develop a definition of persistent supply chain failure.

68 | P a g e
Identify and document how organisations recover from persistent supply chain
failure.
Phase one was divided into two stages; stage one covered semi-structured
interviews with first tier suppliers and stage two focused on participants from the prime.
Phase one sought to identify what participants considered to be the key causes of
persistent supply chain failure. To achieve this aim, themes and concepts discussed in
the literature were also used to guide the development of two semi-structured
questionnaires, one for the suppliers and one for participants from the prime. A copy of
the complete interview questionnaire used for the first tier suppliers is included in
Appendix 29. The major elements of the questionnaires are discussed below.
Both the first tier and prime semi–structured interview protocols had to consider
confidentiality rules particularly in relation to each company’s image, brand and
reputation and also for the protection of all participants. As a result, great attention was
paid to the handling of commercially sensitive and confidential technical information
provided by both sets of participants to protect reputations. It was evident that managers
at the prime placed much more emphasis on protecting sensitive information and
retaining confidentiality than most of the first tier suppliers. As such, before any
interviews could take place, consent from the prime organization was required in the
form of approval from the prime’s legal team and the lead researcher’s university. Prior
to each stage, an ethics document was produced and approved by the university before
the interviews could take place.
Fortunately, permission was gained to use Dictaphones in order to record both
the first tier supplier and prime participants during all of the interviews prior to stage
one and stage two. Interviews typically lasted approximately one hour with each
participant. The major challenge experienced during the interviews at both the first tier
suppliers and the prime was interviewees cancelling or re-arranging the interview time
at short notice.
3.3.3.1 Risk and Contingency Management.
The purpose of conducting interviews on the theme of risk management was to identify
and capture what the first tier and prime participants perceived as the key risks that
could contribute to supply chain failure. The interview questions were also included to
identify the extent of risk management practices and understanding of risk at the first
9 Appendix 2 – A Copy of the complete interview questionnaire used for the first tier suppliers.

69 | P a g e
tier suppliers and the prime. This included identifying what methods / tools, if any, were
being used to capture risks which would enable comparisons to be made with current
literature. Further to this, questions were asked that sought to identify the level of
participation in the risk management process internally at first tier suppliers and the
prime and also joint buyer / supplier risk assessment initiatives. The key driver behind
these questions was to identify whether deficiencies in the risk management process
could contribute to supply chain failure. Further questions included in the interview
script sought to capture sourcing risks. These types of questions were related to the
transfer of risk from the prime to the first tier supplier and whether such an activity
could also increase the risk of supply chin failure.
Contingency management was also included in the research. These questions
were asked in order to understand the macro effects of external sourcing on the prime.
The principal aim of the questions asked on this subject were to identify if outsourcing
increased the risk of supply chain failure. The questions were also included to identify
what measures, if any, the prime or first tier suppliers conducted for contingency
management. The reason for including questions on the subject of contingency
management was to enable comparisons to be made with current literature and to
identify if the findings confirm or refute the literature.
3.3.3.2 Quality Management.
The purpose of conducting interviews on the theme of quality management was to
identify and highlight common causes of supply chain failure from a technical or
process perspective. An aim for the research was to capture and understand the level of
intuitiveness of the prime’s quality management system and whether it was easily
adopted and interpreted by first tier suppliers. A further aim was to identify and capture
potential gaps in the effectiveness of the quality management system being used by the
prime and to understand if, how, and why it might contribute to supply chain failure.
Another key requirement of the interview questions was to capture insights into the
extent to which first tier suppliers conducted the quality management system with, and
passed the requirements of the system to their own sub-tier suppliers. General
perceptions of the quality management system from both sides were also sought. The
aim was to capture how both sets of participants viewed the overall robustness of the
system and whether it helped prevent failure or possibly contributed to causing failure.
The effectiveness of the system included the understanding of how failures were

70 | P a g e
managed by both the prime and first tier suppliers. For example, an area of investigation
was to identify the extent to which exercises were carried out in order to establish root
cause of failure and also understand the prevalence of short term quick fixes carried out
in order to minimise disruption.
Questions aimed at identifying the general perceptions of the auditing regime
conducted by the prime were also asked of both the first tier and prime. The questions
sought to identify the methodology behind audit schedules and to understand
perceptions of the effectiveness from both sides of the dyad. Questions designed to
capture understanding of ISO accreditations and whether they reduced the risk of failure
in the supply chain were also included for both sets of participants.
3.3.3.3 Power and Relationship Management.
For reasons of practicality and time constraints it was decided to amalgamate the power
and relationship management related questions into one set of semi-structured interview
questions for both the first tier and prime participants. The purpose of conducting
interviews on the theme of power and relationship management was to identify and
highlight common causes of supply chain failure related to dependency and leverage
between the parties. The interview questions sought to identify the effects of power,
leverage, and dependency on the relationship dynamics between the prime and the first
tier supplier in order to identify if this could be a factor or cause of persistent supply
chain failure. The question set was also intended to identify the effect of relationship
management issues on performance of the first tier and the prime. Further to this, it was
hoped that the participants from both sides of the dyad would provide insights into the
how relationship management issues could affect supply chain performance. The
interview questions sought to capture the effectiveness of communication between first
tier suppliers and prime manufacturers and its influence on supply chain failure.
Questions were formulated in order to identify the extent to which communication
could improve visibility, increase leverage and responsiveness. The interview questions
also sought to understand strategic alignment and trust in order to identify the current
relationship between the prime and first tier suppliers and highlight if issues of strategic
alignment and trust could be attributed towards causing supply chain failure. The
questions, responses, comments, and findings from the first tier and prime participants
were also intended to confirm or refute the existing literature and identify if new
knowledge had been obtained.

71 | P a g e
3.3.3.4. Supplier Development.
The purpose of asking questions on the theme of supplier development was to identify
and highlight the effectiveness of supplier improvement initiatives during episodes of
supply chain failure. The interviews were intended to capture if and how supplier
development contributed to preventing supply chain failure over the long term or
whether it had an opposite effect. The inclusion of a semi-structured interview section
on supplier development also aimed to identify and capture the effect of supplier
development on overall performance at the prime. It was also intended to complement
potential linkages with existing literature on supplier development.
3.3.3.5 Performance Management.
The purpose of conducting interviews on the theme of performance management was
to identify and highlight potential gaps in the effectiveness of the performance system
being used by the prime and to understand if, how, and why the performance
management system could contribute to supply chain failure. Questions were also
added to the interview questionnaire in order to identify or confirm similarities with
what the literature has already noted on the theme.
Semi-structured interview questions on performance were created in order to
identify how much visibility the prime has on suppliers and how they are performing
versus agreed metrics. This was to identify how the prime attempts to monitor the
supply chain performance of first tier suppliers against predetermined contractual
targets. The questions were also asked in order to identify if they were successful at
preventing it or if they contributed to causing supply chain failure.
An understanding of how efficient the methods of performance measurement
processes within the supply chain was also sought. These questions were included in
order to gauge the perception from both sets of participants as to the success of the
performance measures that were used by the prime. An important aspect of the
interview script on performance management was to identify the distinction between
performance management and performance measurement within the supply chain and
whether the two aspects complemented each other, or not.
3.3.3.6 Service Recovery.
The purpose of conducting interviews on the theme of service recovery was to identify
and capture the methods used by the prime and also first tier participants to recover
from supply chain failure. The interview questions sought to identify how quickly the
72 | P a g e
prime and first tier suppliers are able to identify problems within the supply chain and
understand how quickly they are able to mobilize resources in order to understand
problems and prevent them from causing disruption. Questions that sought to identify
the number of personnel that the prime and first tier suppliers were able to commit to
tackling failure were included. The set of questions on service recovery was also
designed to identify whether the ability of the first tier suppliers to recover from failure
quickly led the prime to award more work to them, i.e. whether the contemporary
literature on the ‘Recovery Paradox’ in service industries was corroborated in a supply
chain context.
3.3.4 Differences between Interview Topics.
In order to draw comparisons and identify differences between the perspectives across
the dyad (Ellram and Hendrick, 1995), the protocol remained largely the same for both.
The only deviations made from the original first tier protocol document was to amend
all interview section questions so that participants from the prime could provide
answers from their own perspective, i.e. what are the causes of persistent supply chain
failure. Another change was the targeted prime manufacturer roles, responsibilities and
functions were different to those of the first tier suppliers. This was reflected within the
semi-structured interview script presented to the prime participants.
3.4 Research Phase Two – Analysis. Research phase two is the data analysis phase. It has been divided into two stages. Stage
one concentrates on the consolidation and subsequent analysis of all data gathered
throughout research phase one. This includes the identification of common trends and
themes that could be used to identify potentially harmful activities occurring throughout
the supply chain that contributed to failure and its persistence. These are specifically
those events that lead to or cause supply chain failure (Holmberg, 2000). Stage two
aims to conceive, develop, and refine a comprehensive causal loop model that captures
and illustrates cause and effect relationships throughout key functions of the prime and
suppliers’ businesses that result ultimately in supply chain failure persisting over time.
3.4.1 Brief Outline of the Qualitative Analysis Process.
The primary purpose of stage one of phase two was to bring together all of the captured
information recorded during each interview and consolidate it in a format aimed at
making it easier to analyse and interpret (Barrett et al., 2011). All of the information

73 | P a g e
gained from the empirical research process was consolidated into a template10 that made
interpretation of the data more manageable. The template served as a repository for all
transcribed recordings of the semi-structured interview data obtained from the
participants from each of the five case study companies involved in the research.
Essentially, the file was used to record and then subsequently analyse empirical data
from both the first tier supplier and the prime manufacturer participants. The file
enabled the researcher to consolidate large amounts of the data (approximately thirty
five hours of interview data gathered during research stage one). The template
facilitated the focusing and subsequent coding of the data (Stall-Meadows and Hyle,
2010). Figure 3.2 provides a description of how the coding process was conducted
through to the development of causal loop diagrams that combined to create the final
model. Phase two consisted of five steps overall broken down into stage one, which
involved two steps and stage two which involved three steps. The coding process was
carried out with the data sets from both stages of research phase one.
3.4.2 Stage One Qualitative Analysis.
Stage one of Phase Two commenced by adopting an axial coding technique (Yin, 2009)
to analyse the interview data. It consisted of two coding steps as shown in Fig 3.2: step
one is identification of general themes, and step two a consolidation of both the first
tier and prime data collected during the semi-structured interviews. This was carried
out to show trends and / or themes that emerged from the findings. Throughout each
and every interview script key terms and phrases (Basit, 2003) that appeared
consistently in each of the responses were recorded. These were all logged in
preparation for the coding process. For example, questions related to causes of supply
chain failure from a quality perspective would generate terms and phrases such as:
‘meeting specification’; ‘misinterpretation of customer’s drawings’; ‘inadequate non-
conformance processes’.
A full description of each captured term and phrase is given later in Chapters 5
and 6. Often the questions asked yielded consistently repeated responses that were
related to separate themes. A more detailed analysis and description is provided in
Chapter 4 (Exploratory case phase one). The qualitative stage was conducted following
the coding method adapted from Hahn (2008) that involves gathering all of the data
together to conduct the first steps in the coding process. The coding process explains
10 Coding File – Appendix 3

74 | P a g e
how the categorized data is converted into causal variables and then arranged into loops
using a combination of causal coding (Narasimhan and Jayaram, 1998) in order to
capture the systemic thinking of the participants (Groesser and Schaffernicht, 2012).
An explanation of the coding process is described later in Chapters 4 and 5.
2 Figure 3.2 Coding Process for the Development of Causal Loop Diagrams.
3.4.3 Stage Two – Causal Analysis.
At this juncture, the process of generating answers to research questions RQ1, RQ2 and
RQ3 began. The focus of the research and coding process mechanism shifted to
identifying, capturing, and visually demonstrating the causality of persistent supply
chain failure through causal loop diagrams. Stage two starts with step three, which
involves the development of causal loop variables, step four involves the development
of causal loops, and step five the identification of the causal loop quadrants. During
step four, the coding method also changed to incorporate Strauss and Corbin’s, (1990)
thematic coding technique. The aim of step four was to begin the identification of the
causal relationships between each variable (Sterman, 2001). Once the variables linked
together, they form a causal loop that captures and visually demonstrates the effect on
the system (Morecroft, 2009).
During this stage of coding and causal loop development, a process of
identifying the systemic thinking of the participants (Groesser and Schaffernicht, 2012)
was conducted to help form the loops. The eventual structure of all of the loops were

75 | P a g e
then tested during the validation phase three. All of the identified loops joined together
and formed a complete model that captures and demonstrates the causes and effects that
result in persistent supply chain failure. Step five is also a continuation of coding level
three. However, by this point all of the loops have been developed and could now be
positioned into the key top level themes (Strauss and Corbin, 1990). The causal loop
diagrams were constructed by identifying the key variables attributed to failure evident
from the analysis of data. Consistently quoted topics and themes were developed into
variables and placed into categories covered by the most pertinent lenses identified from
the literature, e.g. Risk Management, Quality Management, Power and Performance
Management. The variables were then broken down further into key themes associated
with failure. Using the interview responses as justification, the established variables
were then linked to corresponding variables based on causality, i.e. variables that create
an effect on a process either positively or negatively when linked together (Morecroft,
2009). A more detailed description of the qualitative coding and variable name
formulation process is given in Chapters 4 and 5.
3.4.3.1 The Use of Systems Dynamics – Causal Loop Diagrams.
Causal loop diagramming was adopted as the means to identify, capture, and
demonstrate the mechanisms that allow supply chain failure to persist. The approach is
used in the thesis to show the results of data analysis in model form.
Causal loop diagrams are an important tool for capturing and representing the
feedback structure of systems (Sterman 2001, pp.137). A causal loop diagram is
basically a word and arrow chart that shows interdependencies between variables
(Morecroft, 2009 pp.30). All causal loop diagrams are constructed from the same basic
elements: words, phrases, links and loops with special conventions for naming variables
and for depicting the polarity of links and loops (Morecroft, 2009 pp.39). To illustrate
how causal loop diagram modelling works in simple terms, Morecroft (2009) highlights
the feed-back structure for births and deaths on the population size, which is shown in
Figure 3.3. Polarities are shown using plus and minus signs. The plus sign situated next
to the arrowhead is called a link polarity.

76 | P a g e
3 Figure 3.3 Birth Rate Causal Loop Diagram (Morecroft, 2009).
The diagram illustrates how key variables associated with population size are
linked by arrows. The arrows show the causal influences between the variables (Kim,
1992 pp.2). The key dependent variables are Births, Population and Deaths. The
system’s exogenous variables are the birth and death rates. The birth and death rates
have an effect on the number of births and deaths leading to either an increase in the
population variable or a decrease (Morecroft, 2009). An increase in the birth rate has
the effect of increasing the number of births more than would otherwise have occurred.
An increase in the number of births increases the population size. As shown in Figure
3.3, feedback occurs in the loop because the greater the size of the population then the
greater the chance of more births because the population is larger. In this case the link
polarity denotes an increase in population because of the greater number of births. The
plus sign is described as a positive link polarity because the number of births increases
the population growth more than would otherwise have been the case if the birth rate
had not increased (Sterman, 2001). Such a loop is described as a reinforcing loop. When
the variables combine in this way they continually reinforce to increase the population
growth. This kind of loop is typically labelled with the letter ‘R’ (Sterman, 2000) to
symbolise that the loop has an increasing effect on the system (effect of ‘Births’ on
‘Population’).
Conversely, an increase in population will increase the number of deaths
because a larger population will result in more deaths. The death rate directly
counteracts or balances out the effect of a growing birth rate on the population than
would otherwise have been the case (Morecroft, 2009). If there is an increase in the
death rate then this will have the effect of increasing the number of deaths. An increase
in the number of deaths has the effect of decreasing the population size. Therefore, the
causal link polarity is denoted by a minus sign meaning that the link has a reducing
effect on the loop and decreases the population size. The feedback outcome between
the variables has the overall effect of balancing the population size against the number
Feedback

77 | P a g e
of births. The effect is called a balancing loop and is typically denoted with the letter
‘B’ to symbolise the reducing effect (the effect of ‘Deaths’ on Population).
Feedback between variables can be time dependent, meaning that the cause or
effect can happen over a period of time or be delayed by a period of time. These are
known as ‘Time Delays’ (Groesser and Schaffernicht, 2012). They appear on the
directional arrow between two variables. When simulating a causal loop model, a period
of time is usually incorporated into the model to simulate the effects between variables
(Rahmandad et al., 2009). In order for a loop to be classified as reinforcing (a loop
that continually increases its effect on a system over time), the number of positive
linkage polarities in the loop has to be an even number i.e. 2, 4, 6 etc. (Morecroft, 2009).
If there are an odd number of negative linkages i.e. 1, 3, 5 etc. then the loop has a
balancing effect on the problem being analysed (Morecroft, 2009).
3.5 Introduction to Research Phase Three – Validation. The aim of research phase three was to validate the data collected throughout research
phase one and most importantly to critique the complete causal loop model on persistent
supply chain failure. This was again carried out from a dyadic perspective in order to
further strengthen the methodological rigor of the study (Ellram and Hendrick, 1995).
Research phase three commenced with a review of all previously obtained data.
All of the information gathered during phase one including each of the original
interview participants from both the first tier suppliers and then the prime were given
the opportunity to review the information they provided again. A validation of the first
tier and prime interview scripts was carried out to ensure that the information originally
collected was still relevant and topical after the passing of time. The process was a pre-
requisite to the major critique of the causal loop model, which was to be carried out in
a planned workshop in which the model was tested with supply chain professionals
from the prime manufacturer.
The workshop was conducted at the prime’s main facility in the UK.
Observations, inputs and critique from the workshop were then used to create a further
iteration of the causal loop model in order to develop a model that reflected reality most
accurately. The workshop sought to increase the methodological rigour of the model
development process by enhancing the robustness of the research design.
In order to adequately test the data, the validation process was divided into
separate stages (see Figure 3.4). The first stage involved the validation of original

78 | P a g e
interview data provided by first tier supplier and prime participants during research
phase one. The second stage was to conduct a pilot study pre-workshop testing of the
model. The pilot study was treated as a run through of the planned information to be
presented on the day of the workshop. Any issues with the information and material to
be presented were captured here by the participants. A total of three supply chain
professionals participated in the pilot study. One of the respondents had since changed
jobs and was working for another eminent global engineering company with similar
characteristics to the prime. The third stage was the workshop session held at the
prime’s facility.
4 Figure 3.4 Research Phase Three - Validation Process.
3.5.1 Pilot Testing the Persistent Failure Model.
The findings and experiences taken from the pilot study were utilized to develop the
most efficient and effective protocols for the planned workshop. The first session was
held using video conferencing facilities due to the location of the participants in relation
to the researcher. Approximately one week prior to each session, the participants were
sent a brief supporting document that explained causal loop diagrams and how they
worked. At the beginning of each meeting a brief explanation of how causal loop
diagrams are constructed and what they try to show, was given. The causal loop model
was systematically presented and explained from the bottom up. Each loop was
explained in sequence until the entire model was built up (see example slide figure 3.5
below). It was anticipated that there would be much discussion during each session;

79 | P a g e
therefore they were both scheduled to take around two hours, which turned out to be
sufficient.
5 Figure 3.5 Construction of the Causal Loop Model Explained in Sequence.
Commentary explaining each variable and linkage was given to describe every
stage of the development process from creating individual loops leading to the
formulation of the complete model. Each participant was asked to comment on the
overall construction of the model and the rationale behind its meaning. They were
consistently asked throughout the exercise if they understood the thought processes and
thinking behind each of the loops and whether they thought it was an accurate
representation of reality. Comments on the final structure and set up of the model was
also sought and captured. This was done in order to encourage a participative approach
to the session to ensure that the participants would fully interpret how the loops were
constructed and what each loop was seeking to convey.
3.5.2 Semi-Structured Interview Data - First Tier Suppliers and Prime
Participants.
The main purpose for seeking validation of the semi-structured interview findings was
to identify if the participants subsequently disagreed with any of their original
observations given during exploratory phase one. Any updated information was then

80 | P a g e
used to further improve the causal loop model, presentation and protocol prior to the
validation workshop held at the prime.
The first tier supplier validation process involved returning to each facility and
conducting the interview again with the original participants. The prime validation
process was conducted exclusively via email.
3.5.3 Prime Workshop – Model Validation and Workshop Strategy.
The validation workshop held at the prime manufacturer represented a key milestone
for the overall research process. The primary purpose of the workshop was to bring
together experienced supply chain professionals with differing levels of seniority to
validate and critique the persistent supply chain failure model and provide topical,
relevant and valuable insights as to whether the model presented to them adequately
reflected the ‘reality’ of managing aerospace supply chains. All comments, opinions
and structured criticism were captured on a Dictaphone and also on flipchart paper. The
information obtained from the validation workshop was then analysed and used to
improve and refine the causal loop model. In the event that the participants disagreed
with any of the identified themes, they were encouraged to explain what they thought
did not work or why they did not believe the loops reflected reality adequately. The
participants were then asked what they would change and also to provide suggestions
on how they thought the themes should be structured or worded to better reflect reality.
The opportunity to validate the finished model with highly knowledgeable personnel in
the prime organisation provided rich additional insights.
A total of nine professionals employed by the prime took part in the workshop.
Two of the nine professionals also took part in the semi structured interviews during
exploratory phase one. The remaining seven participants did not take part during
exploratory phase one, this meant that the majority of the participants were completely
new to the research and provided a fresh perspective. For the remaining two
participants, this was the first time they had seen the failure persistence model and how
it was constructed. Neither were aware that the model would be the output of the semi
structured interview questions. Therefore, they also looked upon the model with a fresh
perspective. The participants came from a range of departments including procurement,
production, engineering and production planning and control. Levels of seniority were
also well represented ranging from Directors to a graduate trainee who was on a job
rotation in the supply chain management function. The workshop session was split into

81 | P a g e
a morning session commencing with a 40 minute presentation that described the
objectives of the study and expectations of the workshop. This was followed by a
breakout session in which the participants were divided into three groups of three, each
supported by a researcher from the University. Two of the groups’ were then tasked
with analysing a specific part / quadrant of the model. The other group was tasked with
analysing two parts of the model as it was divided into four parts. After a lunch break
the afternoon session involved detailed feedback of the model from each group
including suggested changes and also which elements they believed reflected reality at
an appropriate level of detail.
The workshop ended with an open discussion on the potential application and
benefits of the model and descriptions from the participants of how it could be used to
help the prime avoid, mitigate against, or manage persistent supply chain failure. They
were also asked to note any limitations of the model and the research in general if
applicable. Finally, the participants were asked to provide feedback on how the model
could be used to help the organisation to recover from persistent failure situations and
how it could be used as a management tool by the organisation. All of the subsequent
findings are analysed in Chapter 7 (Discussion).
It was anticipated that the content presented would stimulate much debate
amongst the participants. As per the case study research method described by Stuart et
al., (2002 pp.427) the session was facilitated by the lead researcher backed up by two
research team members. The team member’s primary role was to facilitate discussion
concerning the model being presented. During the breakout sessions in the morning
they each operated a Dictaphone in order to capture multiple findings and observations.
Also, in accordance with field research practice as described in the literature (Meredith,
1998) all of the research team were required to take further notes in order to highlight
identified issues with the model from the participant’s perspective.
3.6 Chapter Summary. The discussion above on methodology and research design has introduced the reader to
the approaches and methods adopted for this research study. The Chapter has discussed
the validity and reliability of the research design, which is based on conducting multiple
case studies (Yin 2009). Three phases of the research study are described – empirical
case studies, analysis, and validation. By developing and then following a systematic
process throughout the study during the exploratory phase, qualitative and causal

82 | P a g e
analysis phase, and finally the validation phase, the research design and methodology
has sought to be demonstrably robust (Seuring, 2008). It was clear the research process
needed to be considered with great care and that the three phase approach to validating
the data would be time consuming and fraught with logistical challenges, which is why
all potential risks had to be considered and challenges and mitigation plans had to be
documented.

83 | P a g e
Chapter 4: Exploratory Study, Phase One – Empirical
Evidence and Analysis. The methodology and research design described in Chapter 3 explained how the
exploratory phase was conducted in two stages, i.e. stage one focuses on the first tier
supplier study and stage two focuses on the prime company. In Chapter 4, the evidence
from each case study is presented, consolidated, analysed and discussed in sub-sections
covering each of the semi-structured interview themes.
The investigation carried out throughout this Chapter is integral to the
subsequent development and formulation of the Dynamics of Supply Chain Failure
model. As noted in Chapter 3, the quality management system used by the prime is
called Sabre. All first tier suppliers are required to follow the Sabre quality management
system. The rules and regulations stipulated in Sabre are passed down the supply chain
first by the prime and then by the first tier suppliers into their sub-tiers. Causes of failure
are identified and categorised in accordance with the specified requirements
documented within the Sabre management system.
4.1 Research Phase One – Exploratory Phase observations. This section aims to establish the most consistent causes of failure identified by the
target research group and to put them into specific categories and themes (Miles and
Huberman, 1994). Each of the following sections documents and analyses key
observations, empirical evidence and narrative descriptions obtained from the
exploratory phase. The analysis conducted throughout this Chapter represents steps one
and two of Figure 3.2 of the coding process presented in Chapter 3. The captured
evidence is organised using the principal themes identified from the literature. Each
sub-section starts by highlighting the key questions asked of participants under the
relevant semi-structured interview theme, providing the reader with the context behind
the observations captured during each interview. In the interests of space the indicative
evidence presented to support the findings has had to be selective. Also, as will become
evident, some of the issues identified under different themes are related and inter-
mixed. All of the sub-themes captured under each main theme are consolidated into
tables, which pinpoint key factors influencing supply chain failure in some way. The
information captured in each table is then consolidated under identified themes at the
end of the Chapter in Table 4.7.

84 | P a g e
4.1.1 Risk and Contingency Management – First Tier Suppliers Perspective.
Questions used in the first tier semi-structured interviews on risk and contingency
management were:
1. What are the key risks that contribute to failure for the organisation?
1.1. Are risk assessments carried out to ensure these issues are identified and
managed before they can contribute towards chronic long term failure
scenario?
2. Can failure to identify and manage key risks at critical stages in a contract
contribute to long-term chronic failure? If so how and when?
2.1. Who is considered responsible for your organisations identification and
management of risks?
2.2. Are these identified risks flowed down to other members of the organisation /
project teams?
3. What in your opinion are the key macro-economic factors that can contribute
towards long term chronic supply failure?
Table 4.1 provides a consolidation of the sub-themes captured in the semi-
structured interviews conducted across the first tier suppliers on the subject of risk and
contingency management.
Table 4.1 First Tier Suppliers - Risk Management.
All of the participants said that failure to identify and manage key risks at critical
stages in the contract formulation stage could contribute to failure. A key identified risk
that was cited as a cause of failure from a risk management perspective was the
existence of uncertain demand profiles. It was made clear that the uncertainty with the
Theme General Sub – Themes (Coding Level One) Table 4.1
Risk Management
(Including Contingency
Management)
Regular material schedule changes by the prime.
Lack of planning capability in the industry.
Poor lead time adherence by the prime.
Component specifications regularly issued late by the prime.
Untimely responses to questions asked by first tier suppliers by
the prime.
Failure by the prime to manage and mitigate key risks at critical
stages during contract formulation process.
Limited access to rare and exotic materials specified by the
prime.
Sub-tier suppliers not being able to get funding from the banks
due to cash flow issues because of late payment by the prime.
85 | P a g e
material schedules was not being caused by volatile shifts in demand further upstream
from the end customer. Aerospace demand is relatively stable compared to other
industries. It was mentioned that the uncertainty in demand schedules has come about
as a consequence of poor planning by the prime and not as a result of industry demand
fluctuations. A consequence of poor planning was shown to manifest itself in poor lead
time adherence by the prime, which was also said to perpetuate risk of failure for the
first tier suppliers.
To further compound the risk of failure, it was noted that component
specifications were regularly issued late by the prime combined with a lack of
responsiveness from the prime when first tier suppliers requested further technical
clarification regarding newly submitted specifications or drawings. This was especially
the situation when the prime specifies exotic or rare materials that need to be procured
expediently in order to meet the requested delivery dates. Delays in delivery could place
the first tier and sub-tier suppliers at financial risk due to the ensuing cash flow issues
that could occur with sub-tier suppliers not being paid, potentially leading to poor credit
ratings.
The purpose of investigating risk management during the exploratory phase was
first to capture the activities or events that the participants perceived as key risks to the
business and second identify the level of awareness within the supply chain of risk
management techniques. The most consistently identified issue within the planning
process concerned the number of material schedule changes made by the prime.
Supplier D manages between fifteen hundred to two thousand parts on behalf of
the prime, which the participant viewed as representing a significant challenge to their
organisation and their sub-tier supply chain. Participant OM–D suggested that
consistently changing material requirement dates can have a huge effect on the risk and
contingency management process of the supplier: “Fifteen hundred part numbers are
currently being managed. Some are dormant though because this is a legacy low
volume commodity, predominantly legacy engines. Difficult to manage failure due to
the low volumes and infrequency of demand, this is where we (supplier D) sometimes
struggle”.
Participant OM–D also indicated that issues concerning delivery performance
were often problematic enough for the supplier to commence conducting root cause
analysis. The subsequent analysis had identified that regular material requirement

86 | P a g e
changes did cause disruption: “We can expect to get somewhere in the region of four
hundred and seventy changes a week on average. Each of those has to be flowed down
to the relevant sub-tier and each of those have to say whether they can meet the new
dates imposed by the customer. Quite often that causes more confusion than anything”.
Participant OM–D also shared their belief that the overall planning capability in
the aerospace supply chain was consistently poor with many first and sub-tier
companies lacking capability within the planning discipline. The lack of capability in
planning was cited as a risk that could contribute to supply chain failure should the
effects of poor planning come to fruition: “There is a lack of planning, not many
companies are good at planning. Very poor at management and planning of projects”.
This was due to an inability to correctly align their supply chain planning tools
with those used by the prime. Participant MD-E conveyed that something as simple as
failing to monitor issues closely at any time during the process could result in a failure
happening somewhere. However, participant CM-C provided their opinion on the most
common risks that lead to failure from their perspective: “Late specification issued by
the customer, changes to the specifications. Also, untimely responses to questions (this
is all happening on the XWB at the moment) which means we have to run around in
circles in order to keep to deadlines.’’
Untimely responses to questions was a common theme that has permeated
throughout the first tier research process and was mentioned during the interviews on
other domains. The importance of adequate communication required to either prevent
failures from happening or to quickly resolve them was noted as a key concern for the
first tier participants, especially on matters concerning legacy components.
A universal risk that has affected all first tier suppliers and their sub-tier supply
chain in recent years has been the economic crisis (Natarajarathinam et al., 2009). A
consequence of that has been discussed by the first tier suppliers. They have said that
they now considered the wider macro-economic environment when managing risks.
The majority of risks listed can be attributed to cash-flow / funding issues. Participant
MD-D suggested that obtaining finance was currently a big risk to sub-tier suppliers.
This includes businesses not being able to get adequate funding from the banks or banks
withdrawing funding because of weak business cases. Participant MD-D explained how
it causes disruption to companies within the supply chain: “This is happening now
where funding is being withdrawn causing business to go into administration which in

87 | P a g e
turn causes disruption to this business. Liquidity challenges for the banks, i.e. suppliers
cannot grow or expand because risk of not being able to make loan repayments is high.
The banks are very willing to lend money to anyone who doesn’t need it but are less
willing to lend to those who do”.
Perhaps surprisingly, none of the participants suggested that sub-tier suppliers
or customers in financial trouble would not be selected to participate or be part of a
supply strategy as a consequence of financial problems despite the issue being identified
as a potential cause of supply chain failure.
4.1.2 Risk and Contingency Management – The Prime Perspective.
Questions used in the semi-structured interviews held at the prime on risk and
contingency management were:
1. What are the key risks that contribute to failure for the organisation?
1.1. Does the prime review issues that caused previous quality / delivery failures
via risk assessments when contracting with a supplier?
1.2. To what extent is the prime accountable for learning and sharing information
of previous mistakes with the supplier?
1.3. Are risk assessments carried out to ensure these issues are identified and
managed before they can contribute towards a repeat chronic long term failure
scenario?
2. Does the prime conduct joint risk assessments with suppliers prior to key milestones
during the contract formulation process?
2.1 If so how? If not why?
3. What in your opinion are the key macro-economic factors that can contribute
towards long term chronic supply failure?
3.1. What actions (If any) are put in place to protect the prime from this causing
chronic long-term supply failure?
Table 4.1A provides a consolidation of the sub-themes captured during the
semi-structured interviews on the subject of risk and contingency management held at
the prime.

88 | P a g e
7 Table 4.1A Prime Participants – Risk Management.
It shows how participants from the prime focused on the actual risk management
process in their responses, i.e., maturity, robustness and effectiveness of the process
(Zsidisin et al., 2000) as being a risk to their business rather than describing what
constitutes a risk of failure. The participants described how risk management as a
discipline was still quite new to their business. They also described how joint risk
assessments were not being conducted during the contract formulation stage suggesting
that this was a consequence of traditional arms-length relationships with suppliers. It
was discussed how first tier suppliers were only invited to participate ‘post event’ when
a failure had already occurred and was already causing disruption. This was despite an
overarching uncertainty regarding available capacity within first and sub-tier supply
chains. This was also combined with observations that highlighted a perception that risk
to any project was perpetuated by the prime due to the setting of unrealistic project time
scales. All of these comments were captured despite there being clear
acknowledgement that the lack of planning capability at the prime was a major risk.
All of the participants focused on the prime’s internal processes throughout the
interview and concentrated on highlighting how their organisation approached the
identification of risk in the supply chain. It was noted by participant EPM that much of
the suppliers’ risk management / risk mitigation process is focused on mitigating risks
that have been caused by the prime themselves: “I think a lot of it is around the
planning. I think we tend to not plan very well and have timescales that are not realistic.
So we are always chasing our tails to make things happen. So we have got the situation
whereby they want this in six months when really it needs a year to go through the
Theme General Sub – Themes (Coding Level One)
Risk Management (Including
Contingency Management)
Issues with overall robustness / effectiveness of the risk
management process at the prime.
Risk assessments are not considered important enough to be
conducted during the contract formulation process between the
prime and first tier supplier.
First tier suppliers participate in risk assessments ‘post event’.
Recognised lack of competency in planning, including the
setting of unrealistic project timescales.
Regular uncertainty over available capacity in the industry
affecting the prime’s perception of demand.
Arms-length relationships with first tier suppliers.

89 | P a g e
validation and delivery and all those kind of things. Normally the timescales are that
tight that you are always chasing and pushing. This is one of the key reasons I believe
that setting unrealistic timescales sometimes results in your validation strategy being
reduced so you don’t do enough validation leading to quality issues and delivery
problems. This is because you are trying to condense everything into a much shorter
time space”.
Until relatively recently, the management of risk has been seen as a low priority
and kept in the background. Participant EPM noted how suppliers are asked to
participate in risk assessments post event but are not required to conduct a risk review
during the contract formulation phase: “Normally what happens is, if you have got a
specific problem which might be an engineering problem or whatever, you would have
the supplier as part of the risk assessment team to try and flush out and get right down
to the root cause problem so yes. Now whether they do it jointly during contract
formulation I don’t think so. I think they will have a risk assessment to try and flush out
the reasons why and where in order to try and rectify it. It is not normally done during
contract formulation stage”.
Despite there being a requirement for suppliers to be involved in risk
management processes, there was acknowledgement that relationships were still very
much at arms-length. Participant EPM explained how the prime had a dedicated risk
management department with risk experts whose role it is to facilitate risk assessments
at the prime. These experts help clarify the difference between a risk and an issue during
risk review sessions. However, participant EPM was asked whether the inclusion of a
risk assessment helped during a crisis and when supply chain failure was happening:
“Not really, it kind of goes into panic mode. Firefighting kicks in. People are thrown
at it. Invariably money is thrown at it and maybe a little later in the day they do look at
the risk assessment but to be honest I think it is more firefighting and money and men
are thrown at it”.
Two key risks for the organisation were identified as available capacity in the
gas turbine manufacturing supply chain and the prime’s perception of future demand.
The availability of capacity in the supply chain was specifically highlighted by
participant PDM as a key area for concern: “Overall capacity within the industry, be
that raw material availability and or capability that is directed into other industries. A
lot of what we have tended to think about is focusing in on the suppliers themselves and

90 | P a g e
on their processes. In reality their ability to conduct increasing levels of business for
us is very dependent on them being able to secure resource to do so. So that would be
my biggest concern, is there enough capacity in the industry to deliver what we need
for growth going forwards?”
Further to the comment another important observation was the
acknowledgement made by participant EPM regarding the prime’s lack of competency
in planning components into the first tier supply chain, especially concerning new
product introduction planning. The participants’ viewpoint corroborates observations
made by participants from the first tier supply chain, suggesting that planning capability
is not adequate in the gas turbine manufacturing industry. From a contingency
management perspective, it was mentioned that the prime’s first and sub-tier supply
chain covers a vast footprint in a number of environmental and geo-political hotspots.
These comments highlight the level of immaturity that has existed at the prime
concerning contingency management. However, the captured observations show that
the subject has only started to be seriously followed due to events that have occurred
over a period of time. Despite this, the subject still appears to be a relatively new
concept at the prime.
4.1.3 Quality Management – First Tier Suppliers Perspective.
Questions used in the first tier semi-structured interviews on quality development were:
1. What are the key factors that contribute to quality failure within the organisation?
2. How can you identify that the system is robust and can control a failure by
preventing it from becoming chronic?
2.2 What is the process for managing a reoccurring failure?
3. Does your organisation conduct process failure mode effects analysis PFMEA to
ensure repeat problems don’t occur?
3.1. Is this part of your sub-tier selection criteria to control potential failure from
occurring down the supply chain?
Table 4.2 is a consolidation of the comments and sub-themes captured during
the interviews based on quality management held with first tier suppliers.
8 Table 4.2 First Tier Suppliers - Quality Management.
Theme General Sub – Themes (Coding Level One) Quality Management Consistently failing to meet the prime’s specification on parts.
Confusion surrounding the prime’s auditing schedule.
Misunderstanding of ISO9001 accreditation and function.

91 | P a g e
One of the strong emergent themes involved first tier suppliers consistently
failing to meet the prime’s specifications. Although the first tier suppliers
acknowledged that they had been involved in causing disruption due to failure, the first
tier participants partly attributed this to a lack of understanding of the prime’s technical
specifications. These observations were also followed up by insights that suggested
drawing definitions were regularly supplied late by the prime. It was also noted that
when the first tier suppliers did eventually receive the drawings they were often
misunderstood. There was also confusion as to the purpose of a customer audit. The
perception appeared to be that audits were carried out by the prime as a result of failure
and not to ensure standards are being met in order to prevent failure from happening in
the first instance. Again, inadequate planning of newly designed components was cited
as a potential cause of persistent supply chain failure.
The most commonly cited issue was not being able to consistently meet required
specifications. Participant QM–A provided a clear definition: “Anything that doesn’t
meet the specification or the customer requirements internally or externally”.
Further responses concerned the presence of ISO certification11. It is a
mandatory requirement for first tier suppliers to hold ISO AS9100 accreditation in order
to supply product to the prime. Selecting suppliers who hold the accreditation is a key
control mechanism used to reduce the risk of non-conforming products being supplied
and improve supply chain performance (Yeung, 2008). However, none of the
interviewees believed that the presence of the AS9100 certification meant that quality
failure was less likely to occur. Participant QM–B noted the following; “The ISO9000
is just an in-depth review of the quality assurance system. The system should be able to
give adequate assurance that the product conformity is going to be the absolute goal
for the company. Naturally nobody wants to see the supply chain being disrupted with
a huge amount of non-conformity going out of the factory. Therefore, the quality
11 ISO certification – Designed to ensure that companies have processes and procedures that guarantee
that a good level of quality for the product being supplied. This is awarded by a third party who is
cerified to award the standard.
Drawing definitions being supplied late by the prime.
Misinterpretation of the prime’s drawings.
Inadequate planning for newly designed components / end
product.
Poor communication throughout the supply chain.
Poor training by the prime on how to adhere to quality system.

92 | P a g e
assurance system is its safeguard but it doesn’t mean to say that it will stop a supply
chain getting saturated with non-conformances”.
Despite ever changing aerospace industry quality standards, which are further
amplified by the prime, some of the participant first tier suppliers have not significantly
improved their quality management system or invested in new equipment or machinery
in line with new requirements. However, some are adopting important improvement
practices in order to compensate. Due to an aging issue with tooling and machinery,
participant QM-B mentioned that they had recently started an initiative to conduct ‘gage
repeatability and reproducibility’12 on all of their measuring equipment: “We are
currently on a programme whereby we are doing all of the gage R&R on all of our
measuring equipment that we have onsite with various types of products and that is
being done with various types of people. We most certainly will see benefits from these
activities. It is the first time that we have had complete confidence in the way we
measure our tooling. If you don’t have complete confidence in the way you are
measuring your finished goods then how can you have complete confidence in what you
are shipping out. Eventually the project will be used to look at all of the machines”.
A further factor identified during the interviews was that the first tier suppliers
tended to only have the resources to audit the quality performance of their key suppliers
once a year. This represents a risk to the prime as there are a multitude of potential
issues upstream that could cause a failure throughout the supply chain, i.e. human error,
engineering issues, material issues, and misinterpretation of customer’s drawings,
inadequate planning, poor training and poor communication. Participant QM-D
explains the challenges faced by the supplier in order to fully comply with Sabre: “Due
to the fact we have about one hundred and sixty sub-tiers (suppliers) we can’t audit all
of those suppliers more than once a year so we do a risk assessment based on cost and
volume of the parts and also historical risk with the suppliers. We audit suppliers every
month but we don’t get across to every supplier”.
The analysis of the first tier quality management findings strongly identifies the
following issues – not all first tier suppliers are adequately equipped to cope with the
pace of changing requirements in the aerospace industry. Adoption of improvement
techniques usually associated with lean manufacturing (Dyer and Nobeoka, 2000) and
12 Gage R&R – Process for ensuring that measurement gages for product inspection are statistically
accurate for each measurement of a batch.

93 | P a g e
continuous improvement (McAdam et al., 2008) seems to be very slow and may lag
behind other industries. Not all first tier suppliers have the resources to adequately meet
the requirements of the prime’s stringent quality management system, particularly with
respect to monitoring their own supply base.
4.1.4 Quality Management – The Prime’s Perspective.
Questions used in the semi structured interviews held at the Prime on quality
management were:
1. What would you describe as a ‘quality’ failure?
2. Can causes of quality failure in the supply chain be attributed to the supply chain
only or is the prime accountable also, if so why?
2.1. What effect does a long term chronic failure have on the prime?
2.2. What are the key factors that contribute to quality failure within the supply
chain?
3. Does the existence of the ISO certification mean that quality failure (Long-term)
are less likely to occur in the supply chain?
3.1. Does the prime ensure that your suppliers have a robust quality system that
can quickly identify, improve and control quality failures above and beyond
ISO certification?
Table 4.2A provides a consolidated view of the themes captured during the
interviews on quality management held with participants from the prime.
9 Table 4.2A Prime Participants – Quality Management.
Consistent with the observations taken from the first tier participants, the
participants from the prime also noted how inconsistent interpretations of component
Theme General Sub – Themes (Coding Level One) Quality Management Inconsistent interpretations of prime’s part specification and
drawings.
Overly complex quality management system at the prime.
Lack of training for sub-tier suppliers in using the prime’s QMS.
Poor information flows on quality issues through supply chain.
Inadequate documentation: paperwork being incorrect or part
marking errors by first tier suppliers.
Overall lack of internal capability to adequately manage quality
management system.
Weak auditing of supply chain capability combined with
misinterpretation of ISO accreditation at the prime.

94 | P a g e
specifications and drawings greatly increased the risk of failure. Again, it was
mentioned that this could be the result of an over complicated quality management
system. The prime participants also noted how information flows through the supply
chain were currently poor. This limits the chances of further improving understanding
of the quality management system throughout the supply chain. A similarity between
the observations taken from the prime participants compared to those from the first tier
suppliers was the acknowledgement that there was a lack of capability internally to
manage the quality management system at the prime. The prime participants suggested
that there was a lack of capability to manage the prime’s quality management system
throughout the supply chain. Another similarity was the apparent inconsistent
application of the ISO accreditation. The participants from the prime also believed that
the presence of ISO accreditation did not reduce the risk of failure.
In addition to being asked for their insights on the causes of quality failure, the
participants were asked if they thought that it was solely the responsibility of the first
tier supplier or whether the prime was also responsible in some way for the failures.
The participants identified that quality failures were on the whole a joint problem.
Participant RPM acknowledged that some of the prime’s inefficiencies can perpetuate
problems in the supply chain: “You can say both; ultimately the supplier is accountable
for both i.e. the product delivery and is responsible for quality. The prime can
contribute to that quality issue in numerous ways in terms of interpretation of
specification and drawings. Vagueness around our expectations i.e. people interpreting
our drawings differently etc. We can contribute”.
Participant SDTM provided a stronger response to the questions focused on
causes of failure by providing an insight into the culture of quality at the prime towards
their supply chain: “This organisation is definitely accountable; it makes its systems so
complex that it sets a supplier up to fail. It makes it so difficult to deal with it that it sets
the supplier up to fail. In my opinion some of its measures are set up for the supplier to
fail”.
Observations from the interviews suggest that there is an understanding of
potential causes of quality failures to some level. However, there was also an underlying
narrative concerning how the prime is slow to do anything about it or is seemingly
accepting of issues as simply ‘the way things are’ (Levitt and March, 1998). Participant
RPM, whose role it is to manage these issues on an operational level provides insight

95 | P a g e
into what the main issues may be: “There is always a spread in any failure and our
organisation usually has some part to play, whether it be lack of clarity of requirements
or lack of training given by our organisation to the supply chain. There are very few
failures that are entirely black and white, i.e. one person rather than the process is
responsible. The vast majority I would say are 80/20 one way or the other.
Issues that can occur throughout the supply chain are a lack of clarity and
understanding of standards and specifications. This is also the case with poor
information flows about quality issues where there is a standard set of working
instructions that have not been adequately passed down to first / sub-tier suppliers. It
was also noted how short cuts were often made to documentation in order to rush them
through to first tier suppliers. Participant QD described how constant quality issues such
as paperwork being incorrect or part marking errors, for example one digit being wrong,
were classified as failures by the prime. The prime directly manages only their first tier
suppliers because of the size of the supply chain, transferring sub-tier management
responsibility onto their first tier suppliers. This inevitably causes significant resource
issues for the first tier suppliers but also to the prime who subsequently needs to validate
and monitor the first tier supplier’s own supplier management process. Participant QD
explained why this is the case: “We audit the first tiers and the sub-tiers are managed
by the first tiers, we pay the first tiers to manage the sub-tiers [as part of the component
price]. The size of the triangle gets exponentially bigger when you try and look at the
sub-tiers as well. We couldn’t resource it. There are hundreds of audits carried out
each year on our first tiers alone. We make sure that they have a level of control. Part
of the Sabre compliance audit is that they check the controls of what the sub-tiers have
in place”.
A conclusion drawn from the quality management interviews conducted at the
prime points to the possibility that neither party has the resources and capability to
adequately manage the prime’s extensive quality management system, in particular in
relation to the sub-tier suppliers. Despite this, much of the risk is transferred into the
supply chain on the assumption that suppliers with ISO accreditation are less likely to
cause failures than others without. Those assumptions contribute to increasing the risk
of failure within the supply chain.

96 | P a g e
4.1.5 Power and Relationship Management – First Tier Suppliers Perspective.
Questions used in the first tier semi structured interviews on power and relationship
management were:
1. What are the key factors that can contribute to chronic long-term failure for the
organisation?
2. On what criteria does your company select its potential customers?
2.1. Do you have favoured / non-favoured customers?
2.2. If so what is the criteria for this, how do you decide what who is a favoured
customer as opposed to a non-favoured customer?
3. Do you have a maximum leverage cap with your customers and suppliers? If so
what is it and why?
3.1. How quickly and easily can you re-source if a supplier is not performing thus
effecting your performance?
Table 4.3 presents the consolidated sub-themes captured from analysis of the
semi-structured interviews conducted on the subject of power and relationship
management at the first tier suppliers.
10 Table 4.3 First Tier Suppliers - Power and Relationship Management.
A prominent theme that was captured during the interviews with the participants
was how first tier suppliers could become dependent on the prime to provide a large
proportion or the majority of their turnover. It was also found that some first tier
suppliers actively develop strategies to become a sole source supplier to the prime.
Additionally, some first tier participants reported that they were potentially over
leveraged with the prime, which compounds the level of dependency. Poor
Theme General Sub – Themes (Coding Level One) Power and relationship
management. First tier suppliers can become dependent on the prime.
First tier suppliers develop strategies to be preferred supplier or
sole source.
Commercial redress and lack of supplier attention can lead to
very hostile relationships.
Lack of leverage caps resulting in ‘over leveraged suppliers’ with
the prime.
Poor communication with prime when supplier deemed not
important.
Critical components are difficult to resource due to the prime’s
current process for changing source of supply.
97 | P a g e
communication was mentioned as being an issue within the prime’s supply chain.
However, a perception of the cause of poor communication was that the prime does not
deem the first tier supplier as strategically important. Another interesting observation
concerned how the process used by the prime to change source of supply was perceived
by the first tier participants as notably difficult to achieve.
The interview script sought to capture potential causes of commercial lock in
(Farrell and Klemperer, 2006) and to identify if a level of dependency existed in the
supply chain. Customer dependency on the supplier was also an issue recognised by
some of the first tier participants according to findings from the first tier interviews. To
some extent, these strategies are widespread within the first tier supply chain. However,
participant OM-C pointed out the risks associated with adopting sole source strategies:
“Commercial issues can drive a lot where a supplier can feel that he is not getting any
redress or is getting ignored. He has got quality issues that need customer input or has
a design change requirement that needs looking at but is getting ignored.
Predominantly in the relationship thing, commercial redress / lack of supplier attention
can lead to very hostile relationships that can result in really poor delivery or even non
delivery; sometimes deliveries can be withheld to be used as leverage to get some
attention”.
Equally, participant MD-E stated that their company strategy was to only
contract with customers with whom they are assured of a long term relationship: “If
you are involved with a project from the start you want to work with people who want
to work with you. In terms of customers, customers who we can have a long term
relationship with, recognising that we have to start small to end up big, we are
interested in customers who are in it for the long haul”.
However, although there is considerable research to suggest that developing and
maintaining long term relationships can have a positive effect on supplier performance
(Håkansson and Ford, 2004), this research suggests that over time there can also be
negative side effects such as having too much business with one supplier, described as
being ‘over-leveraged’ in the industry. The importance of communication with the
supplier was noted by participant BS / BO-B: “Quite often a supply chain failure is
caused by poor communication, change of the goal posts, and raw material supply to a
smaller supplier. In situations like this it mainly needs the influence of a larger business
to make it happen”.

98 | P a g e
The participants were aware that being over leveraged with the prime was a
potential problem. However, none of them stated that they had a specific policy to
ensure that business with the prime only represented a certain percentage of their
revenue. In general, however, the participants were very aware that sourcing product
away from one supplier to another could be extremely difficult to achieve because of
the prime’s change of source process. Participant CM-C describes the different
challenges faced: “That depends on the type of product that we are trying to resource,
i.e. if it is a nut or a bolt then it might be a lot simpler to resource than an IP related
product”.
Participant CM-C was describing the difficulties of changing the source of
supply from one sub-tier supplier to another because of the mandatory process that the
prime ensures all first tier suppliers follow, the prime calls this the ‘source change
process’. The first tier suppliers are aware that an onerous source change process can
also work in their favour in case the prime wants to resource product away from them.
Participant MD-E was the only interviewee who said that they could quickly resource
product if a sub-tier supplier was not performing. All of the other companies suggested
that this was extremely difficult for a number of reasons. Participant CM-C stated that
it is not easy and it is very time consuming: “One of the restrictions to that is the source
change process that major customers have, which are quite often lengthy and require
a lot of resource to resolve. This is one of our issues at the moment because we don’t
get the support from our customers that we need to in-order to resource parts”.
It could be argued that some of them hold the upper hand in terms of leverage
and / or positioning. For example, Suppliers A and B are subsidiaries of global corporate
conglomerates and own the design rights (IPR) to the products that they supply. These
companies are far less leveraged in terms of proportion of turnover with the prime. They
have global sales of their products within the industry. The remaining participant
companies are much smaller entities. They produce parts where the designs are owned
by the prime and are far more leveraged towards the prime, engendering a reliance on
orders needed to survive.
4.1.6 Power and Relationship Management – The Prime Perspective.
Questions used in the semi-structured interviews held at the prime on power and
relationship management were:

99 | P a g e
1. What are the key supply chain relationship factors that can contribute to chronic
long-term failure for the organisation?
1.1 Has poor relationship management with suppliers by the prime contributed
towards a breakdown in communication and subsequently poor supplier
performance?
1.2 Does the prime monitor the relationship with all suppliers or does it only
concentrate on key strategic relationships?
2. Does the prime select suppliers who have been known to have been involved in
chronic long term supply chain failure in the past?
2.1 If so why? If not why not?
3. Do you think that suppliers with specific core competencies / IPR are given more
time to recover if a failure starts to become chronic?
3.1 If so why? If not why not?
Table 4.3A provides a consolidation of the sub-themes captured during the semi-
structured interviews on the subject of power and relationship management held at the
prime.
11 Table 4.3A Prime Participant – Power and Relationship Management.
The overriding theme captured during the interviews was how a breakdown in
relationships with first tier suppliers increases the risk of supply chain failure. Further
to this, the prime participants discussed how a lack of relationship continuity caused
the relationship dynamic with first tier suppliers to change. These observations were
directly related to comments made by the first tier participants who suggested that the
prime regularly changed their point of contact, which was also noted by prime
participants during the interviews. A further theme related to the perception that the
prime often failed to deliver on commitments made to first tier suppliers, which led to
Theme General Sub – Themes (Coding Level One) Power Breakdown in relationships can cause failure.
Lack of relationship continuity causes the relationship dynamics to change.
Failure by the prime to deliver on commitments made to first tier suppliers.
Poor information flow throughout the supply chain. Communication is often
inadequate.
First tier suppliers are known by the prime to have strategies aimed at becoming sole
source on rare complex components.
Lack of mature and workable sourcing strategies.
Perception that the prime fails to manage first tier supplier effectively.
Lack of knowledge about who appropriates power in the sub-tier.

100 | P a g e
negative relationships. It was felt by the participants that this could be due to poor
information flow throughout the supply chain.
In discussing potential causes of failure, participants from the prime regularly
mentioned the organisation’s lack of mature and workable sourcing strategies. The
problem was associated with how poor sourcing strategy formulation and deployment
contributed to the prime not being able to manage their first tier suppliers effectively.
This was attributed to the prime not understanding who appropriates the power in the
relationships they choose to form with first tier suppliers. Participant B explains their
perceived limitation “Certain suppliers are the only suppliers who can do certain
things. If the work is complex then we don’t like to pull parts out if they are complex
because supplier B will have the same issue so we will always try to work with the
original supplier. It is very difficult to transfer these out and takes a long time”.
Participant GCL suggested that causes of supply chain failure often began when
the relationship between both sides initially break down. The participant explained how
issues can occur when the nature of the relationship changes. These can potentially lead
to problems: “Issues tend to be where the relationship is broken. Subjective measures,
i.e., people change, thus relationships change and people have a different agenda /
scope on one or both sides. This can result in problems”.
Similar to the comments made during the first tier interviews, the participants
highlighted communication and not delivering on commitments as very important in
developing and maintaining a positive relationship. Participant B explained how good
communication with the suppliers meant the consistent sharing of important
information: “Communication is a big one. It is a big factor. We advise the supplier of
future requirements but never give them the forward load, which damages
relationships. We only advise them of the NPI quantity when we should give the volume
for the full length of the contract which affects price and negotiations. Because we only
communicate NPI batches13 to the supplier they don’t see us as a partner in the long
term which affects our supply chain. Because of this suppliers have refused to quote”.
The strength of the narrative here indicates that poor information flow was not
unusual and can reoccur frequently and / or over a period of time. The opinion given
by participant B was that the prime is aware that their overall communication is
inadequate, yet key supply chain management employees such as the buyers, feel
13 NPI batches – New Product Introduction first production batch.

101 | P a g e
powerless to do anything constructive about it. As previously identified in the study of
power and relationship management, first tier and sub-tier suppliers often identify these
constraints and capitalise on them. They do this by basing their sales strategies on
encouraging the prime to use the supplier’s IPR-owned technology on the final product.
Again, the participants from the prime are more than aware of such strategies as
described by the GCL: “It is some suppliers’ strategy to actively become the sole source
of supply on rare complex commodities making it difficult to find an alternate source.
Unless we are careful we end up engineering that single source onto our platforms,
which makes it difficult to go elsewhere. There is a risk that we become beholden to
suppliers who operationally haven’t been a good performers, but have the technology
that we need”.
The consequences of allowing a supplier to effectively ‘engineer’ their products
onto an engine are being acutely felt by the prime. This has now become an operational
issue because they are obligated to contract with only a few suppliers on key systems
due to there being little or no alternatives to generate competition within the industry.
The lack of mature and workable sourcing strategies for key systems was mentioned by
both participants in line with the perceived lack of supply options. The failure to
manage suppliers effectively can and does erode and undermine the prime’s own value
proposition within the supply chain. The resultant effect is that suppliers are given the
opportunity to push up costs and reduce the level of return for the prime. An important
aspect of this research project is to understand why the prime is unable to identify who
appropriates power in a sub-tier relationship.
4.1.7 Supplier Development – First Tier Suppliers Perspective.
Questions used in the first tier semi structured interviews on supplier development
were:
1. Do supplier development initiatives contribute towards preventing long term failure
for the organisation?
1.1 If so how? If not why not?
2. In the event of chronic long-term supply chain failure within your supply chain, do
you deploy people into your supplier’s in-order to facilitate recovery?
2.1 If so how quickly? If not why not?

102 | P a g e
3. Have improvement initiatives been implemented by your customers and / or
suppliers in the event of periods of chronic failure? If so what are they? Have they
helped to improve chronic long term failure?
3.1 Are you currently still involved in any customer led activities that were started
during chronic supply chain failure?
Table 4.4 is a consolidation of captured sub-themes related to supply chain failure from
a supplier development perspective. Table 4.4 highlights that first tier participants
described how a lack of resources limited their ability to conduct supplier development
activities within their own sub-tier supply chain.
12 Table 4.4 First Tier Supplier - Supplier Development.
The participants also articulated how the general size of their organisations
tended to limit the amount of supplier development activities they were able to conduct
per year. Therefore, deployment of precious resources was dependant on criticality, i.e.
sub-tier suppliers who are causing the most immediate problems.
Observations made during the first tier interviews was that improvement
initiatives would often be implemented in first tier suppliers by the prime, that do not
have the volume of demand required to justify undertaking any improvement. The
process of implementing such initiatives can end up costing the first tier supplier more
than the actual benefit gained. Participant OM-D explained how they approached the
implementation of supplier development initiatives within their own first tier supply
chain: “We don’t make snap judgements so there would need to be a consistent trend
of failure. We would make a report fairly quickly so we could see what the situations
was. If it happened over a number of months we would go into the supplier and ask why
the failure was occurring. We would ask the company to make an improvement plan.
Theme General Sub – Themes (Coding Level One) Supplier Development Lack of supplier development resource to adequately manage its
sub-tier suppliers.
Lack of flexibility in sub-tier management.
Level of resource committed by first tier suppliers depends on
criticality.
Level of influence depends on leverage with the prime.
Planning capability needs to improve throughout the supply
chain.
Initiatives are stopped after short term solution is identified.

103 | P a g e
To deploy somebody would be a judgement call, i.e. value of the business, extent of the
failure etc. We would monitor it from two months onwards. We monitor suppliers
similar to the prime”.
The majority of issues raised relate to available resources that are required in
order to be able to fully engage in supplier development initiatives, both upstream and
downstream in the supply chain. When larger suppliers suffer from failure it would
appear they are more likely to throw additional resources at the problem. However,
nearly all of the participant companies of a similar size i.e. Suppliers A, E and D (around
150 employees) and participant companies that were part of a much larger corporate
group (Suppliers B and C) reported that they did not have the resources to call on in
order to adequately manage or develop their sub-tier supply chain. Participant MD-E
explained: “I am not a big fan of simply throwing lots of resources at a problem. We
often sit and joke that there are very few problems in the world that can’t be solved if
you throw money at them. There is some truth in that but that doesn’t necessarily get to
the root cause. The prime has this quick response team. They’re not solving the
problem, they’re not looking at the root cause. They’re about expediting a solution for
those particular problems. Is it about having additional people? It is, but it has much
more nuance than that…it is about making sure that you have the appropriate planning
in place, to make sure you have the appropriate lines of communication in place. To
me it is not so much about throwing resources at the problems but putting resources in
early on to ensure you don’t get problems later on. One problem for business is head
room, how many resources should you have to be able to flex the business and cope”.
All of the participant first tier suppliers reported that they only have small teams
of supplier development personnel dispersed across their supply chains. These
personnel tend to visit suppliers once or twice a year. Supplier D was the only
organisation that reported having supplier development personnel regularly conducting
visits. The majority of the suppliers stated that they mostly conducted supplier
development initiatives on a small scale involving two to three people visiting a supplier
on an infrequent basis. Short visits are conducted rather than actually placing people at
a supplier for periods of time like a larger OEM organisation might do in the event of
failure. Also sub-tier suppliers are less likely to hand over control to a first tier supplier
should a supply chain failure occur. Participant OM-D explains: “It would be rare for

104 | P a g e
a supplier to hand over to us control of a particular area but we can give them
assistance to identify the root cause analysis”.
The level of influence depends on the leverage they have as a supplier
(Gelderman and Weele, 2003). Participant OM-D suggested that you can assist
suppliers to find the root cause of a failure but they will rarely find one without being
pushed by the customer: “What drives it is the interest that companies have in making
improvements. Smaller companies sometimes don’t see the benefit of having regular
improvement initiatives, for example companies that are not looking to make
improvements. People who are content at delivering to the standard that they are at.
Implementing improvement initiatives into these companies is actually a very difficult
thing to do. Any initiative takes time and is done in addition to the job you are doing
currently. It depends on the measurement criteria that are set. Another factor is down
to the reliance that you have on your customer’s business”.
It would seem that on occasion both sides of the dyad can lose sight of where
the real root cause lies such as planning capability throughout the supply chain.
Subsequently, these initiatives are not often continued after a short term fix is found.
4.1.8 Supplier Development – The Prime Perspective.
Questions used in the semi-structured interviews held at the prime on supplier
development were:
1. Do supplier development initiatives contribute towards rectifying long term chronic
failure and assists with recovery in the supply chain?
1.1. If so how? If not why not?
1.2. How important is it that suppliers adopt the initiatives and implement them into
their culture rather than just reverting back to ‘old ways’ when the problem
has been resolved.
2. During periods of sustained under performance occur, how much extra resource is
dedicated to resolving the problem?
2.1. Do you think extra / dedicated resources can help to mitigate chronic long term
supply chain failure?
2.2. If so why, if not why not?
3. During times of chronic supply chain failure have your suppliers deployed personal
from their organisation into their problem suppliers? If so, for how long?

105 | P a g e
Table 4.4A illustrates how the consolidated supplier development sub-themes
identified from the interviews held at the prime capture some different viewpoints from
those taken from first tier suppliers but also highlight some areas of agreement.
13 Table 4.4A Prime Participants – Supplier Development.
The prime participants reported poor engagement with suppliers when
implementing improvement initiatives and also questioned the approach taken by the
prime organisation on the whole. Sourcing strategy formulation and deployment was
viewed as inconsistent and immature and a main reason for having to conduct more
supplier development initiatives. However, similar to the findings from the first tier
suppliers it was identified that there was a culture of favouring short term quick fixes
over identifying root causes that had led to regular firefighting in order to quickly solve
problems.
Participant SDTM was the prime’s executive who contributed to the supplier
development questions. Throughout the interview, this participant did not at any point
apportion blame on first tier suppliers for persistently failing to deliver product. Instead
they focused on how the prime operated and managed its supplier development
processes. Despite a number of observations made concerning how to get suppliers
engaged in improvement processes, and constructive criticism of the prime and sub-tier
management of supplier development initiatives, participant SDTM firmly believed
that supplier development initiatives could and often did contribute towards preventing
failure for the organisation. The interview responses indicate that choosing the correct
method of implementing improvement initiatives is key to engendering positive
improvements within a first tier supplier. However, as participant SDTM explained, the
methods sometimes chosen by the prime could be described as extreme: “We had a
vendor eighteen months to two years ago who had a chronic issue. It was related to one
issue where they discovered that a lot of people were having or had had problems with
Theme General Sub – Themes (Coding Level One) Supplier Development Poor engagement with suppliers to implement improvement
initiatives.
Heavy handed approach to managing improvement initiatives
with suppliers.
Weaknesses in sourcing strategy formulation and deployment.
Communication issues preventing key stakeholders from seeing
the real picture by middle management.
Short term fixes resulting in regular fire-fighting at the prime.

106 | P a g e
this vendor so they sent in a parachute team who did a massive strip down of their
quality system, their engineering controls and their manufacturing controls. That was
eight people and they absolutely tore that vendor apart. Was that constructive? Well it
made the vendor wake up but did it actually have the desired effect? Well we have got
a slightly better vendor but we have not got a great vendor. Would a one to one have
worked better? Over a period of time I believe so”.
Interpreting this statement suggests that despite causing significant disruption
to the prime who subsequently committed vast resources, time and effort into fixing the
problem, in the end the method adopted yielded little sustained benefits. The company
remains a supplier but the reactive / aggressive ‘throw all resources at it’ approach does
not work in all cases when a more considered approach over a period of time may have
been more effective. Participant SDTM suggested that suppliers will often simply stand
back and watch the prime manufacturer fix problems. When the problem is resolved
and the pressure abates, the supplier will return to their normal way of working: “If you
go in with a big mob handed team you can probably fix lots of things very quickly but
will you get engagement from the supplier, probably not because you are doing the
work rather than them doing the work. They stand back and let you get on with it. You
walk away and you are then back to the sustainment thing because nobody bought into
what you are doing. On the one to one actions, the one to one development allow them
to do the actions, which allow them to come up with the solutions that allow them to
put things right”.
A combination of weak purchasing strategy formulation together with a
potential lack of communication skills can combine to reduce the effectiveness of
supplier development initiatives within the supply chain. The success of supplier-led
initiatives was also put into question in terms of whether an actual tangible
improvement was received by the supplier In essence, the major difference between
failures reported by the prime was that the prime seems to have difficulty in
communicating with their first tier adequately in some cases. Therefore, they are at risk
of implementing supplier development initiatives in an ineffectual way over the long
term. Observations from the first tier suppliers corroborated these findings by
consistently stating that they struggled to find resources to engage with the prime
requirements for improvement.

107 | P a g e
4.1.9 Performance Management – First Tier Suppliers Perspective.
The questions used in the first tier semi-structured interviews on performance
management were:
1. Has your organisation ever been put into the prime’s delivery or quality red flag as
a result of poor metrics on the prime’s balance scorecard?
1.1. If so why and if not why not?
2. What are the specific metrics chosen by this organisation to ensure that long term
chronic supply chain failure does not occur?
2.1. Do / have they helped to prevent chronic long term failure from occurring?
2.2. If so how, if not what happened?
3. What is the most common cause of customer rejection / failure with the prime?
Table 4.5 shows the sub-themes captured from the performance management
related interviews. The most discussed sub-theme throughout the performance
management interviews related to the difficulties faced by all first tier suppliers in
complying with the prime’s quality standards.
14 Table 4.5 First Tier Suppliers – Performance Management.
The quality standards were often labelled as ambiguous and were thought to
perpetuate the risk of first tier suppliers failing to supply conforming products due to
erroneous issues such as supplying products with incorrect serial numbers or incorrect
accompanying paperwork. It was mentioned how all of these relatively minor issues
could combine to dramatically result in a perception of consistent poor performance.
Another cause of poor performance was identified as a lack of planning capability
throughout the supply chain, also noted under the interviews in previous sections such
as risk management. This deficiency was further exacerbated by a lack of adequate
planning tools being used by first tier suppliers. The first tier participants described how
Theme General Sub – Themes (Coding Level One)
Performance Management Difficulties complying with prime’s quality standards.
Ambiguous quality acceptance standards by the prime.
Erroneous errors such as incorrect serial numbers on parts.
Weekly demand schedule changes by the prime.
Poor planning capability throughout the supply chain.
Lack of adequate planning tools used by first tier suppliers.
Lack of lead-time adherence by the prime.

108 | P a g e
their planning tools did not always coordinate effectively with the prime’s planning
tools, resulting in significant miss-matches to what was being seen by the first tier
supplier versus what was being seen by the prime.
The first tier supplier participants attributed causes of failure to compliance
related issues and focused on difficulties faced by suppliers in order to comply with the
prime’s quality management system. The reported issues revolved around ambiguity in
acceptance standards, misinterpretation of the specifications provided by the prime,
designs that did not match manufacturing capability as well as erroneous issues such as
serialization errors. These are all essentially quality management issues hence the
statement at the beginning of the Chapter that captured issues were related and inter-
mixed. However, Participant BS / BO-B explained how they were currently struggling
to achieve the agreed level of quality and delivery performance on a consistent basis:
“I know that we’ve had quality issues and I know that we’ve had 100% over checking
bought in. I believe because of the quality it has affected our delivery so it has been a
combination of both. It is not very good, it does not show supplier B in a particularly
good state that we cannot achieve what they require (The prime) and we cannot achieve
the quality that they require. I know internally that the key focal point across the
business and from top down we need to halt this poor run of quality and delivery. The
prime might choose to take the business elsewhere and supplier B in some ways might
cease to exist”.
The supplier B participant acknowledges that they appear to contribute to
creating issues or in some cases have been direct causes of supply chain failure. Many
of the issues discussed by the first tier supplier participants during the performance
management interviews were around planning and in particular how material demand
requirements were managed by the prime. Some of the participants suggested that if a
material schedule change was made by the prime, it was considered a direct result of
the prime’s deficiencies in areas such as poor planning, lack of adequate planning tools
and a lack of lead time adherence. Participant BS / BO-B provided an interesting insight
on this issue: “I don’t believe that we have any specifically good capacity measurement
systems in place. We monitor pacing machines, we measure a lot of our ability to meet
targets based on our output requirements. We kind of have a feel for what we can
achieve based on value on what we can achieve in a month. In terms of real system

109 | P a g e
tools that we use I think it is a lot more of a personal feel for it rather than a system
that will give answers from the data that we put into it”.
Should the prime choose to make changes to supplier B’s order book schedule
at short notice there would be an increased risk of delivery failure. It was also reported
that the supplier could still be penalised for late delivery against their agreed delivery
targets irrespective of when changes in dates occurred. Participant PrM-D explains: “In
the majority of cases, from the schedule change perspectives then clearly as part of the
Prime’s Sales Order Review Board (SORB) there is an articulation of potential future
demand changes. So we have the ability to respond. We have the ability to state to the
customer whether we have the ability to cope with the changes. The prime will ask us
if we can cope with a peak or trough in demand, even if we respond by saying we cannot,
often the prime will update the schedule anyway, thus setting us up to fail”.
The presence of uncertain demand schedules being placed on first tier suppliers
has meant that some suppliers have been forced into taking action to mitigate against
the potential for material schedule changes that negatively affect their scorecard.
Participant MD-D explained: “We actually forward schedule onto the supply chain
based on the supply chain quoted lead-times not through the planning rules that they
[The prime] have on a plant by plant basis. So there is a discrepancy because obviously
what we don’t flow down for example is the build and manufacturing lead time of 84
days.’’
Captured narrative taken from the first tier suppliers suggests that the planning
capability of each supplier is constantly being tested by the prime. The effect of
uncertain material demand schedules appears to put the sub-tier supply chain under
intense pressure. It was suggested that the changes occur because of poor planning
throughout the supply chain. Therefore, regular changes in material demand
requirements happen when the prime is looking to prevent disruption on key
programmes. Participant BS / BO-B talked about the difficulty that frequent demand
changes cause: “The information that is given from the customer and the changes that
they make ensures that the process is very difficult, certainly from the raw material
point of view because the prime does seem to have a knack of making changes whenever
they want and expecting us to basically say Okay, no problem”.
4.1.10 Performance Management – The Prime Perspective.
Questions used in the interviews held at the prime on performance management were:

110 | P a g e
1. How is chronic failure defined by the prime in terms of performance management?
1.1 Can elements of that failure be attributed to the prime, if so what?
2. Do the prime award new work to suppliers who been (historically or at present) put
into delivery or quality red flag as a result of poor metrics on the prime’s balance
scorecard?
2.1 If so why and if not why not?
3. Do you only award work that the suppliers are set up for and / or capable of doing?
Or are there other factors that are taken into consideration?
Table 4.5A shows the sub-themes captured during the performance
management interviews held at the Prime.
15 Table 4.5A Prime Participants – Performance Management.
All of the identified problems were attributed to issues regarding the
understanding and interpretation of performance management between the prime and
first tier suppliers. The findings highlight a general disparity between the management
of performance metrics internally within the prime and with the first tier suppliers.
There appears to be a difference in perception that each side of the dyad have on their
performance level. Again, the lack of planning capability was highlighted as an issue
in much the same way as it was by the first tier suppliers. In addition, the lack of
investment and resources within the industry and its effects due to the economic
volatility of the industry in recent times was also cited as a potential cause of failure.
The prime participants apportioned much of the causes of failure onto
themselves and did not tend to redirect the blame for failures towards the first tier
suppliers. Participant PPCM argued that the prime’s performance management metrics
were not sufficiently dynamic to improve the first tier performance due to infrequency
Theme General Sub – Themes (Coding Level One)
Performance
Management
Ambiguous performance metrics being presented by the prime.
Immature performance expectations by the prime.
Different interpretations of performance across the prime’s
business.
Post event performance analysis / metrics used by the prime.
Uncertain demand signal passed onto suppliers.
Poor planning in the supply chain by the prime.
Lack of robust sourcing strategies by the prime.
Reluctance to invest within the supply chain.

111 | P a g e
with which each metric is updated. They suggested that the method of data capture
means that key information is always generated post event, meaning that any failures
have already happened before they are reported. This does not give the supplier time to
react to any changes when notified by the prime. It was also suggested that the
performance metrics are not coordinated across the supply chain, heightening the risk
that they could be interpreted in different ways. Inconsistent methods can potentially
cause pressure on the first tier suppliers if they are contracted to multiple supply chain
units within the customer’s business. Participant PPCM also believed that the continued
use of the same metrics as a measure of performance highlighted the organisation’s
immaturity in performance management and slowed its ability to learn, develop and
improve: “Our business metrics that we use are around deliverables such as delivery,
quality and cost performance. As a customer we are still immature on what we expect
performance to be. We tend to be very reactive. We both ignore issues and then let them
go chronic or we throw twenty people into something that probably doesn’t need it.
Across the business there is a lot of variability so you will get a different concept of
what is considered a failure or is chronic. We seem to accept chronic failure a lot and
seem to limit our thinking into believing that we don’t really have any other options”.
The participants from the prime generally agreed that they could contribute
towards failure and actually pointed out where and how. Participant RPM confirmed
that regular material demand signal changes made by the prime affected the supply
chain; “There is no doubt about it in terms of our demand signal volatility”.
The prime participants consistently talked about a lack of capability and supply
options due to poor commodity sourcing strategy 14 or lack of capacity in the first tier
supply chain. This theme seemed to permeate throughout the responses given and was
described as a key reason for a number of actions taken by the prime. The strategic
thinking adopted for many of the prime’s commodities appears to be constrained by the
belief that there is limited supplier capability within the supply chain. Participant RPM
also suggested that: “Our strategies may not be as robust as they need to be. There are
commodities where we are on a journey through transforming the supply chain or
getting to grips with a supply chain. We have mature strategies and immature
14 Commodity Sourcing Strategy – This is the process of defining the short, medium and long term
direction / sourcing decision for specified material used to produce gas turbine engine.
112 | P a g e
strategies. There is also a commercial negotiation element of it which puts you of
track”.
However, a supplier’s performance could also be affected by actions taken by
the prime. Participant RPM explained how common practices carried out by the prime
could affect the first tier suppliers, the example given shows how quality management
changes can affect supplier performance: “Quality related issues, where we may have
moved the goal posts regarding our expectations around quality. We reaffirm our
standards so we do contribute to problems, significantly in some supplier’s minds”.
A notable difference between the first tier and the prime’s observations was the
subject of developing future sourcing plans / strategies for each product used to
manufacture the end product. None of the first tier suppliers discussed the effects of
strategy decisions on the supply chain. However, a number of the prime participants
discussed how their ineffectual sourcing strategies could become a potential cause of
supply chain failure.
4.1.11 Service Recovery – First Tier Suppliers Perspective.
Questions used in the first tier semi-structured interviews on service recovery were:
1. What are the key factors that contribute towards supply chain failure?
1.1. Can they be identified quickly?
1.2. Can the factors that cause chronic long term failure be resolved in a timely
manner so that they don’t become chronic?
2. If there is an approval process, does it affect the speed at which key decisions are
made delaying the ability to fix a problem?
2.1. When a component is being consistently returned as a non-conformance, what
steps do you take to resolve the problem?
3. Do you have direct collaborative communication with the customer?
3.1. If so what are the benefits? If not, why not and what are the effects of this?
Table 4.6 provides a consolidation of the sub-themes captured during the semi-
structured interviews on the subject of service recovery at the first tier suppliers.
16 Table 4.6 First Tier Suppliers - Service Recovery.
Theme General Sub – Themes (Coding Level One)
Service Recovery Incentives (Penalties) designed to prevent failure are rarely
enforced.

113 | P a g e
A key sub-theme identified by the participants from the first tier suppliers was
how commercial incentives (penalties) designed to ensure against failure from
happening were rarely enforced by the prime. It was said that this was potentially due
to a perception that decision making was slow, which reduced the chances of a quick
recovery and also from the prime seeking compensation for failure. Another perception
was that timescales for recovery within the aerospace industry were generally
considered longer than those of other industries. That said, further narrative described
the prime as often being overbearing towards first tier suppliers, which made the
process of recovery difficult for suppliers to manage quickly and effectively. In order
to mitigate the effects of failure, participants from the first tier described how they
actively developed strategies around IPR ownership, which would eventually protect
them against the ultimate punishment of supplier dissolution (Chen, et al., 2013) and
resourcing components from alternative suppliers.
All of the participants suggested that failure to mitigate problems resulted in
escalation and a subsequent reprimand from the prime’s senior managers. Only
participants from supplier D acknowledged that the consequences of repeated failures
towards the prime usually resulted in serious measures such as supplier dissolution and
components being re-sourced from elsewhere. However, due to issues with
communication and seemingly slow decision making at the prime, the agreed penalties
implemented to avoid failure were rarely enforced. The resultant effect was a perception
that often nothing happens with the exception of perhaps a small financial penalty for
cost of non – quality agreed between the prime and first tier supplier. Participant MD-
E pointed out that an important method of resolving a failure is to clearly communicate
with the prime in order to manage their expectations, otherwise they have a tendency
to become domineering: “A key measure taken was to ensure that this mind-set was
changed. It is about working with the customer and making them understand that there
Slow decision making at the prime reduces chances of quick
recovery.
Perception that timescales for recovering from failure are different
in the industry.
Prime has a tendency to become overbearing.
Major schedule changes by the prime make it hard for first tier
suppliers to recover.
First tier suppliers actively develop strategy around IPR
ownership.

114 | P a g e
are problems that need time and effort to resolve sometimes (managing expectations).
We did not want customers intervening or second guessing any decisions that we made
even if there was a delay. That disruption means that something else is not being
managed. A hard message for the customer to take on board”.
However, participant BO / BS-B suggested that the timescales for managing
failure are far different in the aerospace industry than other industries. The participant
suggested that time was actually akin to a commodity in its own right within the
industry - you could in fact buy time. Furthermore, when asked about if making a full
recovery from failure contributed to gaining more work from the prime, participant
MD-E said: “I don’t think it was as a result of the way we recovered from the situation
as much as the fact that we did recover the situation”.
When asked if serious issues could be identified quickly so that preventative
measures could be put in place, all of the participants said that potential failures could,
in theory, be identified quickly. However, expedient containment would depend on the
number of parts involved. Participant MD-D (who are managing over fifteen hundred
part numbers for the prime), stated that the majority of their part numbers are classified
as low volume and used on legacy engine platforms. That means demand may emerge
only once every five years in some cases. However, participant MD-D said that they
recorded the problem in the majority of cases except if the problem was caused by major
material scheduling changes carried out by the prime. In these circumstances participant
MD-D believed that they were not liable because they have the ability to state to the
customer whether they could cope with the changes or not. The prime will ask Supplier
D if they can cope with a peak or trough in demand. Even if Supplier E responds by
saying they cannot, often the prime updates the schedule anyway, thus setting up
Supplier E to fail. Understanding if repeat business occurred in the first tier supply chain
irrespective of supply chain failure was an important aim of the research. Participant
BO / BS-B suggested that they receive repeat business because of the fact that they own
the design and IPR on their components in an industry where there are not many
competitors, if any at all. Participant OM-B gave their view on how repeat business was
gained: “Business tends to be approved on the basis of who actually owns the design.
A lot of products that we manufacture are design controlled by Supplier B. Returning
business is mostly based on that but we do get business based on delivery, quality and
price (obviously)”.

115 | P a g e
As discussed earlier in this Chapter, there were comments made stating that
suppliers actively develop strategy around intellectual property rights by focusing on
design engineering. The intentions have been clearly stated to ‘corner the market’ for
the particular product, assembly, or system, and become the sole source of supply.
4.1.12 Service Recovery – The Prime Perspective.
Questions used in the semi-structured interviews held at the prime on service recovery
were:
1. What are the key factors that contribute towards supply chain failure?
1.1. How much responsible should the prime take when a supplier suffers from
chronic long term failure, and why?
1.2. Can they be identified quickly?
2. What impact does supplier failure have on the prime’s customers? Are there
suppliers who respond better to failure than others?
2.1. If this happens are the events recorded so that they prevent failure from
happening in the future?
3. When a component is being consistently returned as a non-conformance, what steps
are taken to resolve the problem?
3.1. Are penalties / liquidated damage clauses enforced when failure occurs? Does
this act as a deterrent?
3.2. Has the prime ever awarded more business to a supplier as a result of
recovering from a chronic long term failure?
Table 4.6A provides a consolidation of the sub-themes captured during the
semi-structured interviews on the subject of service recovery held at the prime. The
overarching theme that was identified from the interviews was how the prime suffered
from a lack of visibility throughout the supply chain, which often prevented a quick
recovery.

116 | P a g e
17 Table 4.6A Prime Participants – Service Recovery.
It was mentioned how problems would often be identified only days or weeks
after they had occurred, making a quick recovery very difficult to achieve. A cause of
failure was attributed to insufficient problem solving by not establishing root cause of
failure in the first instance. These issues would often recur, adding to pressure that is
already affecting the supply chain. There was a perception that there was too much
focus on resolving failures in the short term rather than looking to develop long term
solutions. This was compounded by a further perception that there was a lack of
commitment towards improvement initiatives at first tier suppliers, hampering
recovery. This was further perpetuated by a belief that the prime put more effort into
solving technical non-conformances rather than improving or recovering from poor
delivery performance.
Again, rather than focusing on the first tier suppliers as a cause of failure, both
participants identified and described problems caused by the prime. Participant BTL
provided insights on how this may be perceived at the prime: “There are a lot of factors
that influence a suppliers’ motivation to recover from failure. The suppliers’ power is
something that varies it. Suppliers who have more power than us are larger companies
that don’t depend on us and depend on other customers more. Therefore suppliers help
depends on whether failure towards us has a negative effect on their bottom line. So I
think it is completely varied. There are some suppliers that may be small to medium in
size so recovering from failure for them is a way of getting future business. So it is
completely varied”.
Another observation made during the interviews was how issues of lateness or
non-conformance do not reach the buyer until it is too late to prevent consequences
downstream, e.g. a production line stoppage. Participant BTL describes this as a
potential weakness and one that could contribute to causing longer term disruption.
Theme General Sub – Themes (Coding Level One)
Service
Recovery
Lack of visibility in the supply chain caused by inadequate communication.
Identification of supply problems days / weeks after delivery from supplier.
Insufficient problem resolution by not establishing root cause of failure.
Concentrate / focus on non – conformance rather than lateness of delivery.
Providing engineering specifications that are not easily manufacturable.
Lack of commitment to improvement initiates in the first tier supplier
failures.
Too much focus on short term failures and short term fixes by the prime.

117 | P a g e
When asked if problems could be identified quickly participant BTL explained that
invariably problems are not identified early enough.
A further finding from this research suggests that there is insufficient root-cause
analysis conducted specifically in terms of assessing delivery failure. This appears to
be more prevalent within the prime’s quality organisation who seem to concentrate on
non-conformances rather than lateness. However, participant BTL felt that the supply
chain could learn a lot from the quality organisation in terms of root cause analysis of
non-conformance and identification of why failure has occurred to help fix delivery
problems. In addition, participant RPE explained the current position at the prime
regarding failure: “Have people got real control over what KPI’s? Do we understand
the underlying performance in the supply chain? Are we fixing root causes of the issues
or just glossing over things? For quality I think first of all it comes down to, have we
got an engineering specification that’s manufacturable in the first place? Do we
understand that well enough, in a lot of cases we don’t”.
Captured narrative suggests that it is the prime who commits time and resource
to recovering and then developing the supplier rather than the reverse. The perception
is that the prime leads the majority of problem resolution activities. The reality behind
the perceived lack of activity can be attributed to strategic positioning. Again,
participant BTL provided insight into the cause and effect of poor performance in the
supply chain by suggesting that a lack of mature sourcing strategy is a key cause of
eventual supply chain failure. Participant RPE also suggested that the prime focuses on
the short term failures and short term fixes a bit too much, often losing focus of the real
issues. Participant BTL went on to state that the prime should be tougher on the
suppliers: “We should be tougher on the suppliers instead of trying to help them by
enforcing liquidated damages and get the suppliers motivated to fix the problems
themselves”.
However, the overall narrative from both participants interviewed suggested
that a number of the causes of failure can be attributed to the actions conducted by the
prime either at the present time or sometime in the past.
4.2 Empirical Evidence and its relationship with the literature. This section compares and contrasts issues highlighted during the exploratory phase of
the study with themes discussed in the research literature in supply chain management
and related areas. Gaps in the literature are highlighted, leading to further analysis in
118 | P a g e
Chapter 5 (Causal Analysis) and contributing towards the development of causal loop
diagrams.
In the interviews on the subject of Risk and Contingency Management,
participants from the first tier supplier described how poor planning throughout the
supply chain combined with regular material demand schedule changes carried out by
the prime contributed to supply chain failure. Research by Kleindorfer and Saad (2005)
examines risks associated with demand management. Their studies concentrated on
how organisations manage disruption risks in their supply chains and identified risks
associated with material demand planning errors, flexibility and robustness of supply
chains (Flynn et al., 2016). This was also noted by participants from the first tier supply
chain who described how fluctuations in demand places considerable pressure on the
supply chain. Earlier, studies by Tang and Tomlin (2008) and Kerkkänen et al., (2008)
examined how supply chain agility and resilience is closely related to demand risk
(Govindan and Fattahi, 2017), which was also highlighted by participant OM-C who
argued that there was a very real lack of planning capability throughout the aerospace
supply chain.
4.2.1 Empirical Evidence and the Risk Management Literature.
Participants from the prime described how their risk management process was
immature. The findings resonated with studies carried out by Zsidisin. His early
research focused on the tools that organisations use to assess risk and identify whether
they were being utilised effectively (Zsidisin et al., 2000). Observations from the
exploratory phase indicate that the adoption of risk management tools and techniques
were still relatively rare in the aerospace supply chain. The prime manufacturer had
started to utilise risk management in order to seek an effective method of mitigating
risks before a contract is agreed with a supplier. However, it was stated that suppliers
are not usually asked to participate in the risk management process during the contract
formulation process. Given the responsibility placed on them by the prime to manage
their sub-tier suppliers, is clearly a weakness. Captured evidence also suggested that
the supplier is only asked to participate once a failure has started to occur. These are
issues that are not captured in the existing supply chain risk management literature.
4.2.2 Empirical Evidence and the Quality Management Literature.
Throughout the interviews on the subject of Quality Management, unclear
specifications provided by the prime leading to non-conformances was frequently

119 | P a g e
identified as a factor influencing supply chain failure and its persistence. Further to this,
key steps that the prime organisation takes to ensure quality adherence, combined with
a general lack of adherence were also highlighted. Some of the literature on supply
chain quality management has focused on some of these areas. Studies by Power and
Terziovski (2007), Yeung (2008), Basu (2014) and Quang et al., (2016) examined
whether robust approaches to quality management lead to improvement in supply chain
performance. Subsequent research studies found evidence to suggest that such
approaches do lead to improved performance. However, evidence captured during the
exploratory phase of this research also shows how achieving acceptable quality requires
much more than just having a stringent quality system in place. How the prime applies
and manages the quality management system with its first tier supply chain partners is
equally important. For instance, the evidence captured during this study has identified
how expedient communication of requirement changes is crucial rather than leaving the
supplier to find out about changes themselves. First tier participants also indicated that
refraining from making changes to requirements / specifications after a contract has
been signed could help to reduce the risk of failure, i.e., having a stable design and set
of requirements. Foster (2008); Zu et al, (2008); Han et al, (2011); Kim et al, (2012);
Zhang et al, (2012) and Barouch and Ponsignon (2016) conducted exploratory
examinations and analysis on the overall effectiveness of quality management practices
adopted by organisations. The empirical findings from the exploratory phase supports
the notion that the prime manufacturer is conducting supplier audits primarily to ensure
compliance rather than to solicit improved performance. This backs up observations
taken from the literature. A finding from the exploratory phase that corroborates some
of the recent literature relates to the question whether the presence of a robust quality
system reduces the risk of quality failure within the supply chain (Steven et al., 2014).
Observations from both the exploratory phase and the literature indicate that the mere
presence of a quality management system does not reduce the risk of supply chain
failure.
4.2.3 Empirical Evidence and Power and Relationship Management Literature.
The main observations evident from the exploratory phase interviews on Power and
Relationship Management concerned a general inconsistency in communication
between the prime and its first tier suppliers. Similar to the captured observations
regarding the communication of design / specification changes, a key aspect of the

120 | P a g e
literature is the significance of effective communication between the first tier suppliers
and the prime manufacturer. The literature highlights how its significance can be
extended throughout the supply chain (Wadhwa et al., 2010). Jacobs et al., (2016)
found that the way in which internal communication within an organisation was
conducted could also facilitate positive communication with suppliers. Captured
comments from the prime participants suggest that leverage can have an effect of
developing more expedient information flow and overall responsiveness. This element
is missing from the literature - the literature does not currently identify if increased
leverage between parties in a dyad improves communication exchange.
Further issues captured from the empirical study described the effects of long
term relationships. Participants from the prime appear to exercise caution when signing
up to long term agreements due to negative experiences whereas first tier participants
were very much in favour of long term relationships. The literature discusses two
distinct approaches to relationship management that organisations adopt in order to
examine how power affects the influence that one party can hold over the other.
Evidence from this study indicates that first tier suppliers do favour the approach
described by Håkansson and Ford (2002), which places high importance on developing
long term relationships. Conversely, participants from the prime supported Cox’s
(2001) power perspective that seeks to understand methods of developing competence
in procurement and supply management from a power perspective. The perspective on
power suggests that buyer-supplier relations should always start from an understanding
of the bases of supplier power and business strategy (Cox, 2001). This understanding
should help gauge the type of relationship most likely to develop. Interestingly,
participants from the prime cited how a lack of understanding of the relationship had
led to dependency and ultimately was a factor influencing the persistence of supply
chain failure. The potential for power / leverage to lead to dependency and the resultant
negative consequences are not adequately addressed in the existing literature.
Cox et al., (2004, p.347) found that practitioners associate the identification of
supplier positioning or the identification of leverage in a buyer supplier relationship on
how important one is to the other in terms of turnover or spend. More recently, Jain et
al., (2016) developed a model that attempted to quantify the power position of each
player in the supply chain by linking specific procurement activities with buyer-supplier
power asymmetry (Gnizy 2016). Krause and Ellram (2014) have suggested that the risk

121 | P a g e
to the prime is perpetuated when the supplier is one of only a few sources able to supply
the product. In corroboration with the findings from the exploratory phase, Krause and
Ellram (2014) postulated that greater risk comes when the supplier is the IPR owner of
the product. The first tier suppliers described IPR ownership as a source for competitive
advantage whereas prime participants described it as being a risk and a potential cause
of failure. Ultimately though, the literature describes studies that seek to identify who
appropriates the most value from a relationship and the circumstances that surround
relationships (Kähkönen and Tenkanen 2010). The findings from the exploratory stage
have identified the effects of being on the weaker side of the buyer-supplier
relationship. In support of the work conducted by Jain et al., (2016), the prime appeared
to be weaker than some suppliers in some activities but in a more advantageous position
in others.
4.2.4 Empirical Evidence and the Supplier Development Literature.
In the interviews on the subject of Supplier Development, participants from the prime
described how supplier development initiatives were initiated and conducted. They also
provided comments on how successful the methods adopted for implementation were
with first tier suppliers. In depth studies by researchers such as Krause and Ellram
describe how organisations adopt such methods with the intention of improving
performance (Krause et al., 1997). However, the literature tends to focuses on critical
success factors that lead to improved supplier performance (Routroy and Pradham,
2011). The literature does not investigate the effect of incorrectly managed
implementations on first tier suppliers and how that can lead to minimal benefit and in
some cases further disruption.
Participants from the first tier suppliers described how they found it difficult to
resource supplier development initiatives, especially within their own supply chain in
order to ensure adherence to the prime’s quality system. These observations add to the
recent research by Pulles et al., (2016) in their study on preferential resource allocation.
They describe the significance of effectively securing supplier resource because
customers could end up competing for this with competitors. Wagner (2006) discusses
how in order to compete and survive in industries with few capable suppliers, prime
manufacturers must seek to extract the maximum value through such relationships.
However, evidence from the exploratory phase indicates that the prime manufacturer
can often act too vociferously and monopolise a supplier’s resources with only limited

122 | P a g e
benefit to show for it in the end. The literature does not discuss the negative effects of
a poorly managed supplier development activity.
4.2.5 Empirical Evidence and the Performance Management Literature.
Key findings from the exploratory phase relating to literature on Performance
Management involved an examination of how the prime attempts to gain consistent
adherence to their quality system throughout the supply chain. The literature focuses
on the need for effective performance measurement and benchmarking (Koufteros et
al., 2014). McAdam et al., (2008) identify that the outcome of such initiatives leads to
the identification of successful performance management practices that organisations
should adopt. However, findings from first tier and prime participants show a lack of
consistency in this area. Narrative from the prime suggests a lack of identification and
precision about how to use performance data to recover from failure and the first tier
participants suggest that there was a distinct lack of visibility resulting in delays that
often created the perception that the supplier was performing worse than they actually
were and thereby creating unnecessary attention on suppliers. In the literature, Laihonen
and Pekkola (2016) noted that companies have generally failed to maximise on the
potential of performance management systems (Akyuz and Erken 2010). Pongatichat
and Johnson (2008) described how, in the situation where managers are not provided
with accurate information, their ability to align actual supply chain performance with
agreed performance levels will be reduced. It can result in negative metrics being
incorrectly interpreted and displayed against first tier suppliers. There is a risk that this
can potentially create the perception that suppliers are perceived to be performing worse
than they actually are (McAdam et al., 2008). The resulting effect causes the prime to
make changes in demand scheduling in order to mitigate against the risk of delivery
failure in the future. The negative impact of misaligned performance management
systems is a topic that is discussed in the literature but has received limited attention.
The evidence obtained from the study on persistent supply chain failure backs up that
research to some extent. However, the risk of mishandling key information from a
performance management system leading to unnecessary mitigation activities is not
covered in the performance management or performance measurement literature.
4.2.6 Empirical Evidence and the Service Recovery Literature.
During the interviews on the subject of Service Recovery, participants from the first
tier suppliers described how resolving and subsequently recovering from failure was

123 | P a g e
key to retaining business with the prime. Comparable studies conducted by Craighead
et al., (2004) within the service operations literature suggests that service recovery
principally examines the effect that recovery can have on the customer / seller
relationship. For example it has been observed that fulfilling specific recovery criteria
can result in significantly positive effects for the seller (Augustus de Matos et al., 2007).
This is referred to as ‘the service recovery paradox’, which originated from the work of
McCollough and Bharadwaj (1992). They made the observation that effective recovery
strategies can lead to a more favourable relationship than was in place before the failure
(Tax et al., 1998 p.64). However, only two of the five first tier participant companies
had actually managed to enjoy a period of stability with the prime after recovery from
poor performance. Despite consistent periods of failure, all of the first tier suppliers
managed to retain business with the prime. Participant BTL from the prime suggested
that they spent so much of their time focusing on quick fixes and workarounds aimed
at mitigating failures in the shortest period of time to even notice (Morrison 2015), let
alone congratulate, suppliers who managed to fully recover from failure. The broader
service management literature has many studies concerned with understanding how
organisations regain customer satisfaction and confidence (Tax et al., 1998). However,
the findings from this study indicated that the recovery paradox does not exist in an
industrial supply chain management context. As suggested during the exploratory
phase, it was found that the prime is much more likely to attribute recovery from failure
towards how they managed the failing supplier rather than how the supplier managed
themselves through the failure. This is an aspect of service recovery that the literature
does not account for, i.e., the prime’s perception of managing a failure.
Overall, there are a number of issues captured during the exploratory phase that
legitimately back up observations from the literature covered during the study.
However, there are also many important issues that are not covered in the literature. A
key omission is the lack of research that examines the phenomenon of long term failures
that organisations have failed to mitigate before they happen. The prime and first tier
supplier then struggle to solve the problems in a short period of time, irrespective of
efforts by both parties. The exploratory phase has captured issues that cover scenarios
related to quality management, power, risk and contingency management and
relationship management. It is clear from the empirical evidence that issues within each
of these domains interact to cause longer lasting failures.
124 | P a g e
4.3 Exploratory Phase – Emergence of Persistent Failure. The purpose of this section is to analyse the findings and observations from the
exploratory empirical phase of the study and show how they can be further grouped
together and categorised using a coding process (Hahn, 2008). The first part of the
Chapter encapsulates level one coding and identifies key research themes and sub-
themes. In order to categorize the data into dominant key themes and sub-themes and
therefore move onto coding levels two and three (axial thematic coding) (Strauss and
Corbin, 1990), a significant amount of recorded data taken from both first tier and prime
participants has been analysed. Throughout the exploratory phase, it was identified that
some failures occur persistently. The causes of failures that continue to persist were not
very well understood by either the prime or first tier participants, although they
recognised the phenomenon. Participant PPCM explained when asked during the
interview if they ever awarded work to suppliers with a history of poor performance:
“We constrain our thinking to say that this is the only supply chain available to us. We
don’t put robust fixes in place to either fix that supplier or put the correct pressure to
get them to up their game. There is an example of a supplier who were causing chronic
failure seven years ago who we decided to exit at that time. However, we are now going
back to them because we have not been able to find anybody else capable in the supply
chain or manage the change. So we have now gone back to them with new business,
even though we don’t want to. So yes we do all the time”.
The findings indicate that there are certain causes of failure that the prime
manufacturer struggles to mitigate against in the short term. Such failures then persist
over time. They often start as reasonably small issues but eventually lead to serious
supply chain failures that persist and consequently have a large effect on the prime and
its ability to serve its customers adequately. The phenomenon is encapsulated in four
dominant influencing themes related to four key literature domains as shown in table
4.7 below.
4.3.1 Summary of Key Identified Dominant and Sub–Themes.
Throughout the research process, categories of issues and dominant themes that were
linked to potential causes of failure began to emerge. Each of the categories are related
to themes evident somewhere in the research literature on supply chain management
and related areas but rarely discussed in combination and never specifically related to
supply chain failure persistence. Table 4.7 summarises the captured sub – themes and

125 | P a g e
their related literature domains identified from the data captured during the exploratory
phase that lead to the development of four distinct dominant themes.
18 Table 4.7 Exploratory Phase One - Summary of Key Themes and Sub -
Themes.
The sub-themes related to the Supply Chain Quality Management literature led
to the development of the ‘Quality Adherence’ dominant theme. Both sides of the dyad
appeared to struggle from a lack of adherence to the prime’s quality system, which was
abundantly evident from the interviews on quality management. The prime participants
reported suffering from the effects of a lack of compliance from the supply chain. The
limitations of short term quick fixes were mentioned by both sets of participants as a
Coding Level Two
Literature
Domain
Supply Chain Quality
Management.
Power, Leverage
and Dependency
in the Supply
Chain.
Supply Chain
Risk and
Contingency
Management.
Relationship
Management in the
Supply Chain.
Dominant
Theme
Quality Adherence. Dependency. Risk and
Contingency
Management.
Relationship
Management.
Key Sub –
Themes
Adherence to
Primes Quality
System.
Short Term Quick
Fixes versus Root
Cause Analysis.
General
Misunderstanding
of Audits
conducted by the
Prime.
Ambiguous
Performance
Metrics.
Lack of Supplier
Development
Resource.
Dual
Dependencies
in the Supply
Chain i.e. the
Prime
Dependent on
the First Tier
Suppliers and
Vice Versa.
Failure to
manage
spend with
existing
suppliers.
Immature
strategy
deployment
resulting in a
lack of
supplier
options.
Material
Demand
Uncertainty
generating
frequent
Schedule
Changes.
Lack of
Planning
Capability
throughout
Supply
Chain.
Immature
Risk
Management
Processes.
Inconsistent
Communication
throughout
Supply Chain
and Internally
within the Prime.
Lack of
relationship
continuity
throughout the
supply chain
between first tier
and prime.
Lack of
responsiveness
and poor
information flow
between first tier
and the Prime.

126 | P a g e
result of being forced to resolve issues quickly and therefore reduce disruption
expediently. However, this was carried out at the expense of conducting root cause
analysis that could pinpoint the true cause of failure. Further to this, the justification
and frequency of audits conducted by the prime was also seemingly misunderstood by
both parties.
The identified sub-themes on performance management are related to
ambiguous performance metrics alongside a lack of supplier development resource at
first tier suppliers. These have been included under the Supply Chain Quality
Management literature theme because of the effect the issues have on quality adherence.
Participants from the prime described how their metrics were inflexible leading to the
capture of potential failure ‘post event’. Captured narrative from the first tier
participants suggested that they were often confused with the metrics being used by the
prime and described how their own metrics portrayed the performance differently to
how the prime often presented it. To counter the effects of poor performance the
participants from the prime discussed supplier development improvement initiatives
and their effectiveness. However, the first tier participants described how they often did
not have the resources to fully engage in the activities combined with having limited
resource availability to adequately conduct supplier development within their own sub-
tier supply chain.
The sub-themes related to Power, Leverage and Dependency in the Supply
Chain literature led to the development of the ‘Dependency’ dominant theme. Both sets
of participants described how they had become dependent on each other for the supply
of products (often IPR owned) and subsequent turnover. It was noted how the lack of
mature sourcing strategies had conspired to reduce the options available within the
supply chain for the prime and meant that some first tier suppliers had dedicated
virtually all of their business to the prime, leaving them very vulnerable and sensitive
to the prime’s performance in the market. Combined with a failure to manage spend
with existing suppliers resulting in first tier suppliers having more business with the
prime then they could effectively handle. This appears to be exacerbated by immature
commodity sourcing strategies, which have resulted in a lack of supplier options for the
prime.
The sub-themes related to Risk and Contingency Management in the Supply
Chain literature led to the development of the ‘Risk and Contingency Management’

127 | P a g e
dominant theme. Material demand uncertainty and the resultant frequent schedule
changes were regularly discussed by the first tier suppliers during the interviews on risk
and contingency management. Despite having a fairly stable demand profile within the
industry, the first tier suppliers reported that delivery dates could be changed on a
weekly basis causing disruption throughout the upstream supply chain. Participants
from the prime confirmed that this was happening and agreed that it could indeed cause
disruption. Participants from the first tier attributed the regular changes in demand to
poor planning capability at the prime and also discussed how this was extrapolated
throughout the supply chain because planning capability was just as bad if not worse in
the sub-tier. Immature risk management processes throughout the first tier supply chain
are making potential issues more difficult for the prime to mitigate before they become
persistent.
The sub-themes related to Relationship Management in the Supply Chain
literature led to the development of the ‘Relationship Management’ dominant theme.
Inconsistencies in communication throughout the supply chain, starting at the prime,
was a theme regularly discussed by the first tier suppliers and participants from the
prime during the interviews on power and relationship management. Participants noted
how they regularly did not provide the first tier supplier with the potential demand
figures for an entire programme, instead only giving them the volumes for the
development programme. The prime participant acknowledged that this type of
behaviour conspired to ruin relationships with first tier suppliers who would often
refuse to quote for the work because of the unattractive potential of the business being
offered. A picture also emerged of a lack of relationship continuity between key
participants from the first tier supplier and the prime. This was caused by relationships
being broken up due to mainly prime participants being moved into different roles on a
frequent basis. A potential consequence of this was a lack of responsiveness between
the first tier and prime participants combined with poor information flow within the
supply chain. This was perceived as an antecedent to other issues, contributing to
persistent supply chain failure.
4.4 Summary. All of the key themes and sub-themes identified in Chapter 4 that have been
consolidated in Table 4.7 demonstrate potential causes of persistent supply chain
failure. They each affect different parts of an organisation and its supply partners and

128 | P a g e
they appear to ultimately combine to cause persistent failures that are extremely
difficult, time consuming, and costly to eradicate. In Chapter 5 a description of coding
level two and level three will be given showing how variables and causal loops were
developed from the sub-themes within the four dominant themes shown in Table 4.7.

129 | P a g e
Chapter 5: Causal Analysis. The main outputs of the exploratory phase described in Chapter 4 were the
identification of emergent dominant themes and sub-themes captured from the
empirical study conducted on supply chain failure and why it may persist. Steps one
and two, including coding levels one and two, were described in relation to the
qualitative causal process shown in Figure 3.2 in the Methodology and Design Chapter.
The exercise yielded preliminary categories that are linked to various literature domains
discussed during the literature review section (Chapter 2). Multiple causes for persistent
failure and the effect that these can have on the supply chain was provided throughout
the exploratory phase. From the analysis in Chapter 4 (section 4.3.1) and summarised
in table 4.7, four dominant themes emerged – Quality Adherence, Dependency, Risk
and Contingency Management, and Relationship Management. Each of the identified
variables and subsequent causal loops relate to these four dominant themes.
Chapter 5 begins the process of causal modelling using causal loop diagrams,
which provide the principal mechanism used here to identify how variables interact in
a cause and effect scenario. The discussion then moves on to show how the identified
variables interact to form causal loops. This shows the effect that interacting variables
can have on, and between, the prime and a first tier supplier which is the unit of analysis
for the subject under study – persistence of supply chain failure. Justifications for how
and why the variable names were chosen from the empirical evidence are given. At the
end of this Chapter, the persistent supply chain failure model in its first iteration is
presented along with a full glossary of terms (see Table 5.13 below) that provides a
description and explanation of each of the variables created as a result of the empirical
evidence analysed and categorized in Chapter 4. Finally, a description showing how
each set of loops falls under one of the four dominant themes is presented. The final
iteration of the causal loop model is presented in Chapter 6.
5.1 Validation of First Tier Supplier and Prime Interview Scripts. As described during Chapter 3, in order to strengthen the development of the causal
loop model, validation of all interview data captured during the exploratory phase was
conducted with both first tier supplier and prime participants.
Findings from the first tier participants indicated in some cases that conducting
business with the prime had gradually got worse since the start of the research in key
areas. For example participant PrM-B described how the prime had subsequently

130 | P a g e
reduced delivery lead time requirements on its first tier supply chain: ‘A significant
change over the intervening time period has been that the prime have now taken the
further decision to reduce their lead time even further. So from what was the original
material planning cycle of 84 days has been reduced down to 42 days. Therefore, the
variability has actually increased rather than reduced. So were having to buffer for a
worse situation from a customer demand fluctuation perspective’. Participant PrM-D
described how this change had increased the number of scheduled changes made by the
prime: ‘The main difference there is that the number of schedule changes per week has
gone up per average’. In addition participant QM-B mentioned how their overall
supplier performance had got worse since the original interviews had been conducted:
‘Our scorecard [Measuring Quality, Delivery and Cost] currently is probably the worst
it’s ever looked’. Participant QM-B went on to describe why this had happened and
how they were of the view that actions by the prime contributed towards the reduction
in performance: ‘Unfortunately we, I mean the bigger we [The prime], put people under
pressure to try and push parts out of the door, so it is probably not as good as it was
say two years ago. We've created that monster, well maybe in some respects it’s joint
with the customer. All the customer drawings are wrong, if you can't change them quick
enough then it is a joint problem!’
In general, participants from the prime reconfirmed their initial observations
from the exploratory phase. The only addition to the findings was provided by
participant RPM who also added that failure can be attributed towards the prime when
providing first tier suppliers with poor drawings.
In summary, validation of the original interview scripts showed that since the
original interviews were conducted during the exploratory phase, the prime was
applying more pressure onto the first tier supply chain. This was being done by reducing
required lead times on components and by making quality standards tougher for first
tier suppliers to comply with.
5.2 Development of Causal Loop Variables. The use of causal loop diagrams as a method of capturing and demonstrating the causes
of persistent supply chain failure has been discussed in Chapter 3. Each diagram guides
the reader to understand the particular characteristics of variables that cause problems
over a period of time if they interact with other variables in a system. The aim of the
following section is to highlight how the empirical data was coded and subsequently
131 | P a g e
converted into pertinent variable names (Sterman, 2000) and how these variables
interact, leading to causal loop development.
5.3 Quality Adherence. Here we present and justify causal loops relating to quality adherence, disruption and
sub-tier capability.
5.3.1 The Quality Adherence Loop.
Table 5.1 below shows how causes of failure were attributed to issues related to quality
management topics and were linked to components consistently not meeting the prime’s
requirements. The evidence suggests that stringent quality requirements laid down by
the prime and by aerospace industry regulations often make it difficult for first tier
suppliers to achieve contractually agreed levels of quality performance. Failure to
achieve requirements is registered as a supplier quality adherence failure by the prime.
Figure 5.1 shows the quality adherence causal loop that has been constructed from the
analysis of empirical evidence, which is explained below.

132 | P a g e
19 Table 5.1 Quality Adherence.
6 Figure 5.1 The Quality Adherence Loop.
Quality Adherence
Failure Persistence
Focus On Supplier
Supplier Improvement
Initiative
-
+
+
+
B1
Themes
(Coding
Level 2)
Representative Empirical Findings (Coding Level 2) Variables
(Coding
Level 3)
First Tier Supplier Prime
Quality
Management
.
History of Failure.
Chronic failure is the biggest
impact.
Short Term Problem Solving.
Lack of sub-tier supplier management
by the first tier.
Failure
Persistence
(From the
Quality /
Performance
Perspective
Not being able to achieve what the
customer wants (Specification
issue).
Meeting specification.
Moving the goal posts. regarding our
expectations around quality.
Misinterpretation of quality
certifications.
Quality
Adherence
Men and money thrown at a
problem.
Seek help from the Prime if the
issues become chronic in sub-tier.
Focus on the short term failures and
fixes a bit too much.
Lack of supplier development
resource.
Focus on
Supplier
You need to build in your
requirements with their
requirements “do you want to be
part of this game or not?”.
Reservations about throwing
resources at a problem in the belief
that this form of problem solving
may well quickly resolve a critical
situation in the short term but it
won't necessarily identify the root
cause of the problem increasing the
probability.
Resource is limited.
Heavy handed approach.
Supplier
Improvement
Initiatives

133 | P a g e
A consistently discussed theme during the exploratory phase concerned how
some quality failures appear to reoccur again and again, i.e. persistently. Evidence
suggests that there are interactions between variables that result in the prime
manufacturer struggling to eliminate such failures in the short term. Issues may often
start off appearing reasonably innocuous but then develop into serious persistent supply
chain failures if not addressed and eliminated quickly. Failure to quickly resolve such
issues can eventually have a large effect on the prime and its sub-tier supply chain,
hence the formulation and inclusion of the ‘Failure Persistence’ variable within the
quality adherence sub-section15.
All first tier suppliers who participated in the study stated that they try to align
themselves very closely with the prime’s balanced scorecard to ensure that problems
do not become a cause of failure that attracts unwanted attention from the prime. This
finding resulted in the inclusion of the ‘Focus on Supplier’ variable. By moving in a
clockwise direction, the polarity between the two variables is shown as a positive sign
to highlight how an increase in failure persistence results in an increased focus on the
supplier by the prime because recurring issues have started to affect the prime’s
assembly and delivery schedules, which draws attention from senior managers at the
prime.
The attention placed on a failing supplier resulted in the creation of the ‘Supplier
Improvement Initiatives’ variable. There is a perception by the prime that more
improvement visits result in a reduced risk of failure. The loop demonstrates how an
increase in the focus on supplier has an increased effect on supplier improvement
initiatives, influencing the number of development / improvement activities that the
prime has going at any one time with a problem supplier in order to ensure quality
issues do not disrupt future supply. The prime initiates improvement activities when
failure persistence has the effect of causing disruption to the company. This extra focus
placed on the supplier is seeking to mitigate against failure.
Further evidence presented in Chapter 4 indicated that failures related to quality
issues are caused by a poor adherence to agreed quality standards as a consequence of
problems in compliance with specifications. Quality management issues were
frequently cited as a key cause of supply failure during the exploratory phase. The worst
15 A full glossary of the model variables with definitions is presented in alphabetical order in Table
5.13 on pages 166-168.

134 | P a g e
case effect of a lack of quality adherence is the product failing to meet the specification
that was agreed. These observations led to the development of the ‘Quality Adherence’
variable.
The loop shows how an increase in supplier improvement initiatives has the
effect of increasing the supplier’s ability to achieve quality adherence with the prime.
Increased adherence happens over a period of time, captured by the time delay mark
that sits between the two variables within the loop. The delay highlighted between the
Supplier Improvement Initiatives and Quality Adherence variables captures oscillatory
behaviour because the action of the prime, whose goal of is to improve quality
adherence through the implementation of improvement initiatives, does not have an
immediate effect on supplier quality adherence, resulting in further disruptions. The
loop then continues to feedback and is completed by showing how the quality adherence
variable then forms a linkage with the failure persistence variable. The polarity between
the two variables shows a minus sign denoting a negative effect because an increase in
quality adherence reduces failure persistence, i.e. the supplier is adhering to the prime’s
quality system which has the effect of reducing failure.
Overall, the quality adherence loop should have the effect of balancing or
reducing causes of persistent supply chain failure if managed correctly. This is largely
driven by additional focus on supplier and effective implementation of supplier
improvement initiatives, which represent activities that the prime carries out in order to
reduce the threat of failures from persisting or from happening in the first place.
5.3.2 The Disruption Loop.
Table 5.2 highlights variables created to show how quality issues relating to the highly
complex specifications set by the prime can combine and lead to non-conformances and
problems being encountered throughout a sub-tier supply chain. The interactions that
have been identified between each of the variables led to the formulation of the
disruption loop shown in Figure 5.2, as described below.

135 | P a g e
20 Table 5.2 Disruption.
7 Figure 5.2 Disruption Loop.
Starting with the quality adherence variable, it was identified that the prime did
not always entirely know what is required to correctly manufacture a component that is
Disruption
Short Term
Quick Fixes
Quality Adherence
Non Conformances
+
+
R3
Root Cause Analysis
-
+
-
Themes
(Coding Level
2)
Representative Empirical Findings (Coding Level 2) Variables
(Coding Level 3)
First Tier Supplier Prime
Quality
Management
Inadequate Non-conformance
process.
Not being able to achieve what the
customer wants. (Specification
issue).
Ambiguous quality acceptance
standards.
Non-conformance to the
process.
Non-conformance, capacity
(common causes of failure)
Non
Conformances
Calling out dimensions on
drawings that are illegible can
bring a stop to production.
Inadequate planning.
Not pro-actively solving
quality issues in the supply
chain.
Knowingly delivered non-
conforming product.
Disruption
Sometimes it takes that chronic
failure before they actually do
something.
If we don’t fix the problem
we will always go back to the
fire-fighting.
Lack of robust fixes in place
to fix the supplier.
Short Term
Quick Fixes
Lack of PFMEA’s.
Poor tools for the job
Failure to identify the root
cause of a problem
Not getting to the root cause
of failure
Root Cause
Analysis

136 | P a g e
fit for its intended purpose. Specifications can be unrealistic or ambiguous, making the
manufacture of components beyond the capability of the first tier supplier (or possibly
any supplier). Captured issues also highlighted the complex industry standard
requirements to which compliance is mandatory before being allowed to supply product
into the aviation sector. Evidence from the exploratory phase has shown that the first
tier suppliers and the prime struggle to achieve required standards on a consistent basis
resulting in repeated non-conformances. Consequently, quality failures were commonly
defined by both sets of participants as ‘Non-Conformances’ resulting in the inclusion
of this variable in the model. The linkage between the quality adherence variable and
non-conformances demonstrates how an increase in adherence to the prime’s quality
system has the effect of reducing the number of ‘Non-Conformances’ emanating from
the supplier.
Disruptions occur when the flow of components to production is interrupted for
a period of time. The extent of the non-conformance is often unknown when first
identified and therefore needs to be quickly ‘quarantined’ to ensure that non-
conformances are contained. Subsequent behaviour by the prime and the first tier
supplier is influenced by the type of non-conformance and the scale of the disruption
that is caused. However, the findings captured during the exploratory phase suggest that
containing non-conformances to prevent or reduce disruption does not always happen
sufficiently quickly to prevent repeat failure. This led to the inclusion of the
‘Disruption’ variable. The interaction between both variables demonstrates how an
increase in non-conformances has the effect of increasing the ‘Disruption’ caused to
the prime manufacturer.
It was also identified that when these further disruptions start to accumulate, the
likelihood of the prime implementing a short term quick fix required to quickly resolve
disruption is greatly increased. When a failure occurs, unless it is mitigated immediately
there is a higher likelihood that both parties will abandon the possibility of conducting
root cause analysis in favour of a short term fix. These observations led to the creation
of the ‘Short Term Quick Fix’ variable. This results in a lack of robust ‘fixes’ being put
in place with the supplier. Therefore, the interaction demonstrates how an increase in
disruption can have the effect of causing an increase in short term quick fixes being
adopted.

137 | P a g e
Conducting root cause analysis of persistent non-conformances is an approach
that seeks to eliminate or mitigate a failure permanently. However, although conducting
root cause analysis may reduce the likelihood of repeat disruption in the future it could
take a long time and require more resources to get supply moving again. Hence, both
the prime and the sub-tier supplier can become pressurised into favouring a short term
quick fix in order to reduce the effects of a disruption. The findings also indicate that
recognised tools used to conduct root cause analysis such as PFMEA16 are still relatively
immature within the first tier supply chain, although capability to adequately conduct
PFMEA studies are slowly being implemented by the prime. This observation resulted
in the inclusion of the ‘Root Cause Analysis’ variable. Therefore, the loop shows how
an increase in short term quick fixes has the effect of reducing the amount of root cause
analysis conducted in order to solve problems quickly.
Overall, the disruption loop demonstrates how the combination of the supply
chain quality management sub-themed variables and the interactions between them
feedback to reduce the level of quality adherence within the supply chain and reinforces
the negative effects of failure. The cycle will self-propel, gradually reducing the effect
of adherence, which will then increase the risk of failure persisting.
5.3.3 Sub-Tier Capability Loop.
A common strategy by the prime is to conduct audits that identify process deficiencies
and seek to develop capabilities of the first tier supplier. Table 5.3 highlights variables
that show the level of importance placed on quality adherence at the prime. In order to
ensure adherence, audits are regularly conducted throughout the supply chain by the
prime. The frequency of audits conducted by the prime on a first tier supplier depends
on their ability to consistently supply products that conform to specified requirements.
The interactions that have been identified between the variables led to the formulation
of the sub-tier capability loop shown in Figure 5.3 and described below.
16 PFMEA – Part Failure Mode Effects Analysis. Methodology adopted to identify root cause of
failures.

138 | P a g e
21 Table 5.3 Sub-Tier Capability.
8 Figure 5.3 Sub - Tier Capability Loop.
The prime manufacturer conducts audits on first tier suppliers to prove the
existence of ‘process capability’ within the supply chain and also to enhance that
capability. Captured observations indicate that the sheer size of the prime’s supply
chain combined with its geographic spread requires first tier suppliers to be compliant
with the prime’s quality management system and explains why the prime requires each
of its first tier suppliers to subsequently conduct audits on their own sub-tier suppliers.
This resulted in the creation of the ‘Supplier Audits’ variable. The variable is designed
to highlight the extensive importance that the prime places on supply chain capability
to reduce non-conformances in pursuit of improved performance. Starting with the non-
Disruption
Short Term
Quick Fixes
Quality Adherence
Non Conformances
+
B4
Root Cause Analysis
-
+
-
Process Compliance
Supplier Audits
+
+
-
Themes (Coding
Level 2)
Representative Empirical Findings (Coding Level 2) Variables
(Coding Level 3)
First Tier Supplier Prime
Quality
Management
Supplier
Development
Customer Auditing based on
Spend.
Audit programme based on
problem / high risk suppliers.
Weak auditing of
supply chain capability.
Desktop auditing.
Supplier Audits
Taking your eye of the ball
during the process will result in
a failure surfacing.
Processes that set the
supplier up to fail.
Lack of process
understanding in supply
chain.
Process
Compliance
139 | P a g e
conformances variable, the loop demonstrates how an increase in non-conformances
has the effect of increasing the number and / or frequency of ‘Supplier Audits’ being
conducted by the prime on the failing supplier.
It was also described how there is a tendency to over-complicate systems and
processes to such an extent that first tier suppliers can find consistent process
compliance difficult to achieve. Process compliance is viewed as critical by the prime
and is controlled by contractually agreeing performance metrics with all first tier
suppliers. However, what constitutes acceptable levels of compliance appears to be
more subjective within the supply chain. That led to inclusion of the ‘Process
Compliance’ variable. The interaction between each variable shows how an increase in
supplier audits has the effect of increasing process compliance. The supplier will then
gradually become capable of adhering to the prime’s quality system autonomously. The
time delay mark has been added because it can take considerable time and effort by
both the first tier supplier and the prime to achieve sustained compliance within the
supply chain. The delay highlighted between the Process Compliance and Disruption
variables demonstrates how the goal of achieving compliance is often delayed because
of changes to requirements and standards, which causes oscillatory behaviour as
disruptions continue to persist.
Further evidence from the exploratory phase shows that the supplier audit and
process compliance variables represent captured sub-themes that the prime conducts to
reduce or balance the effects of disruption in the supply chain. Without such mitigation
activities, the loop will gradually reinforce over time to feedback in a continuous cycle
of non-conformances and short term quick fixes until the system becomes so volatile
that failure will become difficult to mitigate and supply chain failure will persist.
5.4 Dependency. Here we present and justify causal loops relating to dependency, spend relationship and
strategy mitigation.
5.4.1 The Dependency Loop.
Table 5.4 describes causal loop variables that interact to show how strategic decisions
made by the prime can lead to a state of interdependency between the prime and a first
tier supplier. The evidence relating to the interaction between all of the discussed
variables led to the development of the dependency loop shown in Figure 5.4 and
explained below.

140 | P a g e
22 Table 5.4 Dependency.
9 Figure 5.4 Dependency Loop.
Dependency on
the Supplier
Strategy Deployment
Vaccillation
Failure Persistance
-
-
+
R1
Delivery Arrears
+
+
Themes (Coding
Level 2)
Empirical Findings (Coding Level 2) Variables
(Coding
Level 3)
First Tier Supplier Prime
Power, Leverage
and Dependency in
the supply chain.
Relationship
Management.
Highly leveraged
suppliers.
Repeat business
because of the fact
that they own the
design / IPR.
Sole sources of supply on rare
complex commodities.
Dependency effects recovery.
Dependency
on Supplier
Acceptance of poor
performance due to
lack of options.
Selecting suppliers
with a known
history of chronic
failure.
Lack of robust commodity strategies.
We have limited options. We cannot
go elsewhere so we are either forced
to work with the supplier or force
them to engage the one other source
we have.
Resourcing is a long process which
is too long and too inflexible.
Strategy
Deployment
Slow decision
making.
Bureaucratic
decision making
structures.
Takes a while for this organisation to
wake up and smell the coffee! Same
as all large organisations.
Breakdown at top level.
Vacillation
Forcing suppliers to
prioritise deliveries.
Reduced their
planned delivery
time.
Not delivering on commitments.
Putting all the delivery pressure on
our suppliers before resolving our
own internal pressures first.
Delivery
Arrears
Not enough focus on the cost of non-
quality and the cost of non-delivery.
141 | P a g e
The dependency loop highlights the effects of over-reliance on a single supplier
because of a lack of sourcing options within the overall market. Participants from the
prime mentioned how poor or immature commodity strategy development could
contribute to situations whereby the prime becomes beholden to first tier suppliers. This
is compounded by key suppliers who own the design rights on products that form a
critical part of the prime’s end product. The reverse can also happen if the majority of
a first tier supplier’s turnover is dependent on business with the prime. Obtaining the
required industry certifications and approvals has become increasingly harder for all
new entrants to the aerospace sector. The number of suppliers willing to enter the
industry has reduced as a result, therefore reducing competition in the market. The
effect of a lack of sourcing options led to the creation of the ‘Dependency on the
Supplier’ variable.
Developing and deploying multi-sourcing commodity strategies is the prime’s
main defence against IPR and becoming dependent on critical suppliers. Sound
commodity strategies are considered important because they identify options in the
supply chain and highlight the existence of alternative suppliers. However, the evidence
also points to the development and deployment of commodity sourcing strategies as
being an arduous and lengthy process resulting in different levels of strategy maturity.
In some instances reverting back to existing suppliers that have approvals already in
place may be the only option available to the prime despite a history of poor
performance by that supplier. Hence, ‘Strategy Deployment’ is included as a variable.
This is the term used by the prime for examining and choosing supply options. The loop
shows how an increase in dependency works to reduce strategic deployment activities
and consequently the number of available options reduces when the prime focuses on
only one first tier supplier. If that supplier starts to persistently fail, the prime then has
no immediate options to quickly mitigate the failure. This is influenced by the volume
of spend and / or number of parts that the first tier supplier supplies to the prime.
Observations that relate to poor commodity strategy development came principally
from participants from the prime manufacturer who associated ineffective strategic
sourcing decision making, combined with the inability to make required changes over
time, as contributory factors causing supply chain failure to persist. This can occur
when a manager has a lack of industry knowledge and supply options but most
importantly, is under significant pressure to deliver a solution quickly. Indecision can

142 | P a g e
prevent the prime from rapidly changing source when failures start to happen and
subsequently persist. This effect has led to the inclusion of the ‘Vacillation’ variable in
the loop. Vacillation is associated with decisions not being made in expedient time
because of the tendencies of managers when faced with supply problems to either not
know how to address the issue and / or swing indecisively from one course of action or
opinion to another if not well informed. The loop shows how an increase in sourcing
strategy deployment activities has the effect of reducing ‘Vacillation’ because more is
known about the supply chain and the alternative options available to the prime. Over
time, an increase in vacillation will lead to an increase in ‘failure persistence’, as
highlighted by the delay mark. The delay mark inserted between the Vacillation and
Failure Persistence variables captures the impact of management indecision and how it
increases the effects of feedback on the loop. The resultant effect means that the prime
are more likely to persist with existing suppliers for longer, which further increases
dependency.
Even though the supplier is failing, a lack of viable options in the supply chain
may prevent the manager from being able to stop failure from happening. Persistent
failures that emanate from within the supply chain result in component supply being
delayed, thus increasing delivery arrears. The prime monitors the supplier’s
performance based on their ability to deliver to agreed schedules. Persistent delivery
disruptions will be identified because of the risks to the prime and the critical
implications for manufacturing and sales. Therefore, the ‘Delivery Arrears’ variable
was included into the loop. The loop shows how an increase in ‘failure persistence’ has
the effect of increasing ‘Delivery Arrears’. The loop moves on to also show how an
increase in delivery arrears has the effect of increasing the dependency on the supplier
because the prime is reliant on the supplier to catch up with their deliveries.
The dependency loop can be classified as an unfavourable loop because it
combines to increase dependency on a failing first tier supplier with each cycle of the
loop. This can result in decision making becoming very difficult for managers at the
prime when all knowledge of available options within the market has evaporated over
time. This loop drives a short term perspective because the prime’s supply chain
management resources will spend more time trying to control and manage the supplier
on which they are dependent rather than looking for alternatives.

143 | P a g e
5.4.2 The Spend Relationship Loop.
Table 5.5 introduces and justifies the creation of causal variables that show the effect
of managing spend by the prime as a method of reducing dependency. The evidence
relating to the interaction between these variables led to the development of the spend
relationship loop shown in Figure 5.5 explained below.
23Table 5.5 Spend Relationship.
10 Figure 5.5 Spend Relationship Loop.
Supplier Influence
Leverage
Dependency on
Supplier
Supplier Growth
-
-
+
+
R6
Themes (Coding
Level 2)
Empirical Findings (Coding Level 2) Variables
(Coding Level
3)
First Tier Supplier Prime
Power, Leverage
and Dependency in
the supply chain.
Relationship
Management.
Supplier prioritisation
based on spend.
Customer dependency
from the supplier.
There is only one source you can
go to or they have got the contract
for that product so you can’t go
anywhere else.
There is a risk that we become
beholding to suppliers who
operationally haven’t been a good
performer.
Supplier
Growth
Level of Influence
depends on leverage.
Dealing with people
(organisations) that
we are not important
too.
Supplier power effects motivation
to recover.
Cost is the driver.
Lack of pressure on the supplier to
get them to up their game.
Supplier
Influence
Lack of leverage cap.
Limited competition
in market.
Prime introducing a new supplier
as a vendor does not happen
terribly often for example within
our particular team everybody
within our supply base is
established.
Sourcing decisions do not force
the assessment.
Leverage

144 | P a g e
The prime spends large amounts of money in contracts with its extensive supply
base. Evidence from the exploratory phase highlighted how some first tier suppliers
explicitly target prime aerospace manufacturers that offer long term contracts.
Aerospace contracts commonly cover both manufacturing and aftermarket
requirements for long periods of time, sometimes up to thirty years. Winning a long
term agreement has become central to the strategic objectives of many first tier
suppliers. When entering into a long term contractual agreement, the intention for both
parties is to generate revenue growth and prosper together over the duration of the
contract. However, it was evident that the greater value of spend the prime has with a
first tier supplier can correspond to an increase in interdependency over a period of
time. Evidence captured from the prime suggests that such contracts are not always the
optimal solution and can eventually result in operational and strategic problems. The
more likely outcome of dependency on the supplier is that the prime systematically
places orders irrespective of performance without thought or consideration of the
potential future consequences. Increasing the amount of business with a first tier
supplier has the positive effect of helping a supplier to grow but can also increase
dependency. Hence, the ‘Supplier Growth’ variable was included.
In contrast to the prime, first tier supplier participants reported that they had a policy of
retaining their sub-tier suppliers, even during the bad times. As a consequence of these
actions, first tier suppliers are now stepping up their efforts to find alternative customers
because re-sourcing activities conducted by the prime represents a major risk to future
business. It has also exposed the extent of the prime’s influence on the supply chain.
The effect though, will eventually cause the prime to have a weakened influence in the
market because first tier suppliers may find other customers. These observation led to
the inclusion of the ‘Supplier Influence’ variable. This describes a supplier’s power to
influence decisions based on their ability and position in the market. The influence that
a supplier has over the prime also corresponds with the increase in supplier growth over
a period of time. The delay highlighted between the Supplier Growth and Supplier
Influence variables captures how supplier influence is slowly reinforced over time as
the first tier supplier gets more work from the prime. The system gradually becomes a
closed feedback loop as the supplier’s influence increasingly makes it harder for the
prime to exit from that supplier as time passes by.

145 | P a g e
Therefore, the loop shows how an increase in supplier growth has the effect of
increasing supplier influence within the relationship between the prime and the first tier
supplier. Increasing the amount of work / expenditure with a supplier by continually
awarding new business can develop into a key operational issue for the prime if not
managed effectively. By increasing growth with key strategic suppliers, the prime runs
the risk of effectively reducing their leverage over that supplier. Leverage in a
relationship has the effect of increasing the power that the prime yields because the
options that the prime has in order to take control in the relationship become greater
than those of the suppliers. Factors that place a supplier into a position of power in the
relationship often force the prime to increase the amount of repeat business with that
supplier because of the cost and time required to transfer parts to an alternative and to
find available capability in the market. This has resulted in the inclusion of the
‘Leverage’ variable. An increase in supplier influence has the effect of reducing the
prime’s ‘Leverage’, which captures the ability to act effectively in commercial
negotiations in order to derive a favourable outcome. Over time, this can create a level
of reliance on the supplier that can affect the prime’s future supply flexibility.
Once the prime becomes heavily dependent on the supplier for the supply of
goods, the risk of the loop causing persistent supply chain failure increases with every
cycle, dynamically. The continual rise in spending with a single supplier has the effect
of increasing dependency over time. Therefore, an increase in dependency on a supplier
has the effect of increasing supplier growth. If action is not taken, then the effect of the
loop will automatically increase until the prime is completely dependent and the
supplier becomes the only source. Breaking the cycle by increasing the prime’s leverage
has the effect of reducing dependency on the supplier by the prime. An outcome of this
can mean that the supplier suddenly goes out of business leaving the prime without a
source of supply17.
Overall, the loop is reinforcing because, when all of the variables link together,
they increase the suppliers influence over the prime. The self-reinforcing nature of the
loop is highly unfavourable to the prime in a commercial relationship as it increases
dependency on supplier through increased supplier growth. This significantly increases
17 Was experienced directly by the author when supplier A went into administration leaving the prime
without a supplier for critical components used on multiple engine products. The prime were forced to
buy supplier A in order to maintain supply because of the lack of alternative suppliers.

146 | P a g e
the leverage position of the supplier, which further enhances the effects of failure
persistence.
5.4.3 The Strategy Mitigation Loop.
Strategy mitigation includes activities adopted by the prime to mitigate the effects of
being dependent on existing suppliers. Table 5.6 identifies the variables that show how
limited sourcing options within the supply chain can increase an existing first tier
supplier’s influence and reduce the resourcing options for the prime. A negative side
effect of this happens because fully managed high risk source changes can and do take
considerable time and consume valuable resources. The evidence relating to the
interaction between these variables led to the development of the strategy mitigation
loop shown in Figure 5.6 and explained below.
24 Table 5.6 Strategy Mitigation.
11 Figure 5.6 Strategy Mitigation Loop.
Starting with the strategy deployment variable, in order to counteract the effects
of dependency on the supplier, the prime develops supply strategies for all of the
relevant components. It does this in order to create options with the aim of preventing
existing suppliers from becoming too powerful and influential within the supply chain.
Leverage
Dependency on
Supplier
Strategy Deployment
Sourcing OptionsR8
-
-
+
+
Themes (Coding
Level 2)
Empirical Findings (Coding Level 2) Variables
(Coding
Level 3)
First Tier Suppliers Prime
Power, Leverage and
Dependency in the
supply chain.
Relationship
Management.
Difficult to resource IPR /
Critical products due to the
prime’s source change
process.
Limited competition in
market.
Commercial Issues.
Cost - we get what we
pay for.
Restricted supplier base -
decisions are made
around capacity and not
capability.
Sourcing
Options

147 | P a g e
The outcome of this causal linkage is that it increases the number of quality approved
supply options available to the prime. This led to the inclusion of the ‘Sourcing Options’
variable. The loop shows how an increase in commodity strategy development and
deployment has the effect of increasing the prime’s sourcing options’ as purchasing
managers seek to establish control in the supply chain through greater leverage because
of more supply options.
It was also reported that some of the participant first tier suppliers are currently
performing below acceptable standards on delivery and quality due to long term supply
chain failure but, significantly, it was noted that they are still being awarded work on
major new product development programmes. As such, they still continue to grow their
level of business with the prime and are frequently tendering for new business.
The loop is favourable because it demonstrates how an increase in sourcing
options can increase the prime’s leverage in the supply chain by introducing more
competition into the market. The loop then shows how an increase in leverage reduces
the prime’s dependency on their suppliers because there is a greater choice of suppliers
with which to contract.
5.5 Supply Chain Risk Management. Here we present and justify causal loops relating to supply chain flexibility, demand
planning and contingency risk management.
5.5.1 The Supply Chain Flexibility Loop.
Table 5.7 presents the variables relating to how a general lack of planning capability in
the wider supply chain forces the prime to micro-manage suppliers because of the risk
that failure represents to the prime. Interactions between these variables led to the
development of the supply chain flexibility loop shown in Figure 5.8 and explained
below.

148 | P a g e
25 Table 5.7 Supply Chain Flexibility.
12 Figure 5.7 Supply Chain Flexibility Loop.
Greater awareness of capable suppliers within the supply chain enables the
prime to be more proactive in sourcing. They can make more informed strategic and
operational sourcing decisions in advance which helps the prime to reduce the risk of
contracting with suppliers that do not have the capability to produce components to the
required standard. This has created a significant risk to the prime because it has steadily
become more dependent on the first tier supplier’s general ability to identify and
improve their overall capability. This has given rise to the inclusion of the ‘Supply
Chain Capability’ variable. Evidence from the exploratory phase revealed how
Dependency on
the Supplier
Strategy DeploymentFailure Persistance
-
R2
Delivery Arrears+
+
Supply Chain
Capability
Micro Management
Time to Plan
+
-
-
-
Themes (Coding
Level 2)
Empirical Findings (Coding Level 2) Variables (Coding
Level 3)
First Tier Supplier Prime
Risk
Management.
Contingency
Management.
Declining labour skills.
Companies who cannot plan.
Limited supply
chain capability.
Poor planning in
the supply chain.
Supply Chain
Capability
Lack of response / Urgency or
understanding.
Lack of trust towards customer
resulting in poor relationship.
Micro managing
suppliers.
Lack of sub-tier
control.
Micro-
Management
Poor planning in the sub-tier.
Alien and Stranger demand
(Legacy and low volume
components).
Lack of load and
capacity planning.
Poor planning.
Time to Plan

149 | P a g e
insufficient planning capability is considered to be a frequent cause of failure. The loop
demonstrates how the strategic deployment variable has the effect of increasing supply
chain capability as it results in sourcing from more capable suppliers
Further captured evidence suggests that the prime is forced to, or reacts by
micro-managing first tier suppliers when they persistently fail to meet agreed levels of
performance. As reported during the exploratory phase, the prime commits
considerable resources to identify and resolve the causes of persistent supply chain
failure, on occasion this involves ‘parachuting’ a team of supply chain personnel into
the failing supplier to quickly establish and quarantine the cause of failure in order to
ensure continuity of supply. However, the effectiveness of this heavy handed approach
was questioned by a participant from the prime and first tier supplier. They both
suggested that the short term approach didn’t actually result in an improved supplier in
the long term. Therefore, the ‘Micro-Management’ variable has been included. The
loop demonstrates how an increase in supply chain capability has the effect of reducing
the prime’s need to micro–manage within the supply chain.
It was evident that some of the micro-management approaches adopted by the
prime on high risk suppliers can be extreme, consuming valuable resources at both the
prime and first tier suppliers. To prevent / mitigate failure, the distraction caused
reduces the prime’s planning time ahead of the forward production schedule. The more
dialogue that the prime has to discuss problems with the supplier then the greater the
chance that the supplier will attempt to resolve the issues themselves rather than
standing back and letting the prime solve the failure. However, a lack of planning
capability was cited as a cause of frequent schedule changes and that micro-
management was an effect of the prime having reduced time to plan for future
production requirements. These observations led to the inclusion of the ‘Time to Plan’
variable. The loop highlights how the micro-management variable interacts with the
‘Time to Plan’ variable to reduce the amount of planning time needed to adequately
schedule future deliveries because the prime forces the first tier supplier to prioritize
critically required components. The loop then shows how an increase in the time to plan
variable subsequently has the effect of reducing failure persistence. An increase in
failure persistence increases the effect of delivery arrears, which in turn increases the
effect on dependency on the supplier. The loop is completed by the dependency on the

150 | P a g e
supplier variable having the effect of reducing the strategy deployment variable as
previously explained.
Overall the loop has a reinforcing effect on the supply chain because the greater
the dependency on the supplier, the less resourcing activities are carried out by the
prime. The number of parts that the prime has with one supplier determines whether it
will be more susceptible to a reduction in planning time available for the supplier.
5.5.2 The Demand Planning Loop.
Each contracted first tier supplier is provided with a forecasted delivery schedule every
week by the prime. The forecasted schedule is passed to first tier suppliers with the
understanding that demand may change, despite the aerospace industry having a fairly
stable demand profile compared to other sectors. The policy is put in place to protect
the prime from potential cancellations by its customers and unplanned orders.
Therefore, suppliers are incentivised to forward plan at their own risk. Table 5.8
presents variables that relate to the impact of material schedules changes on first tier
suppliers. The evidence relating to the interaction between these variables led to the
development of the demand planning loop shown in Figure 5.8.
26 Table 5.8 Demand Planning.
Themes
(Coding Level
2)
Empirical Findings (Coding Level 2) Variables
(Coding Level
3)
First Tier Supplier Prime
Risk
Management.
Contingency
Management.
Number of schedule
changes made by the
customer.
Demand is not fixed.
Treating the supplier inconsiderately
with schedule demands and not
listening when we don’t want to react to
news we don’t want to hear.
Demand signal volatility
Rescheduling
Disruption
Lack of lead-time
adherence by the customer.
Failure to identify the
correct supply chain tools
and lead times of products
as part of planning.
Lack of time.
Not supplying specifications on time
and then condensing the suppliers lead
time down.
Lead time
Accuracy
Schedule changes on a
weekly basis.
Number of Parts.
Forcing suppliers to prioritise
deliveries.
Lack of flexibility in sub-tier
management.
Supply Chain
Flexibility

151 | P a g e
13 Figure 5.8 Demand Planning Loop.
Evidence from first tier suppliers highlighted how frequent material schedule
changes can cause significant disruption to the suppliers if not planned adequately. It
was noted that regular changes to demand schedules distributed to first tier suppliers
was a cause of significant disruption to production plans at the supplier. These are
tightly managed by first tier suppliers in order to meet the customers demand schedule.
Suppliers find achieving adherence to their agreed delivery metric targets (set by the
prime) much more difficult due to such frequent changes (called exception messages18).
One supplier suggested that achieving a consistently good delivery score was almost
impossible because of the changes and noted that this was reflected by a third party
audit firm when shown the extent and frequency of the amendments. The evidence from
the empirical study led to the inclusion of the ‘Rescheduling Disruption’ variable.
Rescheduling disruption occurs due to persistent schedule changes by the prime despite
a relatively stable demand profile overall in the aerospace market. The eventual effect
is to reduce a supplier’s resilience leading to persistent failure. An increase in the time
available to plan has the effect of reducing the impact of rescheduling disruption.
Reducing the effects of disruption caused by regular rescheduling requires the
specified lead-times to be achieved each time the loop feeds back. Planning at the prime
uses fixed lead times. This should provide prior warning to the supplier and its sub-tier
supply chain for planning and should require little effort by the prime to ensure that
components are delivered on-time to the correct specification. However, the captured
evidence has resulted in the inclusion of the ‘Lead Time Accuracy’ variable which
relates to the accuracy in achieving a given lead time. The loop demonstrates how an
18 Exception messages – These appear in SAP to warn the prime that changes in delivery date
requirements have changed.
Time to Plan
Rescheduling
Disruption
Leadtime Accuracy
Supply Chain
Flexibility
-
-
+
+
R5

152 | P a g e
increase in rescheduling disruption has the effect of reducing a supplier’s lead-time
accuracy. Changes to material schedules are made by the prime in order to try and
improve its delivery performance whereas the interaction between these variables
demonstrates how it actually feeds back to reduce the first tier supplier’s ability to
deliver on time.
Due to the size of many sub-tier supply chains, the risk of first tier suppliers
utilising unapproved sub-tier suppliers can increase. A lack of control within the first
tier supply chain also reduces overall supply chain flexibility, effectively leaving the
prime exposed to the risks of supply chain failure. Flexibility denotes the supplier’s
ability to manage their own internal production management system effectively in the
presence of frequent demand change requests by the prime. The captured observations
led to the development of the ‘Supply Chain Flexibility’ variable. The loop
demonstrates how an increase in lead time accuracy by the supplier has the effect of
increasing supply chain flexibility. An increase in supply chain flexibility helps the
prime by increasing the time to plan because the supplier has the ability to manipulate
their production plan, i.e. they can bring the delivery of parts forward or move them
back without compromising the rest of their production plan.
Overall, the loop has been classified as favourable because the variable that
causes the most issues for the prime and supplier, is rescheduling disruption. This
variable is being counteracted positively by the other three variables. The loop
reinforces to increase the prime’s time to plan, which decreases failure persistence
because the prime has more visibility and time to inform suppliers of upcoming changes
in demand, giving them more time to react.
5.5.3 The Contingency Risk Loop.
It is often the case that orders for components need to be made months in advance
because the raw materials required to manufacture them often have a long lead time due
to high demand within the industry. Table 5.9 highlights and justifies variables that
capture the effects of outsourcing and the need for adequate risk management processes
within the first tier supply chain as a result. The variables that go into formulating the
contingency risk loop have been created to capture the effect of outsourcing
components from a supply chain that is widely dispersed geographically. This includes
supply chains located in geo-political hotspots and / or in the vicinity of areas that are
affected by natural disasters. The evidence relating to the interaction between these

153 | P a g e
variables led to the development of the contingency risk loop shown in Figure 5.9
explained below.
27 Table 5.9 Contingency Risk.
14 Figure 5.9 Contingency Risk Loop.
Throughout the exploratory phase it became clear that participant first tier
suppliers operated at very different levels of competency when it came to identifying
internal and external risks associated with sourcing components from their sub-tier
supply chain. It was acknowledged by participants from the prime that failure to identify
and manage key risks at critical stages in the contract formulation stage between the
prime and first tier supplier, could contribute to persistent failure later on in a
Time to Plan
Rescheduling
Disruption
Supplier Resilience /
RobustnessOutsourcing
External Material
Supply
-
-
+
+
-
B5
Themes
(Coding Level
2)
Empirical Findings (Coding Level 2) Variables
(Coding Level 3)
First Tier Supplier Prime
Risk
Management.
Contingency
Management.
Sticking to plan.
Lack of Business
Continuity Management
(BCM).
Joint risk assessments not
robustly in place.
Willing to change.
Unapproved sub-tiers.
Supplier
Resilience and
Robustness
Poor or very bad
supplier sourcing.
Supplier doesn’t see the
need to perform or have
the capability to
perform.
Number of suppliers in high risk
areas.
Sourced IPR components in
known global trouble spots.
It is very difficult to transfer
these out and takes a long time.
Outsourcing
Weak auditing of supply
chain capability.
Lack of raw material
availability.
There have been some very close
calls in recent times. We have
dodged bullets and this has
woken people up to the realism.
Unsure whether BCM is high on
the list of priorities.
External
Material Supply

154 | P a g e
commercial relationship. The emphasis placed on risk management within the supply
chain depends on the size of the supplier. The ability to successfully manage supply
despite the effects of disruption led to the development of the ‘Supplier Resilience and
Robustness’ variable. In this context it is defined as a first tier supplier’s ability to
recover from a failure and not cause any disruption to the prime. The loop demonstrates
how an increase in rescheduling disruption has the effect of causing a reduction in
supply chain robustness and resilience. Over a period of time, constant rescheduling
will incrementally weaken the supplier’s ability to react to changes creating further risks
for the prime.
In contrast to observations made at the prime, captured perceptions by the first
tier suppliers was that risk management was an area very much reserved for senior
management with minimal information flowing down to the rest of the organisation.
Some first tier supply participants said that they had started to hold discussions with the
prime regarding the subject of risk management. They believed that in order to
successfully outsource key components into the supply chain, management of risk is
critical to ensuring persistent failures do not occur. These issues led to the creation of
the ‘Outsourcing’ variable, reflecting the amount of effort made by the prime to capture
risks when outsourcing components to globally dispersed supply chains. The loop
shows how an increase in supplier resilience / robustness will have the effect of
increasing the drive by the prime to increase outsourcing of components because the
perceived risk of doing so is reduced.
Mitigating key identified risks is a significant issue for the prime because of events that
have occurred in recent years that had caused extreme disruption to raw material supply
in particular, hence the inclusion of the ‘External Material Supply’ variable. The loop
shows how an increase in outsourcing has the effect of increasing external material
supply. This is because a greater volume of parts are sourced from the first tier supply
chain rather than produced in house. Therefore, greater effort is required by the prime
to get the parts to where they need to be at the correct time. The key risk to the prime
is that an increased use of a widely dispersed suppliers will cause a reduction in the
level of flexibility within the prime’s supply network and therefore reduces the amount
of time available to plan at the prime because much of the time will be used to transport
the components from the supplier to the prime. The delay highlighted between the
Outsourcing and External Material Supply variables demonstrates how outsourcing

155 | P a g e
product into the supply chain is a slow process. Therefore any problems with internally
manufactured products will not be dealt with quickly. Increased planning time within
the network feeds back to reduce the pressure on rescheduling disruption because the
prime and subsequently first tier suppliers are given more time to manage demand
changes within their production planning system.
Overall, this causal loop diagram is unfavourable to the system because it feeds
back and reinforces to reduce planning time for the prime. The increase of both the
outsourcing and external material supply variables increases the risk of delivery
disruption to the prime by reducing the amount of time that the prime has available to
plan for changes.
5.6 Relationship Management. Here we present and justify causal loops relating to communication, relationship
management and information delay loops.
5.6.1 The Communication Loop.
Table 5.10 presents variables identified relating to communication between the prime
and the supplier and their impact on supply chain performance. The evidence relating
to the interaction between these variables led to the development of the communication
loop shown in Figure 5.10.
28 Table 5.10 Communication.
Themes
(Coding Level
2)
Empirical Findings (Coding Level 2) Variables
(Coding Level
3)
First Tier Supplier Prime
Relationship
management
Dealing with people
(organisations) that we are
not important too.
Seniors with own agenda.
Selective Communication.
Miscommunication prompting
capacity risk.
We need to understand what
the drivers of the relationship
are.
Dialogue with
the Supplier

156 | P a g e
15 Figure 5.10 Communication Loop.
Captured evidence found that the quality of the relationships the prime has with
first tier suppliers can affect the level of effort expended by suppliers, especially when
personnel changes occur, changing the relationship dynamics and the type and mode of
communication. These observations have led to the inclusion of the ‘Dialogue with
Supplier’ variable. Starting with the failure persistence variable, the loop demonstrates
how an increase in failure persistence has the effect of increasing dialogue with the
supplier considerably, as a number of the supply chain functions within the prime
urgently try to mitigate the failure and avoid further disruption.
The interaction shows how failure persistence stimulates the prime into
increasing the amount of dialogue they have with the supplier in order to reduce or
balance out the failure and increase quality and / or delivery adherence by implementing
supplier improvement initiatives. The loop then cycles in a clockwise direction showing
how an increase in the dialogue with supplier has the effect of increasing the number
of supplier improvement initiatives. Persistent failures trigger a significant increase in
dialogue with the supplier as the prime attempts to identify the cause of failure and
quickly mitigate its effects. An increase in quality adherence then has the effect of
reducing failure persistence, which reduces the continued disruption to the prime.
The communication loop has been classified as favourable because the system
essentially combines to reduce the effects that cause failure persistence after each cycle
of the loop. The reduced effect could be temporary as other loops continually reinforce
to increase the pressure being placed on the prime. The loop also shows implicitly the
existence of a reactive management style displayed by the prime because dialogue with
supplier increases only when the prime is experiencing persistent failures. Dialogue
Quality Adherence
Failure Persistance
Dialogue with
Supplier
Supplier Improvement
Initiative
-
+
+
+
B2

157 | P a g e
with the supplier then becomes critical because both parties have to quickly identify
where the failure is happening in the process before it becomes too difficult to contain.
5.6.2 The Relationship Management Loop.
Table 5.11 presents variables relating to communication and their effects on the buyer-
supplier relationship. There is often a lack of understanding emanating from both the
prime and supplier regarding technical specifications, forthcoming fluctuations in
demand and changes to the quality management system. These issues have the effect of
impairing the supplier’s ability to understand what the prime actually wants in order to
fulfil the requirement properly. The identified interactions between these variables
resulted in the development of the relationship management loop shown in Figure 5.11.
29 Table 5.11 Relationship Management.
16 Figure 5.11 Relationship Loop.
Dialogue with
Supplier
Understanding of
Requirements
Ambiguity
Commitment and
Trust
+
-
-
+
R4
Themes
(Coding Level
2)
Empirical Findings (Coding Level 2) Variables (Coding
Level 3)
First Tier Supplier Prime
Relationship
Management
Customer not clearly
communicating what
they want.
Poor information flow /
poor communication.
Vagueness around expectations.
Lack of clarity of requirements.
Understanding of
Requirements
Not knowing what the
customer wants.
Poor information in load.
Sending out the wrong message.
Internal communication issues at
suppliers whereby senior people do not
get given the real picture by middle
management.
Ambiguity
Lack of trust towards
prime resulting in poor
relationship.
Poor communication.
Not viewed as long term partner.
Relationship is broken.
Commitment and
Trust

158 | P a g e
Throughout the exploratory phase, a commonly identified theme was the
negative effect on supply chain performance of a breakdown in the relationship between
the prime and first tier supplier. The evidence indicates that a general lack of
communication and poor relationship management practices could translate into delays
in delivery and quality non-conformances, increasing the likelihood of persistent supply
chain failure. New contacts may have a different agenda, scope, or responsibilities and
this may result in inconsistent information flows and general frustration. The findings
captured from the exploratory stage suggest that current relationships with the prime
are far from consistent, heightening the risk of failure. These findings led to the
development of the ‘Understanding of Requirements’ variable. Starting with the
dialogue with the supplier variable, the loop shows how an increase in the dialogue with
supplier has the effect of increasing the understanding of requirements by both the
prime and the first tier supplier. This is simply because both parties will take the time
to focus on and discuss the issues that are causing problems.
The evidence suggests that in practice these activities are not in many cases
consistently maintained over the period of a commercial relationship because of issues
with lack of personnel continuity. It was felt that vagueness came in the form of the
prime sending out the wrong messages, resulting in a heightened level of ambiguity
towards design requirements, especially during NPI projects. The evidence also
suggests that failure to consistently communicate with a supplier can cause significant
confusion, leaving suppliers not knowing how to work with the prime or what is
expected of them. Therefore, ‘Ambiguity’ was included as a variable. The loop shows
how an increase in the understanding of requirements has the effect of reducing
ambiguity because queries from either party are dealt with in an understandable and,
importantly, expedient way.
Evidence from the exploratory phase also indicates that a lack of trust by the
supplier towards the customer could result in a poor relationship. Likewise, this
situation arises when first tier suppliers feel that they are not viewed as a long term
partner, resulting in efforts being directed elsewhere. Therefore, ‘Commitment and
Trust’ has been included as a variable because the existence of trust between both
parties is important to ensure that a relationship does not break down. The loop shows
how an increase in ambiguity has the effect of reducing commitment and trust because
the supplier quickly becomes frustrated when they do not know what is required and
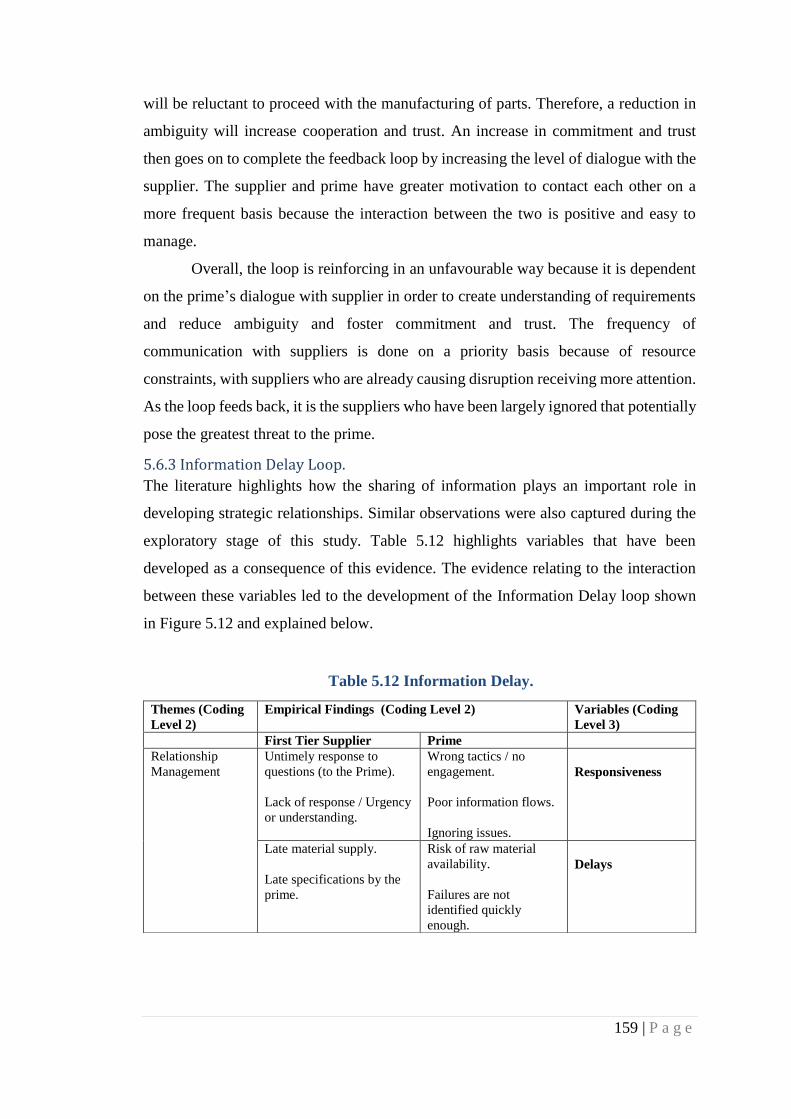
159 | P a g e
will be reluctant to proceed with the manufacturing of parts. Therefore, a reduction in
ambiguity will increase cooperation and trust. An increase in commitment and trust
then goes on to complete the feedback loop by increasing the level of dialogue with the
supplier. The supplier and prime have greater motivation to contact each other on a
more frequent basis because the interaction between the two is positive and easy to
manage.
Overall, the loop is reinforcing in an unfavourable way because it is dependent
on the prime’s dialogue with supplier in order to create understanding of requirements
and reduce ambiguity and foster commitment and trust. The frequency of
communication with suppliers is done on a priority basis because of resource
constraints, with suppliers who are already causing disruption receiving more attention.
As the loop feeds back, it is the suppliers who have been largely ignored that potentially
pose the greatest threat to the prime.
5.6.3 Information Delay Loop.
The literature highlights how the sharing of information plays an important role in
developing strategic relationships. Similar observations were also captured during the
exploratory stage of this study. Table 5.12 highlights variables that have been
developed as a consequence of this evidence. The evidence relating to the interaction
between these variables led to the development of the Information Delay loop shown
in Figure 5.12 and explained below.
30 Table 5.12 Information Delay.
Themes (Coding
Level 2)
Empirical Findings (Coding Level 2) Variables (Coding
Level 3)
First Tier Supplier Prime
Relationship
Management
Untimely response to
questions (to the Prime).
Lack of response / Urgency
or understanding.
Wrong tactics / no
engagement.
Poor information flows.
Ignoring issues.
Responsiveness
Late material supply.
Late specifications by the
prime.
Risk of raw material
availability.
Failures are not
identified quickly
enough.
Delays

160 | P a g e
17 Figure 5.12 Information Delay Loop.
Potential causes of a relationship breakdown and contributors to persistent
supply chain failure were attributed to issues concerning the responsiveness of either
the first tier supplier or the prime for requests for information. This includes delays in
responses to questions, or worse where one party continually ignores issues or requests
for information. Responsiveness is the time it takes the prime to respond to a question
in such a manner that any doubt regarding the answer to a query is clarified, thus
enabling the process of manufacturing components to continue. Therefore, the
‘Responsiveness’ variable was added. Starting with the understanding of requirements
variable, this was frequently cited as being a key interaction between the prime and
supplier to ensure that the correct requirements are being satisfied. Therefore, the loop
shows how an increase in understanding of requirements has the effect of increasing
responsiveness between first tier suppliers and the prime.
In the context of the loop, delays can be caused due to requests for information
from the first tier suppliers not being answered by the prime expediently. This could
result in the first tier supplier halting production of the component until the required
information is given by the prime leading to late deliveries. Equally, late specifications
provided by the prime could cause ‘Delays’ hence its inclusion as a variable. All late
deliveries affect the scorecard of a first tier supplier negatively irrespective of the cause.
Therefore, any assistance given by the prime to mitigate potential delays will improve
cooperation and trust between the two parties. The effect is that delays or the risk of
delays can be reduced if the request for information is dealt with in an expedient way.
The loop shows how an increase in responsiveness has the effect of reducing ‘Delays’.
Dialogue with
Supplier
Understanding of
Requirements
Commitment and
Trust
+
+
R7
ResponsivenessDelays+
-
-

161 | P a g e
Evidence indicates that internal relationship management and in particular
relationship continuity is a key antecedent to persistent supply chain failure. To some
extent, this drives the way in which the prime manufacturer communicates with, and
manages relationship issues with the external supply chain. The loop shows how an
increase in delays has the effect of reducing commitment and trust between both the
prime and the supplier. Subsequently, the loop shows how an increase in commitment
and trust then has the effect of increasing dialogue with the supplier, which then
increases the level of communication between the two parties. An increase in dialogue
with the supplier subsequently has the effect of increasing understanding of
requirements, which completes the loop.
The information delay loop is a favourable self-reinforcing loop because it feeds
back to gradually increase the level of communication between the prime and supplier
after each cycle. However, it often takes the prime a long time to build up a good level
of communication with a first tier supplier. The difficult aspect of this for the prime is
that it takes perseverance to build up a good relationship with a supplier which comes
at a cost in the use of personnel resources.
5.7 The Core Failure Persistent Loop. Figure 5.13 shows how a core loop made up of variables from four key loops discussed
above (Quality Adherence, Dependency, Supply Chain Flexibility and
Communication) is at the centre of the failure persistent model. This failure persistence
loop has been developed by combining the effects of identified variables that interact
to cause supply chain failure and the actions taken by the prime to try and mitigate those
failures.

162 | P a g e
18 Figure 5.13 Failure Persistence Loop.
The failure persistent loop essentially captures events and activities that affect
the prime’s supply chain over time and either reinforce interactions between variables,
leading to failure, or events and activities that are conducted to reduce the effect of
persistent failure. Starting with the quality adherence variable, the loop shows how an
increase in quality adherence has the effect of increasing dependency on the supplier
because finding previously unknown or unused suppliers with all of the appropriate
aerospace industry and specific customer approvals is very challenging. The prime does
seek to develop new suppliers but this is a very costly and time consuming endeavour.
Another option for the prime is to stick with existing suppliers that are already fully
approved and currently supply products to the prime even though they have a history
of failure and causing disruption.
Captured evidence indicates that existing suppliers are in a position of power
because they already have experience and a working relationship with the prime and
enjoy a level commitment through existing business. It is therefore perceived as being
less risky by the prime to retain the incumbent supplier because they are already
established. This does, however, leave the prime vulnerable to price changes as a result
of commercial lock-in as alternatives are gradually diminished over time.
The next key interaction between the variables demonstrates how an increase in
the dependency on the supplier has the effect of reducing strategic sourcing and
deployment activities carried out by the prime. In theory persistent failure should result
Quality Adherence
Dialogue with
Supplier
Supplier Improvement
Initiative
+
+
B3
Dependency on
the Supplier
Strategy Deployment
-
Supply Chain
Capability
Micro Management
Time to Plan
+
-
-
+
+

163 | P a g e
in an increase in sourcing activities rather than reducing it. However, participants from
the prime talked about how preventing failure in the existing supply chain uses up
considerable personnel resources and actually reduces the opportunity to investigate
and deploy new sourcing strategies. Every sourcing strategy deployment activity should
have the effect of increasing the prime’s knowledge of the supply chain through the
study and the identification of existing and new capability within alternative but related
industries. The result of such activities were described as mixed, with some sourcing
strategy deployment activities being more successful than others. Ideally, an increase
in sourcing strategy deployment activities should increase the prime’s supply chain
capability through identification of capable suppliers. The loop demonstrates how
successfully deploying new sourcing strategies should be a key part of the resourcing
activity, although it was found that this is not always the case.
A greater awareness and holistic knowledge of what is happening within the
prime’s supply chain reduces the need for the prime to engage in micro-management
of the supply chain. It was evident that a knock-on effect of micro-management of high
risk suppliers is an increase in the amount of resource dedicated to prevent / mitigate
failure. Conversely, an increase in supply chain capability has the effect of reducing
micro-management. An increase in the amount of micro-management activity reduces
the prime’s time to plan against the production schedule. The loop shows how greater
planning time available to the prime will enable an increase in dialogue with the
supplier, which works in both directions. Greater discussion should provide both the
prime and the first tier supplier with more time to react to changes in schedules.
The more dialogue the prime has available to discuss issues with the supplier
then the greater the chance that the supplier will deliver parts on time. Hence, the loop
demonstrates how an increase in the dialogue with supplier will increase the
implementation of supplier improvement initiatives (even if it is only for a short period
of time) in order to facilitate improvement in quality adherence. The core loop then
moves on to show how an increase in supplier improvement initiatives will have the
effect of increasing quality adherence. This is mainly due to the prime’s quality system,
which must be fulfilled in all sourcing deployment activities and subsequent production
activities.
Overall, the core loop demonstrates how each of the variables not only interact
with other variables within each loop, they also link with variables from other loops

164 | P a g e
that relate to different themes. Therefore, the core loop shows that quality management,
power / leverage, risk management, and relationship management are all inter-
connected. Variables that sit within each of these areas can interact to cause an effect
that results in persistent failure if not captured in the first instance or mitigated quickly
once failure occurs. The loop shows the activities that are most likely to cause issues
within the prime’s supply chain and result in persistent supply chain failure if they are
not identified and successfully addressed.
The core loop shows how key activities such as effectively monitoring the
supply chain to ensure adherence to quality standards is critical in order to avoid repeat
non-conformances. The difficulties faced by suppliers in adhering to the prime’s quality
management system are well known. Therefore, the prime should be actively working
with suppliers to make this process much easier and not continually ‘moving the goal
posts’ by changing requirements and specifications and failing to inform suppliers of
the changes expediently. The prime should make the correct sourcing decisions and
then control the level of spend they have with a supplier. These actions will help to
reduce the effects of dependency and becoming beholden to a supplier. Informed
strategic sourcing decisions should be made on what is known about the capability of a
chosen first tier supplier rather than reverting to existing long term relationships.
However, relationships should be cultivated and driven by the prime, which involves
consistent and effective communication with all first tier suppliers.
5.8 Developing the Persistence Failure Model. Figure 5.14 is titled “The Failure Persistence Model”. It shows the full failure
persistence model in its entirety and is the first iteration of the complete model. The
model was subsequently reviewed and critiqued by participants from the prime during
the workshop stage of the validation study. The findings of this workshop are presented
in Chapter 6.

165 | P a g e
19 Figure 5.14 Failure Persistence Model.
Each loop is a visual representation of the interactions between each variable
that develop over time at the prime and within the first tier supply chain. They are the
end result of sustained activities conducted by either the prime or the supplier over a
number of years. The loops are the result of cause and effect relationships that have
influenced company sourcing strategy, and the approaches, philosophy and culture that
have evolved over time.
Failure Persistence
Quality Adherence
Supplier Improvement Initiatives
Dependency on the Supplier
-
Vaccillation
Strategy Deployment
-
-
+
Dialogue with the Supplier
+
Time to Plan
-
+
Outsourcing
External Material Supply
Rescheduling Disruption.
Leadtime Accuracy
Supply Chain Flexibility
Supplier Resilience / Robustness
+
+
Supplier Audits
Non Conformances
Process Compliance
Disruption
++
+
-
Understanding of RequirementsCommitment and Trust
ResponsivenessDelays
-
Ambiguity
-
-
-
Supplier Influence
LeverageSupplier Growth
Sourcing Options
-
+
+- +
-
+
+
++-
+
Supply Chain Capability
+
Short Term Quick Fixes
Root Cause Analysis
+
-
+
Delivery Arrears
+
+
-
-
+
-
Micro Management
-
-+
Focus on Supplier+
++
+
B1
B2
R1
R2
B3
R5
B5
R4
R7
B4
R3 R6
R8

166 | P a g e
Overall, it was identified that when the variables interact, they can manifest into
a reoccurring failure that becomes increasingly hard to remedy (Sterman, 2001). Due
to the sheer size and complexity of the prime’s organisation and equally the size and
complexity of its supply chain, it is difficult for managers to comprehend and capture
the relationships between cause and effect of every decision that is made. Hence, the
risk of persistent failure is present with every critical decision made by the prime.
5.9 Glossary Defining the Chosen Variables. Table 5.13 provides a full glossary describing all of the variables included in the first
iteration of the failure persistent model in alphabetical order. The glossary helps the
reader further understand each interaction between the variables and how the polarities
affect the loops.
31 Table 5.13 Failure Persistence Model Glossary.
VARIABLE DESCRIPTION
“Ambiguity” The first tier supplier does not know what is expected of them in some
aspect of the commercial or operational relationship with the prime.
“Commitment and
Trust”
A strong collaborative working relationship exists between the first tier
supplier and the prime. Both the first tier supplier and the prime share joint
goals in order to be successful.
“Delays” Occur when requests for information or clarification from the first tier
supplier are not answered by the prime expediently or specifications are not
provided by the prime in sufficient time resulting in late deliveries.
“Dependency on
Supplier”
Heavy reliance on a first tier supplier due to them either being a sole source,
or there being limited alternative capability in the supply chain, or because
the supplier has IPR ownership.
“Delivery Arrears” The level of late deliveries from a supplier against the material delivery
schedule specified by the prime.
“Disruption” A supply failure emanating from a first tier supply chain that leads to
interruptions to the prime’s assembly line or build schedule.
“Dialogue with
Supplier”
The interaction and communication between the prime and the first tier
supplier.
“External Material
Supply”
The complete supply chain from raw materials through to the assembly
operations of the prime.
“Failure Persistence” Supply chain failure that continues to happen despite multiple efforts by the
prime and a first tier supplier to resolve it.
“Focus on Supplier” The additional time and resource placed on a specific first tier supplier by
the prime when they start to fail persistently.

167 | P a g e
“Lead-Time
Accuracy”
A first tier supplier’s ability to accurately achieve a given lead time with the
prime on a consistent basis.
“Leverage” Either the prime or first tier supplier uses its resources to derive an
advantage in a commercial relationship over the other, leading to a strong
negotiating position for that party.
“Micro–Management” A management style adopted by the prime where it closely monitors,
observes or controls the work of the first tier supplier and/or its sub-tier
suppliers.
“Non-Conformance” Components supplied by the first tier supplier that do not meet the required
specification as contractually agreed.
“Outsourcing” Activities conducted by the prime to source components that were
previously manufactured in-house from outside first tier suppliers.
“Process Compliance” Consistent conformance to the prime’s quality management process and
system.
“Quality Adherence” Compliance to both industry regulations and the prime’s required
specifications by the first tier supplier.
“Rescheduling
Disruption”
The level of change in delivery schedules and / or date delivery date changes
made by the prime to the first tier supplier’s existing delivery schedules.
“Responsiveness” The amount of time taken by the prime to respond to a query / question by
the first tier supplier.
“Root Cause Analysis” Methodological analysis of a non-conformance to identify the main
underlying cause of a problem, which aims to ensure repeat failures do not
happen.
“Short Term Quick
Fixes”
Non-conformances that are resolved in order to fix problems quickly but
without investigating the underlying root cause of failure.
“Sourcing Options” The number of viable alternative suppliers that the prime can contract with
in the market for a particular component, sub-assembly or system.
“Supplier Audits” Investigation and analysis of a supplier’s quality management system and its
ability to meet requirements set by the prime.
“Supply Chain
Capability”
A first tier supplier with strong production and sub-tier planning and
management capability.
“Supplier Growth” The increase in a supplier’s turnover due to the increase in the volume of
orders being placed by the prime with the supplier.
“Supply Chain
Flexibility”
A first tier supplier’s ability to deliver parts on time despite schedule
changes imposed by the prime.
“Supplier Influence” The influence that the first tier supplier has over the prime due to a specific
capability that the first tier supplier posesses where there are limited
alternatives for the prime.

168 | P a g e
“Supplier Resilience /
Robustness”
A first tier supplier’s ability to recover from a failure and not cause any
disruption to the prime.
“Strategy
Deployment”
The term used to describe the development and use of sourcing strategies by
the prime. Strategies involve identifying new or alternative suppliers and
deciding what, from where, and when to source components.
“Time to Plan” The length of time the prime has to plan material deliveries with the first tier
supplier.
“Understanding of
Requirements”
A first tier supplier’s ability to understand a component specification given
to them by the prime and then convert the requirement into a manufactured
component.
“Vacillation” The inability by supply chain managers at the prime to decide between
different opinions or actions when faced with a failing supplier.
5.10 Chapter Summary. The purpose of Chapter 5 was to show how the research evidence and findings were
initially coded and then used to develop the first iteration of the causal loop model.
Throughout Chapter 5, the data was gathered together, categorised and used to develop
causal variables. Following on from the variable creation process, interactions between
each of the variables were identified and analysed, culminating in the introduction of
each of the causal loops. By conducting the coding process from step one through to
step eight as described in Chapter 3, all of the semi-structured interview data from both
sides of the dyad was analysed and captured. The loops were then formulated using
variables developed from the findings made during the exploratory phase and used to
highlight causes and effects that result in persistent supply chain failure. It was also
found that all of the loops that made up the model could be placed within four dominant
themes as shown in Figure 5.15.
As a consequence of a workshop conducted at the prime significant changes and
improvements were made to the failure persistence model in order to develop a model
that could be used by managers to define, understand interaction between variables and
subsequently mitigate against persistent supply chain failure. The observations made
by the workshop participants and the changes made are documented during Chapter 6.

169 | P a g e
20 Figure 5.15 Failure Persistence Model Key Themes.

170 | P a g e
Chapter 6 Causal Model Validation Phase. The purpose of Chapter 6 is to analyse and review comments, observations and critique
of the failure persistence model captured during the model validation workshop
(described in Chapter 3) held at the prime’s facility. The purpose of the workshop was
to test the validity and applicability of the model and to seek improvements and
refinements where justified. All causal loop diagrams must be robust and justifiable to
achieve consensus of opinion (Morecroft, 2009).
The discussion and feedback highlighted throughout Chapter 6 serve to
strengthen the methodological rigour of multiple case study research (Thomson and
McLeod, 2015). A further aim of the workshop was to not only validate each individual
loop, but also to guide the evolutionary development of the causal loop model towards
becoming a tool that could be used to help supply chain managers identify, understand
and mitigate failure. Once each of the failure persistent loops are examined and all of
the comments and observations are discussed, a final iteration of the failure persistence
model is presented along with a detailed description of the changes made.
For most of the participants, it was the first time they had been exposed to the
concept of causal loop diagrams. Therefore a full explanation of the model was given
prior to the workshop group sessions to ensure that the participants understood the basis
for each loop. Below, the loops are presented individually following the same sequence
used in Chapter 5. To further enhance the findings from the workshop, all of the
captured comments relevant for a loop are included in a table accompanying that loop.
Alongside these, each loop is labelled to indicate the position on the loop to which the
observation relates and is matched to a corresponding position number in each table.
6.1 Prime Validation and critique of the Failure Persistence Model. As discussed in Chapter 3 (Methodology and Design), the workshop was attended by
nine supply chain professionals (here called ‘the participants’) representing multiple
departments ranging from supply chain and operations to engineering functions. The
workshop sought to identify those aspects of the model that truly reflected current
reality and those that the participants found problematic or difficult to understand. To
facilitate detailed analysis and critique the participants were divided into three breakout
groups during the workshop, each led by one of the research team. Each of the
observations presented in this Chapter originated from the group feedback sessions
conducted during the workshop, which were captured on flip charts by each group as

171 | P a g e
well as recorded with the use of Dictaphones. In summary, the agenda for the workshop
was as follows:
Introductions and Presentation of Workshop Aims – What is persistent supply chain
failure.
Workshop Part 1.
o Group Session – Causal loop diagrams.
o What are the causes of persistent supply chain failure? – validating the
failure persistence model.
Lunch Break.
Workshop Part 1 Continued.
o Causal Loop Diagrams.
o Group feedback session.
o Validation of the failure persistence model.
Feedback session.
Close.
Details of all comments and observations are presented below, one loop at a
time, eventually leading to the development of the completed causal loop model. Table
6.1 provides a summary of the main issues with each loop as discussed by the workshop
participants.
32 Table 6.1 Type of Issues Captured during the workshops.

172 | P a g e
6.1.1 The Quality Adherence Loop.
The quality adherence loop shown in Figure 6.1 was the first loop to be discussed during
the feedback presentation session. The quality adherence loop was developed in
recognition of the difficulties suppliers face when trying to adhere to the prime’s quality
management system.
21 Figure 6.1 Quality Adherence Loop.
33 Table 6.2 Quality Adherence Loop Group Feedback.
The observations made regarding the quality adherence loop set the tone in
terms of the language used to comment on each issue. Position 1 shown in Figure 6.1
and described in Table 6.2 was captured as a problem with the naming convention of
the ‘focus on supplier’ variable and the polarity relating to it. The polarity between the
‘failure persistence’ and ‘focus on supplier’ variables was questioned. The problem was
described by a participant: “You’ve got that down as a positive [Failure Persistence
increases Focus on Supplier]. It could be a negative, so it could be open to debate”.
This was also the first indication of the significance placed by participants on using
accurate naming conventions within each loop and the importance of polarities making
intuitive sense. Each variable name and each polarity needs to be made crystal clear in
Failure Persistence
Focus on Supplier
Quality Adherence,
Supplier Improvement Initiatives
-
+
+
+B1
1
2
3
4

173 | P a g e
a future iteration in order to facilitate understanding of the complete model. This will
further improve the usability of the model.
The observation highlighted in position 2 also focuses on an issue that was to
recur in the validation process – the implementation and interpretation of time delay
symbols. It became apparent that time delays could be open to interpretation because
their inclusion was mostly based on the mental models described by the participants
(Groesser and Schaffernicht, 2012). Time delay placements need to be fully backed up
with firm evidence, logic and reasoning, otherwise interpreting the model as intended
could prove difficult. Being able to interpret the model is a critical factor (Morecroft,
2009) because each loop seeks to show contributory causes of persistent failure over
time.
The issue highlighted in position 3 relates to comments regarding the ‘quality
adherence’ variable and its relationship with the ‘dependency on supplier’ variable. It
was noted that the relationship between supplier improvements and quality adherence
can be context specific and could depend on the circumstances surrounding the
relationship between the prime and the supplier (Kähkönen, 2014). The example given
was that a supplier’s willingness to participate in improvement activities can rely on
how dependent they are on the prime. Captured comments also hint at some issues with
the directionality of the sequence of events in the loop.
The issue highlighted in position 4 relate to a debate regarding the naming
convention of the ‘supplier improvement initiative’ variable. The workshop participants
argued that the naming convention ‘supplier improvement initiative’ seems to imply
the prime will effectively push suppliers for an improvement. This narrative was met
with disapproval by some workshop participants who suggested that improvement was
a joint activity between the prime and first tier supplier. The loop was subsequently
amended in order to reflect the observations made (see full description of changes later
within the Chapter).
6.1.2 The Disruption Loop.
The disruption loop shown in Figure 6.2 generally gained approval from all of the
participants and the discussion involving the interactions between variables within the
disruption loop validated the link between disruption and short term quick fixes.

174 | P a g e
22 Figure 6.2 Disruption Loop.
34 Table 6.3 Disruption Loop Group Feedback.
The participants described this loop as closely reflecting actions and
consequences experienced by the prime: “We reflected on the fact that with the Loop
R3 we recognise a lot of short term fixes versus root cause and proper fixes. So loops
B1 [Quality Adherence] and R3 resonated a lot in terms of the prime’s behaviour”.
As per Table 6.7 (described later), discussions revolved around the removal and
subsequent adding of alternative variables to the loop and incorporating a time delay
mark combined with the possibility of adding an extra loop. This was suggested in order
to acknowledge how the interaction between variables evolve slowly (denoted by
position 1). These issues were debated by the participants in relation to position 2: “If
we look at loop six, we were debating between supplier audits and process compliance
- was there actually a supplier improvement initiative in that loop? So what actually
drives from the audit to actually get compliance? There’s obviously something
happening and that would be an improvement activity. Again, the time delay and then
we are drawing a link, also creating another link for yourself which was linking process
compliance right round to root cause analysis on R3”.
However, findings from the exploratory phase and comparable comments made
during the workshop suggest that this is more of a desired outcome by the prime, rather
than a reflection of reality. Although there was a suggestion that the prime was actively
working on initiatives to reduce disruptions through conducting root cause analysis.
However, the empirical evidence indicates that current reality and practices are less
optimistic for persistently failing suppliers. A more realistic representation of the actual
Disruption
Short Term
Quick Fixes
Quality Adherence
Non Conformances
+
+
R3
Root Cause Analysis
-
+
-
1
2
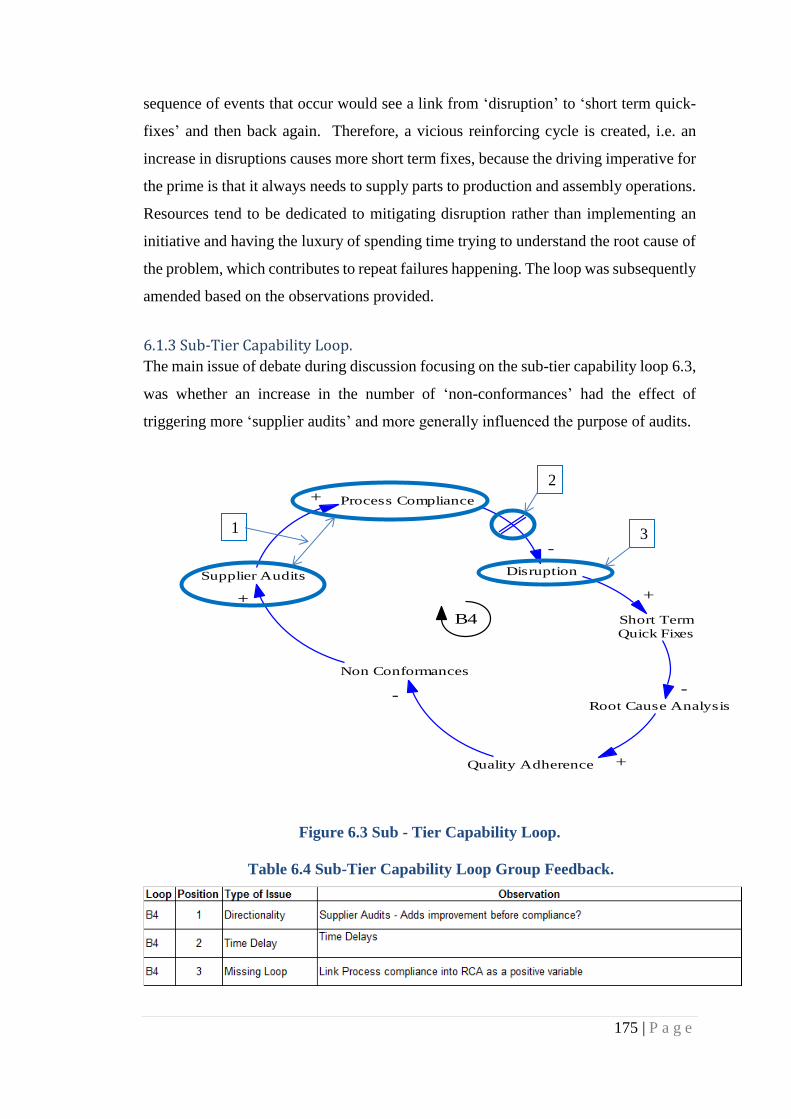
175 | P a g e
sequence of events that occur would see a link from ‘disruption’ to ‘short term quick-
fixes’ and then back again. Therefore, a vicious reinforcing cycle is created, i.e. an
increase in disruptions causes more short term fixes, because the driving imperative for
the prime is that it always needs to supply parts to production and assembly operations.
Resources tend to be dedicated to mitigating disruption rather than implementing an
initiative and having the luxury of spending time trying to understand the root cause of
the problem, which contributes to repeat failures happening. The loop was subsequently
amended based on the observations provided.
6.1.3 Sub-Tier Capability Loop.
The main issue of debate during discussion focusing on the sub-tier capability loop 6.3,
was whether an increase in the number of ‘non-conformances’ had the effect of
triggering more ‘supplier audits’ and more generally influenced the purpose of audits.
23 Figure 6.3 Sub - Tier Capability Loop.
35 Table 6.4 Sub-Tier Capability Loop Group Feedback.
Disruption
Short Term
Quick Fixes
Quality Adherence
Non Conformances
+
B4
Root Cause Analysis
-
+
-
Process Compliance
Supplier Audits
+
+
-
1
2
3
176 | P a g e
The frequency of audits is often prescribed by industry standards. The focal
point of the discussion centred on the number of industry requirements that go into
developing an audit plan. However, it was acknowledged that non-conformances do
play a part in deciding the frequency of audits at suppliers although they are not the
determining factor as highlighted in position 1: “I think that’s perhaps the supply
chains view of what is happening. So I think there is a misconception driven by the
supply chain in terms of does non-conformance drive supplier audits? Non-
conformances probably increases the frequency of the prime’s audits as we recognise
a high risk supplier so rather than going I’ll touch these guys every two years or every
three years with a full blown Sabre audit, the audits will take place every year”.
The linkage between these variables highlights the perception by the prime that
a greater number of audits will increase process compliance and therefore reduce the
level of disruption. The inclusion of the time delay variable was questioned as indicated
in position 2 because it was felt that disruption could occur at any time. However,
despite the number of audits any given supplier will have to undergo, frequent audits
do not seem to stop disruptions from happening. Again, the resulting observations made
by the participants resulted in the loop being subsequently amended.
Participants also reported that the amount of supplier development initiatives
had also dropped off in that period. The participants did, however, recognise how the
prime’s quality function operates in relation to loop B4 and how it interacts with the
rest of the business and the supply chain as per position 3: “There’s a third party coming
into that environment and our quality and engineering teams are moving right to the
top of the B4 cycle, in terms of conducting supplier audits, process compliance, process
audit. That’s where the team’s going. So we’re pushing ourselves right to the top of
that quadrant”.
6.1.4 The Dependency Loop.
The participants then discussed the dependency loop shown in Figure 6.4 during the
feedback session. Dependency is defined as an over-reliance on a single supplier
because of a lack of sourcing options. Conversely, the supplier may also have an over-
reliance on the prime due to a high percentage of its turnover emanating from the prime.

177 | P a g e
24 Figure 6.4 Dependency Loop.
36 Table 6.5 Dependency Loop Group Feedback.
Position 1 in Table 6.4 concerns the polarity of the link between the
‘dependency on supplier’ and ‘strategy deployment’ loops, which has been captured
with a minus symbol, i.e. indicating a reduction in the amount of strategy deployment
work that the prime needs to conduct if the prime is dependent on the supplier. The
thinking behind this interaction also took into consideration the resources available at
the prime. Findings from the original interviews conducted at the prime suggested that
increased dependency on one supplier meant that development and subsequent
deployment of strategies was reduced because the prime’s resources were locked into
providing the supplier with support to get out of a failure scenario. However, according
to some workshop participants: “If we see a dependency on a supplier, in most
commodities we’ve actually got a strategic position that’s trying to reduce that
dependency”.
The comment suggests that the link between the variables in reality could also
be shown as a plus sign because the linkage has the effect of increasing the number of
strategy deployment activities rather than reducing them. The comment also implies
that resources needed to conduct such activities are thought to be available. It may also
be the case that buyers at the prime are meant to increase strategy deployment activities
Dependency on
the Supplier
Strategy Deployment
Vaccillation
Failure Persistance
-
-
+
R1
Delivery Arrears
+
+
2
1

178 | P a g e
if dependency becomes too high to reduce supplier dependency risks. The evidence
obtained from this study, however, indicates that the deployment and success of this
policy is in reality somewhat different, particularly with persistently failing suppliers.
Position 2 concerns a naming convention issue raised about the use of the word
‘Vacillation’. Although there was agreement by participants that vacillation was a
contributory cause of failure, it became apparent that not all potential users of the model
will be able to understand the terminology. The resulting observations made by the
participants resulted in the loop being subsequently amended as part of the next iteration
of the model.
6.1.5 The Spend Relationship Loop.
The participants then discussed the spend relationship loop shown in Figure 6.5. The
Spend Relationship Loop highlights how spending with a single supplier (i.e. increasing
the number of parts allocated to a supplier) increases supplier influence and reduces the
prime’s leverage in a relationship.
25 Figure 6.5 Spend Relationship Loop.
37 Table 6.6 Spend Relationship Loop Group Feedback.
The only problematic issue concerning the spend relationship loop was the
chosen variable name as indicated in position 1. However, some participants identified
further issues with the loop resulting in more discussion: “The first observation in R6
is the linkage between supplier growth and supplier influence, we raised the question;
is it really supply growth that is linked to supply influence or is it something else? What
Supplier Influence
Leverage
Dependency on
Supplier
Supplier Growth
-
-
+
+
R6 1

179 | P a g e
we tend to find is that we have suppliers who have a lot of influence because of specific
capability they have, not necessarily because they are growing”.
If a supplier becomes dependent on the prime, it might be because a supply
contract with the prime represents a significant amount of turnover for the supplier’s
business. Type of parts will fall into one of two categories (1) technologically advanced
parts with few suppliers (possibly IPR owner and / or design to order) or (2) low
technology components equating to a large number of parts (mostly make to print parts).
Irrespective of who is dependent on whom, the prime will still run the risk of disruption
because of either a lack of alternatives or through having to conduct a large scale source
change to move the parts to another supplier. The participants discussed linkages with
the dependency on supplier variable at some length in order to identify if they agreed
with the interactions between variables: “Yeah, there was a long discussion on the
dependency on supplier, whether quality adherence always leads to dependency. If
everyone is a hundred percent quality adhering, then it won’t lead to dependency, it is
very context dependent. Only if you’re in an environment where most or at least
significant portions aren’t performing then one supplier’s quality adherence would
create dependency”.
Again, the captured observations made by the participants resulted in the loop
being subsequently amended.
6.1.6 The Strategy Mitigation Loop.
The main observation made regarding the strategy mitigation loop shown in Figure 6.6
was captured during discussion of the R1 loop. The strategy mitigation loop highlights
activities that the prime conducts in order to reduce supplier dependency and increase
the prime’s leverage in the supply chain. Discussion during the validation workshop
sought to identify if the participants agreed that more consistency in strategy
development and deployment activities would help to increase the prime’s overall
leverage in the supply chain.

180 | P a g e
26 Figure 6.6 Strategy Mitigation Loop.
38 Table 6.7 Strategy Mitigation Loop Group Feedback.
Position 1 concerns the issue of the polarity between the ‘dependency on
supplier’ variable and how it links with the ‘strategy deployment’ variable, which has
been shown as a plus (positive) relationship in the loop. Discussion occurred because
there was a feeling by some that the relationship could actually stimulate a greater drive
for strategy deployment rather than having the effect of reducing it. Another issue with
the naming of the ‘leverage’ variable in loop R6 was that it needed to be more explicit
to facilitate greater understanding, for example ‘buyers leverage’ was suggested.
Overall, the participants agreed that more consistent strategy development and
deployment would help to increase their overall leverage in the supply chain. Therefore,
the loop was subsequently amended.
6.1.7 The Supply Chain Flexibility Loop.
The purpose of this causal loop diagram is to demonstrate how resourcing activities can
enhance the prime’s supply chain flexibility. A question mark regarding the placement
and absence of time delays was the only aspect documented regarding the supply chain
flexibility loop Figure 6.7.
Leverage
Dependency on
Supplier
Strategy Deployment
Sourcing OptionsR8
-
-
+
+
1

181 | P a g e
27 Figure 6.7 Supply Chain Flexibility Loop.
39 Table 6.8 Supply Chain Flexibility Group Feedback.
The discussion regarding Position 1 concerned the participant’s belief that each
negative interaction between variables took time to develop into significant issues for
the prime, therefore a time delay mark should have been included. However, the actual
discussion and debate surrounding the loop went into much greater detail. The major
talking point was around the understanding of how ‘supplier dependency’ occurs in
reality and what the actual effects are on the prime. The participants went on to suggest
that it could manifest itself in a number of ways depending on the type of commodity
that the supplier traded with the prime: “Moving from delivery arrears into dependency
on supplier question mark. We have why? Because, depending on where we are
commodity wise, it could be a negative. It could actually reduce our dependency
because we’ve already got options to go and move from supplier A to supplier B and it
forces them into taking our options. However, we’ve been engaging in risk and revenue
sharing on really complex components. In this case the polarity is a positive because
we’ve got no options capability-wise or options commercially”.
Further comments made by the participants went on to suggest that there are
different levels of dependency: “It’s a realisation that you’re dependent on a supplier
and you can take various actions depending on that supplier. If it is risk and revenue,
their options are limited. If it is a C class supplier, you’ve got more options available”.
Dependency on
the Supplier
Strategy DeploymentFailure Persistance
-
R2
Delivery Arrears+
+
Supply Chain
Capability
Micro Management
Time to Plan
+
-
-
-
1
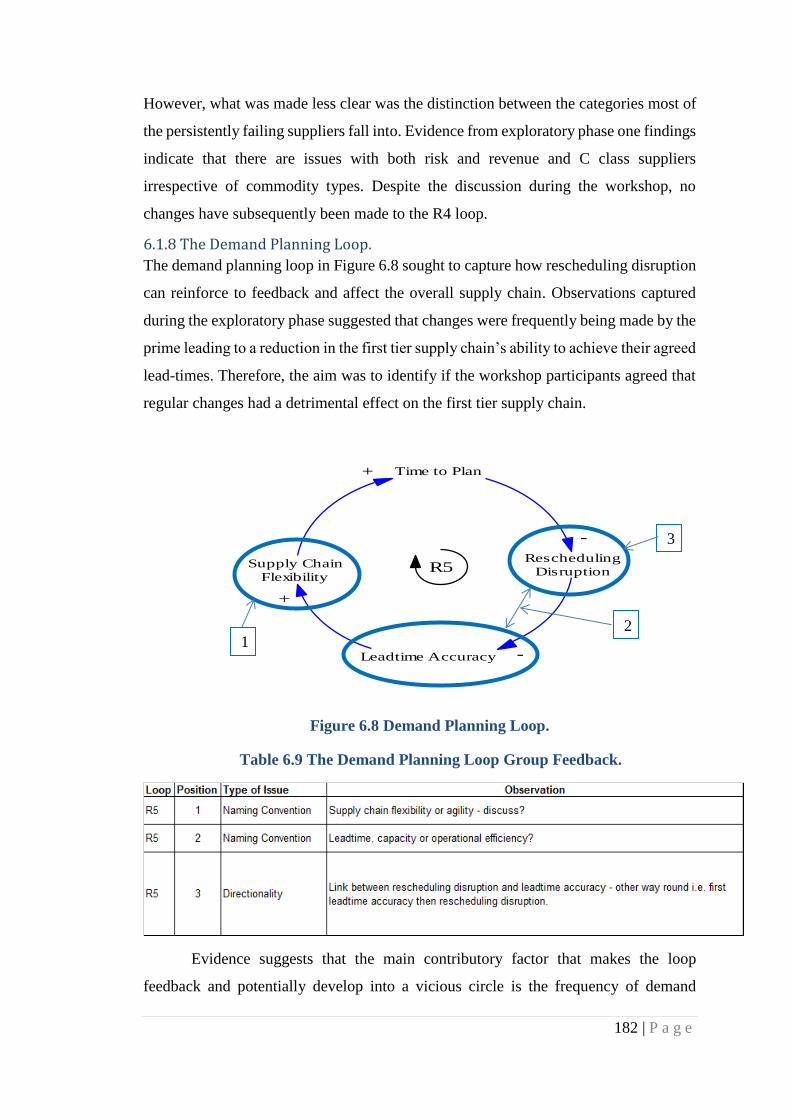
182 | P a g e
However, what was made less clear was the distinction between the categories most of
the persistently failing suppliers fall into. Evidence from exploratory phase one findings
indicate that there are issues with both risk and revenue and C class suppliers
irrespective of commodity types. Despite the discussion during the workshop, no
changes have subsequently been made to the R4 loop.
6.1.8 The Demand Planning Loop.
The demand planning loop in Figure 6.8 sought to capture how rescheduling disruption
can reinforce to feedback and affect the overall supply chain. Observations captured
during the exploratory phase suggested that changes were frequently being made by the
prime leading to a reduction in the first tier supply chain’s ability to achieve their agreed
lead-times. Therefore, the aim was to identify if the workshop participants agreed that
regular changes had a detrimental effect on the first tier supply chain.
28 Figure 6.8 Demand Planning Loop.
40 Table 6.9 The Demand Planning Loop Group Feedback.
Evidence suggests that the main contributory factor that makes the loop
feedback and potentially develop into a vicious circle is the frequency of demand
Time to Plan
Rescheduling
Disruption
Leadtime Accuracy
Supply Chain
Flexibility
-
-
+
+
R5
1
2
3
183 | P a g e
changes made by the prime. The issue noted in position 1 refers to the use of the term
‘flexibility’, which was challenged by the participants. They suggested that the correct
term should be ‘Agility’. Rescheduling disruption affects the prime in two ways, (1) by
consistently changing delivery dates, the prime can effectively make the supplier
become a persistent cause of delivery disruption, and (2) when the prime needs some
flexibility, it does not exist in their supply chain because they have systematically
weakened the supplier’s capability. The described sequence of events was recognized
by all the workshop participants. However as can be seen from the issues raised in Table
6.7, positions 2 and 3, there were some queries regarding the naming conventions,
placement of the variables and directionality of the loop: “It came bouncing back down
to lead-time accuracy, is it lead time accuracy or is it actually capacity? Customers
actually indicating it probably started with capacity, you know through iterations
affects lead time. It’s the naming convention. We might actually get back to capacity on
this, or is it actually operational efficiency that sits there, so not lead time accuracy or
capacity but actually operational efficiency? So rescheduling disruption makes your
operational efficiency lower”.
In addition, the participants suggested that perhaps the ‘rescheduling’ variable
was too general because planning problems could occur in parallel to rescheduling of
items for example by the prime forgetting to order parts in the first place and then
chasing them up with an unsuspecting supplier: “We’re talking about this loop of
rescheduling disruption. Question, should it be rescheduling or just scheduling?
Classic case this morning, we’ve had a cock up where we’ve assumed a supplier is
meant to be supplying a part. They don’t think they’re supplying the part. We’ve now
got a major disruption on one of our programmes because there is no schedule on them.
That’s not rescheduling, that’s just scheduling not happening.
These comments also highlight an interesting issue with regards to the R5 loop.
It assumes that all of the schedules are in place, therefore limiting the risk of disruption.
The feedback received suggests that there could be a number of internal oversights
including those which lead to orders not even being placed. For instance, it might
transpire that a specific component was not even ordered. Therefore, the loop was
subsequently amended to reflect the captured observations.

184 | P a g e
6.1.9 The Risk / Contingency Loop.
The next loop to be discussed was the risk / contingency loop shown in Figure 6.9
during the feedback session. The purpose of the loop is to acknowledge that sourcing
components from widely dispersed supply chains has the effect of increasing risk of
delivery failure either because of process or first tier supplier capability in certain
regions of the world. A further reasons could be because of issues that are out of the
control of the supply chain managers such as political factors or natural disasters in a
region. It was hoped that this loop would stimulate the workshop participants to reveal
their true opinions on the topics and to see if they agreed with what the loop
demonstrates.
29 Figure 6.9 Risk / Contingency Loop.
41 Table 6.10 Risk / Contingency Loop Group Feedback.
Aside from the issue discussed earlier concerning the naming convention for the
rescheduling disruption variable the only other aspect that stimulated further debate was
the naming convention adopted for the supplier resilience / robustness variable shown
by position 1. The debate centred on whether the terminology should be supply chain
resilience rather than supplier resilience? The justification for this thinking was that if
a supplier in isolation is resilient and robust, then that does not necessarily mean they
would have a positive impact on the rest of the supply chain and be able to prevent
persistent failure. The supply chain in its entirety would need to be resilient in order to
reduce the impact of failure in the loop.
Time to Plan
Rescheduling
Disruption
Supplier Resilience /
RobustnessOutsourcing
External Material
Supply
-
-
+
+
-
B5
1

185 | P a g e
Again, the captured observations made by the participants resulted in the loop
being subsequently amended.
6.1.10 Communication Loop.
The next set of observations discussed during the feedback session involved the
communication loop shown in Figure 6.10. The purpose of the communication loop is
to illustrate the causal relationship between performance and level of communication
between the prime and first tier suppliers. Opinions were sought from the workshop
participants as to whether they agreed that communication with first tier suppliers
played on important role in reducing the causes and the effects of persistent supply
chain failure.
30 Figure 6.10 The Communication Loop.
42 Table 6.11 Communication Loop Group Feedback.
The issue raised in position 1 of Table 6.10 highlights one of the variables that
generated much discussion and debate by the whole group. The participants had trouble
linking the variable with causing an increase in ‘supplier improvement initiatives’: “We
weren’t too sure whether the link between dialogue with supplier and supplier
improvement initiatives was particularly good because, depending on the relationship
you have with the supplier and where the power may be, you may not get any
improvement initiatives out of that dialogue. So that’s where we started to think of the
term optimized dialogue”.
Quality Adherence
Failure Persistance
Dialogue with
Supplier
Supplier Improvement
Initiative
-
+
+
+
B2
1

186 | P a g e
The observation supports the notion that the polarity is context specific. If
‘dialogue with the supplier’ is not good enough then there is a greater possibility that
supplier improvement initiatives could be implemented in such a way that it leads to
the chance of reduced quality adherence. There were no comments however, regarding
the link between failure persistence causing an increase in dialogue with supplier. The
debate centred on the quality and frequency of the communication and whether it leads
to greater cooperation with the supplier. The captured observations made by the
participants resulted in the loop being subsequently amended.
6.1.11 Relationship Loop.
The next loop to be discussed was the relationship loop shown in Figure 6.11. Findings
from the exploratory phase highlighted how there is often a lack of understanding
emanating from both the prime and first tier supplier concerning actual requirements
needed to satisfy demand. The aim of this discussion was to identify whether the
workshop participants agreed with the loop and could see the association between
problems with technical specifications, forthcoming demand fluctuations and changes
to the quality management system and relationship management.
31 Figure 6.11 Relationship Loop.
Dialogue with
Supplier
Understanding of
Requirements
Ambiguity
Commitment and
Trust
+
-
-
+
R4
1 2
3 4
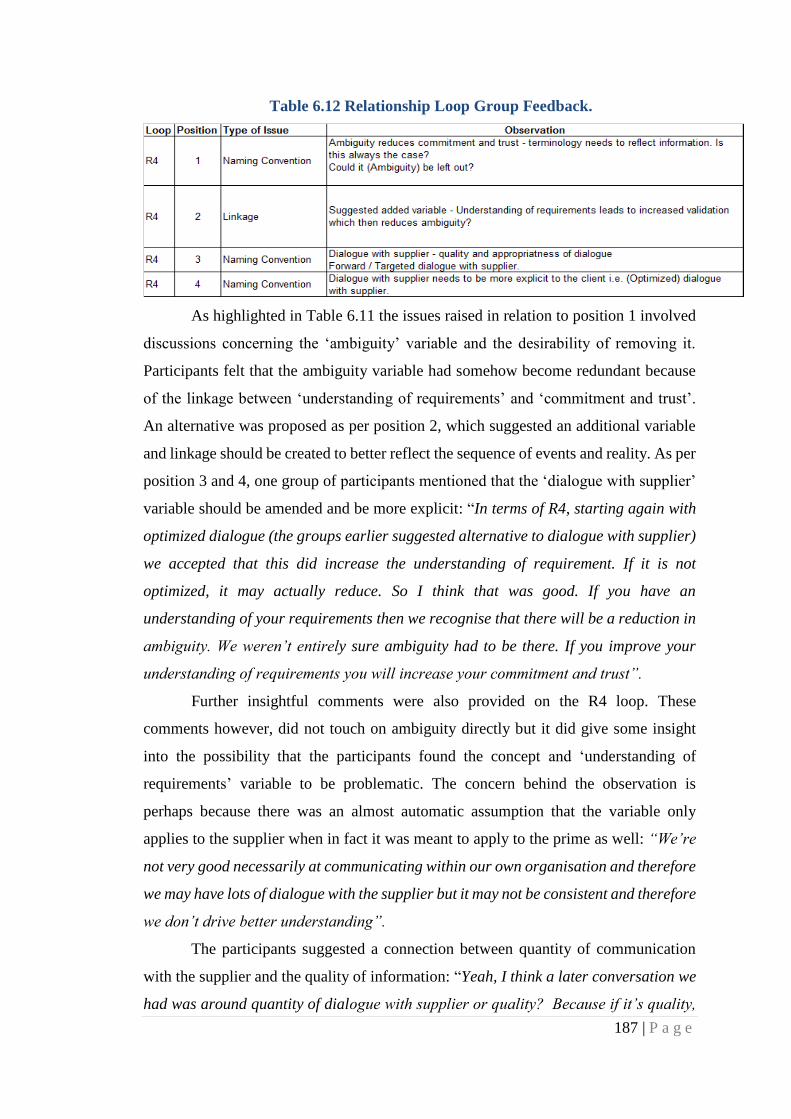
187 | P a g e
43 Table 6.12 Relationship Loop Group Feedback.
As highlighted in Table 6.11 the issues raised in relation to position 1 involved
discussions concerning the ‘ambiguity’ variable and the desirability of removing it.
Participants felt that the ambiguity variable had somehow become redundant because
of the linkage between ‘understanding of requirements’ and ‘commitment and trust’.
An alternative was proposed as per position 2, which suggested an additional variable
and linkage should be created to better reflect the sequence of events and reality. As per
position 3 and 4, one group of participants mentioned that the ‘dialogue with supplier’
variable should be amended and be more explicit: “In terms of R4, starting again with
optimized dialogue (the groups earlier suggested alternative to dialogue with supplier)
we accepted that this did increase the understanding of requirement. If it is not
optimized, it may actually reduce. So I think that was good. If you have an
understanding of your requirements then we recognise that there will be a reduction in
ambiguity. We weren’t entirely sure ambiguity had to be there. If you improve your
understanding of requirements you will increase your commitment and trust”.
Further insightful comments were also provided on the R4 loop. These
comments however, did not touch on ambiguity directly but it did give some insight
into the possibility that the participants found the concept and ‘understanding of
requirements’ variable to be problematic. The concern behind the observation is
perhaps because there was an almost automatic assumption that the variable only
applies to the supplier when in fact it was meant to apply to the prime as well: “We’re
not very good necessarily at communicating within our own organisation and therefore
we may have lots of dialogue with the supplier but it may not be consistent and therefore
we don’t drive better understanding”.
The participants suggested a connection between quantity of communication
with the supplier and the quality of information: “Yeah, I think a later conversation we
had was around quantity of dialogue with supplier or quality? Because if it’s quality,

188 | P a g e
that fits nicely, we’d agree with that”. As a result of the feedback, the R4 loop was
subsequently amended.
6.1.12 Information Delay Loop.
The final loop to be discussed during the feedback session was the information delay
loop shown in Figure 6.12. The aim of this discussion was to identify whether the
workshop participants agreed that a reduction in dialogue with the supplier throughout
the supply chain has the effect of causing a lack of understanding of requirements within
the supply chain. The overall effect is subsequent delays in delivery.
32 Figure 6.12 Information Delay Loop.
44 Table 6.13 Information Delay Loop Group Feedback.
The issues raised regarding position 1 highlights how the main talking point
regarding the information delay loop was the interpretation and actual effect of the
‘responsiveness’ variable: “So then in R7 from understanding of requirements it
increases responsiveness. We had a little bit of a delay around this. Understanding of
requirements, I can make it very clear to you what I need, but it doesn’t mean you can
deliver it. What it does mean is you can give me a message immediately that say’s no I
can’t do that but this is what I can do. So we changed that to say supplier responsiveness
in the sense of their ability to respond to your request”.
The ‘responsiveness’ variable was meant to be applicable for both the first tier
supplier and the prime based on findings from the exploratory phase. The
Dialogue with
Supplier
Understanding of
Requirements
Commitment and
Trust
+
+
R7
ResponsivenessDelays+
-
-
1

189 | P a g e
responsiveness variable indicates that suppliers will not proceed with producing a part
until they understand exactly how to produce to the correct requirements, hence
‘understanding of requirements’ increases responsiveness. A requirement is something
that conforms to the prime’s production parts approval process (PPAP) process, which
was mentioned during the workshop. However, some of the suppliers seem to suggest
that when they requested such information from the prime, often there would be a
significant delay before they received a response. The resulting effect would be a
delayed part. Other potential effects could lead to commitment and trust issues as a
consequence of persistent failure in terms of delivery. The concept proved problematic
with all of the participants who took part in the workshop. They noted that it depended
on the type of parts: “That is what I was trying to sanitize, where it was coming from
in the model? I might expect it to come out in the bottom half of the model, in terms of
the relationship and the risks like planning aspects. I’d expect probably a real negative
vibe from our supply chain. Top left, I’d expect it to be positive. Top right, which is
about the strategy, it depends where the supplier sits in our strategies”.
Again, the captured observations made by the participants resulted in the loop
being subsequently amended.
6.1.13 Failure Persistence Loop.
The main purpose of the failure persistence loop shown in Figure 6.13 was to
demonstrate how all of the loops, when combined, result in the effect of increasing
failure persistence, along with the counter-balancing activities that the prime conducts
in order to reduce the effects and the persistence of failure. Again, participants were
invited to provide feedback because the loop encompasses all four dominant themes
that represent key aspects of the model that interact to cause persistent supply chain
failure.

190 | P a g e
33 Figure 6.13 The Failure Persistence Loop.
45 Table 6.14 Failure Persistence Loop Group Feedback.
The combined loops show the feedback effect of failure persistence, resulting
in a vicious cycle, which becomes very difficult to stop. The main problematic issues
that were pointed out earlier were revisited here for further validation, as indicated in
positions 1 and 4 in Table 6.14. Position 5 highlights a naming convention that was
suggested by the group because it was thought that the description ‘supplier
attractiveness’ was more appropriate than ‘dependency on supplier’. The suggested
change in variable name was because there was a general consensus between the groups
that if a supplier adheres to the quality management system they would therefore
become more attractive because of good performance. The likely effect of this is that
the prime becomes more inclined to load the supplier with more business, which
ultimately has the effect of increased dependency on the supplier. Position 3 highlights
observations made by the participants concerning the polarity between the ‘time to plan’
Quality Adherence
Dialogue with
Supplier
Supplier Improvement
Initiative
+
+
B3
Dependency on
the Supplier
Strategy Deployment
-
Supply Chain
Capability
Micro Management
Time to Plan
+
-
-
+
+
1
2
3
4 5

191 | P a g e
variable and ‘dialogue with the supplier’: “If you have time to plan, does that increase
your dialogue with supplier? Would it not reduce the dialogue with the supplier?”
It was then communicated to the participants that the linkage was trying to
convey the effect of compressed timescales on the prime’s ability to supply on time to
the agreed schedule date. The resulting conversation led to the following
acknowledgement: “If we put time to plan in the context of a material requirements
planner (MRPC) role, when we said time to plan, we mean go and have dialogue with
your supplier about your order book. That’s what we are actually saying. Order book
reviews are a formal sit down with a supplier”.
The linkage between the ‘time to plan’ and ‘dialogue with the supplier’ variables
is aimed at demonstrating how by having more time to effectively plan the workload
there should be an increase in the amount of dialogue between the prime and first tier
employees. Participants also mentioned that more and better communication can
prevent failure from happening: “From a communication point of view, rather than
delivering, because if you double your demand overnight, it’s not going to happen, but
they [First Tier Supplier] will tell you what they can do and when they can do it
immediately. That will then reduce any delay in communication and reduce the delays
in delivery”.
6.2 Section Summary. The overall reaction to the model and the strong level of engagement and participation
combined with the level of interest and enthusiasm shown throughout the day were very
encouraging. Given the thorough critiquing of the model, the captured narrative
indicated strongly that the participants were able to relate the model to their working
experiences as purchasing and supply chain executives and to ‘the way things happen’
in terms of the prime’s engagement with their first tier supply base. This was viewed as
a significant achievement by the research team. A participant provided a summary of
the applicability of the model in relation to their current operations: “We see a lot of
what we do today [at the prime] in the model and therefore in a lot of the loops I think
we agreed with the kind of content that was in there”. That comment was echoed by
the rest of the participants. Therefore, the general construction and the identified
dominant themes / quadrants that the model fits within were viewed as largely accurate.
The overall outcome from the validation workshop suggests that the model is relevant,
topical and did not require radical change (see further observations below): “You’re

192 | P a g e
clearly recognizing what we’re doing relates to a theoretical model that says, actually,
theory and practice have come together now and it’s actually joined together and
there’s a sense, if you look at the quality adherence quadrant, it’s very much what
we’re doing today, very much how we actually do business today and how we react
today. I think we’re actually seeing that maturity and quality is something that we’ve
been talking about for years in terms of failure and it’s very low on the radar now,
quality within our business, because it’s a given and we’ve got a robust, mature model
that looks like that model, I think. Not a lot of debate around that. If you look at the
feedback, it was just about the timings and actually do you put that, the improvement
activity, in between supplier audits and process compliance? The model itself is
actually now driving into identifying where that comes in our supply chain. So that
feels like it is representative, that’s what we’re used to seeing”.
From an evaluation of all the comments, feedback, discussions and critique
received from the workshop participants, it was clear that the next iteration of the model
should concentrate on developing the following areas:
Clarifying and strengthening the naming conventions to make them more
immediately understandable.
Re-evaluating some of the linkages / relationships between variables based on
new observations and critique provided during the workshop.
Re-thinking polarity designation within each loop based on comments from the
workshop.
Placement of time delays within each loop based on comments from the
workshop.
Ensure that the cause and effect of persistent failure is more explicit for the
target audience within the model.
Introduce a colour coding scheme into the model to make it easier to follow.

193 | P a g e
6.3 Post Workshop Persistent Failure Model. The output of all captured observations and insights from the validation workshop have
been brought together to create a revised causal loop model. The updated causal loop
diagram model is now entitled the ‘Persistent Failure Model’ and is shown in Figure
6.14 below. The name has been changed from ‘Failure Persistence Model’ in order to
be more understandable to the end user.
34 Figure 6.14 Persistent Failure Model
Dependency
Relationship
Management
Risk /
Contingency
Supplier
Performance
Persistent Failure
Supplier Performance
Recovery Activities
Dependency
-
Indecision
Strategy Deployment
+
-
+
Communication Fragmentation Time to Plan
-
Scheduling DisruptionSupply Chain Flexibility
Non Conformances
Process Compliance Disruption
Delays
Buyers Leverage
Sourcing Options
+-
+
+
Supply Chain Capability
+
Short Term Quick Fixes
Root Cause Understanding
+
Supplier Attractiveness
-
+
-
+
Operational Efficiency
Micro Management
-
+
Firefighting
+
+
-
Focus on Supplier
++
Alternative Suppliers
-Supplier Improvement Activities
+
+
-
-
+
+
-
Silo Thinking
+
+
Relationship Continuity
-
Understanding of Requirements
+
-
+
Supplier Overload
+
-
+
-
Blockage
-
-+
+
R1 R2
R3R4 B3
R5
R6
R7
B2
B1
B4
B5
B6

194 | P a g e
6.4 Post Workshop Persistent Failure Model. Throughout the next section we take a critical realism approach (Easton, 2010) to
describing the key aspects of the persistent failure model and how it evolved from the
original failure persistence model, created as a consequence of findings from the
exploratory phase. As with the previous version of the model, Table 6.15 shows how
the persistent failure model is divided into four dominant themes / quadrants.
46 Table 6.15 Post Workshop Persistent Failure Model.
The loops have been identified to show (1) activities that the prime carries out
in order to counteract the effect of failure that is being caused by reinforcing loops
within each dominant theme / quadrant (i.e. B1, B2, B3, B4, B5 and B6), and (2) the
issues that perpetuate the reinforcing loops by variables interacting to cause failure to
persist (i.e. loops R5, R6 and R7). Key variables from loops within each of the dominant
themes have been highlighted / coloured (Supplier Performance, Dependency, On Time
Delivery, and Communication Fragmentation). The final version of the model has, in
comparison to the first iteration, seven reinforcing loops as opposed to six balancing or
goal seeking loops. The second iteration of the model also demonstrates how there are
more interactions that reinforce to result in persistent failure. Despite a comprehensive
set of processes, procedures and improvement tools available to supply chain personnel
at the prime, persistent failure continues to happen. A greater number of time delays
were added to the updated Persistent Failure Model based on validation of the original
Table 6.15 Post Workshop Persistent Failure Model
Supplier Performance Dependency
Loop No. Name.
Loop No. Name.
R1 The Supplier Performance Loop R2 Dependency Loop
B4 Sub Tier Capability Loop B1 Sourcing Strategy Loop
B5 Disruption Loop R5 Spend Relationship Loop
B6 Strategy Mitigation Loop
Relationship Management Risk / Contingency
Loop No. Name.
Loop No. Name.
R3 Communication Loop B2 Supply Chain Capability Loop
R4 Silo Mentality Loop R6 On Time Delivery Loop
R7 The Relationship Management Loop
Persistent Failure Loop
B3 Consolidation of loops R1,R2,R3,R4,B1 and B2
195 | P a g e
findings from exploratory phase one and further insights captured during the workshop.
The time delays added to reinforcing loops show how these loops feedback over time
eventually developing into vicious cycle loops if not identified and mitigated
expediently by the prime. The time delays that feature within the negative feedback
structures represent myopic behaviour by the prime which can result in oscillation of
the loop because goal seeking activities being conducted by the prime are delayed or
not actioned quickly enough. Therefore persistent failures continue to affect the prime.
6.4.1 Changes to the Quality Adherence Loops.
The first significant change to the persistent failure model is the amendment to the
quality adherence loop (B1), which was developed and renamed as the ‘Supplier
Performance Loop’ (R1). Using the term ‘quality adherence’ implies conformance is
about meeting the specification of a component only. However, adherence should mean
all aspects of delivering a component to the correct specification at the right time. This
is followed by a naming convention change i.e. the quality adherence variable changed
to ‘Supplier Performance’. It was noted during the workshop that overall supplier
performance is of greater concern to the prime than quality adherence, which is
considered mandatory. Using the terminology ‘supplier performance’ had greater
resonance with the participants from the workshop. This is because it can result in the
supplier becoming a more attractive proposition for the prime in terms of awarding
further business: A participant from the group session provided an explanation: “If we
have a good performing supplier, what do we do, we put more work in, and then they
rapidly become a poor performing supplier probably down to resource capability, a
whole range of stuff. So we take a good performing supplier over time to become a poor
performing one”.
Corresponding to the name change of the complete model, the failure
persistence variable was also changed to ‘Persistent Failure’ to be more understandable
to the end user. Further to this, a time delay mark has been added between the ‘Persistent
Failure’ and ‘Focus on Supplier’ variables to highlight how the variables interact
dynamically over a period of time, gradually increasing the focus placed on the failing
supplier by the prime as the knock-on effects of failure worsen. The next update of the
adherence loop shows how the ‘Supplier Improvement Initiatives’ variable has been
changed to ‘Recovery Activities’. The change was made because greater focus on the
supplier typically occurs due to a build-up of failures. Therefore, the prime instigates
196 | P a g e
activities that seek to help the supplier to recover from a failure situation rather than
improve performance. Supplier improvement initiatives are used by the prime to
balance out the effects of failure in the long term whereas the adherence loop portrays
reactionary activities carried out by the prime when persistent failures are already
reinforcing to reduce supplier performance. The final change to the adherence loop was
the inclusion of a new ‘Supplier Overload’ variable. This was added due to comments
from participants during the workshop (and also the first tier participants during the
exploratory phase) about how the prime often misinterpreted the need for improvement
at a failing first tier supplier and subsequently committed unnecessary amounts of
resource in order to quickly mitigate problems. This is also symptomatic of comments
made by the participants during the workshop about how the prime was good at turning
a good performing supplier into a poor one and then mismanaging the recovery effort.
Overall, the loop has changed from initially being one with interactions that conspired
to reduce the effects of persistent failure to one that actually reinforces failure as a
consequence of overloading the supplier.
The next set of improvements to the model was to rearrange the sub-tier
capability loop (B4) around with the Disruption Loop (R3). In the final persistent failure
model they are now displayed as a Sub-Tier Capability Loop (B4), which has changed
from a reinforcing loop to a balancing one and a Disruption Loop (B5), which remains
a balancing loop. The changes were made because it was deemed necessary to link the
‘Disruption’ and ‘Process Compliance’ variables together. This resulted in the
disruption loop effectively changing places with the sub-tier capability loop in the
model including a number of the variable interactions. As a consequence, the sub-tier
capability loop now demonstrates how the ‘non-conformances’ variable interacts to
increase short term quick fixes. The change was made to show how a greater number
of failures places pressure on the prime to identify quick solutions in order to prevent
blockages in production. This resulted in the ‘Blockage’ variable being added to the
loop in order to show how short term quick fixes reduce blockages. The resulting effect
reduces ‘Root Cause Understanding’, which is a naming convention change made to
the original terminology of root cause analysis. The name was changed because
understanding root causes of failure helps the prime to identify causes of failure and
therefore increase supplier performance. The original ‘Root Cause Analysis’ definition

197 | P a g e
implied that investigations take place but does not necessarily suggest that causes of
failure will be established.
Further improvements to the disruption loop are the introduction of a new
‘Supplier Improvement Activities’ variable. This variable was included because it
shows an interaction that seeks to increase process compliance over time. Process
compliance then has the effect of reducing the disruption to the prime. The disruption
variable has the effect of increasing blockages, which then reduces root cause
understanding because the prime will concentrate efforts on quick mitigation because
of the blockage.
Overall, the Adherence themed loops attempted to convey how short term quick
fixes feedback to reduce supplier performance, whereas identifying the root cause of
failure over time has the effect of increasing supplier performance. An increase in
supplier performance then has the cyclical effect of reducing persistent failure after
each feedback of the loops. The general feedback from the participants of the workshop
was that they viewed supply chain adherence to the prime’s quality management system
as a given and first tier suppliers would not have received approval to supply product if
they could not prove adherence to the quality system. The main area of focus for the
prime was the performance of the supply chain and in particular the performance of
first tier suppliers. Therefore, in addition to changing the name of the quality adherence
loop to supplier performance, adherence was replaced by ‘Supplier Performance’ as a
dominant theme.
6.4.2 Changes to the Dependency Loops.
The first significant amendment made to the dependency series of themed loops
describes how the supplier dependency loop (Originally R1) was changed to the
‘Dependency Loop’ (R2). In addition, the dependency on supplier variable was changed
to ‘Dependency’ because this can apply for both the prime and / or first tier supplier,
i.e. the prime can become reliant on the first tier supplier for components whereas the
first tier can be dependent because of the high proportion of its turnover with the prime.
Therefore, if there are limited supply options, the prime will attempt to identify
alternative suppliers in order to reduce the effects of dependency. It was also discussed
during the workshop and during the exploratory phase that the prime’s supply chain
management function is continually seeking to reduce the risk of dependency by trying
to identify and develop new supply chain capability as shown in loop B1 (Sourcing

198 | P a g e
Strategies). These efforts are a continuous supply chain management activity and seek
to increase buyers’ leverage within the supply chain with the goal of reducing
dependency. Participants noted how there are multiple sourcing strategies being
conducted at any time and each can be described as being at different levels of maturity.
However, the prime is not quick to use gathered intelligence from within the supply
chain and often awards more business to suppliers who are providing immediate
benefit. In addition the ‘Vacillation’ variable was changed to ‘Indecision’ because,
although there was agreement regarding the inclusion of the variable and its effect on
the loop, it became apparent that not all potential users of the model immediately
understood the terminology. The next change in the dependency loop was to replace
the delivery arrears variable with ‘Supplier Attractiveness’ because there was a general
consensus amongst the workshop participants that an increase in supplier performance
is more likely to result in the prime rewarding the supplier with more business. The
effect of this will eventually result in an increased dependency on the supplier. The
‘Sourcing Strategy Loop’ (B1) was added to the persistent failure model in order to
acknowledge that the prime seeks to reduce dependency in the supply chain by
managing sourcing strategies more effectively. No connection was made between
delivery arrears and dependency during the workshop. Therefore, the delivery arrears
variable was removed from the loop.
Changes to the spend relationship loop (R5, Originally R6) involved the
removal of the ‘supplier growth’ variable because it was suggested that supplier growth
was stimulated through attractiveness based on performance rather than the supplier’s
dominance in the market. The participants did not generally believe that growing a
supplier by increasing the amount of business led specifically to greater supplier
influence. The perception was that this is more related to a supplier’s general
performance. In addition, the next change involved removing the ‘supplier influence’
variable and replacing it with ‘Alternative Supplier’. Again, this was changed because
the participants did not agree that supplier growth has the effect of increasing supplier
influence. The participants felt that influence was created because of the specific
capability that suppliers have and not necessarily because they are growing. Therefore,
the inclusion of the ‘alternative supplier variable’ acknowledges how reducing
dependency involves increasing competition in the market.

199 | P a g e
Finally, a slight adjustment was made to the loop by changing the leverage
variable to ‘Buyer’s Leverage’. This was done to be more explicit about which party
needs to increase leverage in the supply chain and to facilitate greater understanding of
the model and the interactions between the variables. A consequence of the
amendments means that the strategy mitigation loop has changed from being a
reinforcing to a balancing loop as is evident by the summation of polarities.
6.4.3 Changes to the Risk / Contingency Management Loops.
The first significant amendment made to the risk management series of themed loops
involves changes to the supply chain flexibility loop R2. This has been changed to the
supply chain capability loop B2. The loop was amended to show that ‘Micro
Management’ caused an increase in ‘On Time Delivery’ a change from the time to plan
variable, changing the loop from reinforcing to balancing. The alteration was made
because future planning of material demand can become restricted as the first tier
supplier is forced to focus on delivering items that are already late. Therefore, reduced
time to plan is an effect rather than a cause of failure, whereas ‘on time delivery’ can
either cause a reduction in failure when it increases.
The demand planning loop (R5) has been changed to the ‘On Time Delivery
Loop’ (R6) in order to highlight the effect of rescheduling by the prime and how it
affects delivery performance in the supply chain. In addition, rescheduling disruption
has been changed to ‘Scheduling Disruption’ based on comments made during the
workshop concerning how disruptions can occur irrespective of late delivery or
capacity. Mistakes as simple as the prime not placing orders for the component in the
first place can occur. Fluctuations in demand can always happen but if the orders are
not placed in the first instance then the prime is not going to receive the component on
time. The on time delivery loop demonstrates the fine line between achieving supply
flexibility and maintaining supply chain control in an uncertain environment. A
workshop participant explains the risk to suppliers: “You have to look at the supply
chain or the network. There’s a lot of unwanted rescheduling disruption and it’s not
necessarily anyone’s fault. It just happens”.
The next amendment made to the on time delivery loop is the change of the
‘Lead-time Accuracy’ variable to ‘Operational Efficiency’. The change was made
because of debate evident within the groups indicating that lead time accuracy is the
effect of issues with capacity, which can reduce ‘operational efficiency’. Therefore, as

200 | P a g e
a consequence, the ability to deliver components to the specified lead time is affected
due to scheduling disruption. The final change within the risk management themed
loops was the removal of the Risk / Contingency Loop (B5 in the original model). The
feedback from the workshop indicated that it was not capturing a true effect or causal
relationship and was therefore not adding value to the model.
6.4.4 Changes to the Relationship Management Loops.
The first significant amendment made to the relationship management series of themed
loops involves the Communication loop. The loop was originally balancing (B2) but
has now been changed to reinforcing (R3) because it was found that the effects of poor
communication drives persistent supply chain failure if not managed correctly. This
stems from the dialogue with supplier variable being changed to ‘Communication
Fragmentation’ because it was noted by the participants that the prime has difficulty
communicating effectively and consistently with first tier suppliers and internally. It
was reported that communication significantly increases when the urgency of getting
parts delivered on time increases. However, communication does not occur on a
consistent basis. In addition, the need to get parts delivered on time increases the risk
that designated communication protocols get ignored because multiple employees from
various levels of the prime’s organisation feel pressurised into contacting first tier
suppliers for status updates. The effect can cause the fragmentation of established
communication protocols.
Communication fragmentation then forms a linkage with a newly included ‘Silo
Thinking’ variable. The variable was added following critique and insights from the
workshop to show how functions / departments in the prime that are immediately
affected by a failure seek to act individually rather than act as one ‘joined up’ company.
Therefore an increase in communication fragmentation has the unwanted effect of
increasing silo thinking. In addition, silo thinking within the prime causes problems
with first tier suppliers because they do not know what, which and when to prioritize
workload. A participant from the workshop explains the disparity between divisions
and functions of the prime’s business: “Often, there isn't a linkage internally within the
prime that we are talking to each other, so particularly in the buying world we're doing
the day to day stuff with commercials; the strategic team are also doing their own
thing”.

201 | P a g e
As a result of these observations the ‘Silo Thinking Loop’ (R4) was added as a
new reinforcing loop to show how silo thinking within an organisation can interact to
cause communication fragmentation. The effect can reinforce into a vicious cycle until
communication is completely fragmented, significantly contributing towards causing
persistent supply chain failure. Further to this the 'Firefighting’ variable was included
to show how management behaviour intensifies towards first tier suppliers when
persistent failure occurs. The effect of delivery arrears, can result in the supply chain
being in a constant state of ‘catch up’ in order to fulfil engine build line schedules,
which has ramifications for the entire supply chain. Hence, firefighting activities
intensify.
Due to further captured observations during the workshop, changes have been
made to the relationship management loop (R7 originally R4). The understanding of
requirements variable was rearranged to show how ‘Relationship Continuity’ has the
effect of increasing understanding of requirements. The changes were made because
relationship continuity was perceived as a way to consistently manage issues with
chosen suppliers rather than dissolve or terminate relationships. Maintaining
relationship continuity should improve or resolve problems through increasing first tier
suppliers’ understanding of requirements. This is meant to show how the prime
mitigates the negative effects of communication fragmentation. The ‘Ambiguity’ and
‘Commitment and Trust’ variables were removed from the loop because they were
deemed redundant by the workshop participants due to a perception that the interaction
between these variables does not actually result in reduced dialogue with a supplier so
the proposed linkage was considered subjective. The ‘Delay’ variable was subsequently
added to the relationship management loop to show how understanding of requirements
has the effect of reducing delays. Therefore, the Information Delay Loop (R7 in the
original loop) was removed from the model and consolidated into the Relationship
Management Loop.
It is important to note that each of the loops in the final model are designed to
show what does happen in the context of persistent failure, not what should happen.
The final updated model provides key decision makers at large industrial prime
organizations that manufacture highly complex products with the understanding and
visibility of the supply chain management activities where negative interactions
between variables can and do reinforce to cause persistent supply chain failure. It
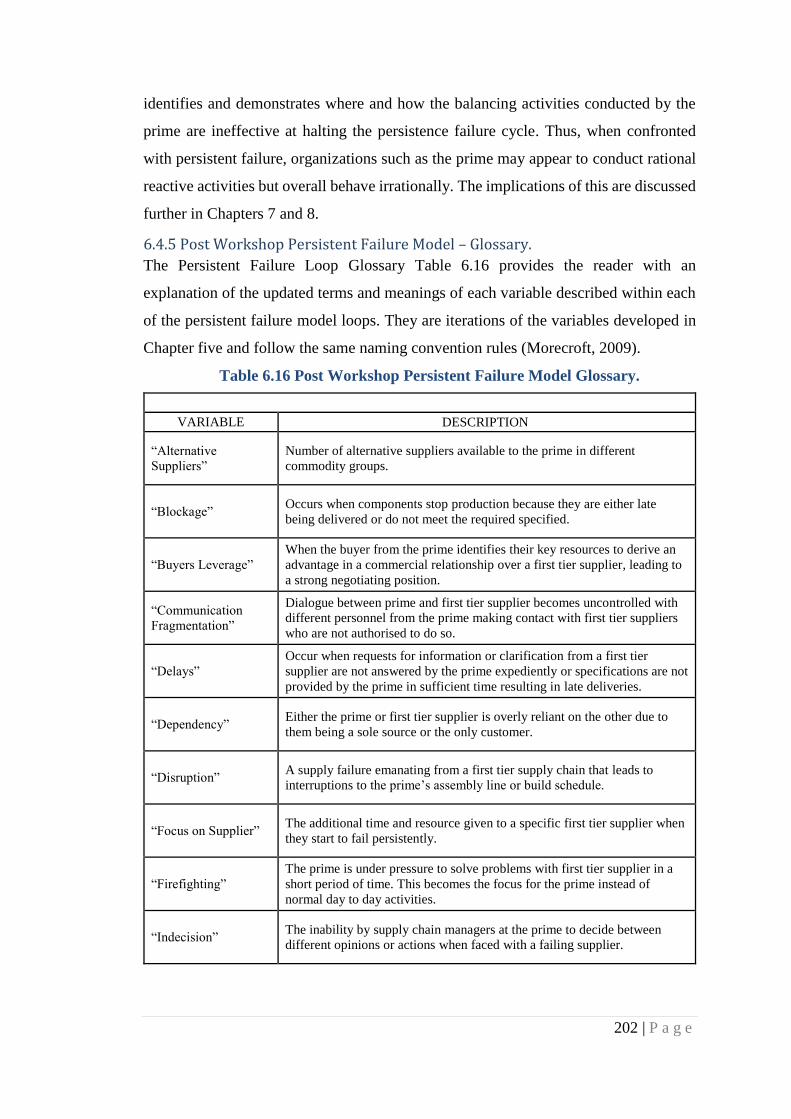
202 | P a g e
identifies and demonstrates where and how the balancing activities conducted by the
prime are ineffective at halting the persistence failure cycle. Thus, when confronted
with persistent failure, organizations such as the prime may appear to conduct rational
reactive activities but overall behave irrationally. The implications of this are discussed
further in Chapters 7 and 8.
6.4.5 Post Workshop Persistent Failure Model – Glossary.
The Persistent Failure Loop Glossary Table 6.16 provides the reader with an
explanation of the updated terms and meanings of each variable described within each
of the persistent failure model loops. They are iterations of the variables developed in
Chapter five and follow the same naming convention rules (Morecroft, 2009).
47 Table 6.16 Post Workshop Persistent Failure Model Glossary.
VARIABLE DESCRIPTION
“Alternative
Suppliers”
Number of alternative suppliers available to the prime in different
commodity groups.
“Blockage” Occurs when components stop production because they are either late
being delivered or do not meet the required specified.
“Buyers Leverage”
When the buyer from the prime identifies their key resources to derive an
advantage in a commercial relationship over a first tier supplier, leading to
a strong negotiating position.
“Communication
Fragmentation”
Dialogue between prime and first tier supplier becomes uncontrolled with
different personnel from the prime making contact with first tier suppliers
who are not authorised to do so.
“Delays”
Occur when requests for information or clarification from a first tier
supplier are not answered by the prime expediently or specifications are not
provided by the prime in sufficient time resulting in late deliveries.
“Dependency” Either the prime or first tier supplier is overly reliant on the other due to
them being a sole source or the only customer.
“Disruption” A supply failure emanating from a first tier supply chain that leads to
interruptions to the prime’s assembly line or build schedule.
“Focus on Supplier” The additional time and resource given to a specific first tier supplier when
they start to fail persistently.
“Firefighting”
The prime is under pressure to solve problems with first tier supplier in a
short period of time. This becomes the focus for the prime instead of
normal day to day activities.
“Indecision” The inability by supply chain managers at the prime to decide between
different opinions or actions when faced with a failing supplier.

203 | P a g e
“Micro Management” A management style adopted by the prime where it closely monitors,
observes or controls the work of the first tier supplier or sub-tier.
“Non-Conformance” Components supplied by the first tier supplier that do not meet the required
specification as contractually agreed.
“On Time Delivery” Consistent delivery by a first tier supplier ‘on time’ according to
contractually agreed timeframes.
“Operational
Efficiency”
Occurs when first tier suppliers are able to deliver components precisely to
the scheduled delivery date irrespective of changes in demand signal
received from the prime and / or rush order requests.
“Persistent Failure” Supply chain failure that continues to happen despite multiple efforts by
the prime and a first tier supplier to resolve it.
“Process
Compliance” Consistent conformance to the prime’s quality management system.
“Recovery Activities” Activities or initiatives conducted by the prime to help a first tier supplier
recover from failure.
“Relationship
Continuity”
The interaction between the prime and the first tier supplier. This includes
the continuity of the relationship between the prime and the supplier in line
with the protocol of a single point of contact philosophy.
“Root Cause
Understanding”
Occurs when the main cause of non-conformance is identified and solved
so that repeat failures are prevented.
“Scheduling
Disruption”
The prime consistently makes changes to the first tier supplier’s component
delivery schedules, irrespective of quoted lead times and capacity
constraints.
“Short Term Quick
Fixes”
Non - conformances that are resolved without investigating the cause of
failure in order to fix problems quickly.
“Silo Thinking”
Occurs when departments within the prime do not share information or
knowledge and act as if they are in competition with other departments
within the organisation.
“Sourcing Options” The existence of a number of viable alternative suppliers that the prime can
contract with in the market for a particular component.
“Sourcing Strategy” Activity conducted by the prime to identify new or alternative suppliers
and then deciding what, where and when to source components.
“Supplier
Performance”
How well a first tier supplier performs to the level of quality and / or
delivery performance originally specified and expected in an agreed
contract.
“Supplier
Improvement
Activities”
The activities conducted by the prime to improve performance of a first tier
supplier.
“Supplier Overload” Occurs when there are too many supplier improvement activities going on
at first tier supplier, affecting resources and taking up capacity.
“Supplier
Attractiveness”
A first tier supplier is perceived as being more capable of performing a task
or function than other suppliers to the prime. The prime will therefore tend
to give that supplier more business often in a short space of time.
“Supply Chain
Capability”
A first tier supply chain that contains a first tier supplier with strong
production and sub-tier planning capability.
“Supply Chain
Flexibility”
A first tier supplier capable of delivering conforming components on time
despite internal or external disruption to ensure continuity of supply.

204 | P a g e
“Understanding of
Requirements”
A first tier supplier’s ability to understand a component specification given
to them by the prime and then convert the requirement into a manufactured
component.
6.5 Chapter Summary. This Chapter has presented the observations, insights and critique captured during the
workshop that examined the failure persistence model. As a consequence of the
feedback, comments and critique, a refined ‘Persistent Failure Model’ has been
presented. The purpose of the updated model is to identify and clarify the interactions
between variables that can combine to cause persistent supply chain failure. The model
also shows how responses and improvement activities intended to reduce the effect of
persistent failures can result in the converse effect, essentially acting to reinforce the
cycle.
The most apparent mitigation activities that are carried out by the prime is to
identify root cause of failure, increase individual sub-tier capability, increase the
capability of the entire supply chain and develop strategy mitigation activities such as
increasing the number of sourcing strategies. All activities involve the prime and first
tier suppliers committing to very labour intensive work streams. The evidence, analysis
and models presented during this and previous Chapters will be discussed further in the
subsequent discussion Chapter (Chapter 7). This encapsulates how inter-relationships
between loops (and not just variables) also drive persistent failure.

205 | P a g e
Chapter 7 – Discussion. The concept of persistent supply chain failure and a causal loop model describing the
phenomenon have not been considered or presented in the literature to date. Each
variable and loop in the persistent supply chain failure model developed in this study
are based on new empirical evidence. In this Chapter a thorough discussion of the model
is given in the context of the existing literature and current state of knowledge. The
discussion examines whether the causal loops within each dominant theme add to the
literature, supports it, or refutes existing thinking. Where the literature is currently silent
on issues that were captured in the study is highlighted. The Chapter therefore shows
where and how the model adds to existing knowledge.
The work has important implications for practice. The Chapter discusses
managerial and business implications of the persistent failure model. It examines the
relationship between each of the main themes and describes the principal implications
of each loop and how the complete model can be used to help managers understand and
mitigate against failure. The implications section provides a review of the model in
relation to current knowledge and practice. The Chapter concludes with a discussion of
how each of the study’s research questions have been addressed as a result of this
research.
7.1. Supplier Performance. The supplier performance loop (R1) as shown in figure 6.14 in Chapter 6 was developed
in order to demonstrate the challenges faced by a first tier supplier seeking to achieve
consistent performance. Ebrahimi and Sadeghi (2013) highlighted how quality
management is a major driver of performance in supply chain management. Following
on from these observations, Barouch and Ponsignon, (2016) identified how quality
management systems are often implemented in an inconsistent way due to a lack of
understanding of quality management methods. The findings from this literature is
supported by observations captured during the exploratory phase. Participants often
described how a lack of consistency in quality management requirements could
negatively influence their performance measurement scores. As a result, if a first tier
supplier’s performance consistently falls below agreed performance levels, the prime
increases its focus on that supplier because they are a source of persistent failure. The
loop shows how additional focus will lead to recovery initiatives being deployed by the
prime. If the failures are not being mitigated quickly enough and continue to happen
206 | P a g e
then the recovery initiatives will become more intensive, potentially resulting in
overloading the affected supplier. This is the result of the prime placing too much focus
and attention on that first tier supplier. The loop shows how such an increase in recovery
activities enacted by the prime can cause failure to persist if utilised incorrectly or too
vigorously.
The contemporary literature does not investigate the connection between how
an increase in recovery activities can have the effect of unnecessarily overloading a
supplier. Existing quality management literature contains numerous studies that
examine whether the adoption of quality management systems by organisations can
lead to improved supply chain performance (Flynn and Flynn 2008; Yeung, 2008;
Quang et al., 2016) or can act to reduce the risk of failure in supply (Ebrahimi and
Sadeghi, 2013). Flynn and Flynn (2005) sought to identify whether the existence of a
quality management function within an organisation improves supply chain
management performance. They found that organisations form a symbiotic relationship
with their supply chain that recognises how each contributes to the others success,
describing this as the ‘Horizontal Effect’, which is encouraged by the adoption of
quality management practices (Flynn and Flynn 2005). Seldom does the literature
consider whether the existence of stringent quality processes required to achieve
adherence to a prime’s quality management system could result in reducing the
performance of a first tier supplier. In addition, rarely does the literature identify how
processes and specifications may in some cases be too stringent for first tier suppliers
to consistently adhere to, therefore contributing to reduced performance. Evidence from
the empirical research indicates that for first tier suppliers to achieve consistent
performance requires a vast amount of collaborative effort from the prime and the first
tier supplier (Barouch and Ponsignon 2016). The literature does not investigate how
such efforts can be affected by regulatory bodies19changing the industry quality
requirements on a regular basis in order to increase product safety. Frequent changes to
the quality management system can cause a decrease in performance, despite work
conducted to ensure consistent adherence by both the prime and first tier supplier.
The interaction between the focus on supplier and recovery activities is
supported in the literature to some extent. Some existing research has investigated how
19 NADCAP – National Aerospace and Defence Accreditation Programme. Industry managed
approach to conformity assessment of special processes.
207 | P a g e
organisations aim to mitigate against instances of failures. The literature highlights how
factors such as senior management involvement and alignment of strategic goals
between the buyers and suppliers are important for success in supplier development
initiatives leading to recovery from poor performance (Humphreys and Chan, 2004).
Findings from the exploratory phase add to the literature by identifying and highlighting
the importance of managing recovery initiatives in an appropriate way. Efficient and
effective methods need to be deployed in initiating mitigation activities with a failing
supplier taking into account the benefits that can be derived. This includes carefully
deciding on the intensity of the effort and the most effective number of personnel to be
deployed.
The sub-tier capability loop (B4) demonstrates how non-conformances in the
sub-tier affect a first tier supplier’s performance with the prime. The loop highlights
activities that are conducted to reduce disruption and keep blockages in production to a
minimum. This is either through short term quick fixes for an expedient resolution or
through long term resolution by conducting root cause analysis. Repenning and
Sterman (2001) reported that despite a number of tools and techniques widely available
to an organisation on how to improve product quality and therefore reduce non-
conformances, there had been little improvement in the ability of organisations to
incorporate these innovations into their daily activities.
There is very little literature that analyses the long term effects of favouring
short term quick fixes instead of establishing the root cause of non-conformances on
supplier performance. The literature focuses on understanding quality management
practices and concepts, providing descriptions of how they seek to prevent failure from
happening in the first instance (Robinson and Molhotra, 2005). Morrison (2015) did
however recently conduct research aimed at establishing why organisations carried out
‘workarounds’ in order to quickly fix problems, which is reflected in the effects
captured in the loop showing how short term quick fixes reduce blockages. The research
found that workarounds happen due to a lack of available resources needed to quickly
mitigate failures. There is currently no literature that investigates this link other than
Morrison’s (2015) study. Therefore, the loop adds to the literature by showing that an
increase in short term quick fixes reinforces blockages because the same problems have
to be fixed repeatedly. This is because a root cause and an effective change or mitigation
strategy have not been established.

208 | P a g e
The disruption loop (B5) was developed to show how interactions between
variables can also have a balancing effect in the persistent failure model. It demonstrates
how the prime seeks to improve supplier performance through reduction of non-
conformances by increasing the number of supplier improvement initiatives being
conducted, therefore increasing process compliance. The loop supports current
literature that seeks to address ways in which buying organisations utilize improvement
initiatives to improve performance (Nagati and Rebolledo 2013). This includes research
by Wagner (2010) who described a scenario whereby an increase in non-conformances
reduces process compliance and subsequently increases the amount of disruption
experienced by a prime. The findings support existing literature that examines the use
of supplier development initiatives and their positive effects on the supply chain but it
also highlights how achieving increased performance as a result of supplier
development initiatives can be dependent on the context of the failure and the methods
adopted to implement initiatives. The research also investigated how buyers manage
improvement initiatives in the event that both parties fail to mitigate against disruption
in the short term or if failure persists despite improvement initiatives being instigated.
The findings back up research by Arroyo-López et al., (2012) who identified that a
major issue with supplier development initiatives is the tendency for buying
organisations to abandon them too early in the process if implementations do not result
in an immediate improvement. Their research identified how initiatives that take longer
to complete may prove to be less successful (Arroyo-López et al., 2012). A further gap
in the literature comes with the identification of whether supplier development
initiatives can actually cause increased problems for the intended recipient over a period
of time should an initiative prove unsuccessful.
Overall, the disruption loop highlights how the prime manufacturer seeks to
ensure that the first tier supplier does not pose a risk to continuity of supply and
therefore reduce the likelihood of causing disruption to the wider organisation and
ultimately the customer (Chopra and Sodhi, 2004). This supports previous studies that
sought to identify the characteristics of supply chains in relation to frequency of
disruption (e.g. Choi and Krause, 2006; Craighead et al., 2007), although these studies
have tended to focus on how external issues can cause disruption in geographically
dispersed supply chains. In contrast, the disruption loop examines how repeat non-

209 | P a g e
conformances result from a lack of understanding of the root cause of a problem when
they first occur.
7.2 Dependency. The dependency loop (R2) was developed in order to illustrate how close long term
relationships between buyers and suppliers can lead to a state of interdependency if not
managed proactively by the prime, exacerbating the effects of persistent supply chain
failure. The type of dependencies reported in the literature tend to focus on the supplier
being dependent on the prime or larger suppliers demonstrating opportunistic behaviour
(Hou et al., 2016). However, this work shows that the causes of dependency can vary
greatly, ranging from issues concerning volume of spend, lack of sourcing options, and
strategic decisions to supplier influence and IPR. The dependency loop points to a key
interaction between variables that moves the prime towards becoming dependent on a
supplier or vice - versa. It was found that dependency can occur in either direction, i.e.
the prime can become reliant on the first tier supplier if the supplier is the design owner
of key components and / or has a large portfolio of parts that the prime finds difficult
to source from elsewhere. Conversely, the first tier supplier can become overly reliant
on the turnover generated by having a contract to supply with the prime. Makkonen et
al., (2015) found that, as a result of good performance, the prospect of awarding the
supplier with more work increases with attractiveness in the relationship between the
prime manufacturer and supplier. When this happens much of the leverage transfers to
the supplier. In an earlier study, Kähkönen (2014) found that the power dynamic within
the relationship between buyer and supplier influences the amount of collaborative
working. The loop shows that an increase in supplier attractiveness leads to an increase
in dependency and shows how the prime can lose the power balance in a relationship
by continually awarding work to an attractive supplier. The findings support the study
by Kähkönen, (2014) who observed that relationship collaboration reduces if the actors
do not have balanced power positions.
An alternative, but equally relevant perspective to how commercial
relationships can play a significant role in the understanding of persistent supply chain
failure is the work conducted by the International Marketing and Purchasing (IMP)
group starting in the early 1980s. This research suggested that the type of buyer-supplier
relationship is an inevitable outcome from the nature of business and hence beyond the
complete control of either participating company (Vaaland and Hakansson, 2003). The
210 | P a g e
dependency loop demonstrates how long term relationships can result in both the prime
and first tier suppliers becoming complacent if allowed to feedback and reinforce over
time. If the prime is in a position of dependency then this represents a genuine risk
because they cannot readily change the source of supply if performance consistently
falls below the agreed levels and the relationship turns sour, resulting in persistent
supply chain failure. The dependency loop supports the concept of power regimes
identified by Cox et al., (2001) because it demonstrates how dependency can occur on
both sides of the dyad if there are no alternatives for the prime or the supplier only has
one substantial customer. The dependency loop does not support the work by
Håkansson and Ford (2004) because it shows how long term relationships can result in
either the buyer or supplier becoming complacent if one party becomes dependent on
the other over time. The prime can forfeit a position of power (Pazirandeh and Norrman,
2014) by giving the first tier supplier more business. Sourcing decisions made by
purchasing managers at the prime are driven by current circumstances. However, the
loop demonstrates how constantly awarding a first tier supplier with more business can
have serious effects later on. There is no literature that currently investigates this
phenomenon.
The sourcing strategy loop (B1) was included in the final persistent failure
model in order to capture how the prime seeks to reduce dependency in the supply chain
by managing sourcing strategies more effectively. Caniels and Gelderman (2007) noted
in their work on power and interdependence in buyer-supplier relationships that even
satisfactory partnerships can be dominated by the supplier. The findings from some of
our case studies lend support to Caniels and Gelderman’s (2007) observation because
of the lack of substitute manufacturers. Even if the prime is in a position of influence
and strong leverage within the Kraljic matrix (1983) at the time of contract award,
agreements in aerospace can last for up to thirty years. Tacit knowledge will eventually
transfer to incumbent suppliers making it more difficult to challenge them with the
existence of competitors. As a result, first tier suppliers to the aerospace industry can
become very difficult to replace over time. This is an observation that the current
literature rarely touches upon. The literature mainly focuses on identifying different
elements of power in relationships and how buyers and suppliers need to understand
where the power dynamic is currently placed (Lacoste and Johnsen, 2015) rather than
looking at the dynamics of power over time. Rarely does the literature identify and

211 | P a g e
investigate strategies that prime manufacturers can conduct in order to prevent and
mitigate against dependencies from occurring in the supply chain over time. The
sourcing strategy loop demonstrates how this is a continual activity for the prime albeit
the outcome is not currently very successful.
The spend relationship loop (R5) has been created to illustrate how a limited
number of alternative suppliers can reduce the amount of leverage that can be exercised
by the buyer. By actively identifying a greater number of alternative suppliers in the
market, leverage for the prime can be increased. The loop shows how increased
leverage will help the prime to reduce its dependency on existing suppliers. The work
by Cox (2004) examined whether there was a correlation between the ability to improve
the performance of suppliers and the power circumstances that exist between buyers
and suppliers. Cox (2004) found that buyers are able to improve the performance of
suppliers if they can identify whether they are in a position of power / or dominance
within the supply chain. Much of the literature that advocates power / interdependence
brings up the same or similar conclusions as Cox’s et al., (2004) work, which suggests
that buyers are able to get suppliers to improve performance if they are in a position of
power or dominance. However, the variable and the sequence of effects in the loop is
based on evidence provided by the research participants, which suggests that supplier
growth was caused by consistently good performance by a first tier supplier rather than
their position / dominance in the market. This is minimised if one party exercises more
power over the other in the relationship (Kähkönen 2014). However, the participants
did not generally believe that holding a greater influence over a supplier specifically
led to improved performance by the supplier, even if this could result in an increase in
the amount of business they received from the prime. It was also suggested by a
participant from the prime during the exploratory phase that reactivity to supply chain
failures was dependent on the importance that the first tier supplier placed on the
prime’s business or how much disruption they would themselves incur as a result of the
failure. The spend relationship loop goes further and seeks to understand the factors
that generate leverage in a relationship and identifies the behaviour of the parties
involved and the effect it has on performance over time. The factors include the number
of alternative suppliers available to the prime in different commodity groups. Fewer
available suppliers has the effect of increasing the prime’s dependency on a first tier
supplier. This influences the buyer’s leverage, which has an effect on performance in

212 | P a g e
the supply chain. Research including that by Zhao et al., (2008) tends to examine the
effect that influence and leverage have on the power position as a combined effect on
performance rather than just leverage and seeks to understand who actually holds the
power in the relationship and why (Benton and Maloni, 2005). This does not take into
consideration the dynamic aspect of leverage, whereas the spend relationship loop
highlights how leverage is not static and can change over time if not managed
effectively.
The strategy mitigation loop (B6) was included in the model in order to
demonstrate how increasing available sourcing options should be a key method used by
the prime to mitigate the effects of being dependent on existing suppliers. The loop
works in tandem with the sourcing strategy loop (B1) in order to further balance out the
effect of dependency within the supply chain. Crook and Combes (2007) discuss how
even weak members of a supply chain can often gain by switching to alternative
customers and leveraging supply chain management outside of the focal supply chain,
which suggests that suppliers do not have to focus on just one customer or even one
industry. The strategy mitigation loop supports those observations as the loop attempts
to show how the prime should focus resources on identifying alternatives for first tier
suppliers that have been identified as strong members of the supply chain. Therefore,
in order to mitigate against the dominant first tier supplier the prime should attempt to
increase their leverage by developing more sourcing options over a period of time.
The literature contains few studies that seek to investigate the effects of being
on the weaker side of a relationship. However, Chen et al., (2014) studied the impact
of supply chain power structures on firm’s profitability. They found that if the prime
manufacturer is the most powerful organisation in the supply chain then profit is usually
at its highest for the prime. The study focuses on relationships within the supply chain
that result in the greatest amount of profit being generated such as sub-tier suppliers
joining forces in order to mitigate the power held by the prime manufacturer. The Chen
et al., (2014) study does not investigate the effects of being on the weaker side of the
relationship.
In challenging circumstances if a buyer does not hold leverage with a supplier
and does not appropriate any value from the relationship then the situation can become
hostile for the buyer. In many industries it is possible they will seek to end the
relationship and go elsewhere (Benton and Maloni, 2005). However, because of a lack

213 | P a g e
of options, this can be difficult to achieve within the aerospace industry, and generally
cannot be done quickly.
7. 3 Risk / Contingency Management. The supply chain capability loop (B2) illustrates the potentially negative effects of
contracting with suppliers across a widely dispersed supply chain. This supports the
observations of Bode and Wagner (2015) who identified a relationship between
geographical spread and the frequency of supply chain disruptions (Bode and Wagner,
2015). They identified how organisations that operate through complex supply chains
are subject to increased risk of supply chain disruptions. Much of the literature on
supply chain risk management focuses on identifying techniques, processes, and
procedures conducted by organisations to capture risks in order to prevent failures from
happening (Swink and Zsidisin, 2006). The limitation within the risk management
literature is the lack of studies that seek to identify what organisations should do to
manage risks when supply chain failure persists.
The literature typically describes how organisations should define the issues or
scenarios that are likely to cause problems or impact negatively on supply chain
operations if not mitigated and / or managed in a proactive manner (Wu and Olson,
2010). The supply chain capability loop contributes to the literature by highlighting
specifically how a lack of planning capability within the supply chain can cause
problems if not addressed effectively before failure occurs. In addition, the supply chain
capability loop also shows how a lack of planning capability increases pressure on the
prime to micro-manage their supply chain. Conversely, this research also found that
micro-management by the prime of first tier supplier activities has internal effects such
as an increase in reporting that middle managers are required to carry out in order to
satisfy senior managers. These observations back up studies that have identified that
prime manufacturers often intervene in all aspects of the supplier’s activities in order
to solicit an improvement in performance (Villena et al., 2011). The supply chain
capability loop shows how such micro-management can lead to an increase in on-time
delivery performance due to intervention but this may not reflect a positive situation
for the prime because of the resources it employs to achieve this. The literature
identifies how the adoption of risk management activities in small manufacturing
enterprises is relatively low (Zsidisin et al., 2004). This was strongly supported by the
findings from the exploratory phase based on observation from the first tier suppliers.
214 | P a g e
The on-time delivery Loop (R6) was included in the model to capture how
uncertain demand can affect material rescheduling and demonstrates the negative effect
on the supply chain that it can cause. The literature contains numerous studies that
investigate and explain risks related to uncertain demand and their effect on
performance (Pereira et al., 2014; Kerkkännen et al., 2008). There is little or no
literature that identifies the effect of limited planning capability with on-time delivery
performance within the supply chain. The loop demonstrates how this is an important
theme in persistent supply chain failure because it is an operational phenomenon that
can affect the entire supply chain. This supports the literature that investigates the effect
that changes in demand have on the supply chain from the customer through to the raw
material producer (Wen–Ho and Fang, 2013; Flynn et al., 2016). The loop shows how
frequent rescheduling disruption places considerable pressure on the supply chain and
reduces operational efficiency.
A number of studies concentrate on how organisations manage the risk of
external disruption within their supply chains (Kleindorfer and Saad, 2005; Bode et al.,
2011; Bode et al., 2015). The literature on risk management also identifies how large,
typically multinational organisations, have developed whole departments dedicated to
identifying and managing risks. The literature also describes how organisations
implement initiatives to manage supply risk by reducing the likelihood of a detrimental
event (Zsidisin et al., 2004) or its impact (Tang, 2006). The focus of research on risk
has tended to be principally geared towards understanding how failures can be
prevented from happening before they happen whereas the on-time delivery loop shows
how the prime needs to identify robust and flexible suppliers who have the capability
to plan and manage effectively in scenarios when adverse events occur.
7. 4 Relationship Management. The communication loop (R3) illustrates the causal relationship between the prime’s
supplier performance requirements and inadequate communication with a first tier
supplier. When the prime fails to adhere to strict communication protocols, this can
cause confusion because employees of the prime may not know what other functions /
divisions within the business are doing. This also has the effect of disrupting suppliers
within the supply chain. The findings support the research by Forslund and Jonsson
(2009) who found that a lack of consistent communication between first tier suppliers
and the prime seriously hinders supply chain management performance. Forslund
215 | P a g e
(2014) recently went on to identify a correlation between logistics performance and the
type of relationship between buyers and suppliers. The communication fragmentation
variable in the model lends support to these research findings because it demonstrates
how poorly managed communication can become a contributory cause of persistent
supply chain failure. The quality and frequency of inter-personal communication and
the subsequent management of relationships throughout the supply chain has an effect
on supplier performance. Villena et al., (2011) in their study on the ‘dark side’ of
supplier / buyer relationships found that contrary to the ‘bright side’ of buyer and
supplier relationships, which benefits the buyer because of greater collaboration, if the
relationship becomes too open then the supplier is more likely to demonstrate
opportunistic behaviour. The findings from the exploratory phase show that when
communication appeared to be inconsistent between the prime manufacturer and the
first tier supply chain, the supplier would be at greater risk of poor performance because
the prime seemed less likely to give them the information required to successfully
manufacture and supply components on time.
The silo mentality loop (R4) was incorporated into the model in order to further
highlight the significance of internal relationships / communication within the prime on
supply performance. The loop lends support to the findings of Yates (2006) who in her
study found that positive levels of internal communication within large multinational
companies transferred over to result in greater financial performance. Comments made
by participants during the exploratory phase and workshop suggested that many of the
prime’s departments and functions are working in isolation and may appear to be in
competition with each other. These observations also relate to the recent findings made
by Jacobs et al., (2016), who found that positively perceived internal communication
within organisations also facilitated positive communication with suppliers, whereas
poor internal communication is reflected by the organisation sending out mixed signals
into the supply chain because communication is not coordinated between functions /
departments.
The relationship management loop (R7) was included in the model to show how
communication and the type of interaction between the prime and first tier supplier was
a factor that could perpetuate the causes of persistent supply chain failure. Much of the
literature that investigates communication in buyer-supplier relationships identifies
how supply chain relationships are important in improving performance (Choi et al.,

216 | P a g e
2002) so the inclusion of relationship continuity variable supports this general theme in
the current literature. Relationship continuity was perceived as a way to improve or
resolve problems through the forming of coalitions with the prime (Bastl et al., 2013).
Carr and Kaynak (2007) found that traditional communication and internal – external
information sharing improves performance in the supply chain. The literature rarely
investigates how inadequate or hostile relationships can have negative effects on supply
chain performance. Parallel to these findings is the literature that suggests successful
performance based on improved relationship management can be characterised by win–
win collaborations such as the alignment of organisational goals, cultural fit, embedding
information systems and resources into both parties’ organisations (Wilding and
Humphries, 2006). The narrative from participants in this study indicated clearly that
deficiencies in these areas are a key cause of material delivery delays, which then
increase communication fragmentation as managers from the prime are placed under
greater pressure for parts to be delivered. The evidence taken from the first tier suppliers
in this study was that communication tended to became more frequent when delays had
started to cause significant disruption to the prime and not before. There appears to be
no research that directly investigates these issues. Therefore, the interactions shown
within the relationship management loop adds to the current literature.
7.5 The Persistent Failure Model. The persistent failure model adds to and provides new and fresh insights to current
knowledge and literature by providing a fundamentally new chain of interactions that
explains the phenomenon under study. Each loop within the model provides the related
literature with new insights, confirmation or further insights relating to previous studies
conducted on similar or related topics. A number of the interactions highlighted within
the model refute some studies in the current literature. However, most importantly, the
model demonstrates how the current contemporary literature is silent on the issue of
persistent supply chain failure. The use of causal loop diagrams is rarely used in the
supply chain management literature as a method of presenting findings from case study
research (Adamides et al., 2012). Furthermore, and irrespective of the extant operations
and supply chain management literature being well represented with examples of
failure, none of them directly addresses the issue of persistent failure nor do they
attempt to model the phenomenon as a sequence of interactions that results in such
failure, as done in this work.

217 | P a g e
As the data collection process during this study on persistent supply chain
failure was heavily focused on semi-structured interview and recorded workshop data,
causal loop diagrams are seen as a robust method of presenting the findings in order to
facilitate an understandable way of testing the data (Meredith, 1998). Despite
comprehensive research that has utilised System Dynamics to model supply chains,
articles written within the project and programme management literature and risk /
contingency management literature represent the closest identified research studies with
this study (Zsidisin, 2003; Chopra and Sodhi, 2004; Sterman and Dogan, 2015). Project
management research covering topics such as causes of cost and time scale overruns on
large scale and mega projects have used System Dynamics and causal loop diagrams to
highlight the characteristics of these failures (Howick and Eden, 2004).
The persistent failure research adds to the literature on System Dynamics by
presenting the model through dominant interacting themes. In addition, another
interesting element of the persistent failure model is how a combination of literature
subject areas are used to identify and support causality and the effects of causality on
the system. Therefore, managers can pinpoint areas of risk and also develop strategies
for mitigation within the same model. Only rarely are there studies that use a cross
pollination of literature topics in supply chain and operations management and show
how they relate to each other to result in failure.
The model also adds new knowledge to each of the principal literature domains
that have been reviewed. None of the literature domains analysed throughout the study
attempt to demonstrate how topics and activities link together to create either a positive
or negative effect on the supply chain. Furthermore, none of the literature domains
covered have been formulated into a model that practitioners can use to visually identify
causal relationships between variables. Nor has a model been created previously that
shows the effect on organisations if problems are not treated in an expedient way can
reinforce to cause persistent supply chain failure.
7.6 Managerial and Business Implications. Throughout the duration of this research project and more specifically during each of
the defined phases and stages of the research, many insights have been identified that
have managerial and business implications, not least concerning the behaviour and
actions of managers and organisations participating in the supply chain. The persistent
failure model captures the outcome of such actions and the effect of strategic sourcing

218 | P a g e
decisions made by the prime’s organisation over a number of years. The implications
of this research project do not just affect managers from the target research sample.
They also have implications for purchasing and supply chain managers and their
employing organisations in other related high tech manufacturing industries. The model
is presented as a tool that can support managers in relevant functions at both the prime
and first tier suppliers to understand and mitigate against failure.
7.6.1 Implications of the Supplier Performance Loops.
The prime’s quality management system is a combination of internal quality system
requirements and industry regulations. Being able to achieve the industry regulations is
considered a standard entry requirements for all first tier suppliers in the industry.
Failure is not tolerated in the aerospace industry because of safety issues for good
reasons - if a prime manufacturer cannot readily find substitute suppliers they have a
duty of care to ensure existing supplier’s products meet the required standards. As a
consequence, each of the loops that are related to adherence to the prime’s quality
management system portray the effort required to achieve improved supplier
performance in order for first tier suppliers to consistently meet agreed targets. These
activities are not mutually exclusive and are as much the prime’s responsibility as the
first tier suppliers. The most important implications for businesses and managers of the
Supplier Performance Loops are:
The prime should fully ensure that the first tier supplier is capable of achieving
agreed targets before a contract is agreed and trading is commenced. Reducing
the risk of future non-conformances involves close collaboration and
communication throughout the early stages of the buyer / supplier relationship
and effective decision making by the prime on a supplier’s true capabilities.
Changes to industry regulations are inevitable and cannot be avoided.
Therefore, potential updates should be anticipated and factored into project
plans. Both the prime and the first tier supplier need to adequately plan for such
eventualities rather than attempting to manage the effect of making changes
retrospectively. By doing so, when a change to the quality management system
occurs, the effect on supplier performance can be minimised. However, given
the structure of this kind of industry the primary responsibility for this process
is likely to rest with the prime organisations.

219 | P a g e
Poor alignment of performance management systems between the prime and
first tier suppliers affects supplier performance by increasing disruption and
consequently the frequency of audits required to ensure that non-conformances
are minimised. Therefore, the prime should work with their first tier suppliers
to ensure they have the best possible understanding of the supplier’s
performance before increasing the frequency of audits.
When failures start to persist, the pressure that is applied to the managers
responsible for a supply chain engenders the tendency to favour quick fixes or
workarounds in order to reduce current disruption. However, short term
resolution of problems may not be sustainable. Developing ‘workarounds’ to
solve a problem in order to quickly alleviate blockages is likely eventually to
feed back to cause persistent failure. These observations are particularly
important for managers at both the prime and the first tier suppliers because they
build up over time and so are difficult to identify until it is too late. A strong
message reflected by the supplier performance themed loops is that managers
need to avoid resorting to short term solutions for failures and concentrate on
identifying the root cause and sustainable problem resolution. Otherwise, the
failure is likely to become persistent.
7.6.2 Implications of the Dependency Loops.
The Dependency themed loops show how high performing first tier suppliers can
become so attractive to the prime that it results in procurement managers increasing
spend at a rate that neither the prime nor the first tier supplier can manage effectively.
Problems then occur when the first tier supplier’s performance falls below contractually
agreed levels. The most important implications for businesses and managers of the
Dependency Loops are:
If an increase in spending with a sole supplier is not controlled, then the risk of
persistent failure is increased should the supplier be unable to cope with the
extra volume. It was found that procurement managers need to be especially
cognisant of suppliers if (1) the first tier supplier is one of a few companies that
has all of the approvals and certifications required to supply product to the
industry, (2) supply a large portfolio of parts to both the prime and its
competitors, and (3) is an IPR owner on components used on prime’s end
product. Changing a supplier that demonstrates any, some, or all of these

220 | P a g e
characteristics during periods of poor performance will result in the need to
either re-design the part or find an alternative supplier. Therefore the prime
needs to (1) recognise the emergence of ‘lock – in’ and thus dependency and (2)
take avoiding action.
The identified factors that increase dependency are strongly influenced by
complacency and / or indecision. The outcome of complacency and / or
indecision may be extremely difficult to mitigate against because first tier
suppliers have switched their effort to other competitors or alternative
industries. Therefore, the prime’s influence is reduced. The prime needs to
consider identifying more sourcing options capable of operating as a dual source
solution in order to increase its buying leverage rather than focusing on a single
supplier where possible.
In the event that a poorly performing supplier is a sole source, the prime must
pursue supplier development initiatives in a collaborative, but also assertive
manner in order to establish the root cause of the failure instead of leaving the
first tier supplier solely responsible for the recovery.
First tier suppliers can become dependent on the prime for the majority of their
turnover. This represents a risk to the prime because if there is a situation where
demand drops considerably in the industry, then this could potentially send a
first tier supplier out of business. This can have serious implications for the
prime because they risk losing a readily available source of supply. The
evidence has highlighted how moving from one source of supply to another is a
very time consuming activity.
The core message portrayed by the dependency themed set of loops is that if a
consistent approach to developing sourcing options is not fostered and pursued,
it will invariably result in a lack of supplier options and will reduce the buying
party’s leverage within the supply chain, potentially pushing up costs but also
reducing performance. To counter this, managers at the prime must commit to
a long term strategic view and develop options that create competition in the
market.
7.6.3 Implications of the Risk Management Loops.
The Risk Management themed set of loops highlight how uncertain demand schedules
can be a contributory cause of persistent supply chain failure. The effects of poor
221 | P a g e
planning capability throughout the supply chain can further exacerbate the problem.
The most important implications for businesses and managers of the Risk Management
loops are:
Rather than behaving reactively, the prime should refrain from requesting first
tier suppliers to reschedule production of components once the original demand
schedule has been submitted and accepted by the supplier. Frequent changes to
demand places significant pressure on the planning capability of first tier
suppliers, which increases the likelihood of persistent supply chain failure,
especially throughout a widely dispersed sub-tier supply chain.
The loops also show how a lack of capable suppliers within the supply chain
places considerable pressure on the prime to micro-manage existing suppliers.
There is a general lack of planning capability throughout the supply chain,
which has resulted in the prime micro managing suppliers who represent a risk
to achieving on time delivery. It is the prime and first tier supplier’s inability to
plan for material requirements adequately that sits behind many delivery
failures and resultant shortages. The evidence highlights the need for an agile
supply chain with a coordinated approach to demand planning and management.
Supply chain flexibility is achieved by suppliers who have considerable
experience of the prime’s processes and procedures and have a proven track
record of achieving agreed on time delivery targets. The on-time delivery loop
shows managers that operational efficiency must be achieved on the supply of
existing components before the first tier supplier is considered for new business.
First tier suppliers who are new to the industry must be given adequate time in
order to achieve and demonstrate operational efficiency. Problems occur when
new suppliers are hastily awarded more work in order to mitigate issues with
existing first tier suppliers.
The core message portrayed by the risk management set of loops is that both the
prime and first tier supplier need to take joint ownership of a problem to mitigate
against persistent supply chain failure. Managers at the prime need to strike a
balance by persisting with long term strategies and developing sourcing options
within the supply chain but also must help existing suppliers to improve
operational efficiency on the components they already supply.

222 | P a g e
7.6.4 Implications of the Relationship Management Loops.
The relationship management series of themed loops highlights how the effect of poor
communication throughout the supply chain can contribute to persistent supply chain
failure. A lack of information often prompts first tier suppliers to stop proceeding with
production until satisfactory answers and guidance are provided by the prime. The
prime is often slow to respond to queries from the first tier suppliers causing a
detrimental ripple effect through the first tier’s sub-tier supply chain that eventually
feeds back to affect deliveries to the prime. The quality of communication is also a very
important factor, not just the frequency. The most important implications for businesses
and managers of the Relationship Management loops are:
The relationship management themed loops demonstrate to managers at the
prime how relationship management issues can contribute to causing persistent
supply chain failure just as much as failing to adhere to quality procedures.
The communication loop shows managers at the prime how a reduction in
adequate and properly managed communication can lead to a reduction in
supplier performance resulting in persistent failure. The prime has fewer
processes and procedures for relationship management than for processes
ensuring quality adherence or sourcing strategies. The prime has a ‘one-size-
fits-all’ relationship management process that is currently being used by supply
chain employees across the globe. As a consequence of cultural differences
between employees in a multi-national company, the process of communicating
with suppliers is being managed independently between sites, leading to
inconsistencies in the way processes and procedures are presented to
international suppliers.
The communication loop shows managers how an uncoordinated / fragmented
approach to communication can lead to ‘silos’ developing in different parts of
the company. Fragmented communication protocols can lead to a reduction in
relationship continuity. To mitigate against the effects of reduced relationship
continuity greater collaborative working between the prime and first tier
suppliers from the very beginning of the relationship, including collaborative
working during the design phase, should be considered. Early engagement
would establish closer relationships and more effective communication
structures.

223 | P a g e
The findings have wider managerial implications because they highlight the
existence of a general lack of coordination between internal functions, which is
exacerbated by internationally based departments / functions within the prime.
Poor communication within the prime feeds back to result into poor
communication throughout the first tier supply chain. When failures persist, a
risky culture of firefighting emerges as employees from across the organisation
‘progress chase’ on behalf of the part of the organisation they represent. Silo
thinking permeates throughout the organisation until firefighting becomes the
sole focus for managers at multiple levels from different functions of the
business.
The core message portrayed by the relationship management themed loops are
that in order to improve supply chain relationship management and
communication the prime must examine current communication processes and
established protocols within the organisation and then coordinate with the first
tier suppliers. A complete review of all processes and procedures related to
relationship management needs to be conducted and administered globally
throughout the organisation to establish continuity and just as importantly, some
regional flexibility where justified.
7.6.5 Implications of the Persistent Failure Model.
Based on the findings of this research project, the phenomenon of persistent supply
chain failure is just starting to be appreciated and its implications understood. New
contributions and significant insights come from having a real understanding of the
causes of persistent failure, which the persistent failure model provides for the first
time. A key purpose for the development of persistent failure model was to create a
comprehensive visualisation tool that could be used by businesses and by purchasing
and / or supply chain professionals to help mitigate failure. The model pinpoints
interactions between key variables that link and eventually reinforce to cause supply
chain failures to persist if not treated effectively and expediently. The model shows
these as unfavourable linkages between variables that can develop into reinforcing
loops. The model also demonstrates how causal loops feedback to cause vicious cycles
that if not mitigated can result in serious disruption. The model also highlights activities
/ variables that are implemented by the prime and first tier suppliers to counteract the
negative effects of reinforcing interactions and loops. These include expediently

224 | P a g e
informing suppliers of a change in regulations, developing a consistent approach to
sourcing with suppliers and continually monitoring the supply market for alternative
sourcing opportunities. Additionally, and in order to avoid confusion the model also
prompts the prime to refrain from changing a supplier’s demand schedule in order to
prioritise production of components because of delays and to maintain a consistent
approach when communicating with the supply chain.
The core messages communicated by the model in its entirety is that the prime
needs to recognise the emergence of a persistent failure scenario and use the model to
help identify and focus on developing both avoidance and recovery strategies that help
organisations to mitigate against long term failures by demonstrating how short term
thinking and reactive strategies combine to create unfavourable situations in the long
term if not managed correctly.
7.6.6 Using the Model to Mitigate against Persistent Failure.
A key output of the research on Persistent Supply Chain Failure is to inform key
decision makers / supply chain professionals how to identify and mitigate against
failure. This can be achieved by using the Persistent Failure Model as a tool to identify
the potential to break loops, turn reinforcing loops from vicious to virtuous, and reduce
the delays that cause overshoot in balancing oscillatory loops.
For example the Supplier Performance Loop – R1 demonstrates to key decision
makers how overzealous recovery activities reinforce to increase supplier overload
because the resource availability of the first tier supplier needed to commit to and
support recovery activities and therefore increase performance levels, are seldom taken
into consideration by the prime, which can lead to a reduction in the performance and
effectiveness of these activities. Preventing this loop from becoming closed is critical
to improving supplier performance. Therefore the loop can be used to show supply
chain professionals how interactions between variables need to be closely examined
before increasing the focus on the supplier and injecting additional resources in order
to break the loop and mitigate against it becoming a closed reinforcing loop that
becomes more vicious to the organisation after each oscillation.
The Sub Tier Capability Loop B4 and the Disruption Loop B5 both demonstrate
activities being conducted by the prime that seek to reduce the effects of failure and
increase supplier performance. The Sub Tier Capability Loop B4 illustrates how the
interaction between the non-conformance and supplier improvement initiative variables

225 | P a g e
has a critical effect on process compliance which drives supplier performance. Equally,
the disruption loop B5 can be used to inform supply chain professionals that improving
process compliance reduces disruption. Loop B5 also demonstrates how initiatives that
are implemented with the goal of improving process compliance can become delayed
unless supplier improvement activities are managed effectively resulting in continued
failure.
The Dependency Loop R2 was developed based on findings from both the
exploratory phase and then comments captured during the workshop highlighting how
consistently giving an attractive supplier more work can feed back to increase
dependency which can conspire to make both the first supplier and the prime over
reliant on each other. To counteract this, the Sourcing Strategy Loop B1 demonstrates
to supply chain professionals how persisting with sourcing strategies is an effective
method of reducing dependency on both sides. In addition, the Strategy Mitigation
Loop B6 shows how consistently pursuing further sourcing options helps the prime to
increase their leverage within the industry and can help to break the dependency loop
by reversing the reliance that both the first tier supplier and the prime have built up.
The Communication Loop R3 is an example highlighted in the model of how to
help supply chain professionals identify interactions between variables that can turn
reinforcing loops from vicious to virtuous. In conducting the empirical research and
also in discussions in the workshop, it became apparent that efforts for improvement
were focused more on quality management in order to increase supplier performance.
It was identified that the way in which communication was managed throughout the
supply chain could perpetuate a lot of the failure, especially if suppliers were regularly
being ignored. The Silo Thinking Loop R4 in the model highlights how communication
fragmentation is driven by departments at the prime having a tendency to work in silos.
The lack of a co-ordinated approach feeds back to turn the communication loop into a
vicious cycle which if not mitigated quickly can drive the mismanagement of recovery
activities causing capacity overload at the first tier supplier and ultimately reduced
performance. Through highlighting these negative interactions, the model can be used
to reverse and prevent the effects of poor communication within the supply chain by
motivating the prime to place greater emphasis on establishing appropriate supplier
communication protocols throughout the organisation. The desired effect is to minimise
firefighting and silo thinking at the prime, which will consequently help the loop to

226 | P a g e
become virtuous by contributing to more efficient and better informed recovery
activities that the first tier supplier is able to manage effectively.
A number of the loops, both balancing and reinforcing are highlighted within
the Persistent Failure Model as being impacted by time delays. The delays have been
included to acknowledge and highlight the empirical findings that show the prime’s
goal of improving aspects of failure within their system are being delayed resulting in
oscillatory behaviour. Thus, the model illustrates to supply chain professionals where
resources can be positioned in order to prevent recovery initiatives highlighted within
balancing loops from demonstrating oscillatory behaviour.
Overall, the intention of the Persistent Supply Chain Failure model is to give
supply chain professionals at the prime the visibility to identify and understand how
key variables interact within each theme forming closed loops that can interact
negatively to result in persistent failure. Each theme, demonstrates loops that are an
effect of failure and show how they interact with loops that cause failure. Variables that
interact with the goal of reducing the effects of failure are also highlighted to enable the
development of action plans that seek to ensure that reinforcing effects of failure are
reduced. Initiatives can also be put in place to prevent further disruption by time delays
which can occur if goal seeking initiatives are not managed correctly.
7.7 Research Conclusions. This study’s research questions have been satisfactorily answered by developing and
validating the persistent failure causal loop model. The empirical research has been
exploratory in its methodology (McCutheon and Meredith, 1993), adopting a critical
realism perspective (Adamides et al., 2012). The research has also facilitated theory
development (Borgström, 2011) and has direct relevance for practice (Piekkari, 2010).
The methodology and research design for this study was influenced by Yin’s
(2009) multiple case study protocol. However, in order to enrich the findings and to
ensure methodological rigor, various innovations have taken place to ensure that
informative answers to the research questions were captured (Pratt, 2009). The practice
was an essential element of the research project as new and rich insights emerged,
culminating in the development of the persistent failure model. Due to the very limited
amount of supply chain and operations management literature focusing explicitly on
persistent failure, the research phase was by definition ‘exploratory’ as new areas of
interest and methods of displaying findings emerged. Summarised below are the major

227 | P a g e
conclusions to each of the research questions drawn from the research process, the
empirical evidence, the persistent failure model, and the overall findings of the study.
7.7.1 Addressing Research Question One.
The initial motivation for the study was to understand why first tier suppliers could be
allowed to persistently fail on agreed deliverables during the contract period with the
prime manufacturer. This led to investigations being carried out in order to answer the
first research question for this research:
RQ1 ‘What is persistent supply chain failure and how can it be understood?’
Why is persistent supply chain failure allowed to happen? The evidence
captured during the study and presented in Chapters 4, 5 and 6, describes how specific
failures can feed back to eventually cause supply problems that cannot be easily or
quickly remedied or effectively managed by the prime due to a number of factors
including a lack of substitutes with adequate design and manufacturing capability or
capacity, and very time-consuming and high switching costs. The research has found
that failures become persistent when different variables interact over time creating
volatile relationships and ineffective relationship management processes that result in
highly negative effects for the prime. The effects include reduced supplier quality and
delivery performance, interdependency between the prime and first tier supplier, and
communication fragmentation between the prime and the first tier supplier and
throughout the sub-tier supply chain.
The identified influencing factors and effects of failure have been consolidated
into four principal themes / quadrants, i.e. Supplier Performance, Dependency, Risk
Management, and Relationship Management. The identified variables that sit within
each of these themes can interact to ultimately cause persistent failure within the supply
chain. As demonstrated within the persistent failure model, the variables form linkages
that develop into feedback cycles, which can escalate into vicious cycles that become
very difficult to remedy (or balance out in causal loop terms). It was also found that
deficiencies in any of these four domains can result in a type of supply failure that
becomes very difficult to eliminate or successfully mitigate quickly.
The literature highlighted some examples of high profile failures at
manufacturing companies including large scale disruptions within the automotive
industry over the past fifty years (Hammond, 2013) and the characteristics of those
scenarios. The literature was also replete with theories and studies devoted to examining

228 | P a g e
ways of helping manufacturing companies to avoid failure or escape from it happening
in the first place (Zsidisin and Smith, 2005). However, the specific topic of why a
supply could be allowed to fail persistently was absent from the literature.
Answering RQ1 involved identifying and describing how each variable and
interaction could influence the phenomenon of persistent failure. Ultimately, persistent
supply chain failure as captured in the model is the effect of the prime and a first tier
supplier not identifying and subsequently managing interactions adequately between
key variables that can develop into recurring causes of failure over time, allowing the
relationships to exacerbate the effect of failures to the point whereby they cannot be
easily mitigated or resolved quickly.
7.7.2 Addressing Research Question Two.
The purpose of research question two was to understand the processes / interactions that
could explain why persistent failures occur. The key gap in the literature was the lack
of research that sought to evaluate failure that continues to disrupt prime manufacturing
organisations in some industries over a period of time. This led to the second research
question for this study:
RQ2: ‘What factors drive persistent supply chain failure and what are the
interrelationships between them?’
Findings from the study have enabled the development of a model that captures
and illustrates multiple factors that interact to contribute to persistent supply chain
failure. The model captures and describes prominent variables that drive failures,
causing significant effects on the first tier supplier, ultimately affecting its ability to
deliver successfully to the prime. The variables and interactions are highlighted within
the Supplier Performance loop (R1), Dependency Loop (R2) and the Communication
Loop (R3). Interactions that are likely to reinforce failures if not treated expediently are
shown in the Silo Mentality Loop (R4), On Time Delivery Loop (R6) and the
Relationship Management Loop (R7). The model also captures how the variables can
interact with loops based on other themes shown in the Persistent Failure Loop (B3) to
balance out persistent failure providing the oscillatory behaviour of time delays is
avoided.
The model encapsulates how inter-relationships between loops (and not just
variables) also drive persistent failure, for example, the Supplier Performance loops can
interact with the Dependency loops to create a form of lock-in, resulting in the prime

229 | P a g e
being unable to resource components quickly even when failure persists. Interactions
between the Dependency and Risk Management loops develop as the prime lacks
capability and options in their supply chain resulting in the need to micro-manage
suppliers, preventing time to forward plan.
Instigating a risk management process using the persistent failure model either
at the very start of a commercial relationship or at key points within a relationship can
be a mechanism to capture and record all of the issues / potential risks. For instance,
the Relationship Management loops highlight how inadequate communication between
key stakeholders within the supply chain exacerbates the risk of supply chain failure
throughout the model. All of the loops interact to perpetuate the causes and effects
contributing to persistent supply chain failure. The insights are underpinned by the
Persistent Failure Loop (B3), which is a consolidation of all the key loops that drive
and also seek to balance out the effects of failure.
Observations from the validation workshop justified the use of causal loop
diagrams to provide a clear and concise method for answering research question two.
The method proved valuable for capturing the dominant variables that interact to cause
persistent supply chain failure, and show why and how they interact.
7.7.3 Addressing Research Question Three.
The purpose of research question three was to gain insight into how the prime and first
tier suppliers could tackle supply chain failure. This led to the third and final research
question:
RQ3: ‘What supply chain recovery strategies can be adopted to help resolve different
types of persistent failures effectively?’
The identification of the key causal relationships can demonstrate to managers
how organisations are at risk of suffering significant disruption if they fail to identify
and manage potential risks of failures early in a contractual relationship. In order to
help managers at the prime resolve persistent supply chain failures effectively the
persistent supply chain failure model highlights the need for managers at the prime to
concentrate on identifying the root cause of a failure rather than consistently repeating
short term solutions in order to fix problems quickly. Although they can take longer to
establish, sustainable resolutions to problems must be identified and pursued in order
to avoid persistent failures from reoccurring.

230 | P a g e
In addition, the model demonstrates how the prime must remain committed to
long term strategic plans by developing alternative supply options that create
competition in the market. The model demonstrates this by highlighting how
interdependencies between the prime and first tier supplier can lead to commercial lock
in if not managed correctly. In order to successfully mitigate against interdependencies
that have formed overtime, managers at the prime need to establish the correct balance
between persisting with long term strategies and developing sourcing options within
the supply chain.
In order to help existing first tier suppliers to improve operational efficiency on
the components they already supply, the prime needs to minimise the amount of
material rescheduling requests made once schedule requirements have been accepted
by the first tier supplier. The model highlights how adoption of this strategy by the
prime reduces scheduling disruption and improves existing planning capability
throughout the first tier supply chain. The need for the prime to micro-manage the
supply chain will also be reduced.
The model also highlights how deficiencies in the prime’s current
communication processes and established protocols feeds back to exacerbate the risk
of developing internal silos, which in turn contribute to persistent failure. The model
highlights to managers how relationship management / communication is equally as
important to improving supplier performance as process compliance for example and
therefore must be effectively managed in order to reduce the causes and effects of
persistent supply chain failure.
7.8 Chapter Conclusions. The purpose of Chapter 7 was to critically discuss the persistent failure model in relation
to the current state of knowledge and related literature and identify the implications for
business and management. The contributions made to the literature of individual loops
have been discussed and the unique contribution of the complete model is highlighted.
Business and managerial implications of the model were then assessed providing clear
guidance to managers at prime industrial organisations with directions on how to avoid
persistent supply chain failure with a first tier supplier. Key contributions pertaining to
where and how a prime needs to focus its efforts in order to firstly resolve persistent
failure and secondly mitigate against reoccurrences in the future was provided. Finally,
it has been demonstrated how the research questions have been successfully addressed

231 | P a g e
during the research project. This highlights a significant contribution to existing
literature on supply chain and operations management.

232 | P a g e
Chapter 8: Conclusion. From the beginning, the ultimate goal of this research project was to address a critical
business problem by performing new empirical research and generating insights that
would contribute to solving the problem. Upon commencement of the project, it was
identified that some literature talked about a perceived gap between management
research and the practitioner world (Teece, 2007). There have been many comments
made about how far apart the two worlds appear to be (Meredith, 1998). Despite there
being a multitude of research studies, there is a debate within the operations / supply
chain management field around the usefulness of the research literature for practitioners
(Stuart et al., 2002 pp. 419). A challenge that researchers face is being able to convert
developed theories into practical uses for practitioners. This background motivated the
approach taken to the empirical study in this work - the best way to extract rich insights
and tacit knowledge was to discuss issues directly with practitioners themselves through
multiple case studies. The research captured a real life topical management problem
and sought to present the findings in the clearest possible way using a model based on
interacting causal loops. A brief summary of how each stage was conducted and
presented is provided here.
The background and motivation for the study was introduced in Chapter 1. A
brief discussion of previous literature studies that sought to investigate supply chain
failure along with a description of the supply chain management literature to be
reviewed was given and research background was then provided followed by an
examination of key research topics. This was followed by an introduction to the
research aims, objectives and expected contributions. The research questions were then
introduced to highlight key issues that needed to be explored and addressed. This was
done in order to illustrate subject areas that would be investigated throughout the study.
Finally, an overview of the research methodology and design was given.
A comprehensive review of literature relevant to the study of persistent supply
chain failure was provided in Chapter 2 (Literature Review). Key gaps in the
contemporary literature were identified, justifying the research questions proposed in
Chapter 1. In order to develop a set of robust research questions that could address gaps
in the literature and adequately justify the study of the phenomenon of persistent supply
chain failure, a wide breadth of literature needed to be investigated covering a number

233 | P a g e
of related domains. Finally, the principal research themes that guided the research
design and methodology Chapter were identified and discussed.
In Chapter 3, Methodology and Research Design, the research protocol that was
developed and followed throughout the study was described in detail. This included a
detailed description of the structure for the research approach, which included
information about the selection of companies and the managers within these
organisations that would participate in the study. In addition, a description of the data
gathering process and protocols for each set of participants was given. In order to
illustrate how categories and themes were developed from the data, commentary was
provided detailing how the coding process was conducted followed by a description of
causal loop diagrams and analysis of how they are constructed and what they can show.
Finally, a review of the steps taken to validate the research findings was provided to
ensure that the methods applied were rigorous, robust and are repeatable.
In Chapter 4, Qualitative Analysis, the most consistently identified causes of
failure highlighted in the study by the target groups were presented and then organised
into specific categories and themes. Throughout the Chapter, key observations and
findings were documented and analysed. This included empirical evidence and
narrative descriptions captured in the exploratory phase. The emergence of the
phenomenon of persistent supply chain failure was then described, followed by a review
of the empirical evidence and its relationship with the literature.
Chapter 5, Causal Analysis, focused on providing justifications for how and
why variables were developed from the empirical evidence that was analysed and
categorized in Chapter 4. An explanation of how each of the variables interact to form
causal loop diagrams was then described in detail along with the presentation of each
developed loop, culminating with the introduction of an initial complete model of
persistent failure for the first time. The Chapter ends with a glossary of terms that
provided descriptions and a brief explanation of the individual variables.
Chapter 6, Validation, described and analysed observations and critique of the
failure persistence model given by participants in a model validation workshop held at
the prime’s facility. This was preceded by a pilot study testing of the model. The
workshop held at the prime’s facility involved a thorough critiquing and validation of
the failure persistence model. Every observation and comment captured regarding each
loop was presented and discussed during the workshop. This led to a further developed

234 | P a g e
iteration of the causal loop model, now entitled the ‘Persistent Failure’ model to help
in identifying, understanding and mitigating against persistent supply chain failure.
Analysis and review of the updated persistent supply chain model was given along with
a description of the updated variable definitions.
In Chapter 7, Discussion, each causal loop model was discussed in relation to
the existing literature and current state of knowledge culminating in a review of the
completed and newly developed model. Whether each causal loop confirmed, added to,
or refuted existing thinking was examined. In addition, an identification of whether the
literature is currently silent on each captured issue was given, clarifying where and how
the model adds to existing knowledge. The Chapter then discussed the managerial and
business implications of the persistent failure model. A review and justification of how
the research questions had been addressed as a result of the research project was then
provided, demonstrating the key findings presented in the persistent failure model.
Finally, here in Chapter 8, Conclusions, we summarize the formulation,
validation and development of the persistent failure model. The limitations and an
examination of potential further areas for research are discussed. Elements of the
research methodology and design that could be further developed are indicated. Ideas
for further research that have emerged during the course of the project are also
presented.
8.2 Limitations of Multiple Case Study Research. As the theory of persistent supply chain failure was being developed, a large portion of
the research process required an element of innovation (Piekkari et al., 2010). As a
consequence of the practical realities of conducting research in the real world, a number
of things did not go to plan. Also, reflecting on the study, there are a number of issues
that could be further developed in future research. The limitations of this type of study
and the further opportunities that have emerged are noted here.
Persistent supply chain failure can occur due to a multitude of reasons, issues,
influences, and negative interactions over a period of time. This research project was
guided by the philosophical approach of critical realism based on the opportunity to
gather and interpret data from a large prime manufacturer and a number of first tier
suppliers with a history of failure, an opportunity that perhaps others may not have had.
Five first tier suppliers participated in the study. They represented a good blend due to
their differing characteristics and history with the prime. A significant number of supply

235 | P a g e
chain professionals from both first tier suppliers and the prime participated. Although
the study is large in comparison with many published empirical studies in supply chain
management, in the development of the research design and methodology it was hoped
that a larger number of participants would take part in interviews across a larger sample
of first tier suppliers. The sensitivity of the topic did prove to be challenging. This
included the potential bias in responding, particularly the first tier supplier participants
who had a tendency to blame the prime’s strict quality management system and
subsequent behaviour for contributing to persistent failure. However, this was mitigated
by the guarantee of anonymity and through conducting research with both parties, i.e.
conducting case study research on the prime in order to gain their perspective on causes
of persistent failure. In addition to the sensitivity of this emotive subject area, other
obstacles and practical constraints were inevitably experienced, in particular the time
available to collect data.
As with all qualitative studies, the key issue is saturation (Mason, 2010) - how
many interviews does it take to gain sufficient knowledge that underpins the theoretical
propositions required to satisfactorily answer the research questions? There are a
number of literature responses that attempt to address this question (e.g., O’Reilly and
Parker, 2012), although it is generally considered to occur when participants start
providing insights and observations that have already been captured. A strong
indication that the number of interview participants who contributed to the semi-
structured interviews during the exploratory phase was sufficient was that the
participants from both the first tier suppliers and then the prime repeatedly discussed
the same issues.
All of the participants in this study were from the UK, although the supply
chains they managed were globally dispersed with sub-tier supply chains based in Far
East (China and Japan) and also in Central Eastern Europe (Poland). Although this was
not necessarily a limitation, future research opportunities could investigate first tier
suppliers and prime manufacturers from other countries. A further limitation of this
work is that only one industry was investigated, i.e., the aerospace industry. Other
complex high-tech manufacturing industries could also be studied such as Automotive,
Rail, Marine, and Power Systems because they contain similar high quality standards,
complex planning and production processes and often share suppliers across supply
chains due to the utilisation of similar components and technology.

236 | P a g e
Reviewing a large literature spectrum was required to identify potential domains
of relevance and identify gaps in the literature with regard to the phenomenon of
persistent supply chain failure. Research that was related to the phenomenon was spread
across a myriad of different literature topics. The search criteria for this project brought
up literally tens of thousands of books, academic journals and practitioner journals.
Focusing the literature and then identifying a potential gap that would lead to a
contribution to knowledge was an extremely time consuming endeavour because such
searches are never fully exhaustive. The most directly relevant domains were used to
underpin this research. However other theory domains in business and management
such as agency theory (Zu and Kaynak, 2012) might also have been explored if time
had allowed.
A further potential limitation of the research project was the use of only two
methods of research, i.e. a qualitative study using multiple case study research, followed
by causal loop modelling. Due to the size and overall complexity of the study alternative
methods were precluded but could be considered. Adopting a ‘triangulation’ approach
in the empirical research methodology, i.e. data collected in two ways such as directly
interviewing key members of staff and issuing questionnaires sent to a pre-determined
sample of participants within the organisations selected. Data derived from each
approach could then be grouped together using coding in order to establish trends and
a specific data set per each research question. In order to ensure that the information
attained was uniform across all six organisations (including the prime), the data could
then have been collected and coded in exactly the same way demonstrating a method
for reliability. However, this would have been much more time consuming and the
success of this activity may have been questionable due to the sensitive subject of the
research, i.e., participants may have been unwilling to record negative issues in a survey
that might reflect badly on them, their business function, their superiors, or their
organisation. Thus, a justification for not using quantitative style questionnaires is that
they may have proven too be too limited.
In this research it was decided that qualitative research alone was the most
efficient method to identify why failures occur within the sub-tier supply chain
management process. By conducting semi-structured interviews, in view of the
philosophical standpoint, and obtaining data from a real life setting from supply chain
professionals, it was felt that this would provide a greater opportunity for richer data

237 | P a g e
with more depth. Quantitative research surveys might not have provided a picture of
the dynamic element of a relationship between buyers and suppliers or the interaction
of influential variables since the original contract formulation. Interpreting interview
data with the use of coding by asking structured questions that were specifically
designed to identify cause and effect of failure proved to be an effective method to
adopt.
Finally, this study did not run simulations or test the model through simulation
as is often done in System Dynamics research. The purpose of the study was to define
persistent supply chain failure and to understand the cause and effect of variables within
each of the loops and how they contribute to persistent supply chain failure. Therefore,
developing simulations in order to test the model was outside the scope of the study.
8.3 Opportunities for further research. Due to the nature of this research project, the sheer number of literature domains
considered and the case studies conducted, a number of other issues emerged that would
justify further examination. The methodology and postulated theory development of
persistent failure provides a myriad of opportunities for further research. Below are
noted some of the opportunities that could enhance academic research in this area and
add value to operations and supply chain management theory and practice:
(i) Conducting simulations and testing the model – The next stage in the
development and evolution of the model is to test the effectiveness of the
persistent supply chain failure model by simulating a real life scenario at the
prime and demonstrating the cause and effects of failure dynamically over a
period of time. The model could pinpoint potentially negative interactions
between variables enabling supply chain managers to put mitigation activities
in place in time to either reduce the effect of failure or prevent failures from
occurring in the first instance. The big challenge for such a study is the
specification of the time lags that occur between causes and effects in the
model. This would be a major research project in itself requiring further
empirical research.
(ii) Agency Theory (Prosman et al., 2016) – could be used to analyse the ‘principal–
agent’ relationship between the prime and first tier supplier as this approach
was not investigated in the study. Using an agency theory perspective could be
especially pertinent in further understanding the supplier performance set of

238 | P a g e
loops. For example, does the principal act in the best interests of the supplier?
Conversely with the dependency theme i.e. does the supplier act in the best
interests of the principal at every opportunity (Bosse and Philips, 2017)? More
specifically, self-serving behaviour within the relationship by either the prime
or the first tier suppliers was not examined, which could add greater insight into
the causes of persistent supply chain failure (Bosse and Philips, 2017). A
further question that could be examined concerns whether one of the parties
generates value at the expense of the other party even if it can become
detrimental to both parties in the long term?
(iii) Identifying the effects of changes over a period of time – Tracking the
effectiveness of interventions made to the system. This could be done by
developing a System Dynamic Model and then evaluating the effect of sudden
changes in policy by the prime on the supply chain and how this affects
persistent supply chain failure.
(iv) The effects of Risk and Revenue Partnerships on Persistent Supply Chain
Failure – These types of partnerships (Ghadge et al., 2017) are formed in order
to spread the cost and risk of new product development into the supply chain.
As a result, the supplier invests in the project and takes a percentage of the
engine sale. They are by definition long term. What are the effects on the prime
if such a supplier begins to cause persistent supply chain failure?
(v) Enabling managers to visualise the effects of external factors – The area of
research focus could be on the first tier and sub-tier supply chain. Changes to
industry regulations and the effects caused could be measured to see how they
affect supply chain performance.
(vi) Highlighting the effects of poor relationship management – This could study
the effects of the prime continually changing the personnel who interact with a
first tier supplier. Evidence from the exploratory stage shows how the prime
regularly changes personnel who act as the point of contact to first tier
suppliers. Participants from the first tier suppliers reported how this activity
caused them disruption because relationships had to be continually re-
established wasting time and effort on their part.
(vii) Implementation of a new visual tool for management – Taking advantage of
being able to condense large amounts of information into one model, managers
239 | P a g e
can use the model and the research methodology that has been created to
develop supply chain recovery strategies. Also, the prime could use the model
to make internal process and protocol design changes.
(viii) Substitute or additional value stream mapping – The causal loop diagrams
show network cause and effects, i.e. they identify potential outcomes of supply
chain designs rather than just identifying the component parts of a supply chain
or a process. The causal loop model could provide managers with visibility of
interacting variables that could cause failure before the failures are allowed to
happen. The model could also show how quickly solving a problem in one part
of the system can potentially cause a problem in another area.
(ix) Identification of the implications on decisions - internal organisational
structures and strategy. The effects of the organisation of individual
departments having their own purchasing functions such as the aftermarket
function could be explored.
The aforementioned areas for further research are some of the potential
opportunities that the persistent supply chain model represents to industry.
8.4 Wider Application of the Persistence Failure Model. As development of the model progressed from being an initial concept, through to
validation, further potential applications emerged. The persistent failure model could
be utilised by prime manufacturers and wholesalers in a number of industries as a way
of visualising their supply chain management and identifying where risks may occur in
the future. Persistent failure is tolerated far less in industries such as Automotive and
FMCG industries but significant failures do still happen. For example, the automotive
industry regularly suffers from high profile supply chain failures resulting in mass
recalls (Marksberry, 2012). The fast moving consumable goods (FMCG) sector such as
food retail, can be relatively complex and advanced in terms of preparation and
packaging and is also sensitive to supply chain failure (Lambert et al., 2016). The horse
meat scandal (Premanandh, 2013) highlights why leading supermarket chains need to
have control and visibility of their supply chain. The electronics industry is another
market with often large and complex sub-tier supply chains (Cooper et al., 1997). In
recent years this industry has been affected by unpredicted events caused by natural

240 | P a g e
disasters and industrial accidents. Another threat for these companies is obsolescence20
and disruptive technologies21. In some of these industries there will be an opportunity
to switch suppliers more quickly than in aerospace. By adopting a causal loop diagram
methodology, such manufacturers could identify and link key variables together from
their respective markets and use the model as an early warning system by identifying
which variables could interact to reinforce possible future failure.
20 Obsolescence – The process of components or manufacturing techniques becoming outdated and
therefore no longer required. These are usually superceded with new technology or improved
processes.
21 Disruptive Technologies’ – Technology that renders rival products or processes as obsolete.

241 | P a g e
References. Acharyulu, G.V.R.K (2012) “Leveraging customer relationship management (CRM) in
corporate hospital supply chain”, The IUP Journal of Supply Chain Management, Vol.
9 No.1 pp 73 – 87.
Adamides, E.D., Papachristos, G and Pomonis, N (2012) “Critical realism in supply
chain research”, International Journal of Physical Distribution & Logistics
Management, Vol. 42 Iss 10 pp906 – 930.
Akkermans, H. A., Bogerd, P and Vos, B (1999) “Virtuous and vicious cycles on the
road towards international supply chain management”, International Journal of
Operations and Production Management. Vol. 19 No.5/6 pp.565 – 581.
Akyuz, G. A, and Erkan, T. E. (2010) “Supply Chain Performance Measurement: A
Literature Review”, International Journal of Production Research, Vol. 48 No. 17 pp.
5137–5155.
Ambulkar, S., Blackhurst, J and Grawe, S (2015) “Firm’s resilience to supply chain
disruptions: Scale development and empirical examination”, Journal of Operations
Management, Vol. 33–34 pp. 111–122.
Anderson, J.C and Narus, J.A (1990) “A Model of Distributor Firm and Manufacturer
Firm Working Partnerships”, Journal of Marketing, Vol. 54 No. 1 pp. 42 – 58.
Anderson, E. G., Fine, C. H and Parker, G. G (2000) “Upstream Volatility in the
Supply Chain: The machine Tool Industry as a Case Study”, Austin (TX): Department
of Management, University of Texas.
Angerhofer, B.J and Angelides, M.C (2000) “System Dynamics Modelling in Supply
Chain Management: Research Review”, Proceedings of the 2000 Winter Simulation
Conference, Department of Information Systems and Computing Brunel University.
Antelo, M and Bru, L (2010) “Outsourcing or restructuring: The dynamic choice”,
International Journal of Production Economics, Vol. 123 pp. 1–7.
Aritua, B., Smith, N.J and Bower, D (2011) “What risks are common to or amplified in
programmes: Evidence from UK public sector infrastructure schemes”, International
Journal of Project Management, Vol. 29 (2011) pp. 303–312.
Arroyo – López, P., Holmen, E and De Boer, L (2012) “How do supplier development
programs affect suppliers? Insights for suppliers, buyers and governments from an
empirical study in Mexico”, Business Process Management Journal, Vol. 18 No. 4
pp680 – 707.
Aviation Week Network (2015) “Supply Chain Research Insights: Global Aerospace
Industry Size and Growth”, Aviation Network.com Dec 23.

242 | P a g e
Auden, W.C., Shackman, J.D and Onken, M.H (2006) “Top management team,
international risk management factor and firm performance”, Team Performance
Management, Vol. 12 Iss 7 pp209 – 224.
Augusto de Matos, C., Luiz Henrique, J and Vargas Rossi, C.A (2007) “Service
Recovery Paradox: A Meta-Analysis”, Journal of Service Research, Volume 10, No. 1
pp60-77.
Autry, C.W and Golicic, S.L (2010) “Evaluating buyer–supplier relationship–
performance spirals: A longitudinal study”, Journal of Operations Management, Vol.
28 pp87–100.
Avots, I (1969) “Why Does Project Management Fail?”, Californian Management
Review, Vol. 12 No. 1 pp. 77 – 82.
Baker, M.J (2000) “Writing a Literature Review”, The Marketing Review, Vol.1 pp219
– 247.
Bakshi, N and Kleindorfer, P (2009) “Co-opetition and Investment for Supply-Chain
Resilience”, Production and Operations Management, Vol. 18, No. 6 pp. 583–603.
Barnabe, F (2011) “A system dynamics – based balanced scorecard to support strategic
decision making. Insights from a case study”, International Journal of Productivity and
Performance Management, Vol. 60 No. 5 pp446 – 473.
Barouch, G and Ponsignon, F (2016) “The epistemological basis for quality
management”, Total Quality Management and Business Excellence, Vol. 27 No.7-8 pp.
944-962.
Barratt, M., Choi, T.Y and Li, M (2011) “Qualitative case studies in operations
management: Trends, research outcomes, and future research implications”, Journal of
Operations Management, Vol. 29 pp329–342.
Basit, T.N (2003) “Manual or electronic? The role of coding in qualitative data
analysis”, Educational Research Vol. 45 No. 2 pp143–154.
Bastl, M., Johnson, M and Choi, T.Y (2013) “Who’s seeking whom? Coalition behavior
of a weak player in buyer – supplier”, Journal of Supply Chain Management, Vol. 49.
No.1 pp8 – 28.
Basu, R (2014) “Managing quality in projects: An empirical study”, International
Journal of Project Management, Vol. 32 pp178–187.
Belen del Rio Lanza, A., Vasquez – Casielles, R and Diaz – Martin, A.M (2009)
“Satisfaction with service recovery: perceived justice and emotional responses”,
Journal of Business Research, Vol. 62 pp. 775 – 781.
Benton, W.C and Maloni, M (2005) “The influence of power driven buyer/seller
relationships on supply chain satisfaction”, Journal of Operations Management, Vol.
23 pp1–22.

243 | P a g e
Beverland, M and Lindgreen, A (2010) “What makes a good case study? A positivist
review of qualitative case research published in Industrial Marketing Management,
1971–2006”, Industrial Marketing Management, Vol. 39 pp. 56–63.
Bhandari, M.S., Tsarenko, Y and Polonsky, M.J (2007) “A proposed multi-dimensional
approach to evaluating service recovery”, Journal of Services Marketing, Vol. 21 Iss 3
pp174 – 185.
Biggemann, S and Buttle, F (2009) “Coordinated interaction and paradox in business
relationships”, Journal of Business and Industrial Marketing, Vol. 24 Iss 8 pp. 549 –
560.
Boateng, P., Chen, Z., Ogunlana, S and Ikediashi, D (2012) “A system dynamics
approach to risks description in megaprojects development” Organisation, Technology
and Management in construction an International Vol. 4 No. 3
Bode, C and Wagner, S.M (2015) “Structural drivers of upstream supply chain
complexity and the frequency of supply chain disruptions”, Journal of Operations
Management Vol. 36 pp. 215–228.
Bode, C., Wagner, S.M., Petersen, K.J and Ellram, L.M (2011) “Understanding
responses to supply chain disruptions: Insights from information processing and
resource dependence perspectives”, Academy of Management Journal, Vol. 54 No. 4
pp. 833 – 856.
Borgström, B (2012) “Towards a methodology for studying supply chain practice”,
International Journal of Physical Distribution & Logistics Management, Vol. 42 Iss 8/9
pp. 843 – 862.
Bosse, D.A and Philips, R.A (2016) “Agency theory and bounded self – interest”,
Academy of Management Review, Vol. 41, No. 2, pp. 276–297.
Bryman, A, and Bell, E (2011), “Business research methods”, Oxford University Press.
Buch – Hansen, H (2013) “Social Network Analysis and Critical Realism”, Journal for
the Theory of Social Behaviour, Vol. 44 No.3 pp. 306 – 325.
Busi, M and Bititci, U.S (2006) “Collaborative performance management: present and
future gaps and research”, International Journal of Productivity and Performance
Management, Vol. 55 Iss. 1 pp. 7 – 25.
Busse, C., Schleper, M.C., Niu, M and Wagner, S.M (2016)," Supplier development for
sustainability: contextual barriers in global supply chains ", International Journal of
Physical Distribution & Logistics Management, Vol. 46 No. 5 pp. 442 – 468.
Busse, C., Schleper, M.C., Weilenmann, J and Wagner, S. M (2017) “Extending the
supply chain visibility boundary Utilizing stakeholders for identifying supply chain
sustainability risks”, International Journal of Physical Distribution and Logistics
Management, Vol. 47 No. 1 pp. 18 – 40.

244 | P a g e
Cadden, T., Humpreys, P and McHugh, M (2010) “The influence of organisational
culture on strategic supply chain relationship success”, Journal of General
Management, Vol. 36 No. 2 pp. 37 – 64.
Cagliano, A.C., Grimaldi, S and Rafele, C (2015) “Choosing project risk management
techniques. A theoretical framework”, Journal of Risk Research, Vol. 18 No.2 pp. 232-
248.
Caniels, M.C.J and Gelderman, C.J (2007) “Power and interdependence in buyer
supplier relationships: A purchasing portfolio approach”, Industrial Marketing
Management, Vol. 36 pp. 219 – 229.
Carr, A.S and Kaynak, H (2007) “Communication methods, information sharing,
supplier development and performance”, International Journal of Operations &
Production Management, Vol. 27 Iss 4 pp. 346 – 370.
Chai, J.A., Liu, J.N.K, Ngai, E.W.T. (2013) “Application of decision-making
techniques in supplier selection: A systematic review of literature”, Expert Systems
with Applications, Vol. 40 pp. 3872–3885.
Chan, F.T.S and Kumar, N (2007) “Global supplier development considering risk
factors using fuzzy extended AHP-based approach”, International Journal of
Management Science Omega Vol.35 pp. 417 – 431.
Chandra, C and Kumar, S (2000) “Supply chain management in theory and practice: a
passing fad or a fundamental change”? Industrial Management and Data Systems, Vol.
100 Iss 3 pp. 100 – 114.
Chapman, R.J (1998) “The role of system dynamics in understanding the impact of
changes to key project personnel on design production within construction projects”,
International Journal of Project Management Vol. 16 No. 4 pp. 235 247.
Chebat, J.C and Slusarczyk, W (2005) “How emotions mediate the effects of perceived
justice on loyalty in service recovery situations: an empirical study”, Journal of
Business Research, Vol.58 pp. 664– 673.
Chen, L.G., Ding, D and Ou, J (2014) “Power Structure and Profitability in Assembly
Supply Chains”, Production and Operations Management, Vol. 23 No. 9 pp. 1599–
1616.
Chen, Y.S., Rungtusanatham, M.J., Goldstein, S.M and Koerner, A.F (2013)
“Theorizing through metaphorical transfer in OM/SCM research: Divorce as a
metaphor for strategic buyer–supplier relationship dissolution”, Journal of Operations
Management, Vol. 31 pp. 579–586.
Cho, D.W., Lee, Y.H., Hwa Ahn, S and Hwang, M.K (2012) “A framework for
measuring the performance of service supply chain management”, Computers and
Industrial Engineering, Vol. 62 pp. 801–818.

245 | P a g e
Choi, T.Y., Wu, Z., Ellram, L and Koka, B.R (2002) “Supplier–Supplier Relationships
and Their Implications for Buyer–Supplier Relationships”, IEEE Transactions on
Engineering Management, Vol. 49 No. 2 pp. 119 – 130.
Choi, T. Y., and Krause. D. R. (2006) “The Supply Base and Its Complexity:
Implications for Transaction Costs, Risks, Responsiveness, and Innovation”, Journal
of Operations Management, Vol. 24 No. 5 pp. 637–652.
Choi, J and Chung, W (2013) “Analysis of the Interactive Relationship between
Apology and Product Involvement in Crisis Communication: An Experimental Study
on the Toyota Recall Crisis”, Journal of Business and Technical Communication, Vol.
27 No.1 pp. 3-31.
Chopra, S and Sodhi, M.S (2004) “Managing Risk To Avoid Supply-Chain
Breakdown”, MIT Sloan Management Review Fall 2004, pp. 53 – 61.
Choy, K.L., Chow., H.K.H., Lee, and W.B and Chan, F.T.S (2007) “Development of
performance measurement system in managing supplier relationship for maintenance
logistics providers”, Benchmarking: An International Journal, Vol. 14 No. 3 pp. 352-
368.
Christopher, M., Mena, C., Khan, O and Yurt, O (2011) "Approaches to managing
global sourcing risk", Supply Chain Management: An International Journal, Vol. 16 Iss
2 pp. 67 – 81.
Clauss, T and Spieth, P (2016) “Treat your supplier’s right! Aligning strategic
innovation orientation in captive supplier relationships with relational and transactional
governance mechanisms”, R&D Management, Vol. 46 No. S3 pp. 1044 – 1061.
Clemons, R and Slotnick, S.A (2016) “The effect of supply-chain disruption, quality
and knowledge transfer on firm strategy”, International Journal of Production
Economics, Vol. 178 pp. 169–186.
Clivillé, V and Berrah, L (2012) “Overall performance measurement in a supply chain:
towards a supplier-prime manufacturer based model”, Journal of Intelligent
Manufacturing, Vol. 23 pp. 2459–2469.
Cohen, M.A and Kunreuther, H (2007) “Operations Risk Management: Overview of
Paul Kleindorfer’s Contributions”, Production and Operations Management, Vol. 16,
No. 5 pp. 525–541.
Cook, M and Hagey, R (2003) “Why companies flunk supply chain 101: only 33
percent correctly measure supply – chain performance; few use the right incentives”,
Journal of Business Strategy, Vol. 24 No. 4 pp. 35 – 42.
Cooper, M.C., Lambert, D.M and Pagh, J.D (1997) “Supply Chain Management: More
Than A New Name for Logistics”, International Journal of Logistics Management, Vol.
8, No. 1 pp. 1 – 14.

246 | P a g e
Cooper, M.C and Ellram, L.M (1993) “Characteristics of Supply Chain Management
and the Implications for Purchasing and Logistics Strategy”, The International Journal
of Logistics Management, Vol. 4 Issue: 2, pp.13-24.
Corbin, J and Strauss, A (1990) “Grounded Theory Research: Procedures, Canons and
Evaluative Criteria”, Qualitative Sociology, Vol. 13 No. 1 pp. 3 – 20.
Corsten, D., Gruen, T and Peyinghaus, M (2011) “The effects of supplier-to-buyer
identification on operational performance: An empirical investigation of inter-
organizational identification in automotive relationships” Journal of Operations
Management, Vol.29 pp. 549 – 560.
Cox, A (1999) “Power, value and supply chain management”, Supply Chain
Management: An International Journal, Vol.4 No.4 pp. 167-175.
Cox, A (2001) “Managing with Power: Strategies for Improving Value Appropriation
from Supply Relationship”, Journal of Supply Chain Management, Vol. 37, No. 1 pp.
42–47.
Cox, A (2001) “The Power Perspective in Procurement and Supply Management”,
Journal of Supply Chain Management, Vol. 37, No. 1 pp. 4–7.
Cox, A (2001) “Understanding Buyer and Supplier Power: A Framework for
Procurement and Supply Competence” Journal of Supply Chain Management, Vol. 37,
No. 1, pp. 8–15.
Cox, A (2004) “Business relationship alignment: on the commensurability of value
capture and mutuality in buyer and supplier exchange” Supply Chain Management: An
International Journal, Vol.9 No.5 pp. 410-420.
Cox, A (2004) “The art of the possible: relationship management in power regimes and
supply chains”, Supply Chain Management: An International Journal, Vol. 9 No.5 pp.
346-356.
Cox, A., Sanderson, J and Watson, G (2001) “Supply Chain and Power Regimes:
Towards an Analytic Framework for Managing Extended Networks of Buyer and
Supplier Relationship”, Journal of Supply Chain Management, Vol. 37, No. 1 pp. 28–
35.
Cox, A., Watson, G., Lonsdale, C and Sanderson, J (2004) “Managing appropriately in
power regimes: relationship and performance management in 12 supply chain cases”,
Supply Chain Management: An International Journal, Vol. 9 No.5 pp. 357-371.
Craighead, C.W., Karwan, K.R and Miller, J.L (2004) “The Effects of Severity of
Failure and Customer Loyalty on Service Recovery Strategies”, Production and
Operations Management, Vol. 13 No.4 pp. 307–321.
Craighead, C.W (2007) “The Severity of Supply Chain Disruptions: Design
Characteristics and Mitigation Capabilities”, Decision Sciences Vol. 38 No. 1 pp. 131 –
156.

247 | P a g e
Crook, T.R and Combs, J.G (2007) “Sources and consequences of bargaining power in
supply chains”, Journal of Operations Management, Vol. 25 pp. 546–555.
De Waal, A.A and Counet, H (2009) “Lessons learnt from performance management
systems implementations” International Journal of Productivity and Performance
Management, Vol. 58 Iss. 4 pp. 367 – 390.
Demeter, K (2014) “Operating internationally: The impact on operational performance
improvement” International Journal of Production Economics, Vol. 149 pp. 172 – 182.
Diaye, M.A., Greenan, N and Pekovic, S (2014) “Sharing the ‘fame’ of ISO standard
adoption: quality supply chain effects evidence”, International Journal of Production
Research, Vol. 52 No. 18 pp. 5396 – 5414.
Dogan, G. and Sterman, J.D (2005) “When less leads to more: Phantom ordering in the
beer game”, Proceedings of the 2005 International System Dynamics Conference,
Boston, MA.
Donaldson, L (2001) “The Contingency Theory of Organisations”, Sage Publications
Inc.
Dyer, J. H and Nobeoka, K (2000) “Creating and managing a high performance
knowledge – sharing network: The Toyota case” Strategic Management Journal, Vol.
21 pp. 345 – 367.
Easton, G (2010) “Critical realism in case study research”, Industrial Marketing
Management, Vol. 39 pp. 118–128.
Ebrahimi, M and Sadeghi, M (2013) “Quality management and performance: An
annotated review”, International Journal of Production Research, Vol. 51 No. 18 pp.
5625–5643.
Edvardsson, B., Tronvoll, B and Hoykinpuro, R (2011) “Complex service recovery
processes: how to avoid triple deviation”, Managing Service Quality, Vol. 21 No. 4 pp.
331 – 349.
Eisenhardt, K.M (1989) “Building Theories from Case Study Research”, Academy of
Management Review, Vol. 14, No. 4 pp. 532-550.
Ekici, A (2013) “An improved model for supplier selection under capacity constraint
and multiple criteria” International Journal of Production Economics, Vol. 141 pp. 574
– 581.
Elahi, E., Sheikhzadeh, M and Lamba, N (2014) “An Integrated Outsourcing
Framework: Analyzing Boeing’s Outsourcing Program for Dreamliner (B787)”,
Knowledge and Process Management, Vol. 21 No.1 pp. 13–28.

248 | P a g e
Ellegaard, C and Anderson, P.H (2015) “The process of resolving severe conflict in
buyer–supplier relationships”, Scandinavian Journal of Management, Vol. 31 pp. 457–
470.
Ellis, S.C., Henry, R.M and Shockley, J (2010) “Buyer perceptions of supply disruption
risk: A behavioural view and empirical assessment”, Journal of Operations
Management, Vol. 28 pp. 34-47.
Ellram, L.M and Hendrick, T.E (1995) “Partnering Characteristics: A Dyadic
Perspective”, Journal of Business Logistics, Vol. 16 No. 1.
Ellram, L.M and Cooper, M.C (2014) “Supply Chain Management: It's All About the
Journey, Not the Destination”, Journal of Supply Chain Management, Vol. 50, Issue 1
pp. 8–20.
Elonen, S and Artto, K.A (2003) “Problems in managing internal development projects
in multi-project environments”, International Journal of Project Management, Vol. 21
pp. 395–402.
Ergun, O., Heier Stamm, J.L., Keskinocak, P and Swann, J.L (2010) “Waffle House
Restaurants hurricane response: A case study”, International Journal of Production
Economics, Vol. 126 Iss. 1 pp. 111 – 120.
Farrell, J and Klemperer, P (2006) “Coordination and Lock-In: Competition with
Switching Costs and Network Effects”, eScholarship University of California 2006.
Fernandes, A.C., Sampaio, P., Sameiro, M and Truong, H.Q (2017) “Supply chain
management and quality management integration: A conceptual model proposal”,
International Journal of Quality and Reliability Management, Vol. 34 Issue: 1, pp.
53-67.
Flynn, B.B and Flynn, E.J (2005) “Synergies between supply chain management and
quality management: emerging implications”, International Journal of Production
Research, Vol. 43 No. 16 pp. 3421 – 3436.
Flynn, B.B., Sakakibara, S., Schroeder, R.G., Bates, K. A. and Flynn J.E (1990)
“Empirical Research Methods in Operations Management”, Journal of Operations
Management, Vol. 9 No. 2 pp. 250 – 284.
Flynn, B.B., Koufteros, X and Lui, G (2016) “On theory in supply chain uncertainty
and its implications for supply integration”, Journal of Supply Chain Management, Vol.
52, No. 3 pp. 1 – 25.
Forrester, J. W (1961) “Industrial Dynamics”, Portland, OR: Productivity Press.
Fornell, C and Wernerfelt, B (1987) “Defensive Marketing Strategy by Customer
Complaint Management: A Theoretical Analysis”, Journal of Marketing Research, Vol.
24, No. 4 pp. 337-346.

249 | P a g e
Forslund, H (2014), “Exploring logistics performance management in supplier/retailer
dyads”, International Journal of Retail and Distribution Management, Vol. 42 No. 3
pp. 205 – 218.
Forslund, H and Jonsson, P. (2009) “Obstacles to supply chain integration of the
performance management process in buyer supplier dyad. The buyers’ perspective”,
International Journal of Operations & Production Management, Vol. 29 No. 1 pp. 75
– 95.
Foster, S.T (2008) “Towards an understanding of supply chain quality management”,
Journal of Operations Management, Vol. 26 pp. 461 – 467.
Friedl, G and Wagner, S.M (2012) “Supplier development or supplier switching?”,
International Journal of Production Research, Vol. 501No.11 pp. 3066-3079.
Fynes, B., De Burca, S and Mangan, J (2008) “The effect of relationship characteristics
on relationship quality and performance”, Int. J. Production Economics, Vol. 111 pp.
56–69.
Gelderman, C. J and Van Weele, A.J (2003) “Handling measurement issues and
strategic directions in Kraljic’s purchasing portfolio model”, Journal of Purchasing and
Supply Management, Vol. 9 pp. 207–216.
Gelderman, C.J and Van Weele, A.J (2005) “Purchasing Portfolio Models: A Critique
and Update”, Journal of Supply Chain Management, pp. 19 – 28.
Germain, R., Claycomb, C and Dröge, C (2008) “Supply chain variability,
organizational structure, and performance: The moderating effect of demand
unpredictability” Journal of Operations Management, Vol.26 pp. 557 – 570.
Ghadge, A., Dani, S., Ojha, R and Caldwell, N (2017) “Using risk sharing contracts for
supply chain risk mitigation: A buyer-supplier power and dependence perspective”,
Computers and Industrial Engineering, Vol. 103 pp. 262–270.
Gligor, D. M (2014) "The role of demand management in achieving supply chain
agility", Supply Chain Management: An International Journal, Vol. 19 Iss 5/6 pp. 577
– 591.
Gnizy, I (2016) “Power dynamics of the international marketing within firms and how
they shape international performance”, Industrial Marketing Management, Vol. 57 pp.
148–158.
González, M.E., Quesada, G and Monge, C.A.M (2004) “Determining the importance
of supplier selection process in manufacturing: a case study”, International Journal of
Physical Distribution and Logistics Management, Vol. 34 Iss 6 pp. 492 – 504.
Govindan, K and Fattahi, M (2017) “Investigating risk and robustness measures for
supply chain network design under demand uncertainty: A case study of glass supply
chain”, International Journal of Production Economics, Vol. 183 pp. 680–699.

250 | P a g e
Govindan, K., Kannan, D and Haq, N.A (2010) “Analyzing supplier development
criteria for automobile industry”, Industrial Management and Data Systems, Vol. 110
Iss 1 pp. 43 – 62.
Groesser, S.N and Schaffernicht, M (2012) “Mental Models of dynamic systems: taking
stock and looking ahead” System Dynamics Review, Vol. 28 No. 1 pp. 46 – 68.
Grundy, T (2006) “Rethinking and reinventing Michael Porter’s five forces model”,
Strategic Change Vol. 15 pp. 213–229.
Hahn, C (2008) “Doing Qualitative Research using your Computer: A practical guide”,
Sage.
Haji-Kazemi, S., Andersen, B and Petter Krane, H (2013) “A Review on Possible
Approaches for Detecting Early Warning Signs in Projects”, Project Management
Journal, Vol. 44 No. 5 pp. 55–69.
Hammond, R.G (2013) “Sudden Unintended Used-Price Deceleration? The 2009–
2010 Toyota Recalls”, Journey of Economics and Management Strategy, Vol. 22, Iss.
1 pp. 78–100.
Han, J.,Trienekens, J.H and Omta, S.W.F (2011) “Relationship and quality
management in the Chinese pork supply chain”, Int. J. Production Economics, Vol. 134
pp. 312–321.
Handley, S.M and Benton Jr, W.C (2012) “Mediated power and outsourcing
relationships”, Journal of Operations Management, Vol. 30 pp. 253 – 267.
Harland, C.M (1996) “Supply Chain Management: Relationships, Chains and
Networks”, British Journal of Management, Vol. 7 pp. 63 – 80.
Harland, C.M., Zheng, J., Johnson, T and Lamming, R. C (2004) “A Conceptual Model
for Researching the Creation and Operation of Supply Networks”, British Journal of
Management, Vol. 15 pp. 1 – 21.
Harland, C.M., Lamming, R.C and Cousins, P.D (1999) “Developing the concept of
supply strategy”, International Journal of Operations and Production Management,
Vol. 19 Issue. 7, pp.650-674.
Hart, C (1998) “Doing a Literature Review: Releasing the Social Science Research
Imagination”, Sage Publications.
Ho, W., Zheng, T., Yildiz, H and Talluri, S (2015) “Supply chain risk management: a
literature review”, International Journal of Production Research, Vol. 53, No. 16, pp.
5031–5069.
Hocutt, M.A., Bowers, M.R and Donavan, D.T (2006),"The art of service recovery: fact
or fiction?", Journal of Services Marketing, Vol. 20 Iss 3 pp. 199 – 207.
251 | P a g e
Hodgkinson, G.P and Starkey, K (2012) “Extending the Foundations and Reach of and
Starkey’s ‘Not Simply Returning to the Same Answer Over and Over Again’”, British
Journal of Management, Vol. 23 pp. 598–604.
Hollinger, P (2016) “Airbus and Boeing put pressure on supply chain”, Financial
Times, July 26.
Holmberg, S (2000) “A systems perspective on supply chain measurements”,
International Journal of Physical Distribution & Logistics Management, Vol. 30 No.10
pp. 847-868.
Holweg, M (2007) “The genealogy of lean production”, Journal of Operations
Management Vol. 25 No. 2 pp. 420–437.
Hornibrook, S., Fearne, A and Lazzarin, M (2009) “Exploring the association between
fairness and organisational outcomes in supply chain relationships”, International
Journal of Retail and Distribution Management, Vol. 37 No. 9 pp. 790 – 803.
Howick, S and Eden, C (2004) “On the nature of discontinuities in system dynamics
modelling of disrupted projects”, Journal of the Operational Research Society, Vol. 55
Iss. 6 pp. 598 – 605.
Huang, M.H (2011) “Re-examining the effect of service recovery: the moderating role
of brand equity”, The Journal of Services Marketing, Vol. 25 No.7 pp. 509 – 516.
Humphreys, P.K., Lib, W.L and Chan L.Y (2004) “The impact of supplier development
on buyer–supplier performance”, International Journal of Management Science Omega
Vol.32 pp. 131 – 143.
Huo, B., Wang, Q., Zhao, X and Schuh, S (2016) “Threats and benefits of power
discrepancies between organisations: a supply chain perspective”, International
Journal of Production Research, Vol. 54 No.13 pp. 3870-3884.
Håkansson, H and Ford, D (2002) “How should companies interact in business
networks?” Journal of Business Research, Vol. 55 pp. 133– 139.
Håkansson, H and Ford, H (2004) “IMP – some things achieved: much more to do”
European Journal of Marketing Vol. 40 No. 3/4 pp. 248-258.
Ik-Whan G. Kwon Taewon Suh, (2005) “Trust, commitment and relationships in supply
chain management: a path analysis”, Supply Chain Management: An International
Journal, Vol. 10 Iss 1 pp. 26 – 33.
Jabbarzadeh, A., Fahimnia, B and Sheu, J.B (2017) “An enhanced robustness approach
for managing supply and demand uncertainties”, International Journal of Production
Economics, Vol. 183 pp. 620–631.
Jacobs, M. A., Yu, W and Chavez, R (2016) “The effect of internal communication and
employee satisfaction on supply chain integration”, International Journal of
Production Economics, Vol. 171 pp. 60–70.

252 | P a g e
Jalilia, Y and Ford, D.N (2016) “Quantifying the impacts of rework, schedule
pressure, and ripple effect loops on project schedule performance”, System Dynamics
Review, Vol 32, No. 1 pp. 82–96.
Johnston, R and Pongatichat, P (2008) “Managing the tension between performance
measurement and strategy: coping strategies”, International Journal of Operations &
Production Management, Vol. 28 No. 10 pp. 941 – 967.
JungYun, C and Hur Soo Cheong Jang S, (2016) “Toward service recovery strategies:
the role of consumer organization relationship norms”, Journal of Services Marketing,
Vol. 30 No. 7 pp. 724 – 735.
Kaplan, R.S and Norton, D.P (1996) “Linking the Balanced Scorecard to Strategy”,
California Management Review, Vol. 39 No. 1, pp. 53-79.
Kähkönen, A.K (2014) “The influence of power position on the depth of collaboration”,
Supply Chain Management: An International Journal, Vol. 19/1 pp. 17–30.
Kähkönen, A.K and Tenkanen, M (2010) “The impact of power on information sharing
in the Finnish food industry”, British Food Journal, Vol. 112 No. 8 pp. 821 – 835.
Kähkönen, A.K., Lintukangas, K and Hallikas, J (2015) “Buyer’s dependence in value
creating supplier relationships”, Supply Chain Management: An International Journal,
Vol. 20 Iss 2 pp. 151 – 162.
Kaman, C., Savasaneril, S and Serin, Y (2013) “Production and leadtime quotation
under imperfect shop floor information”, International Journal of Production
Economics, Vol. 144 pp. 422–431.
Kapsali, M (2011) “Systems thinking in innovation project management: A match that
works”, International Journal of Project Management, Vol. 29 pp. 396–407.
Kauppi, K., Longoni, A., Caniato, F and Kuula, M (2016) “Managing country
disruption risks and improving operational performance: risk management along
integrated supply chains”, International Journal of Production Economics, Vol. 182 pp.
484–495.
Kerkkänen, A., Korpela, J and Huiskonen, J (2009) “Demand forecasting errors in
industrial context: Measurement and impacts”, International Journal of Production
Economics, Vol. 118 pp. 43–48.
Kim, D.H (1992) “Guidelines for Drawing Causal Loop Diagrams”, The Systems
Thinker, Vol 3, No 1, pp. 5-6.
Kim, D.Y., Kumar, V and Kumar, U (2012) “Relationship between quality management
practices and innovation”, Journal of Operations Management, Vol. 30 pp. 295 – 315.

253 | P a g e
Kim, Y., Chen, Y.S and Linderman, K (2015) “Supply network disruption and
resilience: A network structural perspective”, Journal of Operations Management, Vol.
33–34 pp. 43–59.
Kleindorfer, P.R and Saad, G.H (2005) “Managing Disruption Risks in Supply Chains”,
Production and Operations Management, Vol. 14 No. 1 pp. 53–68.
Knoppen, D., Christiaanse, E and Huysman, M (2010) “Supply chain relationships:
exploring the linkage between inter – organisational adaption and learning”, Journal of
Purchasing and Supply Management, Vol. 16 pp. 195 – 205.
Kotha, S and Srikanth, K (2013) “Managing a global partnership model: lessons from
the Boeing 787 Dreamliner program”, Global Strategy Journal, Vol. 3 pp. 41–66.
Koufteros, X., Verghese, A.J and Lucianetti, L (2014) “The effect of performance
measurement systems on firm performance: A cross-sectional and a longitudinal study”
Journal of Operations Management, Vol.32 pp. 313 – 336.
Kraljic, P (1983) “Purchasing must become Supply management” Harvard Business
Review September–October 1983.
Krause D.R., Handfield, R.B and Scannell, T.V (1998) “An empirical investigation of
supplier development: reactive and strategic processes”, Journal of Operations
Management, Vol.17 pp. 39–58.
Krause D.R., Handfield, R.B and Tyler, B.B (2007) “The relationships between
supplier development, commitment, social capital accumulation and performance
improvement”, Journal of Operations Management, Vol.25 pp. 528–545.
Krause, D and Ellram, L.M (2014) “The Effects of the Economic Downturn on
Interdependent Buyer–Supplier Relationships”, Journal of Business Logistics, Vol. 35
No. 3 pp.191–212.
Krause, D.R and Ellram, L.M (1997) “Success factors in supplier development”,
International Journal of Physical Logistics Management, Vol. 27 No. 1 pp. 39 – 52.
Krishna, A., Dangayach, G.S and Jain, R (2011) “A conceptual framework for the
Service Recovery Paradox”, The Marketing Review, 2011, Vol. 11 No. 1 pp. 41-56.
Kroes, J.R and Ghosh, S (2010) “Outsourcing congruence with competitive priorities:
Impact on supply chain and firm performance” Journal of Operations Management,
Vol.26 pp. 557 – 570.
Kuei, C. H., Madu, C.N and Lin, C (2001) “The relationship between supply chain
management quality practices and organisational performance”, International Journal
of Quality and Reliability Management, Vol. 18 Iss. 8 pp. 864 – 872.
Lacoste, S and Johnsen, R.E (2015) “Supplier customer relationships: A case study of
power dynamics”, Journal of Purchasing and Supply Management, Vol.21 pp. 229 –
240.

254 | P a g e
Lahiri, S (2016) “Does Outsourcing Really Improve Firm Performance? Empirical
Evidence and Research Agenda”, International Journal of Management Reviews, Vol.
18, pp. 464–497.
Laihonen, H and Pekkola, S (2016) “Impacts of using a performance measurement
system in supply chain management: a case study”, International Journal of Production
Research, Vol. 54 No. 18, pp. 5607-5617.
Lambert, D.M and Cooper, M.C (2000) “Issues in Supply Chain Management”,
Industrial Marketing Management Vol. 29, pp. 65–83.
Lambert, D.M and Enz, M.G (2017) “Issues in Supply Chain Management: Progress
and potential”, Industrial Marketing Management (2016) Article in press.
Lambert, D.M and Schwieterman, M.A (2012) “Supplier relationship management as
a macro business process”, Supply Chain Management: An International Journal, Vol.
17 No.3 pp. 337 – 352.
Lee, C. J and Johnsen, R.E (2012) “Asymmetric customer–supplier relationship
development in Taiwanese electronics firms”, Industrial Marketing Management, Vol.
41 pp. 692–705.
Lee, H., Padmanabhan, V and Whang, S (2004) “Comments on Information distortion
in a supply chain the bullwhip effect”, Management Science, Vol. 50 No. 12 pp. 1887-
1893.
Lettice, F.A., Wyatt, C and Evans, S (2010) “Buyer–supplier partnerships during
product design and development in the global automotive sector: Who invests, in what
and when?” Int. J. Production Economics, Vol. 127 pp. 309–319.
Levitt, B and March, J.G (1988) “Organisational Learning”, Annual Review of
Sociology, Vol. 14 pp. 319 – 388.
Lindahl, M and Rehn, A (2007) “Towards a theory of project failure”, International
Journal Management Concepts and Philosophy, Vol. 2 No. 3 pp. 246 – 254.
Liu, H., Howley, E and Duggan, J (2012) “Co-evolutionary analysis: a policy
exploration method for system dynamics models”, System Dynamics Review, Vol. 28
No. 4 pp. 361–369.
Liu, H., Howley, E and Duggan, J (2012) “Observations on the shortest independent
loop set algorithm”, System Dynamics Review, Vol. 28 No 3 pp. 276–280.
Liu, Yi, Huang, Y., Luo, Y and Zhao, Y (2012) “How does justice matter in achieving
buyer–supplier relationship performance?” Journal of Operations Management, Vol.
30 pp. 355–367.

255 | P a g e
Lockamy, A and Spenser, M.S (2011) “Performance measurement in a theory of
constraint environment”, International Journal of Production Research, Vol. 36 Issue.
8 pp. 2045 – 2060.
Love, P.E.D., Holt, G.D., Shen, L.Y., Li, H Irani, Z (2002) “Using systems dynamics
to better understand change and rework in construction project management systems”,
International Journal of Project Management, Vol. 20 pp. 425–436.
Lyneis, J.M and Ford, D.N (2007) “System dynamics applied to project management:
a survey, assessment and directions for future research”, System Dynamics Review Vol.
23 No. 2/3 pp.157 – 189.
Lyneis, J.M., Cooper, K.G and Els, S.A (2001) “Strategic management of complex
projects: a case study using system dynamics”, System Dynamics Review Vol. 17 No. 3
pp. 237 – 260.
Magnini, V.P., Ford, J.B., Markowski, E.P and Honeycutt E.D.Jr, (2007),"The service
recovery paradox: justifiable theory or smoldering myth?", Journal of Services
Marketing, Vol. 21 Iss 3 pp. 213 – 225.
Makkonen, H., Vuori, M and Puranen, M (2015) “Buyer attractiveness as a catalyst for
buyer–supplier relationship development”, Industrial Marketing Management (Article
in press).
Mandal, S (2011) “Supply chain risk identification and elimination: a theoretical
perspective”, The IUP Journal of Supply Management, Vol. 8 No. 1 pp. 68 – 86.
Manuj, I and Mentzer, J.T (2008) “Global supply chain risk management”, Journal of
Business Logistics, Vol.29 No. 1 pp. 133 – 155.
Marksberry, P (2012) “Investigating “The Way” for Toyota suppliers: A quantitative
outlook on Toyota’s replicating efforts for supplier development”, Benchmarking: An
International Journal, Vol. 19 Iss 2 pp. 277 – 298.
Marley, K.A., Ward, P.T and Hill, J.A (2014) “Mitigating supply chain disruptions –
a normal accident perspective”, Supply Chain Management: An International Journal,
Vol. 19 Iss 2 pp. 142 – 152.
Mason, M (2010) “Sample Size and Saturation in PhD Studies Using Qualitative
Interviews”, Forum Qualitative Sozialforschung / Forum: Qualitative Social Research,
Volume 11, No. 3, Art. 8 pp. 1 – 19.
Matook, S., Lasch, R and Tamaschke (2009) “Supplier development with
benchmarking as part of a comprehensive supplier risk management framework”,
International Journal of Operations and Production Management, Vol. 29 Iss 3 pp. 241
– 267.
256 | P a g e
Mats Engwall, M and Jerbrant, A (2003) “The resource allocation syndrome: the prime
challenge of multi-project management?” International Journal of Project
Management, Vol. 21 pp. 403–409.
Mentzer, J.T, DeWitt, W., Keebler, J.S., Min, S., Nix, N.W., Smith, C.D and Zacharia,
Z.G (2001) “Defining Supply Chain Management”, Journal of Business Logistics,
Vol.22, No. 2, pp. 1 – 25.
McAdam, R., Hazlett, S.A & Gillespie, K.A (2008) “Developing a conceptual model
of lead performance measurement and benchmarking”, International Journal of
Operations & Production Management, Vol. 28 No. 12 pp. 1153 – 1185.
MacCarthy, B., Kauppi, K and Cox, K (2014) “The Dynamics of Supply Chain
Failure”, 21st International Annual EurOMA Conference, Palermo, Italy, 20-25 June
2014, "Operations Management in an Innovation Economy".
McCollough, M.A and S.G Bharadwaj (1992), “The Recovery Paradox: An
Examination of Consumer Satisfaction in Relation to Disconfirmation, Service
Quality and Attribution Based Theory,” American Marketing Association, Vol. 119.
McCutcheon, D.M and Meredith, J.R (1993) “Conducting case study research in
operations management”, Journal of Operations Management, Vol. 11 pp. 239 – 256.
Meehan, J and Wright, G.H (2011) “Power priorities: A buyer–seller comparison of
areas of influence”, Journal of Purchasing and Supply Management, Vol. 17 pp. 32–
41.
Meng, X (2012) “The effect of relationship management on project performance in
construction”, International Journal of Project Management, Vol. 30 pp. 188–198.
Meredith, J (1998) “Building operations management theory through case and field
research”, Journal of Operations Management, Vol. 16 pp. 441–454.
Merschmann, U and Thonemann, U.W (2011) “Supply chain flexibility, uncertainty
and firm performance: An empirical analysis of German manufacturing firms”
International Journal of Production Economics, Vol. 130 pp. 43 – 53.
Metcalf, L.E., Frear, C.R and Krishnan, R (1990) “Buyer seller relationships: an
application of the IMP model”, European Journal of Marketing, Vol. 26 No.2 pp. 27-
46.
Michel, S and Meuter, M.L (2008) “The service recovery paradox: true but overrated?”,
International Journal of Service Industry Management, Vol. 19 Iss. 4 pp. 441 – 457.
Michel, S., Bowen, D and Johnston, R (2009) “Why service recovery fails: Tensions
among customer, employee, and process perspectives”, Journal of Service
Management, Vol. 20 No.3 pp. 253-273.

257 | P a g e
Micheli, G.J.L., Mogre, R and Perego, A (2014) “How to choose mitigation measures
for supply chain risks”, International Journal of Production Research, Vol. 52 No. 1
pp. 117 – 129.
Miles, M.B and Huberman, A. M (1994) “Qualitative Data Analysis: A Sourcebook of
New Methods”, Educational Evaluation and Policy Analysis, Vol. 8, No. 3 pp. 329-
331.
Miller, J.L., Craighead, C.W and Karwan, K.R (2000) “Service recovery: a framework
an empirical investigation”, Journal of Operations Management, Vol. 18 No. 4, pp. 387-
400.
Mishra, M., Sharma, R.R.K., Kumar, S and Dubey, R (2016) “Bridging and buffering:
Strategies for mitigating supply risk and improving supply chain performance”,
International Journal of Production Economics, Vol. 180 pp. 183–197.
Mishra, R.K (2011) “Buyer – supplier relationships SMEs”, The IUP Journal of Supply
Chain Management, Vol. 8 No.3 pp. 27 – 41.
Møller, M.M., Johansen, J and Boer, H (2003) “Managing buyer – supplier
relationships and inter – organisational competence development”, Integrated
Manufacturing Systems, Vol. 14 Iss. 4 pp. 369 – 379.
Moll, R (2003) “Ford Motor Company and the Firestone tyre recall”, Journal of
Public Affairs, Vol. 3, No. 3 pp. 200 – 212.
Morecroft, J (2009) “Strategic Modelling and Business Dynamics”, John Wiley and
Sons, Ltd.
Morrice, D.J., Cronin, P., Tanrisever, F and Butler, J.C (2016) “Supporting hurricane
inventory management decisions with consumer demand estimates”, Journal of
Operations Management Vol. 45 pp. 86 – 100.
Morrison, B (2015) “The problem with workarounds is that they work: The persistence
of resource shortages”, Journal of Operations Management, No. 39-40 pp. 79 – 91.
Mortensen, S (2007) “A supplier development programme: the SME experience”,
Journal of Small Business and Enterprise Development, Vol. 14 Iss. 1 pp. 93 – 104.
Mortensen, M and Arlbjørn, J (2012) “Inter – organisational supplier development: the
case of customer attractiveness and strategic fit”, Supply Chain Management: An
International Journal, Vol. 17 Iss 2 pp. 152 – 171.
Nair, A., Narasimhan, R and Bendoly, E (2011) “Coopetitive Buyer–Supplier
Relationship: An Investigation of Bargaining Power, Relational Context, and
Investment Strategies”, Decision Sciences Vol. 42 No. 1 pp. 93 – 127.
Narasimhan, R., Nair, A., Griffiths, A., Arlbjørn, J.S and Bendoly, E (2009) “Lock-in
situations in supply chains: A social exchange theoretic study of sourcing

258 | P a g e
arrangements in buyer–supplier relationships”, Journal of Operations Management,
Vol. 27, Issue. 5, pp. 374–389.
Narasimhan, R and Jayaram, J (1998) “Causal Linkages in Supply Chain Management:
An Exploratory Study of North American Manufacturing Firms”, Decision Sciences,
Volume 29 No.3 pp. 579 – 605.
Narasimhan, R and Schoenherr, T (2012) “The effects of integrated supply management
practices and environmental practices on relative competitive quality advantage”,
International Journal of Production Research, Vol. 50 No 4 pp. 1185 – 1201.
Natarajarathinam, M., Capar, I and Narayanan, A (2009) “Managing supply chains in
times of crisis: a review of literature and insights”, International Journal of Physical
Distribution and Logistics Management, Vol. 39 No. 7, pp. 535–573.
National Transportation Safety Board (2014) “Auxiliary Power Unit Battery Fire, Japan
Airlines Boeing 787-8”, JA829J, Boston, Massachusetts, January 7, 2013. NTSB/AIR-
14/01. Washington, DC.
Nagati, H and Robelledo, C (2013) “Learning from suppliers in the aerospace industry”,
Int. J. Production Economics, Vol. 129 pp. 328–337.
Negati, H and Robelledo, C (2013) “Supplier development efforts: The suppliers' point
of view” Industrial Marketing Management, Vol. 42 pp. 180 – 188.
Normann, A and Jansson, U (2004) “Ericsson’s proactive supply chain risk
management approach after a serious sub-supplier accident”, International Journal of
Physical Distribution & Logistics Management, Vol. 34 No. 5 pp. 434-456.
Nyaga, G. N., Lynch, D.F., Marshall, D and Ambrose, E (2013) “Power asymmetry,
adaption and collaboration in dyadic relationships involving a powerful partner”,
Journal of Supply Chain Management, Vol. 49 No. 3 pp. 42 – 63.
O’Reilly, M and Parker, N (2012) “Unsatisfactory Saturation: a critical exploration of
the notion of saturated sample sizes in qualitative research”, Qualitative Research, pp.
1 – 8.
Pazirandeh, A and Norrman, A (2014) “An interrelation model of power and purchasing
strategies: A study of vaccine purchase for developing countries”, Journal of
Purchasing and Supply Management, Vol.20 pp. 41–53.
Pereira, C.R., Christopher, M and Da Silva, A.L (2014) "Achieving supply chain
resilience: the role of procurement", Supply Chain Management: An International
Journal, Vol. 19 Iss 5/6 pp. 626 – 642.
Perry, C., Alizadeh, Y. and Riege, A (1997) “Qualitative methods in entrepreneurship
research”. Proceedings of the Annual Conference of the Small Enterprise Association
Australia and New Zealand, Coffs Harbour, 21-23 September, pp. 547-567.

259 | P a g e
Piekkari, A., Plakoyiannaki, E and Welch, C (2010) “‘Good’ case research in industrial
marketing: Insights from research practice”, Industrial Marketing Management, Vol.
39 pp. 109–117.
Piercy, N.F (2009) “Strategic relationships between boundary-spanning functions:
Aligning customer relationship management with supplier relationship management”,
Industrial Marketing Management, Vol. 38 pp. 857–864.
Pongatichat, P and Johnston, R (2008) “Exploring strategy-misaligned performance
measurement” International Journal of Productivity and Performance Management,
Vol. 47 No.3 pp. 207 – 222.
Power, D and Terziovski, M (2007) “Quality audit roles and skills: Perceptions of non-
financial auditors and their clients”, Journal of Operations Management, Vol. 25 pp.
126–147.
Prahalad, C.K (1993) “The role of core competencies in the corporation”, Research
Technology Management, Vol. 36 No.6 pp. 40 – 47.
Pratt, M.G (2009) “For the lack of a boilerplate: Tips on writing up (and reviewing)
qualitative research”, Academy of Management Journal 2009, Vol. 52, No. 5 pp. 856–
862.
Premanandh, J (2013) “Horse meat scandal: A wake-up call for regulatory authorities”,
Food Control, Vol. 34 pp. 568 – 569.
Pressey, A.D and Qiu, X.X (2007),"Buyer-supplier relationship dissolution: the
Chinese context", Journal of Business and Industrial Marketing, Vol. 22 Iss 2 pp. 107
– 117.
Prosman, E.J., Scholten, K and Power, D (2016) “Dealing with defaulting suppliers
using behavioral based governance methods: an agency theory perspective”, Supply
Chain Management: An International Journal, Vol 21 No. 4 pp. 499–511.
Pulles, N.J Veldman, J and Schiele, H (2016) “Winning the competition for supplier
resources: The role of preferential resource allocation from suppliers”, International
Journal of Operations and Production Management, Vol. 36 No. 11 pp. 1458 – 1481.
Quang, H.T., Sampaio, P., Carvalho, M.S., Fernandes, A.C., Thi Binh, D and Vilhenac,
A.E (2016) “An extensive structural model of supply chain quality management and
firm performance”, International Journal of Quality and Reliability Management, Vol.
33 No. 4 pp. 444 – 464.
Rahmandad, H., Repenning, N and Sterman, J (2009) “Effects of feedback delay on
learning”, Systems Dynamic Review Vol. 25 pp. 309-338.
Ramudhin, A., Alzaman, C and Bulgak, A.A (2008) “Incorporating the cost of quality
in supply chain design”, Journal of Quality in Maintenance Engineering, Vol.14 pp. 71
– 86.
260 | P a g e
Ravenswood, K (2011) “Eisenhardt's impact on theory in case study research”, Journal
of Business Research, Vol. 64 pp. 680–686.
Raz, T, Michael, E (2001) “Use and benefits of tools for project risk management”,
International Journal of Project Management, Vol. 19 pp. 9 – 17.
Rebolledo, C and Nollet, J (2011) “Learning from suppliers in aerospace industry”,
International Journal of Production Economics, Vol. 129 pp. 328 – 337.
Repenning, N.P and Sterman, J.D (2001) “Nobody Ever Gets Credit for Fixing
Problems that Never Happened”, California Management Review, Vol. 43 No. 4 pp. 64
– 88.
Richter, K and Walther, J (2017) “Supply Chain Integration Challenges in Commercial
Aerospace: A comprehensive perspective on the Aviation Value Chain”, Springer.
Ritchie, B and Brindley, C (2000) Disintermediation, disintegration and risk in SME
global supply chain”, Management Decision, Vol. 38 Iss 8 pp. 575 – 583.
Roberts, J.M (2014) “Critical Realism, Dialectics, and Qualitative Research Methods”,
Journal for the Theory of Social Behaviour, Vol. 44 No.1 pp. 1 – 44.
Robinson, C.J and Molhotra, M.K (2005) “Defining the concept of supply chain quality
management and its relevance to academic and industrial practice”, International
Journal of production economics, Vol. 2005 pp. 315 – 337.
Rodrigues, A. and Bowers, J (1996) “System dynamics in project management: a
comparative analysis with traditional methods”, System Dynamics Review Vol. 12 No.
2 pp. 131 – 140.
Roh, J.J., Hong, P and Park, Y (2008) “Organisational culture and supply chain
strategy: a framework for effective information flows”, Journal of Enterprise
Information Management, Vol. 4 pp. 361 – 376.
Rossetti, M.D and Unlu, Y (2011) “Evaluating the robustness of lead time demand
models”, International Journal of Production Economics, Vol. 134 pp. 159–176.
Rotaru, K., Churilov, L and Flitman, A (2014) “Can critical realism enable a journey
from description to understanding in operations and supply chain management?",
Supply Chain Management: An International Journal, Vol. 19 Iss 2 pp. 117 – 125.
Routroy, S and Kumar Pradhan, S (2013),"Evaluating the critical success factors of
supplier development: a case study", Benchmarking: An International Journal, Vol. 20
No. 3 pp. 322 – 341.
Rowley, R and Slack, F (2004),"Conducting a literature review", Management
Research News, Vol. 27 Iss 6 pp. 31 -39.

261 | P a g e
Sage, D., Dainty, A and Brookes, N (2014) “A critical argument in favour of theoretical
pluralism: Project failure and the many and varied limitations of project management”,
International Journal of Project Management, Vol. 32 pp. 544–555.
Salama, K, F., Luzzatto, D., Sianesi, A and Towill, D.R (2009) “The value of auditing
supply chains”, Int. J. Production Economics, Vol. 119 pp. 34–45.
Sancha, C., Longoni, A and Gimenénez, C (2015) “Sustainable supplier development
practices: Drivers and enablers in a global context” Journal of Purchasing & Supply
Management, Vol. 21 pp. 95–102.
Sánchez-Rodríguez, C., Hemsworth, D and Martínez – Lorente, Á.R (2005) “The effect
of supplier development initiatives on purchasing performance: a structural model”,
Supply Chain Management: An International Journal, Vol. 10 Iss 4 pp. 289 – 301.
Sanderson, J (2012) “Risk, uncertainty and governance in megaprojects: A critical
discussion of alternative explanations”, International Journal of Project Management,
Vol. 30 pp. 432–443.
Schaltegger, S and Burritt, R (2014) “Measuring and managing sustainability
performance of supply chains” Supply Chain Management: An International Journal,
Vol. 19 No.3 pp. 232 – 241.
Seuring, S.A (2008) “Assessing the rigour of case study research in supply chain
management”, Supply Chain Management: An International Journal, Vol. 13 No. 2
pp128 – 137.
Sharma, S.K.R and Bhat, A (2014) “Supply Chain Risk Assessment Tools and
Techniques in the Automobile Industry: A Survey”, The IUP Journal of Supply Chain
Management, Vol. 11, No. 1.
Sheffi, Y and Rice, J.B (2005) “A supply chain view of the resilient enterprise”, MIT
Sloan Management Review, Vol. 47 No. 1 pp. 41 – 49.
Singh, P.J and Power, D (2009) “The nature and effectiveness of collaboration between
firms, their customers and suppliers: a supply chain perspective”, Supply Chain
Management: An International Journal, Vol. 14 No.3 pp. 189 – 200.
Singh, S.D (2015) “Creating Your Own Qualitative Research Approach: Selecting,
Integrating and Operationalizing Philosophy, Methodology and Methods”, SAGE
Publications, Vol.19 No.2 pp. 132–146.
Snyder, C.A and Cox, J.F (1985) “A Dynamic Systems Development Life - Cycle
Approach: A Project Management Information System”, Journal of Management
Information System, Vol. 2 No. 1 pp. 61 – 76.
Soltani, E., Azadegan, A., Liao, Y.Y and Phillips, P (2011) “Quality performance in a
global supply chain: finding out the weak link”, International Journal of Production
Research Vol. 49 No. 1 pp. 269–293.

262 | P a g e
Sousa, R and Voss, C.S (2009) “The effects of service failures and recovery on
customer loyalty in e-services: An empirical investigation”, International Journal of
Operations and Production Management, Vol. 29 No. 8 pp. 834-86.
Stall-Meadows, C and Hyle, A (2010) “Procedural methodology for a grounded meta-
analysis of qualitative case studies”, International Journal of Consumer Studies, Vol.
34 pp. 412–418.
Sterman, J.D (2000) “Business Dynamics Systems Thinking and Modelling for a
Complex World”, Irwin McGraw-hill.
Sterman, J.D (2001) “System Dynamics Modelling: Tools for Learning in a Complex
World”, California Management Review, Vol. 43 No. 4 pp. 8 – 25.
Sterman, J.D (2005) “Operational and Behavioral Causes of Supply Chain Instability”,
Forthcoming in The Bullwhip Effect in Supply Chains. O. Carranza and F. Villegas,
(eds.) Palgrave McMillan.
Sterman, J.D and Dogan, G (2015) “I’m not hoarding, I’m just stocking up before the
hoarders get here” Behavioral causes of phantom ordering in supply chains”, Journal
of Operations Management (Article in press).
Steven, A. B., Dong, Y and Corsi, T (2014) “Global sourcing and quality recall: An
empirical study outsourcing – supplier concentration – product recalls linkages”,
Journal of Operations Management, Vol. 32 pp. 241 – 253.
Stuart, I., McCutcheon, D., Handfield, R., McLachlin, R. and Samson, D (2002)
“Effective case research in operations management: a process perspective”, Journal of
Operations Management, Vol. 20 pp. 419–433.
Sutterfield, S.J., Friday – Stroud, .S.S and Shivers – Blackwell, S.L (2006) “A case
study of project and stakeholder management failures: lessons learnt”, Project
Management Institute, Vol. 37 No. 5 pp. 26-35.
Swink, M and Zsidisin, G (2006) “On the benefits and risks of focused commitment to
suppliers”, International Journal of Production Research, Vol. 44 No. 20 pp. 4223 –
4240.
Tan, C.K., Kannan, V R and Handfield, R.B (1998) “Supply chain management:
Supplier performance and firm performance”, International Journal of Purchasing and
Materials Management, Vol.34 No.3 pp.2-9.
Tang, C and Tomlin, B (2008) “The power of flexibility for mitigating supply chain
risks”, International Journal Production Economics, Vol. 116 pp. 12–27.
Tang, C.S (2006) “Perspectives in supply chain risk management”, International
Journal of Production Economics”, Vol. 103 No.2 pp. 451-488.

263 | P a g e
Tax, S.S., Brown, S.W and Chandrashekaran, M (1998) “Customer Evaluations of
Service Complaint Experiences: Implications for Relationship Marketing”, Journal of
Marketing, Vol. 62 No. 2 pp. 60-76.
Teece, D.J (2007) “Explicating Dynamic Capabilities: The Nature and
Microfoundations of (Sustained) Enterprise Performance”, Strategic. Management
Journal Vol. 28 pp. 1319–1350.
Teller, C., Kotzab, H., Grant, D.B and Holweg, C (2016) “The importance of key
supplier relationship management in supply chains”, International Journal of Retail &
Distribution Management, Vol. 44 No. 2 pp. 109 – 123.
Teller, J., Kock, A and Gemünden, H.J (2014) “Risk Management in Project Portfolios
Is More Than Managing Project Risks: A Contingency Perspective on Risk
Management”, Project Management Journal, Vol. 45, No. 4, pp. 67–80.
Tenhiälä, A (2011) “Contingency theory of capacity planning: The link between
process types and planning methods”, Journal of Operations Management, Vol. 29
pp.65–77.
Terpend, R and Ashenbaum, B (2012) “The intersection of power, trust and supplier
network size: implications for supplier performance”, Journal of Supply Chain
Management, Vol. 48 No. 3 pp. 52 – 77.
Thomson, R and McLeod, J (2015) “New frontiers in qualitative longitudinal research:
an agenda for research”, International Journal of Social Research Methodology, Vol.
18 No.3 pp. 243-250.
Thorpe, R and Beasley, T (2004) “The characteristics of performance management
research: implications and challenges”, International Journal of Productivity and
Performance Management, Vol. 53 Iss. 4 pp. 334 – 344.
Tse, Y and Tan, K.H (2012) “Managing product quality risk and visibility in multi-
layer supply chain”, Int. J. Production Economics, Vol. 139 pp. 49–57.
Turner, R and Muller, R (2003) “On the nature of the project as a temporary
organization”, International Journal of Project Management, Vol. 21 pp. 1–8.
Turner, R and Zolin, R (2012) “Forecasting Success on Large Projects: Developing
Reliable Scales to Predict Multiple Perspectives by Multiple Stakeholders Over
Multiple Time Frames”, Project Management Journal, Vol. 43, No. 5, pp. 87–99.
Vaaland, T.I and Håkansson, H (2003) “Exploring interorganisational conflict in
complex projects”, Industrial Marketing Management, Vol. 32 pp. 127 – 138.
Van Der Merwe, A.P (1997) “Multi-project management - organizational structure”,
International Journal of Project Management Vol. 15 No. 4 pp. 223-233.
Vedel, M and Ellegaard, C (2013) "Supply risk management functions of sourcing
intermediaries: an investigation of the clothing industry", Supply Chain Management:
An International Journal, Vol. 18 Iss 5 pp. 509 – 522.

264 | P a g e
Villena, V.H., Veronica H. Revilla, E and Choi, T.Y (2011) “The dark side of buyer–supplier relationships: A social capital perspective”, Journal of Operations
Management, Vol. 29 pp. 561–576.
Jain, V., Kumar, S, Kundu, A and Chandra, C (2016) “Linking procurement operations
to power-influence in a supply chain”, Journal of Manufacturing Systems Vol. 41 pp.
201–210.
Voss, C., Tsikriktsis, N and Frohlich, M (2002) “Case research in operations
management”, International Journal of Operations and Production Management, Vol.
22 Iss 2 pp. 195 – 219.
Wacker, J.E (1998) “A definition of theory: research guidelines for different theory-
building research methods in operations management”, Journal of Operations
Management, Vol. 16 pp. 361–385.
Wadhwaa, S., Madhawan, M., Chan, F.T.S and Ducq, Y (2010) “Effects of information
transparency and cooperation on supply chain performance: a simulation study”,
International Journal of Production Research, Vol. 48 No.1 pp. 145 – 166.
Wagner, S.M (2006) “Supplier development practices: an exploratory study”,
European Journal of Marketing, Vol. 40 No. 5/6 pp. 554 – 571.
Wagner, S.M (2010) “Indirect and Direct Supplier Development: Performance
Implications of Individual and Combined Effects”, IEEE Transactions on Engineering
Management, Vol. 57, No. 4 pp. 536 – 546.
Wagner, S.M (2011) “Supplier development and the relationship life-cycle”
International Journal of Production Economics, Vol. 129 pp. 277 – 283.
Wagner, S.M and Friedl, G (2007) “Supplier Switching Decisions”, European Journal
of Operational Research, Vol. 183 pp. 700 – 717.
Wagner, S.M and Krause, D.R (2009) Supplier development: communication
approaches, activities and goals”, International Journal of Production Research,
Vol.47 No.12 pp. 3161-3177.
Wallace, S.W and Tsan-MingChoi (2011) “Flexibility, information structure, options,
and market power in robust supply chains”, International Journal of Production
Economics, Vol. 134 pp. 284–288.
Wang, L., Kunc, M and Bai, B.J (2017) “Realizing value from project implementation
under uncertainty: An exploratory study using system dynamics”, International Journal
of Project Management Vol. 35 pp. 341–352.
Watts, C. A and Hahn, C.K (1993) “Supplier Development Programs – An empirical
Analysis”, Journal of Supply Chain Management, Vol. 29, Issue. 1 pp.10–17

265 | P a g e
Webster, J and Watson, R.T (2002) “Analyzing the past to prepare for the future:
Writing a literature review”, Science Quarterly Vol. 26 No. 2, pp. 13 – 23.
Wee, H.M and Wu, S (2009) “Lean supply chain and its effects on product cost and
quality: a case study on Ford Motor Company”, Supply Chain Management: An
International Journal, Vol. 14 Iss 5, pp. 335 – 341.
Wen – Ho, J and Fang, C.C (2013) “Production capacity planning for multiple products
under uncertain demand conditions”, International Journal of Production Economics,
Vol. 141 pp. 593–604.
Wen – Li, L., Humphreys, P., Chen, L.Y and Kumaraswamy, M (2003) “Predicting
purchasing performance: the role of supplier development programs” Journal of
Materials Processing Technology, Vol. 138 pp. 243–249.
Wilding, R and Humpries, A.S (2006) “Understanding collaborative supply chain
relationships through the application of the Williamson organisational failure
framework”, International Journal of Physical Distribution and Logistics
Management, Vol. 36 No. 4 pp. 309 – 329.
Williams, B. D., Roh, J., Tokar, T and Swink, M (2013) “Leveraging supply chain
visibility for responsiveness: The moderating role of internal integration”, Journal of
Operations Management, Vol. 31 pp. 543–554.
Williams, Z and Moore, R (2007) “Supply chain relationships and information
capabilities. The creation and use of information power”, International Journal of
Physical Distribution and Logistics Management, Vol. 37 No. 6 pp. 469 – 483.
Wu, D.D and Olson, D (2010) “A review of enterprise risk management in the supply
chain” Kybernetes, Vol. 39 No. 5 pp. 694-706.
Wu, D.D and Olson, D (2010) “Enterprise risk management: a DEA VaR approach in
vendor selection”, International Journal of Production Research, Vol. 48 No. 16 pp.
4919-4932.
Xie, W., Jiang, Z., Zhao, J and Hong, J (2014) “Capacity planning and allocation with
multi-channel distribution”, International Journal of Production Economics, Vol. 147
pp. 108–116.
Yang, C.C and Yeh, C.H (2014) “Application of System Dynamics in Environmental
Risk Management of Project Management for External Stakeholders”, Syst Pract
Action Res, Vol. 27 pp. 211–225.
Yates, K (2006) "Internal Communication Results Enhances Bottom Line Results”,
Journal of Organisational Excellence, Vol. 25, Issue 3 pp. 71–79.
Yeo, K.T (2002) “Critical failure factors in information system projects”, International
Journal of Project Management, Vol. 20 pp. 241–246.

266 | P a g e
Yeung, A.C.L (2008) “Strategic supply management, quality initiatives, and
organisational performance”, Journal of Operations Management, Vol. 26 pp. 490 –
502.
Yim, A (2014) “Failure Risk and Quality Cost Management in Single versus Multiple
Sourcing Decision”, Decision Sciences Vol. 45 No. 2 pp. 341 – 354.
Yin, R.K (2009) “Case Study Research Design and Methods”, Sage.
Zhang, C., Henke, J.W.Jr and Griffith, D.A (2009) “Do buyer cooperative actions
matter under relational stress? Evidence from Japanese and U.S. assemblers in the U.S.
automotive industry”, Journal of Operations Management Vol.27 pp. 479–494.
Zhang, D., Linderman, K and Schroeder, R.G (2012) “The moderating role of
contextual factors on quality management practices”, Journal of Operations
Management, Vol. 30 pp. 12 – 23.
Zhao, X., Huo, B., Flynn, B.B., Hoi, J and Yeung, Y (2008) “The impact of power and
relationship commitment on the integration between manufacturers and customers in a
supply chain”, Journal of Operations Management, Vol. 26 pp. 368–388.
Zou, W., Kumaraswamy, M., Chung, J and Wong, J (2014) “Identifying the critical
success factors for relationship management in PPP projects”, International Journal of
Project Management, Vol. 32 pp. 265–274.
Zsidisin, G. A and Smith, M.E (2005) “Managing supply risk with early supplier
involvement: a case study and research proposition”, The Journal of Supply Chain
Management, A Global Review of Purchasing and Supply, Vol. 41, Issue 4 pp. 44–57.
Zsidisin, G.A (2003) “A grounded definition of supply risk”, Journal of Purchasing &
Supply Management, Vol. 9 pp. 217 – 224.
Zsidisin, G.A and Wagner, S.M (2010) “Do perceptions become reality? The
moderating role of supply chain resiliency on disruption occurrence”, Journal of
Business Logistics, Vol. 31, No. 2 pp. 1 – 20.
Zsidisin, G.A., Ellram, L.M., Carter, J.R and Cavinato, J.L (2004) "An analysis of
supply risk assessment techniques", International Journal of Physical Distribution &
Logistics Management, Vol. 34 Iss 5 pp. 397 – 413.
Zsidisin, G.A., Panelli, A and Upton, R (2000) “Purchasing organisation involvement
in risk assessments, contingency plans, and risk management: an exploratory study”,
Supply Chain Management: An International Journal, Vol. 5 No. 4 pp. 187-197.
Zu, X., Fredendall, L.D and Douglas, T.J (2008) “The evolving theory of quality
management: The role of six sigma”, Journal of Operations Management, Vol. 26 pp.
630 – 650.

267 | P a g e
Zu, X and Kaynak, H (2012) “An agency theory perspective on supply chain quality
management”, International Journal of Operations & Production Management, Vol.
32 Iss. 4 pp423 – 446.
Zwikael, O and Smyrk, J (2015) “Project governance: Balancing control and trust in
dealing with risk”, International Journal of Project Management, Vol. 33 pp. 852–862.

268 | P a g e
Appendix 1 – Draft Pilot Case Study Protocols 1.1 Overview of Pilot case study project.
This pilot case study is being conducted in order to investigate, analyse and evaluate
the phenomena of persistent supply chain failure. In persistent supply chain failure a
chosen sub-tier supplier consistently fails to provide the level of quality and delivery
performance originally expected or specified within an agreed contract. The work is a
major element of a PhD research project at the University of Nottingham aimed at
analysing and defining the concept of persistent supply chain failure.
The key outcome of the research is to:
Define persistent long term failure.
Understand and document how organisations manage persistent long-term
failure.
Identify and document how organisations recover from persistent long term
failure.
The criteria for case study selection are explained below:
1. Poor performing suppliers to the prime.
2. Low tech suppliers (Example: Machining) to the prime.
3. High Tech suppliers (Electronics) to the prime.
1.2 Project Objectives, Purpose and Auspices.
The key objectives of this case study protocol document is to create a plan of action to
be used and followed when conducting research at the site of a chosen participant
supplier, and to ensure that the correct procedures are followed. This methodology is
required in order to ensure a systematic replicable study that can be repeated throughout
the project on all participating suppliers. It is also a key objective to keep the threat of
bias to a minimum and protect the rights of the participants asked to be involved in the
study. The aim of this pilot case study protocol document is to develop standardised
procedures to obtain information to support the research project on persistent supply
chain failure. Systematic processes and procedures will be created and tested during
this pilot study research and the findings and experiences will be utilised to develop the
most efficient protocols to use during the official case study research. The following
activities will drive the research process;

269 | P a g e
Interview questions. The questions will be drawn up to answer the research
questions. These questions will then be tested to see if they yield responses to
support the study. It will be here that the relevancy of the interview questions in
line with persistent supply chain failure will be validated.
Structure and format. The semi-structured interview sessions will be developed
and tested. The experiences and observations gained here will show whether the
structure adopted is flexible enough to deal with sudden changes in the itinerary
and behaviour of the employees being interviewed.
Data collection. The ability to obtain information from other sources within the
organisation will be tested and built into the protocols of the official case study
research. The ability to observe events going on in a real life environment and
ask relevant questions accordingly will help develop flexibility into the overall
plan
Develop field procedures. A process will be developed that is firstly, repeatable
and will be the format that is followed for every case study. This will include
developing an introduction letter explaining the purpose of the research and the
contribution that the organisation will make to research. A process for the
protection of interviewees will be developed and tested along with basic
procedures such as structure of interview process. This will include functional
employees to be interviewed, the time and location of interview, for how long,
process for reporting findings back to organisation to make them feel that they
have benefitted from the process.
The overall outcome of the pilot case study research project is to develop a set of
robust protocols to be used in the main multiple case study research. The experiences
gained at the chosen pilot case study organisation will enable a streamlining of the
process so that data can be collated and grouped in a systematic way. Data from all case
study suppliers will be sorted into groups and categorized into themes. When all of
themes are identified, they will be compared against the research questions to establish
whether any trends occur that highlight characteristics of performing suppliers versus
consistently failing suppliers. This will show what activities each supplier is engaged

270 | P a g e
in and should identify successful practices in comparison to problematic practices.
Therefore, the pilot case study will test the initial study design.
1.3 Field procedures.
In order to present credentials to case study participants (Organisations) a standard letter
template has created that details the following:
Introduction from the lead investigator and the institution they represent.
Outline who the letter is directed at within the organisation and detail their
importance within the process.
Provide brief information on the aims and objectives of the study.
Provide brief information on the questions that require answering.
Outline the potential benefits that the research investigation will bring.
Re-iterate the fact that successful co-operation will provide important and
critical research findings.
1.4 Justification of the selection of the pilot case study.
The pilot case study organisation has been chosen on the following basis;
Convenient location.
Direct supplier to the prime.
Direct supplier to other aerospace OEM’s.
Supplier with a long term contract with the prime.
History of poor performance.
Access to the pilot case study site has been gained through the use of networking
and prior knowledge of the organisation. Through the researcher’s previous experience
of working for the prime in Derby, a counterpart was contacted via email and asked
whether they would
1.5 Language pertaining to the protection of interviewees.
For interviewing key persons, you must cater for the interviewee’s schedule and
availability, not your own. The nature of the interview is much more open ended, and
an interviewee may not necessarily cooperate fully in sticking to your line of questions.
Similarly, in making observations of real life activities, you are intruding into the world
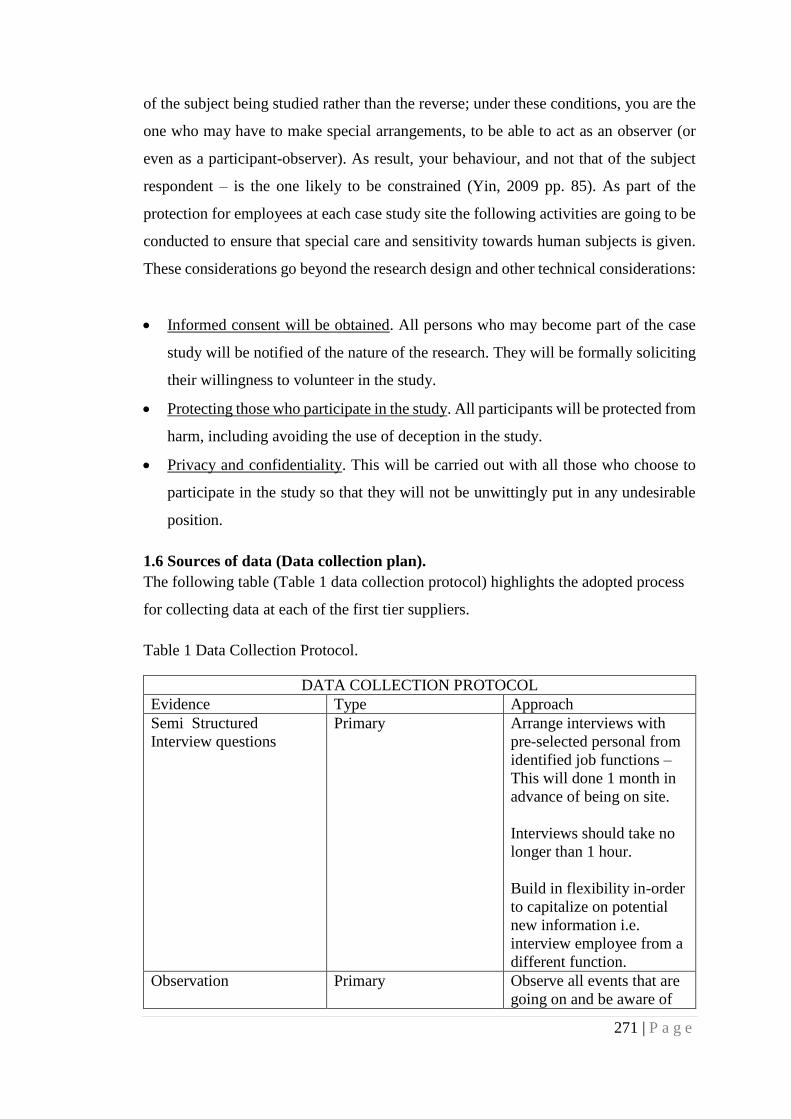
271 | P a g e
of the subject being studied rather than the reverse; under these conditions, you are the
one who may have to make special arrangements, to be able to act as an observer (or
even as a participant-observer). As result, your behaviour, and not that of the subject
respondent – is the one likely to be constrained (Yin, 2009 pp. 85). As part of the
protection for employees at each case study site the following activities are going to be
conducted to ensure that special care and sensitivity towards human subjects is given.
These considerations go beyond the research design and other technical considerations:
Informed consent will be obtained. All persons who may become part of the case
study will be notified of the nature of the research. They will be formally soliciting
their willingness to volunteer in the study.
Protecting those who participate in the study. All participants will be protected from
harm, including avoiding the use of deception in the study.
Privacy and confidentiality. This will be carried out with all those who choose to
participate in the study so that they will not be unwittingly put in any undesirable
position.
1.6 Sources of data (Data collection plan).
The following table (Table 1 data collection protocol) highlights the adopted process
for collecting data at each of the first tier suppliers.
Table 1 Data Collection Protocol.
DATA COLLECTION PROTOCOL
Evidence Type Approach
Semi Structured
Interview questions
Primary Arrange interviews with
pre-selected personal from
identified job functions –
This will done 1 month in
advance of being on site.
Interviews should take no
longer than 1 hour.
Build in flexibility in-order
to capitalize on potential
new information i.e.
interview employee from a
different function.
Observation Primary Observe all events that are
going on and be aware of

272 | P a g e
what employees are
actually trying to say.
Continually ask questions
that are pertinent to SCR
throughout the entire time I
am onsite.
Support documentation Secondary If it is ok to do so request
the following
documentation:
Sub-tier
performance
metrics.
Customer
performance
metrics.
Sub-tier sourcing
specifications i.e.
quality, delivery
and commercial
requirements.
Organisation
strategy, goals and
vision.
1.8 Pilot case study questions.
Formulation of the case study questions has been guided by Yin’s ‘levels of
questions’. The questions in the case study protocols are different depending on who
they are aimed at i.e.
Level 1: questions asked of specific interviewees.
Level 2: questions asked of individual case (these are the questions in the case
study protocol to be answered by the investigator during a single case, even when
the single case is part of a larger, multiple case study).
Level 3: questions asked of the pattern of findings across multiple cases.
(Yin, 2009 pp. 87)
The questions asked at all levels are designed to answers and further understand the
research questions formulated as a result of the systematic literature review study.
Research question one (RQ1): What is persistent supply chain failure and how can it
be understood?

273 | P a g e
Research question two (RQ2): What factors drive persistent supply chain failure and
what are the interrelationships between them?
Research question three (RQ3): What supply chain recovery strategies can be adopted
to help resolve different types of consistent failures effectively?

274 | P a g e
Appendix 2 – Level 1: questions asked of specific
interviewees
1. Performance Management Questions.
PARTICIPANT INFORMATION
Function: Operations / Engineering
Job Title Responsibilities Justification for
Interview
Operations Manager Accountable for
production, manufacturing
quality and delivery to
customer.
Can provide overall
picture of organisational
performance in line with
the future direction of the
organisation i.e. quality /
manufacturing
improvements and
efficiency programmes.
They should be aware of
best practice / standards
within industry and within
alternative industries.
Question
Number
Research
Question
Question Literature Interviewee Response
1 1 How is your organisation
measured by the Prime?
Performance
2 2 Do you review internal
capacity constraints vs.
the customer demand
profile when tendering
for business? If not why
not?
Performance
2.1 3 If not why not, how do
you know that you have
enough resources to meet
demand and quality
requirements
Performance
3 1 How often do you review
performance?
Performance
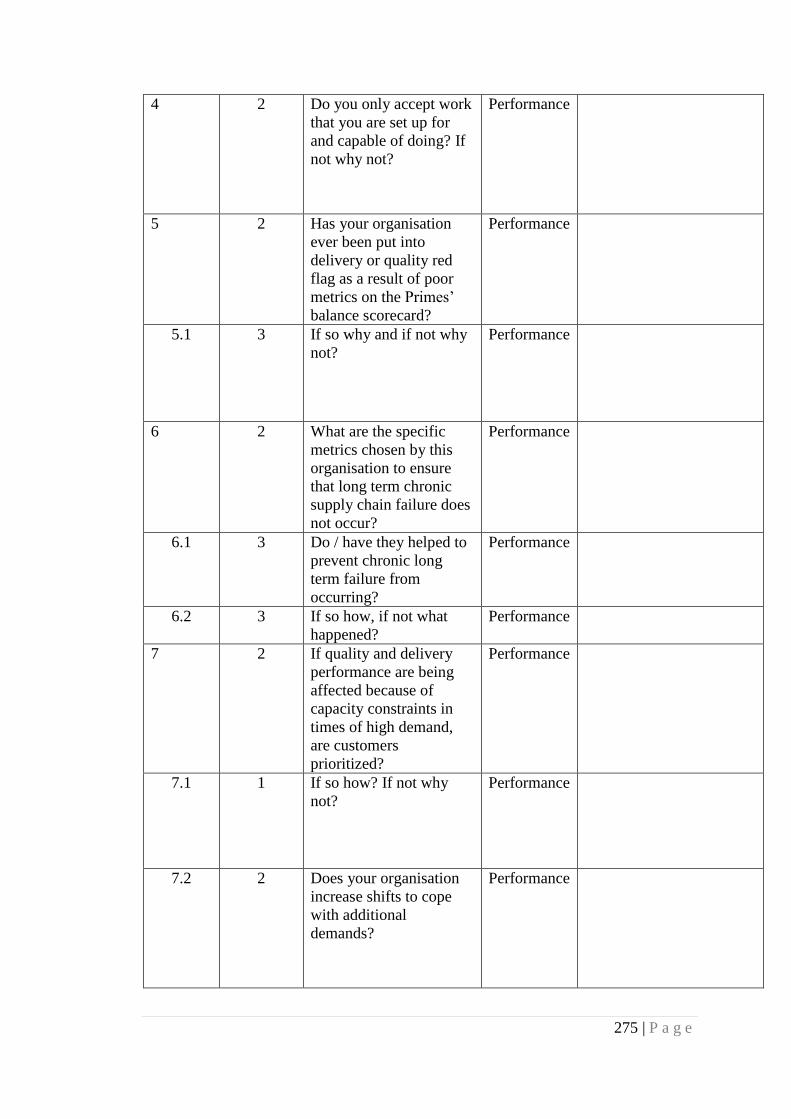
275 | P a g e
4 2 Do you only accept work
that you are set up for
and capable of doing? If
not why not?
Performance
5 2 Has your organisation
ever been put into
delivery or quality red
flag as a result of poor
metrics on the Primes’
balance scorecard?
Performance
5.1 3 If so why and if not why
not?
Performance
6 2 What are the specific
metrics chosen by this
organisation to ensure
that long term chronic
supply chain failure does
not occur?
Performance
6.1 3 Do / have they helped to
prevent chronic long
term failure from
occurring?
Performance
6.2 3 If so how, if not what
happened?
Performance
7 2 If quality and delivery
performance are being
affected because of
capacity constraints in
times of high demand,
are customers
prioritized?
Performance
7.1 1 If so how? If not why
not?
Performance
7.2 2 Does your organisation
increase shifts to cope
with additional
demands?
Performance

276 | P a g e
7.3 2 Do you get suppliers to
increase shifts to cope
with additional
demands?
Performance
7.4 2 Does your organisation
prioritise production runs
when capacity is
constrained? If not why
not?
Performance
8 3 Does your organisation
align its business goals
with the customer?
Performance
9 3 When a failure is
reported by a customer,
how quickly do you have
to respond to that failure
in-order to prevent it
from being classed as a
chronic long term
failure?
Performance
9.1 2 If it takes longer than a
week to react, why?
Performance
10 2 Do you have a planning
department? Is this
considered a key
organisational function?
If not why not?
Performance
11 3 What containment
measures do you put in
place to prevent the
failure from turning
chronic?
Performance

277 | P a g e
12 1 What is the most
common cause of
customer rejection /
failure with the Prime?
Performance
13 3 What measures could
take place to solve
problems earlier in the
event of chronic long-
term failure
Performance
14 3 In the event of chronic
long-term failure are
teams assembled and
empowered to resolve
the problem?
Performance
15 2 What are the key factors
that contribute to failure
through performance
management?
Performance
16 3 What initiatives (if any)
have been put in place to
improve performance
management?
Performance
16.1 2 Are they customer or
supplier led?
Performance
16.2 3 If so, how successful are
the initiatives, if not why
not?
Performance
2. Quality Management Questions
PARTICIPANT INFORMATION
Function: Quality Department

278 | P a g e
Job Title Responsibilities Justification for
Interview
Quality Manager Owner and gatekeeper of
organisations quality
process.
Should provide
perspective on current
sub-tier / market quality
capability in line with
company standards and
alternate industry
capabilities
Research
Question
Question Literature Interviewee Response
1 1 What would you describe
as a ‘quality’ failure?
Quality
2 2 What are the key factors
that contribute to quality
failure within the
organisation?
Quality
3 1 Is your organisation ISO
9000 certified?
Quality
3.1 3 Does the existence of the
ISO certification mean
that quality failure (Long-
term) are less likely to
occur?
Quality
4 1 Does your organisation
have a robust quality
system that can quickly
identify, improve and
control quality failures?
Quality

279 | P a g e
4.1 2 How can you identify
that the system is robust
and can control a failure
by preventing it from
becoming chronic?
Quality
5 2 What is the process from
managing a reoccurring
failure?
Quality
6 3 Does your organisation
conduct process failure
mode effects analysis
PFMEA to ensure repeat
problems don’t occur?
Quality
6.1 3 Is this part of your sub-
tier selection criteria to
control potential failure
from occurring down the
supply chain?
Quality
6.2 2 Were you asked to
provide evidence of a
PFMEA process when
tendering for business
from the Prime?
Quality
7 1 Does your company
employ gage r&r
measurement techniques?
Quality
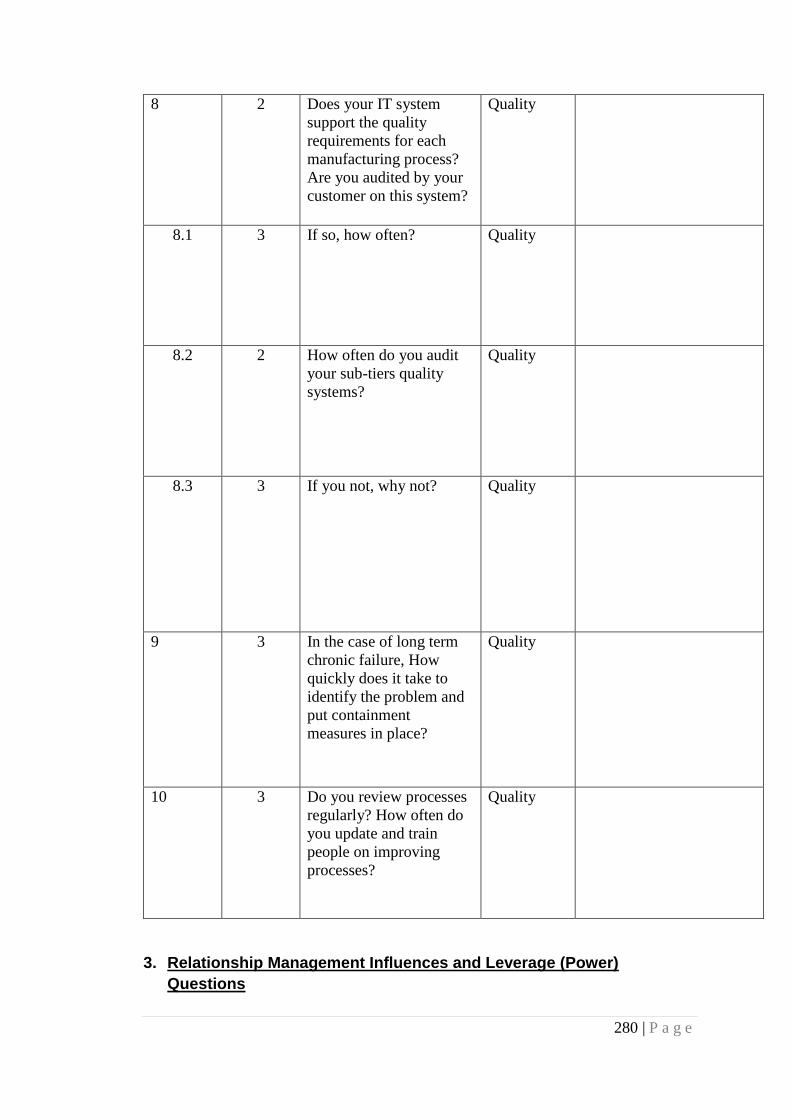
280 | P a g e
8 2 Does your IT system
support the quality
requirements for each
manufacturing process?
Are you audited by your
customer on this system?
Quality
8.1 3 If so, how often? Quality
8.2 2 How often do you audit
your sub-tiers quality
systems?
Quality
8.3 3 If you not, why not? Quality
9 3 In the case of long term
chronic failure, How
quickly does it take to
identify the problem and
put containment
measures in place?
Quality
10 3 Do you review processes
regularly? How often do
you update and train
people on improving
processes?
Quality
3. Relationship Management Influences and Leverage (Power)
Questions

281 | P a g e
PARTICIPANT INFORMATION
Function: Sales
Job Title Responsibilities Justification for
Interview
Commercial Manager Commercial link between
procurement and sales
within the organisation
Detailed knowledge of
customer requirements vs
supply chain capability.
Should understand where
the organisations
strengths and weaknesses
lie within their supply
chain management
function and how it
affects their ability to be
competitive within the
markets they serve.
Research
Question
Question Literature Interviewee Response
1 2 What are the key factors that
can contribute to chronic
long-term failure for the
organisation?
Power
2 1 What is your organisations
current credit rating?
Power
2.1 2 Does your performance have
an effect on the credit rating
of the company?
3 3 On what criteria does your
company select its potential
customers?
Power

282 | P a g e
3.1 2 Does your organisation
select suppliers who have
been known to have been
involved in chronic long
term supply chain failure in
the past?
Power
3.2 3 If so why? If not why not? Power
4 1 Do you have favoured / non-
favoured customers?
Power
4.1 2 If so what is the criteria for
this, how do you decide what
who is a favoured customer
as opposed to a non-favoured
customer?
Power
5 1 How does your organisation
differentiate itself from other
competitors within aerospace
sector?
Power
5.1 3 Do you think these core
competencies give you more
time to recover if a failure
starts to become chronic? If
so why? If not why not?
Power
6 3 If a chronic long-term failure
occurs under what
circumstances would the
failure be allowed to become
chronic, i.e. go on so long?
Power

283 | P a g e
7 2 Do you have a maximum
leverage cap with your
customers and suppliers? If
so what is it and why?
Power
8 2 Do you ensure that supplier
protection clauses are
incorporated into the
contract with the customer to
protect you against:
Fluctuations in
customer demand
(Customer has to pay
for WIP parts and
raw material if
demand is cut within
leadtime).
Expectations (I.e.
cardinals defining
who is responsible
for what, where and
when and what are
the parameters)
Quality disputes
(Innocent before
being proved guilty
through joint
investigation)
Other
Power
8.1 1 Are these flowed down to
your customers?
Power
9 3 Do you encourage long
standing relationships with
suppliers? If so do you think
it reduces the likelihood of
chronic long term supply
chain failure from occurring?
Power

284 | P a g e
9.1 2 How quickly and easily can
you re-source if a supplier is
not performing thus effecting
you performance?
Power
4. Supply Chain Failure and Recovery Questions
PARTICIPANT INFORMATION
Function: Senior Management
Job Title Responsibilities Justification for
Interview
Sales Director Accountable for all sales
and new business
development
Knowledge of market
trends and future business
potential
Research
Question
Question Literature Interviewee Answers
1 1 What are the key factors
that contribute towards
supply chain failure?
Service
Recovery
1.1 2 Can they be identified
quickly?
Service
Recovery
1.2 3 Can the factors that cause
chronic long term failure be
resolved in a timelier
manner so that they don’t
become chronic?
Service
Recovery
1.3 3 If this happens are the
events recorded so that they
prevent failure from
happening in the future?
Service
Recovery

285 | P a g e
2 2 What are the key factors
that have contributed to
recovery from failure for
the organisation?
Service
Recovery
2.1 3 Are these identified factors
recorded and used to
improve existing processes
thus reducing the likelihood
that failures will happen
again?
Service
Recovery
3 1 Are teams or individuals at
all levels given the
authority to resolve
problems with customers or
suppliers autonomously or
is there a hierarchical
approval process?
Service
Recovery
3,1 1 If there is an approval
process, does it affect the
speed at which key
decisions are made
delaying the ability to fix a
problem?
Service
Recovery
4 2 When a component is being
consistently returned as a
non-conformance, what
steps do you take to resolve
the problem?
Service
Recovery
5 1 Has your organisation
managed to win more
business as a result of
recovering from a chronic
long term failure?
Service
Recovery
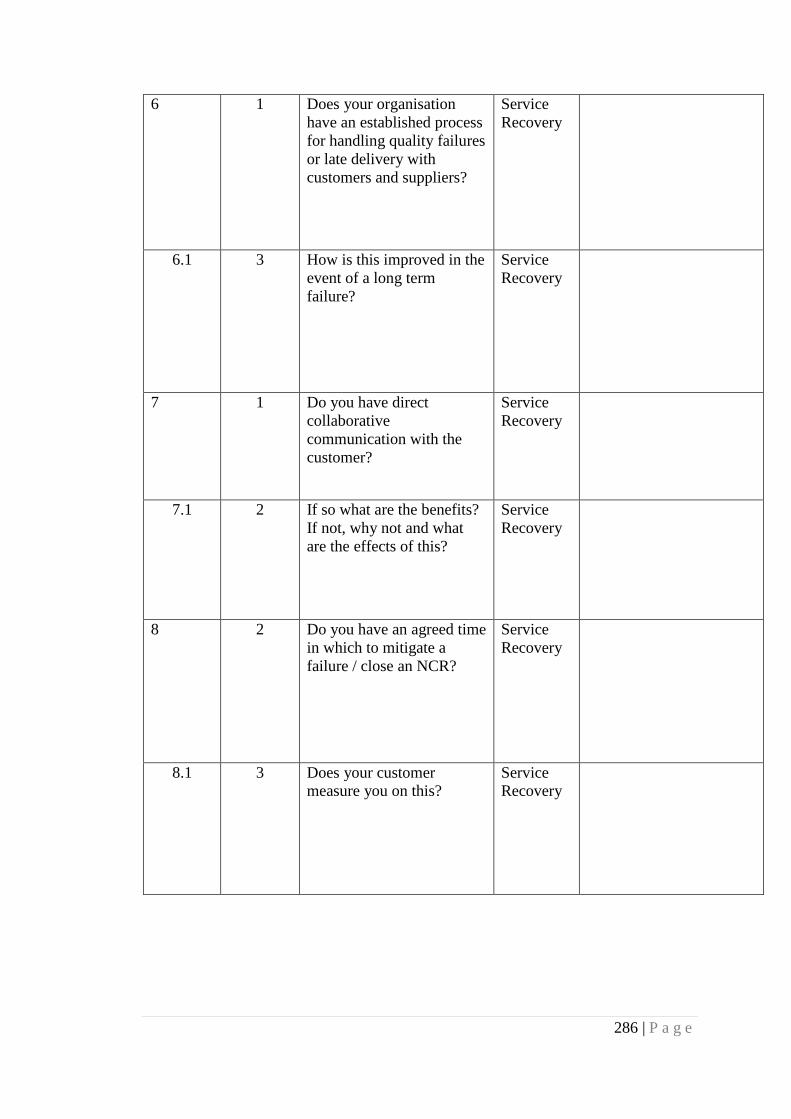
286 | P a g e
6 1 Does your organisation
have an established process
for handling quality failures
or late delivery with
customers and suppliers?
Service
Recovery
6.1 3 How is this improved in the
event of a long term
failure?
Service
Recovery
7 1 Do you have direct
collaborative
communication with the
customer?
Service
Recovery
7.1 2 If so what are the benefits?
If not, why not and what
are the effects of this?
Service
Recovery
8 2 Do you have an agreed time
in which to mitigate a
failure / close an NCR?
Service
Recovery
8.1 3 Does your customer
measure you on this?
Service
Recovery

287 | P a g e
8.2 2 What is the outcome with
your customer if you fail to
mitigate / identify the
problem within the
specified time?
Service
Recovery
8.3 3 Does your organisation
flow this rule / time down
to your customers?
Service
Recovery
9 3 Are their agreed penalties
for non- conforming parts
and late deliveries?
Service
Recovery
9.1 3 Do these penalties ensure
that greater attention is
placed on achieving agreed
quality and delivery targets
with contracted customers?
Service
Recovery
9.2 1 Are these requirements
with the customer
ambiguous? If so how and
what effects does this have
on your ability to deliver on
time and to the correct
specification?
Service
Recovery
5. Risk Management Questions
PARTICIPANT INFORMATION
Function: Senior Management
Job Title Responsibilities Justification for
Interview
Managing Director Accountable for the
organisation
Knowledge of
organisational
performance and
competitiveness in the

288 | P a g e
market. Knowledge of
future vision and strategy
of the organisation in line
with customers’ strategy
and future market
forecasts.
Research
Question
Question Literature Interviewee Response
1 2 What are the key risks that
contribute to failure for the
organisation?
Risk
1.1 3 Are risk assessments carried
out to ensure these issues
are identified and managed
before they can contribute
towards chronic long term
failure scenario
Risk
2 3 Can failure to identify and
manage key risks at critical
stages in a contract
contribute to long term
chronic failure? If so how
and when?
Risk
3 1 Who is considered
responsible for your
organisations identification
and management of risks?
Risk
3.1 2 Are these identified risks
flowed down to other
members of the
organisation / project teams
etc.
Risk

289 | P a g e
4 3 What mechanisms are used
within the organisation to
identify potential risks?
Risk
4.1 2 Once identified, how are the
risks managed / controlled?
Risk
4.2 3 Has any of these initiatives
helped the organisation
recover from chronic long
term failure? If so how?
Risk
5 3 Does your organisation
conduct joint risk
assessments with customer /
suppliers prior to key
milestones during the
contract formulation
process?
Risk
5.1 3 If so how? If not why? Risk
6 2 Does your organisation
conduct risk assessments
when selecting new
potential customers
/suppliers and when
manufacturing new
components?
Risk

290 | P a g e
6.1 1 If so, do you think it has
contributed to mitigating
chronic long term failure?
Risk
7 2 How regularly are risk
assessments updated and
managed during a contract
with a customer / supplier?
Risk
8 3 When it is identified that
chronic failure is occurring
(i.e. repeated NCR’s and
component returns) do you
instigate a risk assessment
process?
Risk
8.1 2 Has this contributed to
resolving the problems and
has it prevented the problem
from occurring again?
Risk
9 3 Do you have regular
meeting concentrated on
risks or are potential issues
identified during day to day
meetings?
Risk
9.1 3 If so, how effective are the
meetings at identifying the
issues?
Risk
6. Business Continuity Management (Contingency) Questions

291 | P a g e
PARTICIPANT INFORMATION
Function: Senior Management
Job Title Responsibilities Justification for
Interview
Managing Director Accountable for the
organisation
Knowledge of
organisational
performance and
competitiveness in the
market. Knowledge of
future vision and strategy
of the organisation in line
with customers’ strategy
and future market
forecasts.
Research
Question
Question Literature Interviewee Response
1 3 What in your opinion are
the key macro-economic
factors that can contribute
towards long term chronic
supply failure?
Contingency
1.1 3 What actions (If any) do
you put in place to protect
your organisation from this
causing chronic long-term
supply failure?
Contingency
1.2 1 If you have no actions /
initiatives in place in place,
why not?
Contingency
2 2 To mitigate against the risk
of events happening that are
out of your control, what
initiatives do you have in
place to insure continuity of
supply?
Contingency

292 | P a g e
3 1 Who is considered
responsible for your
organisations management
of BCM?
Contingency
3.1 3 Are these initiatives flowed
down to the rest of the
organisation?
Contingency
4 1 Do BCM issues drive
business strategy I.e.
supplier selection?
Contingency
5 1 Does your organisation
request a BCM from all
prospective suppliers?
Contingency
6 2 In the event of a supply
failure caused external
events, how quickly can the
organisation react?
Contingency
7 2 When long term chronic
failure occurs, are BCM
issues reviewed and
included in a mitigation
plan? If not why not?
Contingency
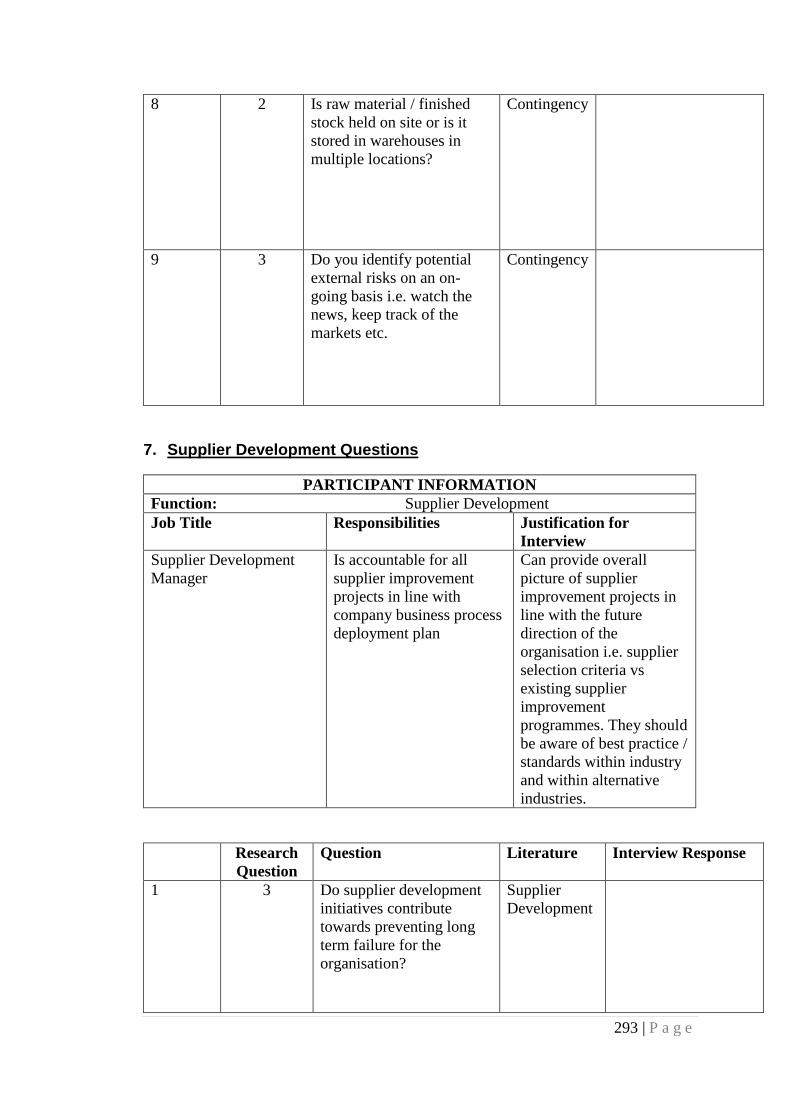
293 | P a g e
8 2 Is raw material / finished
stock held on site or is it
stored in warehouses in
multiple locations?
Contingency
9 3 Do you identify potential
external risks on an on-
going basis i.e. watch the
news, keep track of the
markets etc.
Contingency
7. Supplier Development Questions
PARTICIPANT INFORMATION
Function: Supplier Development
Job Title Responsibilities Justification for
Interview
Supplier Development
Manager
Is accountable for all
supplier improvement
projects in line with
company business process
deployment plan
Can provide overall
picture of supplier
improvement projects in
line with the future
direction of the
organisation i.e. supplier
selection criteria vs
existing supplier
improvement
programmes. They should
be aware of best practice /
standards within industry
and within alternative
industries.
Research
Question
Question Literature Interview Response
1 3 Do supplier development
initiatives contribute
towards preventing long
term failure for the
organisation?
Supplier
Development

294 | P a g e
1.1 2 If so how? If not why not? Supplier
Development
2 2 In the event of chronic
long-term supply chain
failure within your supply
chain, do you deploy
people into your supplier’s
in-order to facilitate
recovery?
Supplier
Development
2.1 3 If so how quickly? If not
why not?
Supplier
Development
3 3 If periods of sustained
under performance occur,
how much extra resource
is dedicated to resolving
the problem?
Supplier
Development
3.1 3 Do you think extra /
dedicated resources can
help to mitigate chronic
long term supply chain
failure?
Supplier
Development
3.2 3 If so why, if not why not? Supplier
Development

295 | P a g e
4 1 Have improvement
initiatives were
implemented by your
customers and / or
suppliers in the event of
periods of chronic failure?
If so what are they? Have
they helped to improve
chronic long term failure?
Supplier
Development
5 1 Are you currently still
involved in any customer
led activities that were
started during chronic
supply chain failure?
Supplier
Development
5.1 3 If so has it been beneficial
i.e. has it stabilized and /
or improved performance?
Supplier
Development
6 3 Do you embrace
knowledge and support
from your customers and
suppliers?
Supplier
Development
6.1 3 If so how and why? If not
why not?
Supplier
Development
7 2 During times of chronic
supply chain failure do
you deploy personal from
your organisation into
problem suppliers? if so,
for how long?
Supplier
Development
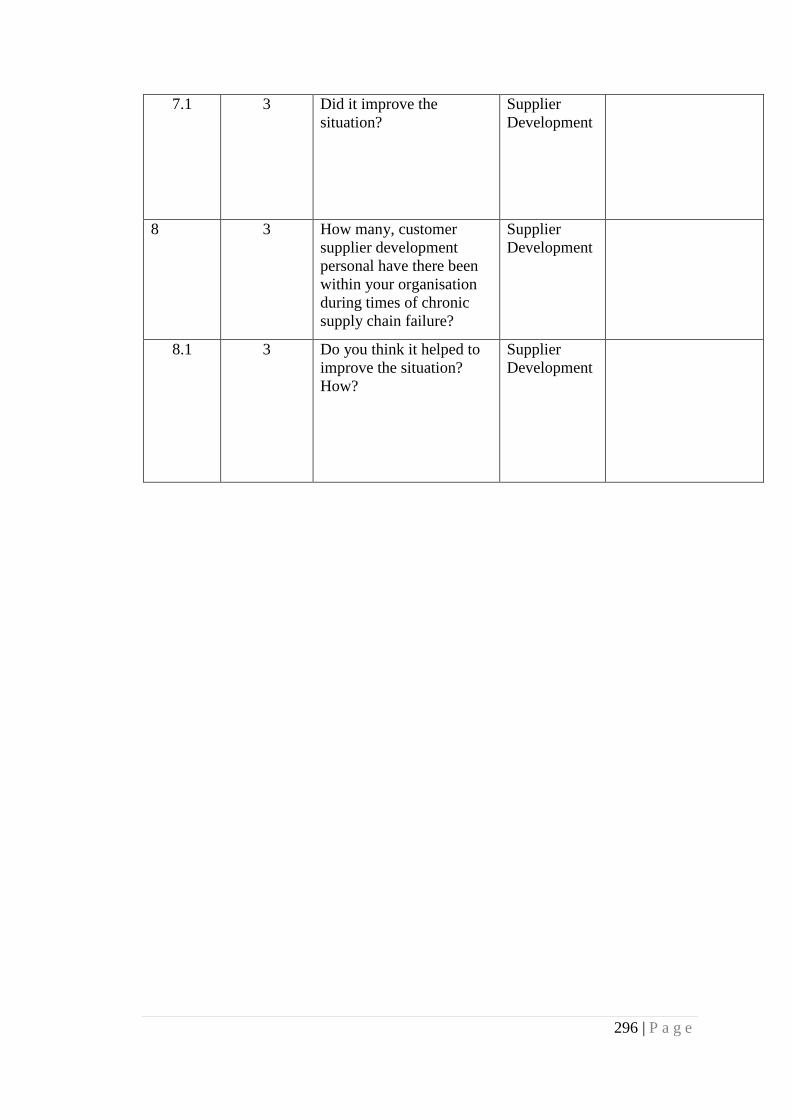
296 | P a g e
7.1 3 Did it improve the
situation?
Supplier
Development
8 3 How many, customer
supplier development
personal have there been
within your organisation
during times of chronic
supply chain failure?
Supplier
Development
8.1 3 Do you think it helped to
improve the situation?
How?
Supplier
Development

297 | P a g e
Appendix 3 – Summary of the Coding File Findings.

298 | P a g e
Interview findings – Example of Coding Level 1.

299 | P a g e
Appendix 4 – First Quality Causal Loop Diagram.
Complex
Quality SystemAmbiguous
Specification
PersistantQualityIssues
First TierAuditing
Capability
-
--
Supply Chain Visibility
- Managing the sub tier
B2
Many failuresand shortterm fixes
R3
+
+
-
-

300 | P a g e
First Iteration of the Causal Loop Diagram Model.
Source Change
Capacity
Supply Chain Dependancy
POWER
Spend = B1
Cost
+
Level of Interaction
+
Sourcing Strategies
POWER
Strategy =
R1
Investment
Skilled Labour
PERFORMA
NCE
Resources =
R3
Non Conformances
Route Cause Analysis
Supplier Audit
Adherence
++
QUALITYComplexity
aroundQuality =
R2
Number of Parts
QUALITYScarcity of
RawMaterials
= R5
Number of Locations
Planning Workload
Volatile Forecasts
On Time Delivery
+
Customer Orders
RISK
Demand
Planning =
R4
+
+
Consensus
Information Transfer
Cooperation and Trust
Chances of Exploitation +
-
POWER
Communication
= B5
-Ambiguity
Reactive Metrics
PERFORMANCE
Ambiguous
Metrics = R6
+
-
+
+
RevenueProfit
Desired Cost
Desired Growth
POLICY - Quick
fix versus Long
term solution
+ -
+
-
+
+
+
+
+
-
-
+
+
+
-
-
+
+
+
Supply Chain Failure isdemonstrated by a supplier
consistently failing to deliver agood / service as agreed perthe contract. Affect is shownby the gap between actual
cost of purchase and desiredcost of purchase over timeaffecting company profit
Causal
Relationship
between
Demand
Planning and
Adherence = B3
Causal
Relationship
between cost and
adherence = B2
Spend with Supplier
-
+
-
+
-
+
-
Causal
Relationship
between Cost
and
Communication
= B4

301 | P a g e
Appendix 5 – Understanding Supply Chain Failure Presentation.

302 | P a g e

303 | P a g e

304 | P a g e

305 | P a g e

306 | P a g e

307 | P a g e

308 | P a g e

309 | P a g e

310 | P a g e

311 | P a g e

312 | P a g e

313 | P a g e

314 | P a g e

315 | P a g e
Appendix 6 – Research Stage 3 Validation Design. Workshop Strategy Research Design Proposal
Introductions & Presentation of Workshop aims – What is persistent supply chain failure. Introduction – All three researchers to briefly introduce themselves to the group
Step 1 – Bart to introduce the research. The starting gambit will be to read out our definition of
persistent supply chain failure. Then move onto discuss the aims and objectives of the research
and also the aims and objectives for the workshop. Then briefly and tactfully discuss the key
issues identified during the research.
Step 2 – Katri to discuss the methodological framework of the research i.e. the three stages of
research design and to highlight the importance of methodological rigor. In other words highlight
the importance of this workshop to the research.
Step 3 – Karsten to go through the model creation process. This will be done by firstly
identifying the key themes of the research. Then we will run through the presentation
highlighting each loop step by step. Until the entire persistent failure model is constructed.
During the presentation the following information will be extrapolated to consist of the following:
What is the causal loop trying to show?
How is it constructed?
What is a variable? What are the rules for creating a variable i.e. use of nouns, are the
variables measurable etc.
What are the rules for linking one variable to another?
(Note: if time starts to become tight it is ok to suggest we speed things up!)
Step 4 – All of the participants will be asked if they understand / agree with the definition of
persistent supply chain failure. This will be recorded either with the use of a Dictaphone or
camcorder depending on permission.
Workshop Part 1 - Causal Loop diagrams – What are the causes of persistent supply chain failure by validating the persistent failure model.
Step 5 – split the workshop into the three groups – The aim of this session will be to assign the
participants in each group a theme from the persistent failure model (Ideally a dominant
literature theme i.e. Quality Management, Dependency and Relationship Management.) and
then ask them to critique that loop
Each group will be tasked with verifying the variables and linkages within the loop. If
there is a general disagreement with the sequence / construction of the loop then within their

316 | P a g e
groups they will be asked to explain why and tasked with providing an alternative sequence.
They will also be free to add or amend the wording of the variables. In addition to this they will
be asked to answer the following questions:
What does the loop highlight?
What is the unseen key determinant – Ceterus Paribus (The hidden constant)?
What are the key characteristics? Long term / short term, favourable / unfavourable?
How does it contribute to the persistent failure model?
Each one of us will individually facilitate a group and capture the comments / observations
made by the participants regarding the models. The comments will be captured on a flip chart
by the facilitator. The key idea is to get the participants to speak freely in the same manner as
a semi structured interview and too make comments about the failure modes (variables) and
how they form interdependencies (systems) at the prime. It will also be important to split the
groups between functions, job roles and seniority. The purpose of this is to maintain a good
spread of participants but it is mainly to stop having all of the seniors in one group.
12.30pm Lunch Break Workshop Part 1 Continued - Causal Loop diagrams – Group feedback session – Validation of the persistent failure model.
Step 6 – each group will then be asked to provide feedback on their specific loop to the rest of
the group. All of the workshop participants will be encouraged to comment and ask questions
at this point. The goal of this session will be to gain a general consensus on whether (1) the
model accurately highlights key variables associated with the causes of persistent failure at the
prime (2) the loops accurately or closely capture the interdependencies / linkages between the
variables that combine to create reinforcing or balancing loops (3) that the loops show the cause
and effect of persistent failure at the prime in an understandable way. The key thoughts /
comments that emerge from the discussion will be recorded either with the use of a Dictaphone
or camcorder depending on permission.
Step 7 – The desired conclusion to this session will be to get the participants to ask questions
on the persistent failure model in its entirety. For example does this model on persistent failure
reflect reality? If it does why, if it does not, why not. The information captured here will help to
decide if the model adequately captures the systems that link together to cause either an
increased or a reduced effect on failure.
Workshop Part 2 – Beneficial uses of the persistent failure model. Step 8 – With the involvement of all participants we will ask the question to the group “How can
the persistent failure model be used to prevent persistent failure in the organization” We will

317 | P a g e
display the model on the projector and record all suggestions on a flip chart. This session will
also be recorded either with the use of a Dictaphone or camcorder depending on permission.
Closing feedback session
Step 9 – To further back up and increase the validity of the findings, for approx. 30mins at the
end of the afternoon session each participant will be provided with a workshop feed-back form
that will simply ask if the participant agreed with the construction, layout, content and assertions
of the persistent failure model. The form will then ask the participants to provide comments as
to why they agree with it or to explain why not. They will also be asked to list any limitations
with the model and the research in general if applicable. The participants will then be asked to
date the form rather than sign in-order to retain anonymity to further enhance the reliability of
the data. This is standard practice at the prime after every training session so hopefully the
participants will be familiar with this process and complete the form.


