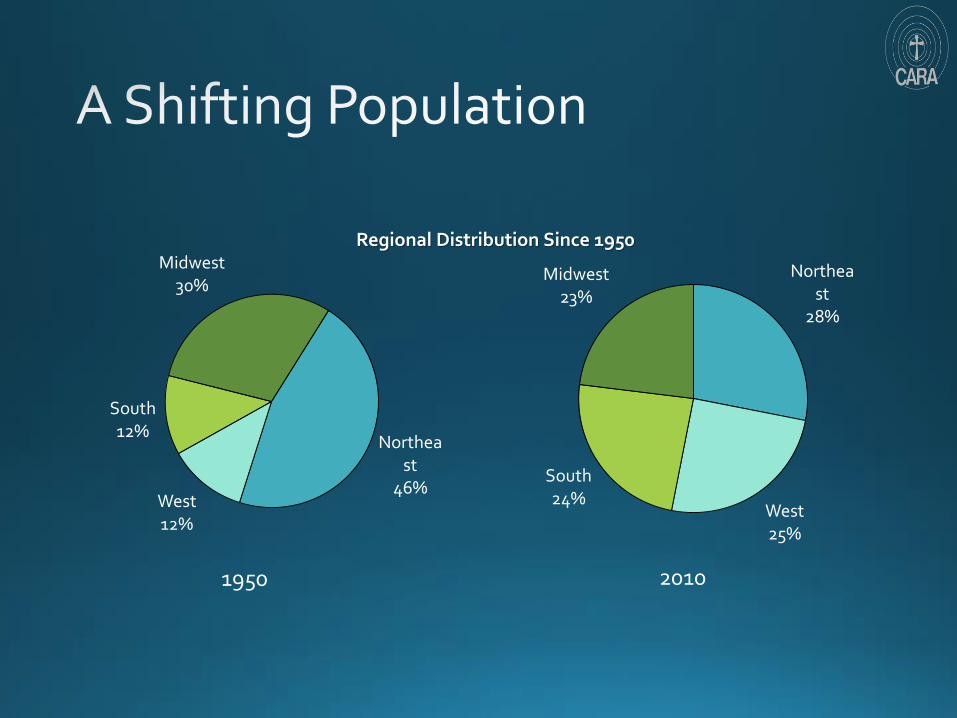
Northeast
46%West12%
South12%
Midwest30%
Northeast
28%
West25%
South24%
Midwest23%
1950 2010
Regional Distribution Since 1950

• The results are generally consistent with CARA’s national surveys of the U.S. adult Catholic population
• Non-Hispanic white Catholics are fewer in number (-4 percentage points)
• The Hispanic/Latino Catholic population is larger in number (+4 percentage points)


• The most racially and ethnically diverse segment of the Catholic population is its youth
• Half of Catholic adults of the Millennial Generation (those born 1982 or later) are notnon-Hispanic white

White94%
Hispanic/
Latina3%
Asian/
Pacific Islander
2%
Black/
African American
1%
Other0.2%
Perpetual Vows
White61%
Hispanic/
Latina16%
Asian/
Pacific Islander
16%
Black/
African American
6%
Other1%
Initial Formation
Source: 2009 NRVC/CARA Study of Recent Vocations to Religious Life


