Culture and trade facilitation: How our values
determine the effectiveness of trade institutions
Master thesis
Spring semester 2016
Department of Economics
Seminar: 16-05-30
Author:
Malin Källén
Supervisor:
Maria Persson
2
Abstract
In recent years new ways to deal with trade barriers, aside from the traditional tariff and quota
reductions, has been introduced to trade negotiations. These have the collective name of trade
facilitation and focuses on the less visible parts of barriers to trade. As this started to be
discussed in policy circles economic research picked up interest as well. However, focus in the
research has been on the effects of increased trade facilitation while little to nothing has been
said about the causes, creating a large gap in the research. This study tries to shed light on this
fact and investigates culture as one of many possible determinants behind the varying levels of
trade facilitation. The field of culture is also relatively new in modern economic research but
what have been unearthed so far is that many aspects of economic interactions and outcomes
are affected by the different cultural traits. By using an OLS regression framework this study
looks at the relationship between culture and trade facilitation and finds that the relationship is
significant. Cultures aligning with the concept of generalised morality are generally better at
facilitating trade than others which is also true for more religious countries. These results
suggest that this relationship requires further research because of the large gains to make when
trade facilitation reforms can be correctly directed.
Keywords: Culture, trade facilitation, trade, generalised morality, religion
3
Table of contents
ABSTRACT ........................................................................................................................................................... 2
TABLE OF CONTENTS ...................................................................................................................................... 3
LIST OF FIGURES .............................................................................................................................................. 4
LIST OF TABLES ................................................................................................................................................ 4
1. INTRODUCTION ............................................................................................................................................. 5
2. THE DIVERSE CONCEPT OF TRADE FACILITATION ......................................................................... 7
2.1 TRADE FACILITATION REFORMS AND TARIFFS ................................................................................................ 9 2.2 MEASURING TRADE FACILITATION IN THE STUDY ........................................................................................ 10
3. DEFINING AND COMPUTING CULTURE AND ITS ECONOMIC EFFECTS ................................... 12
3.1 GENERALISED VERSUS LIMITED MORALITY.................................................................................................. 13 3.2 THE PERSISTENCE OF CULTURE .................................................................................................................... 15 3.3 MEASURING CULTURE ................................................................................................................................. 16
4. THEORY ......................................................................................................................................................... 17
4.1 THE DETERMINANTS OF TRADE FACILITATION ............................................................................................. 17
5. PREVIOUS RESEARCH ............................................................................................................................... 19
5.1 THE EFFECTS OF CULTURE ........................................................................................................................... 19 5.2 THE EFFECTS OF TRADE FACILITATION......................................................................................................... 21
6. METHODOLOGY .......................................................................................................................................... 23
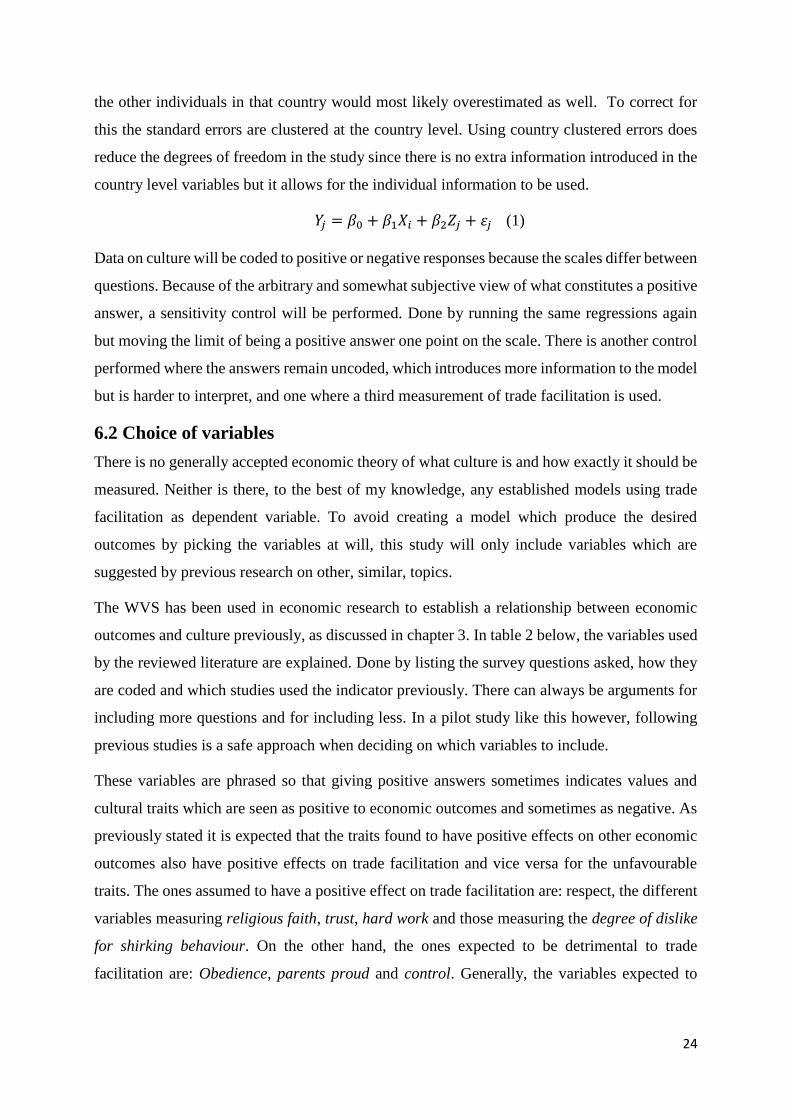
6.1 EMPIRICAL METHOD .................................................................................................................................... 23 6.2 CHOICE OF VARIABLES ................................................................................................................................ 24
6.2.1 Describing the data on culture ............................................................................................................ 26 6.3 LIMITATIONS ............................................................................................................................................... 27
7. MAIN REGRESSION RESULTS ................................................................................................................. 30
7.2 PRINCIPAL COMPONENT ANALYSIS .............................................................................................................. 32 7.2.1 Testing the variables ........................................................................................................................... 35
7.3 PCA REGRESSION RESULTS .......................................................................................................................... 35 7.4 ROBUSTNESS TESTS OF THE RESULTS ........................................................................................................... 37
7.4.1 Leaving the WVS responses uncoded .................................................................................................. 37 7.4.2 Changing the limits for positive answers............................................................................................. 37 7.4.3 Doing a component of all DBD “Trading across borders” data ........................................................ 37
8. SUMMARY AND CONCLUSIONS .............................................................................................................. 39
9. REFERENCES ................................................................................................................................................ 41
APPENDIX A – FULL TABLES MAIN REGRESSION RESULTS ............................................................. 44
APPENDIX B – EXPLAINING THE CAUSE FOR BIAS.............................................................................. 47
APPENDIX C – PCA STATISTICS .................................................................................................................. 48

4
List of figures Figure 1:Time to export in days, all countries in DBD .......……………………………………………8
Figure 2: Time to export in days, only OECD countries ......................................................................... 8
Figure 3: Countries plotted according to their responses in WVS, historical-religious regions are
indicated. ............................................................................................................................................... 14
Figure 4: Eigenvalues of PCA plotted against number of components. ................................................ 34
List of tables Table 1:Discriptive statistics of trade facilitation measurement............................................................ 11
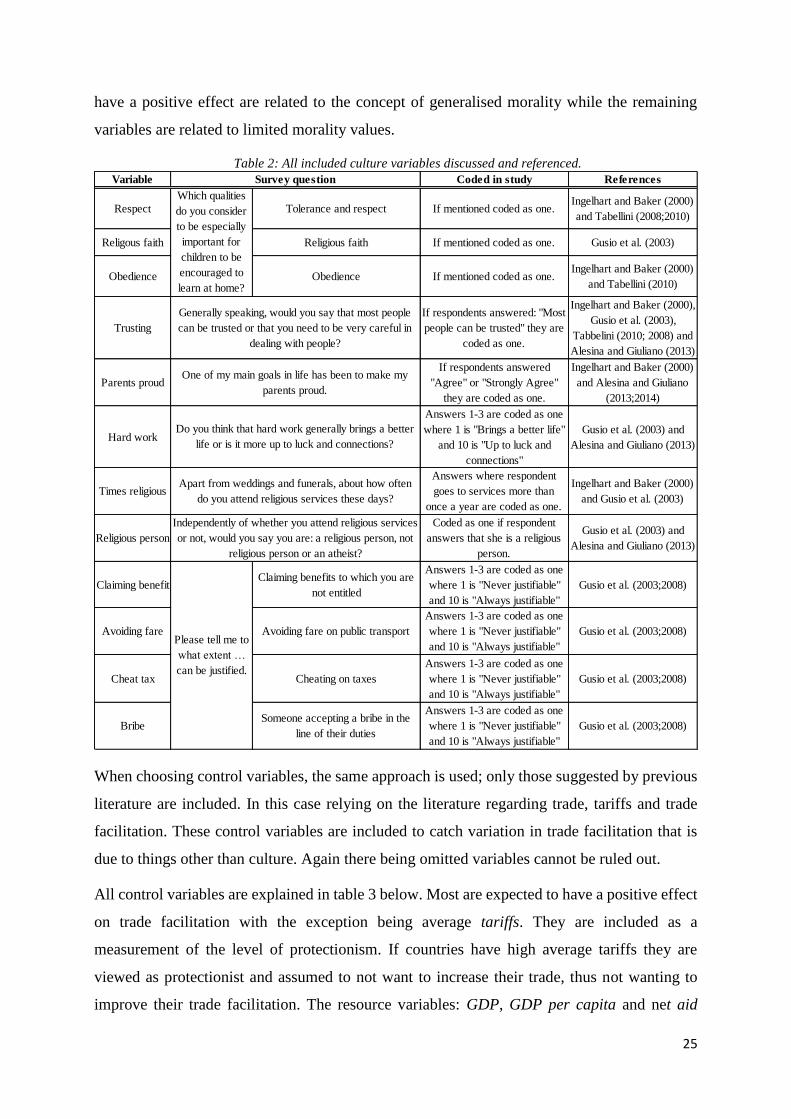
Table 2: All included culture variables discussed and referenced. ........................................................ 25
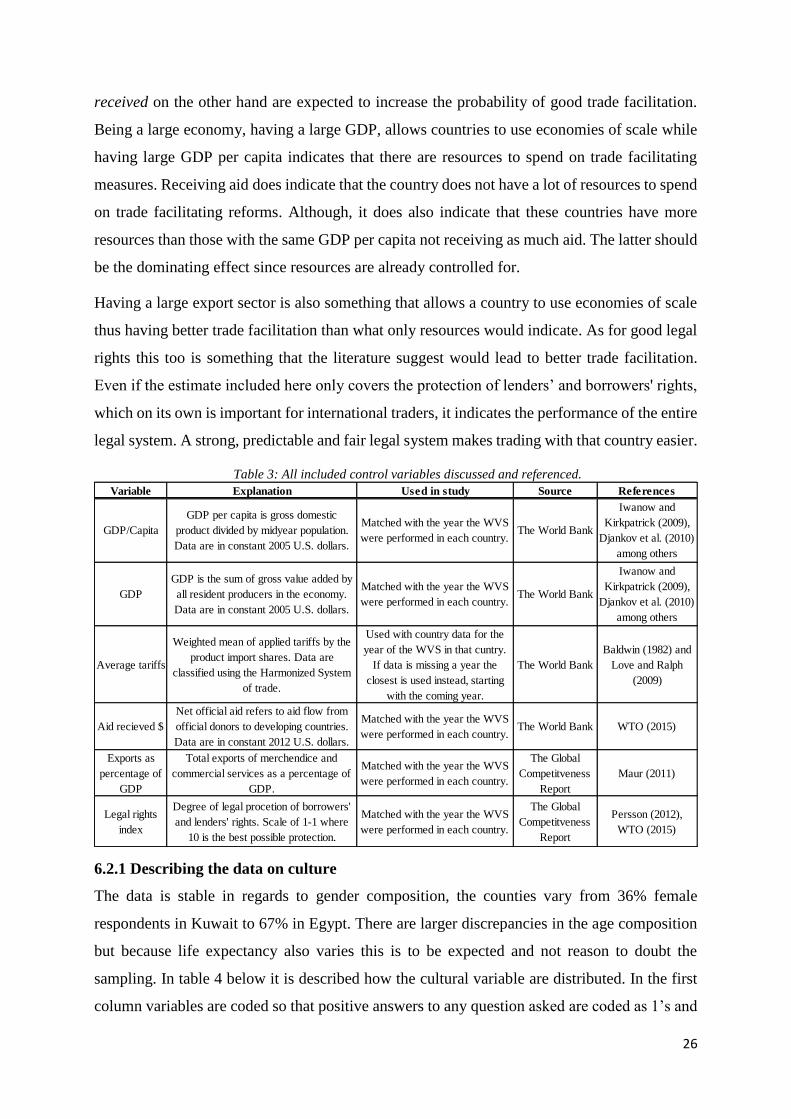
Table 3: All included control variables discussed and referenced. ....................................................... 26
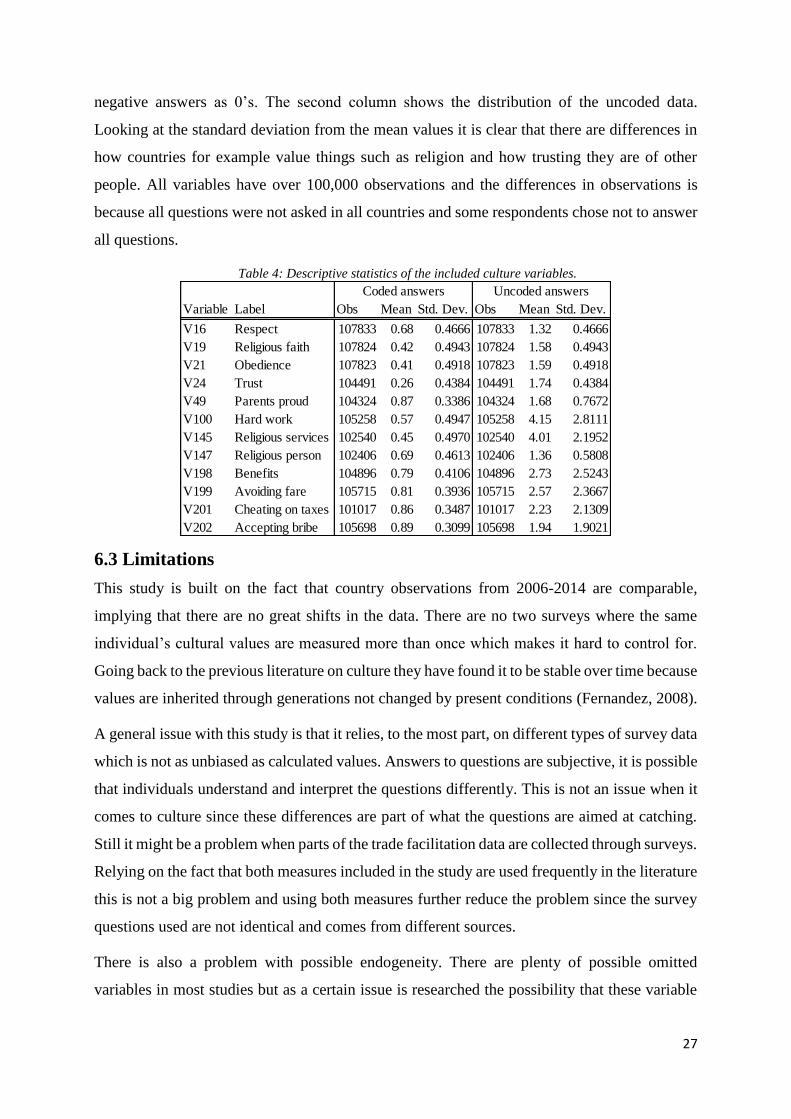
Table 4: Descriptive statistics of the included culture variables. .......................................................... 27
Table 5: Regression results for main models. ....................................................................................... 32
Table 6: Loadings of culture variables on PCA components. ............................................................... 34
Table 7: KMO measure of sampling adequacy. .................................................................................... 35
Table 8: Regression results of models using culture PCA components. ............................................... 36
5
1. Introduction
The world is more integrated today than ever before, and this ongoing process of globalisation
is not likely to halt anytime soon. Hence there has been discussions of how countries are to best
reap the benefits of being a part the ever more interconnected world. One of the main ways of
doing this has been by decreasing trade costs. Because it leads to increase trade flows, which
has been proven profitable. Countries, and organisations, has largely focused on the reduction
of tariffs through multilateral and bilateral agreements as the way of lowering trade costs to
reap the benefits of globalisation (WTO, 2016). However, more recently focus has shifted to
other, less visible, parts of international trade that are costly for firms. These types of costs and
the work of reducing them are usually bundled together under the name trade facilitation.
There is now a widespread consensus in both academia and between trade policy professional
regarding the importance of trade facilitation as a way of reducing trade barriers. Hence, finding
ways to improve trade facilitation in different countries is regarded, by most, as highly relevant
(WTO, 2016). Thus researching what, or even parts of what, determines trade facilitation is
warranted. Because knowing what causes any phenomena is crucial in finding the right tools to
improve it.
It could be assumed that the ways of improving trade facilitation is straightforward, and all the
available guidelines and handbooks are likely to further this view. However, countries are not
identical and one reform which is effective in western-type economies might not be as effective
in the economies of Eastern Asia. The fact that countries differ and thus require different
reforms and strategies to improve their trade facilitation calls for a deeper understanding of the
driving forces behind good trade facilitation. Is it simply a question of resources or are there
other, less obvious, reasons for why some countries are better at facilitating trade than others?
It is not unreasonable to assume that there are other factors involved since there are many parts
in trade facilitating measures which require for example, good management or skilled and
productive employees. By using these two examples it is clear that however easy it is to state
that it is desirable to have these things but that they are more complicated and complex to
achieve. Exactly what all these driving factors are is not known and there are, to my knowledge,
no research done to further investigate this. The scheme of this paper follows the ideas of Gusio
et al. (2003;2006;2008) and Tabellini (2008;2010) among others and their work on the effect
culture has on institutions and other economic outcomes. In their research it is suggested that
there are some cultural traits which leads to more favourable outcomes than others.
6
Given that this trues it is not farfetched to believe it to be the case in trade facilitation as well.
If the values, or other culture characteristics, that help create good trade facilitation can be
found, reforms can be directed at either taking advantage of being such a society or finding
ways to overcome not being one. Thus there does not need to be a convergence of cultures
towards the most economically beneficial. Information on the determinants of trade facilitation
will rather make countries aware of what cultural traits are prevalent there and how to either
work with or around them to succeed in effective trade facilitation.
The reason why there is no previous research on this issue could be because the fields of trade
facilitation and culture research are quite new or because it requires the usage of less
straightforward variables than is otherwise common in economics. This study aspires to be
progressive and to begin the extensive work of covering the research gap regarding the
determinants of trade facilitation by looking at the effects of culture. More specifically the aim
of this study is to:
- Investigate the effect of different cultural traits on levels of trade facilitation.
This will be done using survey data to concretise and make the concept of culture computable,
which is needed for the empirical study. In a regression framework the effect of these culture
variables on different trade facilitation will be investigated. This regression model will in turn
be based upon different theories and research regarding trade facilitation and culture. Following
these theories, the hypothesis is that levels of trade facilitation will be significantly affected by
cultural traits.
The paper will be structured as follows: it will begin with a discussion and explanation of the
separate concepts, trade facilitation and culture in chapter 2 and 3 respectively. These are
followed by a theory section in chapter 4 where the possible relationship between the two are
presented. In chapter 5 the existing research on the issues are considered albeit it not being on
the connection between them. The methodology and data is examined in chapter 6 and the
results are found in chapter 7. Finally, in chapter eight conclusions are drawn and some
suggestions for further research and possible policy implications are aired.

7
2. The diverse concept of trade facilitation
There is no fixed definition of what trade facilitation is or what parts of the trade process it
should incorporate. Researchers and organisations have yet to reach a consensus on how to
define the term. Although they all do seem to think that trade is facilitated when reforms are
introduced which makes it easier and/or cheaper to trade across borders (Persson, 2012). In this
framework some argues that the concept is broad and should cover most types of trade inducing
measures, ranging from reforms concerning improved infrastructure to those aimed at reducing
corruption. Others advocate a more technical definition in which only detailed trade inducing
measures are covered, such as regulatory reductions (Orliac, 2012).
This paper will use the World Trade Organization’s (WTO) definition because this is now
incorporated in trade deals and accepted by all WTO members, making this definition as close
to generally accepted as possible. The WTO states that trade facilitation is ‘The simplification
and harmonisation of international trade procedures’ and that trade procedures should be
defined as ‘the activities, practices and formalities involved in collecting, presenting,
communications and processing data required for the movement of goods in international trade’
(ITC, 2013). This definition includes many types of barriers to trade, such as fees on exports
and imports, trade procedures, laws and regulations, goods standards among others (OECD,
2016).
Accompanying the problem of researchers using different definitions are that they also use
different indicators to measure the degree of trade facilitation prevailing in a country. These
indicators ranges from just looking at customs procedures or levels of “good-governance” to
the availability of information technologies (Orliac, 2012). More specifically there are different
indices and databases used by researchers and organisations. According to the OECD the most
commonly used are the World Bank’s “Doing Business: Trading across border” indicators, the
World Bank’s “Logistics Performance index” (LPI), the OECD’s trade facilitation indicators
and World Economic Forum’s “Enabling trade index” (OECD, 2016). These indicators all
measure the degree of trade facilitation in the world but use different variables to do so which
will cause them to behave slightly different in empirical models.
This paper will focus on two aspects of trade facilitation, namely on time as a barrier to trade
and a broader measurement combining different measurements from the World Economic
Forum. The former will be used partly because it is frequently used in empirical research on the
issue and partly because of the availability of data. Data on time to trade is taken from the
“Doing Business” report and the information on the days it takes to export a standardises good.
8
The second measurement is included because of it is broader and thus likely to be affected by
a wider range of determinants and because it is also commonly used in previous research.
If trading across borders is somehow hindered there will, theoretically, be less trade taking place
because there are costs, direct or indirect, for the trader. If for example, trading is unreasonably
slow the value of the traded goods will decrease, because it spoils or because the market value
decreases. Other causes for costs are the administrative burden it places on traders and that
unreliable trade reduces the usage of efficient “just-in-time” production techniques (Nordås et
al., 2006). Empirically results have been indicating that a 10% decrease in delays result in an
increase in trade of between 2-5%, depending on the study (Djankov et al., 2010; Iwanow &
Kirkpatrick, 2009; Nordås et al., 2006)1.
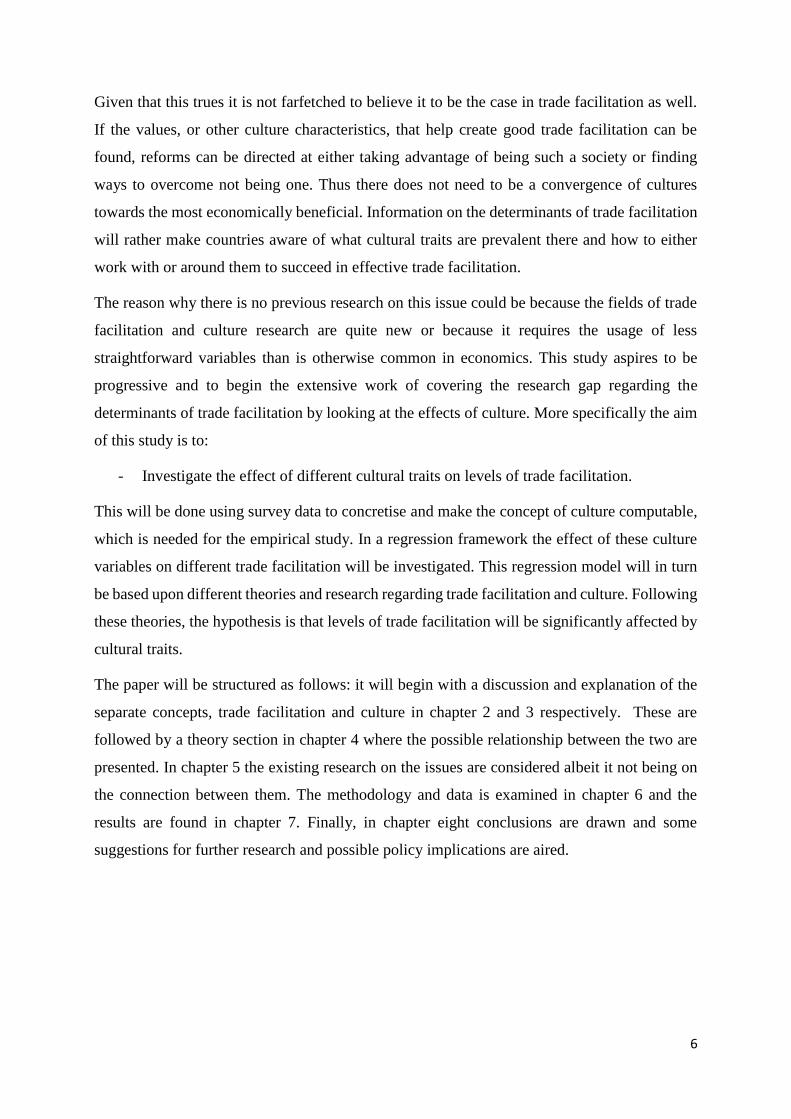
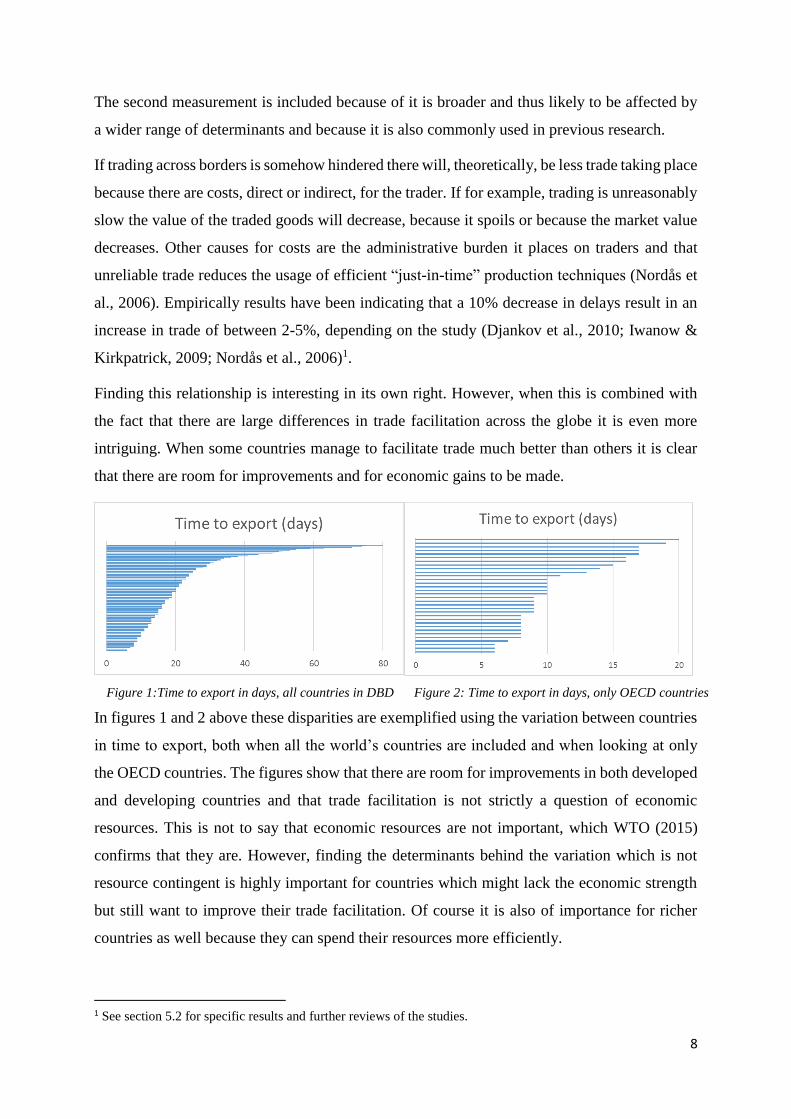
Finding this relationship is interesting in its own right. However, when this is combined with
the fact that there are large differences in trade facilitation across the globe it is even more
intriguing. When some countries manage to facilitate trade much better than others it is clear
that there are room for improvements and for economic gains to be made.
Figure 1:Time to export in days, all countries in DBD Figure 2: Time to export in days, only OECD countries
In figures 1 and 2 above these disparities are exemplified using the variation between countries
in time to export, both when all the world’s countries are included and when looking at only
the OECD countries. The figures show that there are room for improvements in both developed
and developing countries and that trade facilitation is not strictly a question of economic
resources. This is not to say that economic resources are not important, which WTO (2015)
confirms that they are. However, finding the determinants behind the variation which is not
resource contingent is highly important for countries which might lack the economic strength
but still want to improve their trade facilitation. Of course it is also of importance for richer
countries as well because they can spend their resources more efficiently.
1 See section 5.2 for specific results and further reviews of the studies.
9
A good example showing that resources are not the sole driving factor behind trade facilitation
is the case of Mauritius, as suggested by Djankov et al. (2010). This is a small country,
population of 1.3 million, with a modest GDP per capita of around $19,000 (CIA, 2016). If
economic resources were the main determining factor Mauritius would be expected have around
average export handling time, but they do not. The average import-time for Mauritius in 2013
were 10 days while the mean for the world is 19 days (World Bank, 2016a). Mauritius is a
country with less than optimal economic conditions but they still manage to facilitate trade more
efficiently than countries with better economic conditions, such as Japan, Italy and Qatar2. This
supports the discussion above, there must be other factors aside from resources affecting the
level of trade facilitation in a country.
2.1 Trade facilitation reforms and tariffs
To my knowledge there has been no research on the determinants of trade facilitation, rather
the research on the issue has focused on the effects of increased trade facilitation. There are
however many organisations, the most prominent being WTO and OECD, which publish
extensive guides to countries on possible reforms to improve trade facilitation. Using the
division suggested by WTO (2015) there are five types of trade facilitation reforms.3 First there
is reforms facilitating transparency and predictability of rules and regulations, by for example
making laws easily accessible to international traders. The second type of reforms are those
concerning the release and clearance of goods such as improved risk management and more
efficient declaration systems. The third type are all reforms aimed at improving the automation
of customs and streamline documentation requirements. The fourth reform category concerns
cooperation between border agencies and customs both nationally and internationally. An
example of such a reform is to join all border agencies and customs in one location. Finally, the
last type of trade facilitation reforms suggested by WTO are all those which does not fit under
any of the previous four titles. Examples of one such reform is the removal of unnecessary fees.
Many of the reforms imply a need for both qualified personnel with appropriate education and
good infrastructure, which thus can be seen as trade facilitating. Furthermore the judicial system
needs to be fair, uncorrupted and transparent where actors needs to have a chance to appeal
improper treatment (Persson, 2012). The third type of reforms also indicate that there are plenty
of economies of scale opportunities in trade facilitation. Because of this the countries which
today already trade a lot and have ports and airports which are used not only by the country
2 Japan had an export time of 11 days, Italy had 20 and Qatar had 17 and in 2013. 3 The same types of reforms are suggested by Love and Ralph (2009) from the OECD and by UNECE (2012).
10
itself but also by neighbouring countries have a leg up on others. Having a large export sector
would thus imply a possibility to use these economies of scale (Maur, 2011).
In addition to these suggested reforms for increased trade facilitation there has been plenty of
research done on the other main trade barrier, tariffs, and its effects on trade (Baier &
Bergstrand, 2001; Baldwin, 1982; J.-W. Lee & Swagel, 1997). Since both tariffs and extensive
trade procedures serve as barriers to trade would be reasonable to believe that countries want
to reduce these as much as possible. But it can, the case of trade facilitation be difficult to
efficiently reduce these types of trade barrier. The opposite can be said for tariffs, since they
are set via policy decisions which can be changed at will by authorities.
Despite it being easy for policy makers to reduce them there are still tariffs, sometimes quite
high, in place. The reason for this is that the increased trade made possible by such reductions
comes at a price, more competition for domestic firms. As competition for the domestic firms
increases they run the risk of being ousted by more efficient foreign firms. This would in turn
lead to domestic unemployment and serve as an incentive for governments to be protectionist
(Bhagwati, 1994). Using the fact that countries can intentionally keep high tariff levels to
protect their domestic firms the average tariff level can be considered an indicator of countries
levels of protectionism (Baldwin, 1982; Love and Ralph, 2009). If a country chooses to protect
their domestic firms by high tariffs, it is reasonable to assume they do not want to increase their
trade facilitation. This because increased trade facilitation is also likely to generate more trade,
which will increase competition for the domestic firms counteracting the protectionist nature of
the tariffs.
2.2 Measuring trade facilitation in the study
Data on trade facilitation is taken from the DBD (World Bank, 2016a) and the GCI (World
Economic Forum, 2015), both are frequently used in previous research on trade facilitation. The
measurements on trade facilitation in the DBD comes from a survey. The average responses of
trade professionals on questions regarding the number of documents, the costs and the time
needed to trade are computed for each country indicating the level of trade facilitation.
The indicators used to produce a measurement of trade facilitation from the GCI are measures
of: infrastructure, higher education and training, prevalence of trade hindrances and
technological readiness. These are mostly collected through a combination of survey questions
and quantitative data. The survey is the “World Economic Forum’s Executive Opinion Survey”
sent to business leaders in all included countries. Quantitative data is gathered from many
11
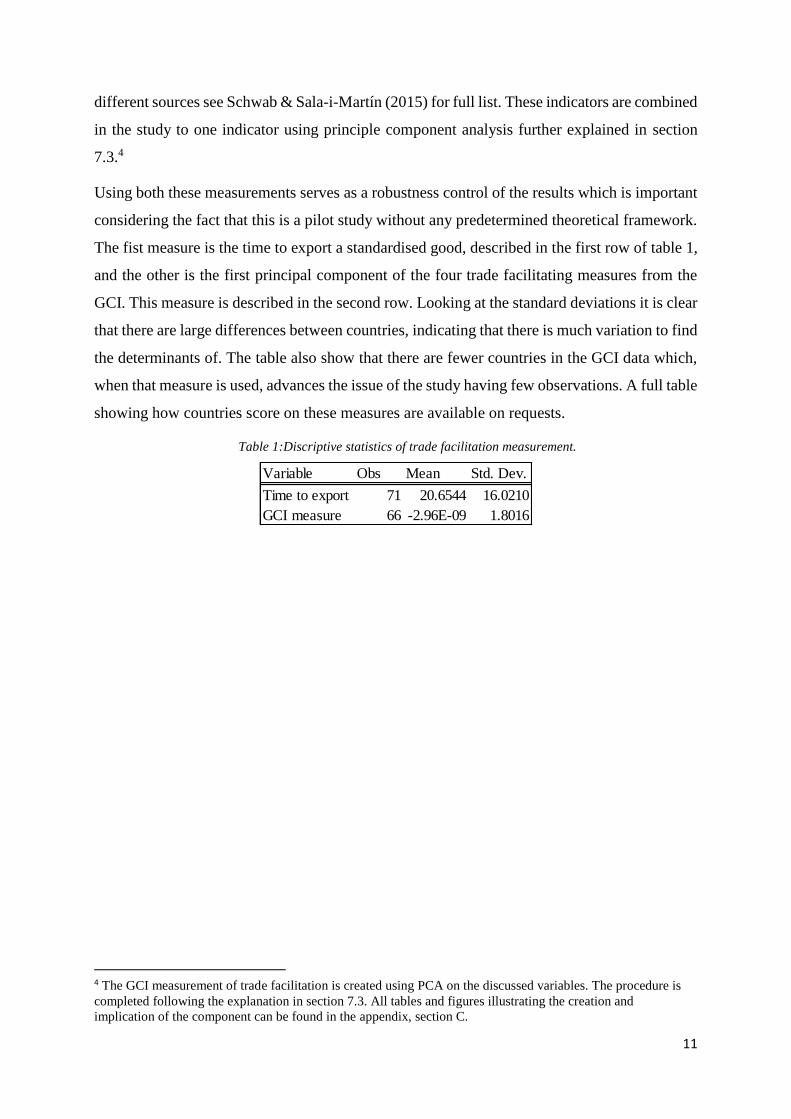
different sources see Schwab & Sala-i-Martín (2015) for full list. These indicators are combined
in the study to one indicator using principle component analysis further explained in section
7.3.4
Using both these measurements serves as a robustness control of the results which is important
considering the fact that this is a pilot study without any predetermined theoretical framework.
The fist measure is the time to export a standardised good, described in the first row of table 1,
and the other is the first principal component of the four trade facilitating measures from the
GCI. This measure is described in the second row. Looking at the standard deviations it is clear
that there are large differences between countries, indicating that there is much variation to find
the determinants of. The table also show that there are fewer countries in the GCI data which,
when that measure is used, advances the issue of the study having few observations. A full table
showing how countries score on these measures are available on requests.
Table 1:Discriptive statistics of trade facilitation measurement.
4 The GCI measurement of trade facilitation is created using PCA on the discussed variables. The procedure is
completed following the explanation in section 7.3. All tables and figures illustrating the creation and
implication of the component can be found in the appendix, section C.
Variable Obs Mean Std. Dev.
Time to export 71 20.6544 16.0210
GCI measure 66 -2.96E-09 1.8016
12
3. Defining and computing culture and its economic effects
All societies, countries, cities and other groups of people have their own beliefs, traditions and
values. These are what together build different cultures, directly affecting those living in certain
areas. Looking at the dictionary definition it states that culture is ‘ideas, customs, and social
behaviour of a particular people or society’ (Oxford Dictionaries, 2016). This definition falls in
line with the common usage of the term, both for general discussions and in academic research,
and will therefore be used in this paper (Throsby, 2001). Having defined the concept makes it
possible to scrutinise previous economic research to see whether culture has been included in
the analysis or not. Most common is that research after 1950’s does not include culture but
rather saw it as incorporated in other variables, or simply as a residual (Guiso et al., 2006).
However, this has not always been the case. The importance of culture was lifted as early as
1759 when Adam Smith, in “the Theory of Moral Sentiments”, pointed out that tastes and
opinions are not objective but rather subjectively determined by culture (Ashraf et al., 2005).
After him the subject has been lifted by other famous scholars such as Max Weber and Karl
Marx. The seminal work “the Protestant Ethic and the Spirit of Capitalism” by Weber in 1905
suggested, based solely on observations in Italy, that different cultures generates different
economic outcomes (Throsby, 2001). Later research, such as Ingelhart and Baker (2000) and
Tabellini (2010), worked with the issue more empirically and found support for his claim. Marx
raised an opposing view in 1859, advocating that it is the economic and technical structures in
a society that determines culture (Kolakowski, 1978). This view suggest a reversed causal
relationship and authors Guiso et al. (2006) finds that Marx’s view, revised to fit neo-liberal
ideas, was generally accepted by the majority of economic researchers after the 1950’s.
It was not until more recently economists started to view culture as an important determinant
for economic outcomes again and hence there is not a lot of modern research done on the issue.
One example used frequently in recent literature, which aims at incorporating culture as a
determinant, is the case of Italy (Guiso et al., 2003; Tabellini, 2008). Where the southern and
the northern parts exhibits widely different economic outputs and varying effectiveness in their
institutions. This differences research suggest are due to the north and south having distinctly
varying cultures which stems from historical differences (Alesina and Giuliano, 2013). This
example complies with Weber’s view, rather than Marx’s, that historic cultural patterns remain
in societies and continue to affect their institutions and economies years later.
As previously stated there has recently been a shift in the view of culture by economists which
now see it as a driving factor behind different economic outcomes. For researchers to be able
13
to place culture in modern economic research a computable variable is needed. In many papers
this has been done using survey variables based on sociological definitions of what constitutes
culture and especially variables believed to effect economic behaviour (Gusio et al., 2008;
Inglehart and Baker, 2000).5 Others have used a more experimental approach, such as Bornhorst
et al (2004) where students play a repeated trust game to find different cultural traits.6
In the research reviewed for this paper focus has been on the survey studies, since they are more
common and in line with the aim of this study. Most of these have included a variable measuring
level of trust. Another cultural aspects used are religion, even if this is harder to measure in an
efficient manner and thus harder to include in econometrical studies (Blum & Dudley, 2001).
Furthermore, researchers have included respect for others, family ties, views on shirking
behaviour among other things to capture the multifaceted concept of culture (Fernandez, 2008;
Gusio et al., 2008). Of course there are many other aspects of culture which affects institutions
and economic outcomes. This is what makes the concept of culture hard to measure and
impossible to completely capture. The complex nature of measuring culture lies beyond the
scope of this paper and the variables used will therefore follow previous research.
3.1 Generalised versus limited morality Measures of trust are included in most reviewed studies because high levels of trust are assumed
to lead to generally ‘better’ economic outcomes. The theory behind this is that if trust between
agents are high, both institutions and economic interactions will run smoother, leading to more
economic transactions taking place and of a more complex nature. In the long run this generates
a more economically prosperous society (Guiso et al., 2006; Tabellini, 2008).
Following the literature, the issue of societies placing different value on something called
generalised versus limited morality is argued to be the reason why trust differs between societies
(Tabellini, 2008). The concept limited morality is used to describe cultures where trust, honesty,
unselfishness and other generally desirable characteristics are confined to the innermost social
circles. Outside of this circle selfish, greedy and opportunistic behaviour is viewed as justified
and acceptable (Alesina and Giuliano, 2014). This is contrasted to generalised morality where
such behaviour is frowned upon regardless of in what context it takes place. Empirics show that
countries with cultural values aligning with generalised morality exhibit more efficient
institutions (Tabellini, 2008). Consequential work by Platteau (2000) show that countries
religious and political histories are highly correlated with what type of morality that is
5 These articles and their methods are further discussed in chapter 5. 6 For other experimental studies see for example Joseph et al. (2001) or Hoff and Pandey (2004).
14
prevailing today. He argues that societies with much hierarchical histories tend to favour limited
morality. This view is supported by the findings of Tabellini (2008) which indicates that
societies with a non-despotic history are inclined to follow generalised morality today.
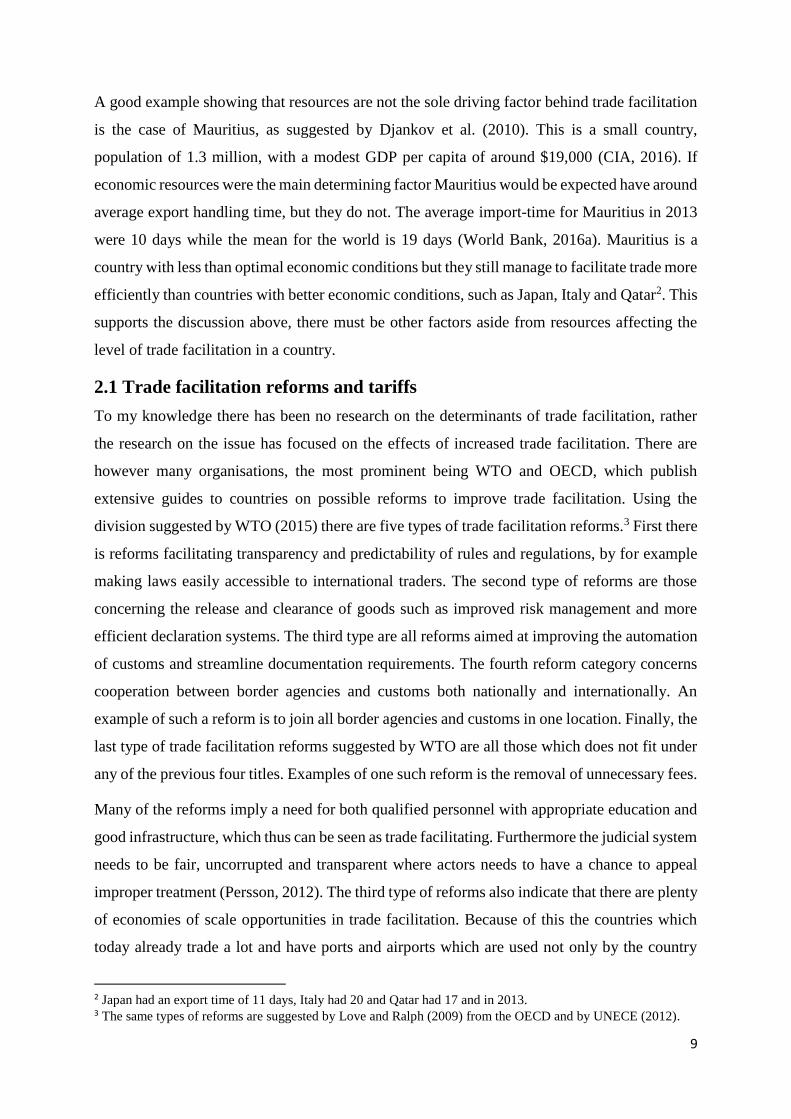
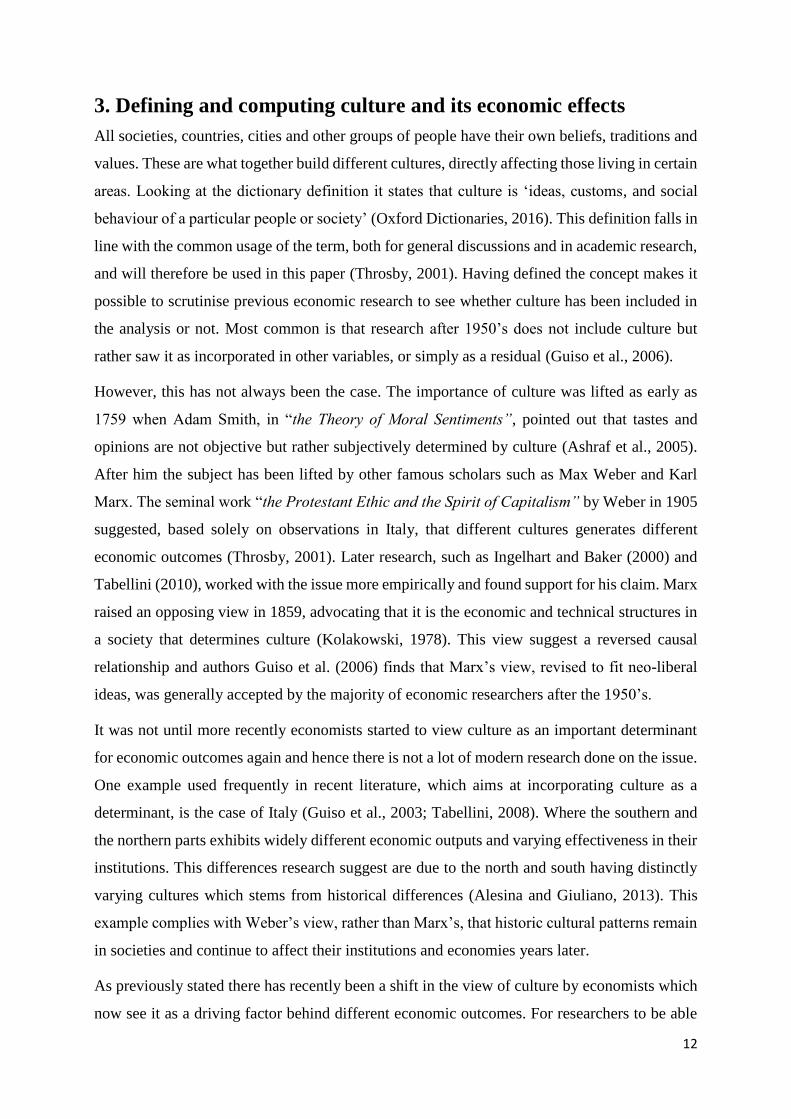
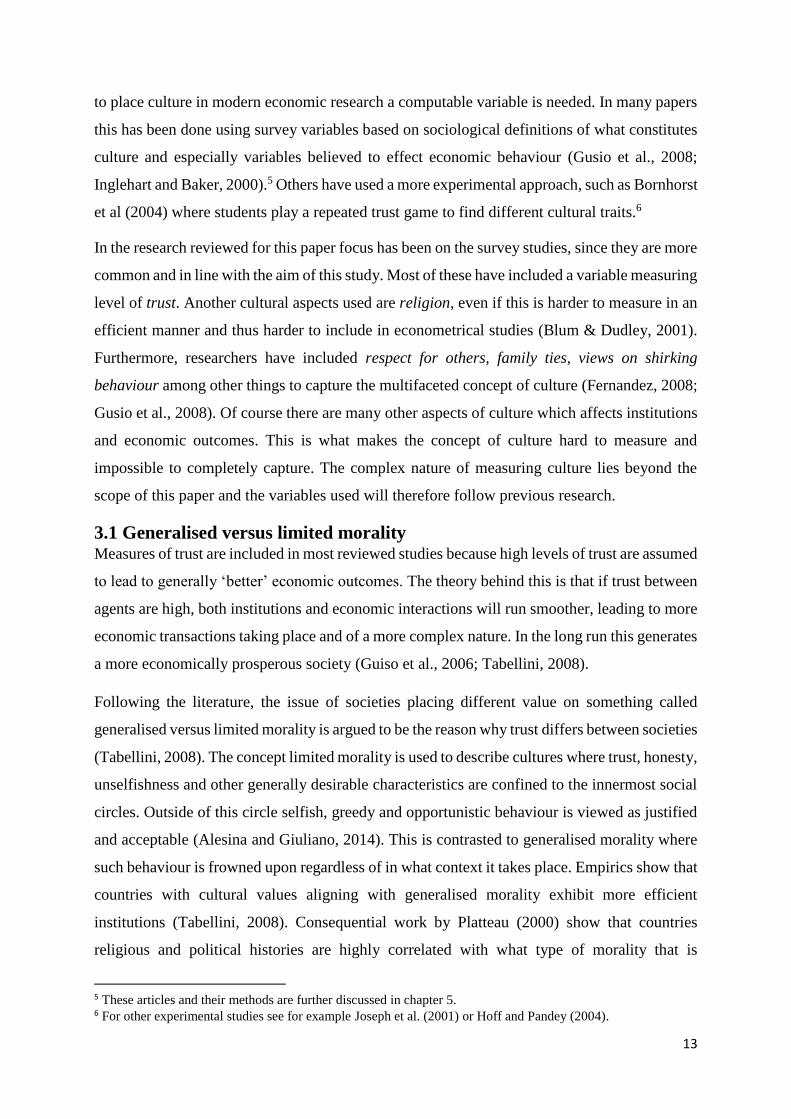
In figure 3 below it is graphically shown how the cultural and religious histories of countries
affects values. Countries are plotted according to two groups of values, traditional versus
secular and survival versus self-expression values (WVS, 2016).
Figure 3: Countries plotted according to their responses in WVS, historical-religious regions are indicated.
We can see that countries in Europe with a protestant history value secularism and self-
expression while African and Islamic countries value the opposite. These findings fall in line
with the discussed empirical results on generalised morality, where hierarchical and despotic
societies place importance traditional and survival values (Ingelhart and Baker, 2000). Other
research also finds evidence supporting both figure 3 and the generalised morality hypothesis7.
The studies cited in this section use a range of variables to measure if limited or general morality
is the prevailing culture in a society. As previously mentioned a common denominator for most
studies are that they use trust as part of the measurement. There are of course other cultural
aspects that also affect effectiveness of institutions. One such aspect is specified in Tabellini's
7 See Greif (1994), Inglehart and Baker (2000), and Guiso et al. (2003) for such empirical work.
15
(2008;2010) work where it is suggested that societies with high levels of generalised morality
have lower levels of shirking in the labour market8. Going back to the building blocks of
generalised mortality: honesty, respect and unselfish behaviour, this is indeed intuitive.
This theory is supported by empirics where, again, the case of Italy and the divide between
north and south is exploited. It is found that in the same company shirking is significantly more
common in the south, even when controlling for possible firm differences between the branches
(Ichino and Maggi, 2000). A way to measure this difference in attitude towards work ethic and
honesty suggested by both Guiso et al. (2003) and Tabellini (2008;2010) which looks at
respondents answer to a question regarding their views regarding cheating on taxes or avoiding
fare on public transport. From basic economic theory and general intuition, we know that
shirking increases costs and reduces effectiveness in institutions. This would imply that
societies where shirking is common practice would have less efficient institutions. As trade
facilitation is made up, to large part, by different institutions reasonable to believe that
generalised morality will have a positive impact on that too.
3.2 The persistence of culture
As previously discussed there has been a debate regarding the direction of causality between
culture and economic outputs. Empirically however there have been credible results showing
that culture is transmitted through generations and hence stable to shorter term changes in the
economy. Fernandez (2008) reviews several studies focusing on the transmission mechanism
of culture by looking at second-generation migrants to the US. Using different methods all
studies show that the cultural traits in children of migrants align more with their parents’
country of origin than with the average US culture. Tabellini (2008) shows that religious beliefs
and political ideologies are more similar between members of a family than in groups of friends.
Suggesting that moves and adult influences does not change the core values of individuals.
This persistence of culture throughout the ages and its reluctance to change with new influences
contradicts Marx’s hypothesis, that varying economic situations creates different cultures.
Hence it rejects the notion of a problem with reversed causality when looking at culture’s effect
on institutions and economic outcomes. Regardless of this the problem of reversed causality
might be important when looking at other types of institutions but not when, as in this case,
trade facilitation is dependent variable. This because it is rather farfetched to assume that
different levels of trade facilitation causes varying cultural traits in the society. Combining the
8 Shirking is the term for all kinds of behaviour that is undesirable in the workplace, such as being absent or lazy.
16
empirical findings with this intuitive reasoning it is evident that reversed causality is not an
issue in this case.
3.3 Measuring culture
The data on culture is, as in most literature, taken from the WVS (World Bank, 2016b). A
survey on culture and values done in waves of around 60 different countries where on average,
1500 respondents are chosen through stratified sampling in each country. The first wave was
conducted in the early 1980’s and the last, wave 6, was concluded 2014. Given the widespread
usage of WVS it is assumed to be sufficiently scrutinised to be regarded as a reliable source.
Alone this study covers most of the world’s countries over a long period of time making it
suitable for panel analysis. However, this data is combined with the sources of data for the
dependent variable discussed in section 2.2, covering only the years 2006 to 2014. Limiting the
dataset to WVS’s wave 6 and wave 5 and observations gathered in or after 2006, leaving the
study to cover at the most 71 countries with a maximum of 107,841 observations. This number
is decreased in some cases because: some questions are not asked in all countries, some
countries lack data on trade facilitation and some respondents opted to not answer all questions.
Given the fact that there are only some countries which are covered by both wave 5 and 6
including these would skew the results. Because there is almost no variation in cultural values
between the waves and there are little changes in trade facilitation which would give extra
weight to these countries in the regressions. To avoid any skewness only the most recent wave
is used in each country. The waves are conducted over time but in the same year for any specific
country. Thus the dataset has been put together so that the values for trade facilitation and the
control variables matches the year the survey was conducted.9 Descriptive statistics of culture
and the control variable is presented in section 6.2.1.
9 Doing this type of matching instead of using the same year for all countries eliminates the possibility of there
being any discrepancies between the measure of culture and level of trade facilitation.
17
4. Theory
In the previous sections theory regarding the effects and determinants of trade facilitation and
culture has been presented, based on previous research and on reports from organisations. It has
been made clear that culture is passed down through generations and that it is one of the
determinants behind economic outcomes such as the effectiveness of institutions (Gusio et al.,
2002;2006; Fernandez, 2008). The theory of generalised morality suggests that countries with
these types of values will perform better in a strictly economic sense (Alesina and Giuliano,
2014). It is also suggested that these values are more prominent in countries with a democratic
and non-hierarchical history (Ingelhart and Baker, 2000).
A large part of trade facilitation in general is made up by the effectiveness of different
institution. This is particularly true when looking at the management of exports where customs,
logistics services, law enforcement are examples of such institutions (Love and Ralph, 2009;
UNECE, 2012). Rephrasing the statement above using trade facilitation, knowing how and to
what extent a country’s culture affects for example the time to export would give indications as
to what areas reforms should be focused on. Theory would thus suggest that culture will affect
trade facilitation in the same direction and through the same channels as it has been found to
affect other institutions.
This would indicate that the more a country’s values align with generalised morality the better
trade would be facilitated since customs, logistics and judicial systems are expected to be more
efficient. In chapter 3 other values, such as religion, are also a proven to affect institutions.
These should also theoretically affect trade facilitation in the same manner they affect other
economic institutions. For example, generalised morality values condemn being immoral and
lazy even outside a person’s innermost circles. In a culture where such values are dominant it
should be frowned upon to shirk on the job. Common sense, as well as economic theory, would
argue that this is good for a country since less shirking leads to higher productivity. In the case
of trade facilitation and more specifically management of exports they too are expected to be
more efficient if the employees are more productive.
4.1 The determinants of trade facilitation
Just by economic intuition and looking at figures 1 and 2 in chapter 2 it is evident that economic
resources must be one of the driving factors of trade facilitation. They show that even if there
are disparities in days to export within the OECD countries, suggesting that resources is not the
sole driving factor, these countries are still better at facilitating trade than many other countries.
18
Because of this, most literature on trade related issues incorporates resources in some capacity,
such as Iwanow & Kirkpatrick (2009) and Djankov et al. (2010). In most cases both GDP and
GDP per capita is included to cover both the size of the economy and the general standard of
living.
Another prerequisite for good trade facilitation is that countries must want it. If a country wants
to be highly protectionist they could intentionally keep policies in place, or just not invest in
improvements, to lower competition for domestic firms. As stated in chapter 2, keeping high
tariffs can be viewed as one possible protectionist policy countries can choose to implement
(Love & Ralph, 2009). Since this is a computable measure it is easy to use as a variable
indicating the level of protectionism in a country, signalling how desirable improving trade
facilitation is for any given country.
There are of course other things countries need besides resources and desire to achieve good
trade facilitation such as good infrastructure with good roads, ports and airports. One condition
which stands out in the literature is the need for reliable, cheap and accessible internet
connections. This because many parts of trade facilitation in general is eased immensely by the
use of online systems instead of physical ones (Duran and Sokol, 2005; Iwanow and
Kirkpatrick, 2007; Persson, 2008).
Following the discussion on trade facilitating reforms in chapter 2 there is also a need for
workers and managers with sufficient education. The managers need to be able to lead reform
work and to be innovative while the other employees are required to be quick learners of the
new systems (Love and Ralph, 2009; Persson, 2012). These qualities demand adequate levels
of education in the general population, since this is the pool of labour from which employees
to the different institutions are hired.

19
5. Previous research
The lack of previous research on the determinants of trade facilitation in general and on
culture’s effect on it in particular forces the study to build on research done on related issues
instead. These are studies on the effect of culture on other economic outcomes and on the effects
of trade facilitation rather than on the determinants. To simplify the reading, the papers will be
presented chronologically and divided into two parts: previous research on culture and previous
research on trade facilitation.
5.1 The effects of culture
Ichino and Maggi (2000) breaks new ground in the empirical field of culture economics by
investigating the reasons behind the different levels of shirking in one large Italian firm.
Reported incidents of shirking are significantly more common in the firm’s southern branches.
To find the reasons behind this difference the authors uses regular OLS regression framework.
The authors control for individual employee characteristics, work environment and branch
characteristics and single out workers that moves between the regions. It is concluded that
shirking on the job is a consequence of individual background but also of sorting and group
interaction. Suggesting that there are some cultural traits in southern Italy which justifies
shirking to a greater extent than in the north.
Authors Ingelhart and Baker (2000) illustrates how countries can be mapped according to two
main cultural indicators: traditional versus secular and survival versus self-expression values.
Which exposes patterns of cultural affiliation, see figure 3 in section 3. To see if these patterns
are significant the authors regress them on variables measuring the levels of modernisation
(GDP per capita, education etc.), all but one region is significant indicating that they are
acceptable.
Another paper telling the causal story of culture’s effect on economic outcomes are Gusio et al.
(2003). The paper aims at empirically, using OLS with fixed effects, compute the effect of
religion on cultural and economic attitudes. It is found that being religious foster attitudes
aligning with preferable economic outcomes and that Christian religions do so to a larger degree
than Islamic ones. An issue with the study, also noted by the authors, is that there is no
difference in what magnitude the different attitudes actually affects economic outcomes.
The papers presented above are important since both help create a foundation where culture is
shown to be important and historically connected. This further confirms the more econometrical
findings of coming studies.
20
Bornhorst et al. (2004) is one of few experimental studies in the field. The experiment is a
repeated trust game with students from different European countries. The students get to choose
their partners knowing the other players’ origins. It becomes clear that southerners are
discriminated against by northerners in the number of times they are chosen as partners.
Interestingly enough this discrimination increases as the game progresses. The authors interpret
this as a punishment of the low trust, indicated by low offerings, southerners themselves place
in others.
One of the first to try to empirically find a causal relationship between culture and economic
outcomes is Gusio et al. (2006). Done using instrumental variables (IV) to counter the issues of
reversed causality and omitted variable bias. The analysis is done in three step. First the direct
effect of culture on economic preferences is shown followed by an illustration of how these
preferences effect economic outcomes. Finally, the causal link is established by using time
invariant culture variables as instruments for preferences. Their results show that, using OLS,
trust affects the outcomes positively which hold true when using the IV, indicating that reversed
causality is not an issue. They also publish a paper which shows how cultural traits are
transmitted through generations using answers to questions regarding the justifiability of
uncooperative behaviour such as cheat on taxes and accepting bribes (Gusio et al., 2008).
Two other papers investigating the causality between culture and institutions and economic
development respectively are Tabellini (2008;2010). The paper from 2008 uses a principal
component analysis (PCA) strategy to see if there is a positive effect of generalised morality
values on institutions10. He uses the first component of variables on trust and respect as an
indication of generalised morality and regresses this on the first component of quality of
government. It is found that in societies with generalised morality values, institutions are
significantly more efficient and that these countries have a longer history of non-despotic rule.
In the 2010 paper Tabellini uses instrumental variables to look at the within-country variation
of economic outcomes in Europe and the varying cultures in these regions. The study uses
historical data on literacy and political institutions as independent variables regressed on the
current economic development of the regions. The historical variables are regarded as
instruments for culture which again are indications generalised morality. It is found that the
components of generalised morality, due to history, are significantly positive for economic
development.
10 PCR and the meaning of “component” is explained in section 7.2.
21
One of the more recent papers is Alesina and Giuliano (2013) which focus more strictly on the
effect of different cultural traits on institutions. This is a review study critically investigating
the published work on the issue. The authors look at culture using measures of: family ties,
generalised morality, individualism, trust and work versus luck as measurements for the
different cultural traits. By doing so they find evidence implying that culture affects the
effectiveness of institutions, in different directions depending on the measurement. However,
they also frequently point out that institutions also have an effect on culture and conclude that
there is not enough satisfactory work done to properly decipher the direction of causality.
Combined the reviewed literature suggest that, using different measurements, culture does
effect institutions and other economic outcomes. They find that values aligning with generalised
morality tend to have a positive effect while limited morality has the opposite effect. The most
commonly discussed problem with the studies are reversed causality and omitted variable bias.
Assuming trade facilitation is affected by culture through similar channels as other institutions,
generalised morality will be expected to have a positive here as well.
5.2 The effects of trade facilitation
As discussed there is a gap in the field of trade facilitation where no, or little, research has been
conducted on the determinants. There are however plenty of studies on the effects of trade
facilitation and these are reviewed here. Mainly they will help illustrate the importance of
finding the determinants, since having good trade facilitation today is a comparative advantage
when it comes to attract international trade. Also the studies will also show what measurements
of trade facilitation are most commonly used.
Early work on the issue of the effects trade facilitations has on trade, such as Wilson et al.
(2003) and Nordås et al. (2006), did not use any standardised measure of trade facilitation,
likely because none were available. The former of the two instead created four indicators of
trade facilitation: port efficiency, customs and regulatory environment and E-business usage,
while the latter used time to export instrumented by control of corruption. They both find that
trade increases with the measure of trade facilitation.
More recent papers use databases set up by organisation to measure different parts of trade
facilitation, where the World Bank’s “Doing Business” database (DBD) is the one most
commonly used. More specifically some authors use information on the time it takes to export
or import to/from certain countries. Examples of such literature are Djankov et al. (2010) and
(Bourdet and Persson, 2012;2014). In line with the older papers these also find that increased
22
trade facilitation, which in this case is manifested by decreasing the time it takes to trade,
increases trade. Despite looking at different types of countries they all conclude that reducing
the time to trade with 10% increases trade volumes with 4-6%11.
Other have used more variables from the DBD to create indices which are used as measurements
of trade facilitation. Studies by Iwanow and Kirkpatrick (2007;2009) both use this strategy and
their indices include time, documents and costs to trade. The results, again, indicate that
increased trade facilitation leads to increased trade. The point estimates suggest that increasing
trade facilitation with 10% yields a 4% or 2% increase in exports respectively.
Aside from using data from DBD, Iwanow and Kirkpatrick (2007) also build an index on data
from the World Economic Forum’s “Global Competitiveness” database (GCI). This approach
and data is also used by Lee and Park (2007) even if the index uses slightly different variables12.
The point estimates suggest that a 10% increase in the trade facilitation index indicate increased
exports with 5% and increased trade with 6% respectively.
11 Djankov et al. (2010) looks at time to export and finds that a 10% decrease in time leads to a 4% increase in
export volumes. When Bourdet and Persson (2014) looks at time to export they find that the same increase in
time indicates a 6% increase in export volume. They also look at time to import and find that a 10% reduction in
time suggest a 3% increase in export volumes. In their 2012 study this estimate is 4%. 12 The index used by Iwanow and Kirkpatrick (2007) uses the variables “hidden export barriers” and “irregular
payments in exports and imports” while Lee and Park (2007) also uses “irregular payments” and “hidden
barriers” but also includes “port efficiency” and “bureaucracy”.
23
6. Methodology
In this section the data sources for all variables included in the study are presented and discussed
followed by the theory behind the inclusion. In the subsequent sections the empirical method,
main results and principle component analysis (PCA) and results using this will be reviewed.
6.1 Empirical method
Due to the fact that there is no previous research on this issue and that there is no economic
theory regarding the effect of culture on trade facilitation, constructing an empirical model is
not entirely straightforward. The suggested model will be built on the empirical studies on the
effects of culture on other economic outcomes, on the discussion on trade facilitation reform
and on literature about trade protectionism. Given this, that there are no previous models to
build on, the model used will be consistently checked for robustness.
The main model will regress, using ordinary OLS estimation, variables suggested by literature
to indicate different cultural traits associated with diverging economic outcomes on a measure
of trade facilitation.13 Noting that the two indications of trade facilitation measure different
aspects of trade facilitation and therefore will produce slightly different regression results.
These results should however go in the same direction. Meaning that if the results support the
hypothesis they should suggest that culture has an effect on trade facilitation and that despite
giving different point estimates they both confirm this effect.
Equation 1 below shows the outline of the main regression used in the study.14 Where X
indicates all the cultural variables. Z represents variables aside from culture that are assumed
to affect trade facilitation and thus need to be controlled for, doing so will reduce the residual
variance which produces better point estimates of the cultural variables (Angrist & Pischke,
2009). The variables measuring culture are on individual respondent level while the dependent
and control variables are at the country level. Using this approach will include all information
the variables can provide but it does create a problem with autocorrelation since all observations
within each country will have the same values for the dependent and control variables15. This
leads to a case where if one individual within a country were to be overestimated in the model
13 Ideally the study would not use OLS but rather a panel type estimation using fixed effects. This is not possible
due to the limited amount of observations available, discussed further in 6.3. 14 This equation will, in some cases, be extended to include dummy variables for geographic location and
majority religious denomination. 15 Autocorrelation implies that there is correlation between the error terms of different observations. In the
normal case, without autocorrelation, the relationship between different observations error terms looks like:
𝐶𝑜𝑣(휀𝑎, 휀𝑏) = 0 and 𝐶𝑜𝑟𝑟(휀𝑎, 휀𝑏) = 0 where a and b are separate observations. When these fail, meaning that
the covariance or correlation between error terms is no longer 0, autocorrelation is present (Verbeek, 2012).
24
the other individuals in that country would most likely overestimated as well. To correct for
this the standard errors are clustered at the country level. Using country clustered errors does
reduce the degrees of freedom in the study since there is no extra information introduced in the
country level variables but it allows for the individual information to be used.
𝑌𝑗 = 𝛽0 + 𝛽1𝑋𝑖 + 𝛽2𝑍𝑗 + 휀𝑗 (1)
Data on culture will be coded to positive or negative responses because the scales differ between
questions. Because of the arbitrary and somewhat subjective view of what constitutes a positive
answer, a sensitivity control will be performed. Done by running the same regressions again
but moving the limit of being a positive answer one point on the scale. There is another control
performed where the answers remain uncoded, which introduces more information to the model
but is harder to interpret, and one where a third measurement of trade facilitation is used.
6.2 Choice of variables
There is no generally accepted economic theory of what culture is and how exactly it should be
measured. Neither is there, to the best of my knowledge, any established models using trade
facilitation as dependent variable. To avoid creating a model which produce the desired
outcomes by picking the variables at will, this study will only include variables which are
suggested by previous research on other, similar, topics.
The WVS has been used in economic research to establish a relationship between economic
outcomes and culture previously, as discussed in chapter 3. In table 2 below, the variables used
by the reviewed literature are explained. Done by listing the survey questions asked, how they
are coded and which studies used the indicator previously. There can always be arguments for
including more questions and for including less. In a pilot study like this however, following
previous studies is a safe approach when deciding on which variables to include.
These variables are phrased so that giving positive answers sometimes indicates values and
cultural traits which are seen as positive to economic outcomes and sometimes as negative. As
previously stated it is expected that the traits found to have positive effects on other economic
outcomes also have positive effects on trade facilitation and vice versa for the unfavourable
traits. The ones assumed to have a positive effect on trade facilitation are: respect, the different
variables measuring religious faith, trust, hard work and those measuring the degree of dislike
for shirking behaviour. On the other hand, the ones expected to be detrimental to trade
facilitation are: Obedience, parents proud and control. Generally, the variables expected to
25
have a positive effect are related to the concept of generalised morality while the remaining
variables are related to limited morality values.
Table 2: All included culture variables discussed and referenced.
When choosing control variables, the same approach is used; only those suggested by previous
literature are included. In this case relying on the literature regarding trade, tariffs and trade
facilitation. These control variables are included to catch variation in trade facilitation that is
due to things other than culture. Again there being omitted variables cannot be ruled out.
All control variables are explained in table 3 below. Most are expected to have a positive effect
on trade facilitation with the exception being average tariffs. They are included as a
measurement of the level of protectionism. If countries have high average tariffs they are
viewed as protectionist and assumed to not want to increase their trade, thus not wanting to
improve their trade facilitation. The resource variables: GDP, GDP per capita and net aid
Variable Coded in study References
Respect Tolerance and respect If mentioned coded as one.Ingelhart and Baker (2000)
and Tabellini (2008;2010)
Religous faith Religious faith If mentioned coded as one. Gusio et al. (2003)
Obedience Obedience If mentioned coded as one.Ingelhart and Baker (2000)
and Tabellini (2010)
Trusting
If respondents answered: "Most
people can be trusted" they are
coded as one.
Ingelhart and Baker (2000),
Gusio et al. (2003),
Tabbelini (2010; 2008) and
Alesina and Giuliano (2013)
Parents proud
If respondents answered
"Agree" or "Strongly Agree"
they are coded as one.
Ingelhart and Baker (2000)
and Alesina and Giuliano
(2013;2014)
Hard work
Answers 1-3 are coded as one
where 1 is "Brings a better life"
and 10 is "Up to luck and
connections"
Gusio et al. (2003) and
Alesina and Giuliano (2013)
Times religious
Answers where respondent
goes to services more than
once a year are coded as one.
Ingelhart and Baker (2000)
and Gusio et al. (2003)
Religious person
Coded as one if respondent
answers that she is a religious
person.
Gusio et al. (2003) and
Alesina and Giuliano (2013)
Claiming benefitClaiming benefits to which you are
not entitled
Answers 1-3 are coded as one
where 1 is "Never justifiable"
and 10 is "Always justifiable"
Gusio et al. (2003;2008)
Avoiding fare Avoiding fare on public transport
Answers 1-3 are coded as one
where 1 is "Never justifiable"
and 10 is "Always justifiable"
Gusio et al. (2003;2008)
Cheat tax Cheating on taxes
Answers 1-3 are coded as one
where 1 is "Never justifiable"
and 10 is "Always justifiable"
Gusio et al. (2003;2008)
BribeSomeone accepting a bribe in the
line of their duties
Answers 1-3 are coded as one
where 1 is "Never justifiable"
and 10 is "Always justifiable"
Gusio et al. (2003;2008)
Survey question
Apart from weddings and funerals, about how often
do you attend religious services these days?
Independently of whether you attend religious services
or not, would you say you are: a religious person, not
religious person or an atheist?
Please tell me to
what extent …
can be justified.
Generally speaking, would you say that most people
can be trusted or that you need to be very careful in
dealing with people?
Which qualities
do you consider
to be especially
important for
children to be
encouraged to
learn at home?
One of my main goals in life has been to make my
parents proud.
Do you think that hard work generally brings a better
life or is it more up to luck and connections?
26
received on the other hand are expected to increase the probability of good trade facilitation.
Being a large economy, having a large GDP, allows countries to use economies of scale while
having large GDP per capita indicates that there are resources to spend on trade facilitating
measures. Receiving aid does indicate that the country does not have a lot of resources to spend
on trade facilitating reforms. Although, it does also indicate that these countries have more
resources than those with the same GDP per capita not receiving as much aid. The latter should
be the dominating effect since resources are already controlled for.
Having a large export sector is also something that allows a country to use economies of scale
thus having better trade facilitation than what only resources would indicate. As for good legal
rights this too is something that the literature suggest would lead to better trade facilitation.
Even if the estimate included here only covers the protection of lenders’ and borrowers' rights,
which on its own is important for international traders, it indicates the performance of the entire
legal system. A strong, predictable and fair legal system makes trading with that country easier.
Table 3: All included control variables discussed and referenced.
6.2.1 Describing the data on culture
The data is stable in regards to gender composition, the counties vary from 36% female
respondents in Kuwait to 67% in Egypt. There are larger discrepancies in the age composition
but because life expectancy also varies this is to be expected and not reason to doubt the
sampling. In table 4 below it is described how the cultural variable are distributed. In the first
column variables are coded so that positive answers to any question asked are coded as 1’s and
Variable Explanation Used in study Source References
GDP/Capita
GDP per capita is gross domestic
product divided by midyear population.
Data are in constant 2005 U.S. dollars.
Matched with the year the WVS
were performed in each country.The World Bank
Iwanow and
Kirkpatrick (2009),
Djankov et al. (2010)
among others
GDP
GDP is the sum of gross value added by
all resident producers in the economy.
Data are in constant 2005 U.S. dollars.
Matched with the year the WVS
were performed in each country.The World Bank
Iwanow and
Kirkpatrick (2009),
Djankov et al. (2010)
among others
Average tariffs
Weighted mean of applied tariffs by the
product import shares. Data are
classified using the Harmonized System
of trade.
Used with country data for the
year of the WVS in that cuntry.
If data is missing a year the
closest is used instead, starting
with the coming year.
The World Bank
Baldwin (1982) and
Love and Ralph
(2009)
Aid recieved $
Net official aid refers to aid flow from
official donors to developing countries.
Data are in constant 2012 U.S. dollars.
Matched with the year the WVS
were performed in each country.The World Bank WTO (2015)
Exports as
percentage of
GDP
Total exports of merchendice and
commercial services as a percentage of
GDP.
Matched with the year the WVS
were performed in each country.
The Global
Competitveness
Report
Maur (2011)
Legal rights
index
Degree of legal procetion of borrowers'
and lenders' rights. Scale of 1-1 where
10 is the best possible protection.
Matched with the year the WVS
were performed in each country.
The Global
Competitveness
Report
Persson (2012),
WTO (2015)
27
negative answers as 0’s. The second column shows the distribution of the uncoded data.
Looking at the standard deviation from the mean values it is clear that there are differences in
how countries for example value things such as religion and how trusting they are of other
people. All variables have over 100,000 observations and the differences in observations is
because all questions were not asked in all countries and some respondents chose not to answer
all questions.
Table 4: Descriptive statistics of the included culture variables.
6.3 Limitations
This study is built on the fact that country observations from 2006-2014 are comparable,
implying that there are no great shifts in the data. There are no two surveys where the same
individual’s cultural values are measured more than once which makes it hard to control for.
Going back to the previous literature on culture they have found it to be stable over time because
values are inherited through generations not changed by present conditions (Fernandez, 2008).
A general issue with this study is that it relies, to the most part, on different types of survey data
which is not as unbiased as calculated values. Answers to questions are subjective, it is possible
that individuals understand and interpret the questions differently. This is not an issue when it
comes to culture since these differences are part of what the questions are aimed at catching.
Still it might be a problem when parts of the trade facilitation data are collected through surveys.
Relying on the fact that both measures included in the study are used frequently in the literature
this is not a big problem and using both measures further reduce the problem since the survey
questions used are not identical and comes from different sources.
There is also a problem with possible endogeneity. There are plenty of possible omitted
variables in most studies but as a certain issue is researched the possibility that these variable
Variable Label Obs Mean Std. Dev. Obs Mean Std. Dev.
V16 Respect 107833 0.68 0.4666 107833 1.32 0.4666
V19 Religious faith 107824 0.42 0.4943 107824 1.58 0.4943
V21 Obedience 107823 0.41 0.4918 107823 1.59 0.4918
V24 Trust 104491 0.26 0.4384 104491 1.74 0.4384
V49 Parents proud 104324 0.87 0.3386 104324 1.68 0.7672
V100 Hard work 105258 0.57 0.4947 105258 4.15 2.8111
V145 Religious services 102540 0.45 0.4970 102540 4.01 2.1952
V147 Religious person 102406 0.69 0.4613 102406 1.36 0.5808
V198 Benefits 104896 0.79 0.4106 104896 2.73 2.5243
V199 Avoiding fare 105715 0.81 0.3936 105715 2.57 2.3667
V201 Cheating on taxes 101017 0.86 0.3487 101017 2.23 2.1309
V202 Accepting bribe 105698 0.89 0.3099 105698 1.94 1.9021
Coded answers Uncoded answers
28
are important enough to cause severe bias is reduced. In this case there is no previous literature
and given this the risk has to be considered greater. Using literature on connected issues is the
only way to try and control for this but there is no way of ever being sure that all variables
affecting trade facilitation are included in the model.
Regardless of what method that were to be used there is a problem in the study with the dataset
containing very few observations. This is not because the WVS is lacking in responses but
rather that the number of countries in the study is low. The problem with the few number of
observations in this study is that it is easy to over-fit the model, trying to explain too many
variables with too little information (Knutsen and Moses, 2012). 16 There is a widely used rule-
of-thumb that every extra variable included there needs 10 more observations. In this case using
more than six or seven variables will over-determine the model, seeing as there are 12 cultural
variables suggested by the literature this is a pressing issue. PCA is used, partly, to try to deal
with this issue but regardless there will still be hard for the model to find statistically significant
effects in the data.
Previous research suggests that cultural variables not only affect trade facilitation but that it
also has a direct effect on different economic outcomes, among them GDP and GDP per capita.
This would be, what is commonly called, a bad control problem, more specifically a version of
the issue called proxy control. When such controls are included they are likely to cause the
estimates of the culture variables to be underestimated, while excluding the controls will
probably overestimated the culture variables.17 Running regressions with and without these
controls will thus create a credible interval in which the true estimate can be found.
To further challenge the results there is the issue that the control variables are suffering from a
simultaneity problem, that they to some extent are dependent on the level of trade facilitation.
For example, previous research on trade facilitation finds that it increases trade which in turn
increase GDP per capita. Which would mean that these two variables affect each other
simultaneously.
There are two main ways of dealing with this issue where the first is to use lagged variables on
the endogenous variable, in this example, GDP per capita which does not entirely remove the
16 Clustered error terms also correct for heteroscedasticity by allowing for them to not having to be identically
distributed nor independent of each other, which they obviously are not given the need for clustering in the first
place. (Cameron and Trivedi, 2009; Verbeek, 2012) 17 In section B of the appendix the reasons for the direction of the bias is explained (Angrist & Pischke, 2009).
29
endogeneity problem but rather suggest there to be predeterminedness (Verbeek, 2012).18 The
second way is to find a good instrument. Where a good instrument is a variable which is not
determined by the dependent variable, which in this case is the measurement of trade
facilitation, but highly correlated with GDP per capita. It is not easy to find perfect instruments
and introducing weak instruments to the model is also problematic. To my knowledge there is
no generally accepted instruments for GDP or GDP per capita, nor for any of the other controls.
18 Something is predetermined when a shock today does not affect yesterday or today’s levels of something else,
but affects the value of tomorrow. Which in more technical terms mean that the present error terms are
uncorrelated with the past and present but correlated with future errors.
30
7. Main regression results
Running the suggested main regression, using clustered standard errors, yields the results
presented in table 5 below. In the first three columns the variables are regressed on time to
export while in column four to six the dependent variable is the GCI measurement.
In both regressions the number of observations are large but the clusters quite few indicating
that there might be a problem of the model being over-fitted, because of this the results are to
be interpreted carefully. In regression model 1 there are four cultural variables which have a
significant effect on time to export: tolerance, wanting to make parents proud, being a religious
person and frowning upon the taking of bribes. Where the first and last have a negative impact
(increasing them is correlated with reducing time to export) while the other two have a positive
one. This falls in line with the theory on generalised morality presented in section 3.1. There
seems to be a positive relationship between good trade facilitation and generalised morality
values such as having higher levels of tolerance and disapproving of self-serving behaviour, in
the form of accepting bribes. Having strong family ties on the other hand falls under the term
limited morality and positively significant to time to export. Being religious is also positively
significant which contradicts research which found religion positive for economic outcomes.
This model is however prone to bias through omitted variables and as discussed in the previous
section this is likely to overestimate the coefficients. In model 2 all control variables are
included and in model 3 there are also dummies controlling for the countries religious majority
and geographical location.19 20 These results do not entirely fall in line with those from the first
model and the last three significant culture variables from that model is no longer significant.
The coefficient for being more tolerant is still significant in the third model but the magnitude
is severely diminished. In model 2 the coefficient is similar in magnitude, to model 3, but not
significant. Remembering the issue that some of the control variables are bad controls it is
reasonable to conclude that the effect is negative but that the magnitude is somewhere between
the values presented in the three models.
Looking at the regressions on the other dependent variable it needs to be noted that this
measurement of trade facilitation goes in the other direction, an increase suggests better trade
facilitation. Since using clustered errors makes it unreasonable to calculate standardised beta
19 To see the full results of these models, see section A of the appendix. 20 The religious denomination omitted is being officially non-religious or atheist and being located in Europe is
the omitted geographical dummy. The coefficients on these dummies should therefore be seen as the effect of
being part of the specific dummy compared to being in the omitted group.
31
coefficients there is no direct comparison of the coefficient magnitudes to be made between the
two methods. Interpreting the sign and significance levels are on the other hand possible and
more reasonable anyway because of the nature of the culture variables. The meaning of
increasing the culture variable by one unit is not straight forward and gives little meaningful
information. Tolerance is again significant and in the direction suggested by theory and the
previous regressions, the same is true for being a religious person. There are many culture
variables which are significant in model 4 but most lose their significance when controls are
included.
In all models where controls are included GDP per capita is significant suggesting that
increasing this will likely increase trade facilitation. This is not a surprising result and in line
with the theoretical reasoning. The same can be said for receiving aid, which is significant in
both regression models, and for the export share of GDP. In model three the only significant
dummy is being an Islamic country, where these countries are expected to have worse trade
facilitation than non-religious ones. For model three both the dummy for Islamic and Asian
religions are negatively significant while being located in East Asia is positively significant.21
Generally, it can be concluded that the results follow the hypothesis and that generalised
morality values tend to be significantly positive for trade facilitation while the limited morality
values are the opposite. The results are not entirely robust to the inclusion of control variables
which could indicate either that the relationship is weak or that the model is over-fitted when
more variables are included.
The fact that the significant coefficients changes slightly when different measures of trade
facilitation is could either suggest that they are not affected by culture in the same way.
However, these changes are largely between variables which can be assumed to try explaining
similar cultural traits. This is good cause for using principal component analysis. Using this
technique, the number of cultural variables will be reduced to only include components
explaining the different parts of culture.
21 Again these results can be found in section A of the appendix.
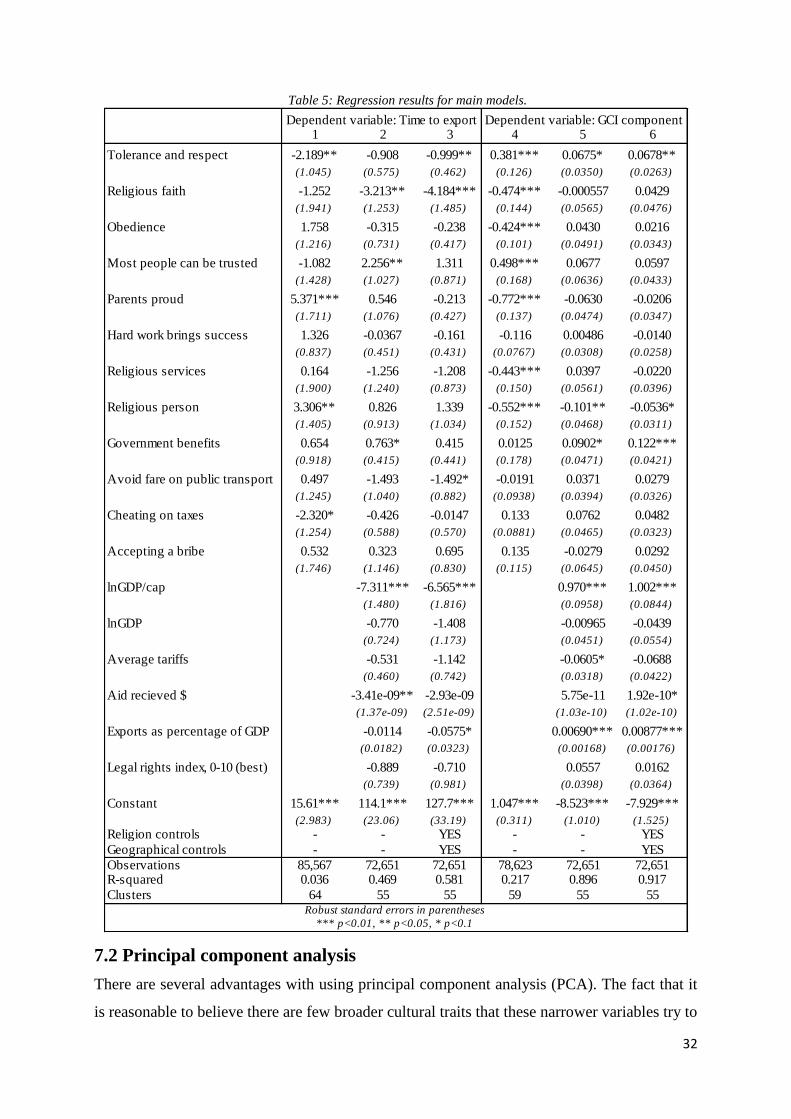
32
Table 5: Regression results for main models.
7.2 Principal component analysis
There are several advantages with using principal component analysis (PCA). The fact that it
is reasonable to believe there are few broader cultural traits that these narrower variables try to
1 2 3 4 5 6
Tolerance and respect -2.189** -0.908 -0.999** 0.381*** 0.0675* 0.0678**
(1.045) (0.575) (0.462) (0.126) (0.0350) (0.0263)
Religious faith -1.252 -3.213** -4.184*** -0.474*** -0.000557 0.0429
(1.941) (1.253) (1.485) (0.144) (0.0565) (0.0476)
Obedience 1.758 -0.315 -0.238 -0.424*** 0.0430 0.0216
(1.216) (0.731) (0.417) (0.101) (0.0491) (0.0343)
Most people can be trusted -1.082 2.256** 1.311 0.498*** 0.0677 0.0597
(1.428) (1.027) (0.871) (0.168) (0.0636) (0.0433)
Parents proud 5.371*** 0.546 -0.213 -0.772*** -0.0630 -0.0206
(1.711) (1.076) (0.427) (0.137) (0.0474) (0.0347)
Hard work brings success 1.326 -0.0367 -0.161 -0.116 0.00486 -0.0140
(0.837) (0.451) (0.431) (0.0767) (0.0308) (0.0258)
Religious services 0.164 -1.256 -1.208 -0.443*** 0.0397 -0.0220
(1.900) (1.240) (0.873) (0.150) (0.0561) (0.0396)
Religious person 3.306** 0.826 1.339 -0.552*** -0.101** -0.0536*
(1.405) (0.913) (1.034) (0.152) (0.0468) (0.0311)
Government benefits 0.654 0.763* 0.415 0.0125 0.0902* 0.122***
(0.918) (0.415) (0.441) (0.178) (0.0471) (0.0421)
Avoid fare on public transport 0.497 -1.493 -1.492* -0.0191 0.0371 0.0279
(1.245) (1.040) (0.882) (0.0938) (0.0394) (0.0326)
Cheating on taxes -2.320* -0.426 -0.0147 0.133 0.0762 0.0482
(1.254) (0.588) (0.570) (0.0881) (0.0465) (0.0323)
Accepting a bribe 0.532 0.323 0.695 0.135 -0.0279 0.0292
(1.746) (1.146) (0.830) (0.115) (0.0645) (0.0450)
lnGDP/cap -7.311*** -6.565*** 0.970*** 1.002***
(1.480) (1.816) (0.0958) (0.0844)
lnGDP/cap -0.770 -1.408 -0.00965 -0.0439
(0.724) (1.173) (0.0451) (0.0554)
Average tariffs -0.531 -1.142 -0.0605* -0.0688
(0.460) (0.742) (0.0318) (0.0422)
Aid recieved $ -3.41e-09** -2.93e-09 5.75e-11 1.92e-10*
(1.37e-09) (2.51e-09) (1.03e-10) (1.02e-10)
Exports as percentage of GDP -0.0114 -0.0575* 0.00690*** 0.00877***
(0.0182) (0.0323) (0.00168) (0.00176)
Legal rights index, 0-10 (best) -0.889 -0.710 0.0557 0.0162
(0.739) (0.981) (0.0398) (0.0364)
Constant 15.61*** 114.1*** 127.7*** 1.047*** -8.523*** -7.929***
(2.983) (23.06) (33.19) (0.311) (1.010) (1.525)
Religion controls - - YES - - YES
Geographical controls - - YES - - YES
Observations 85,567 72,651 72,651 78,623 72,651 72,651R-squared 0.036 0.469 0.581 0.217 0.896 0.917
Clusters 64 55 55 59 55 55Robust standard errors in parentheses
*** p<0.01, ** p<0.05, * p<0.1
Dependent variable: Time to export Dependent variable: GCI component
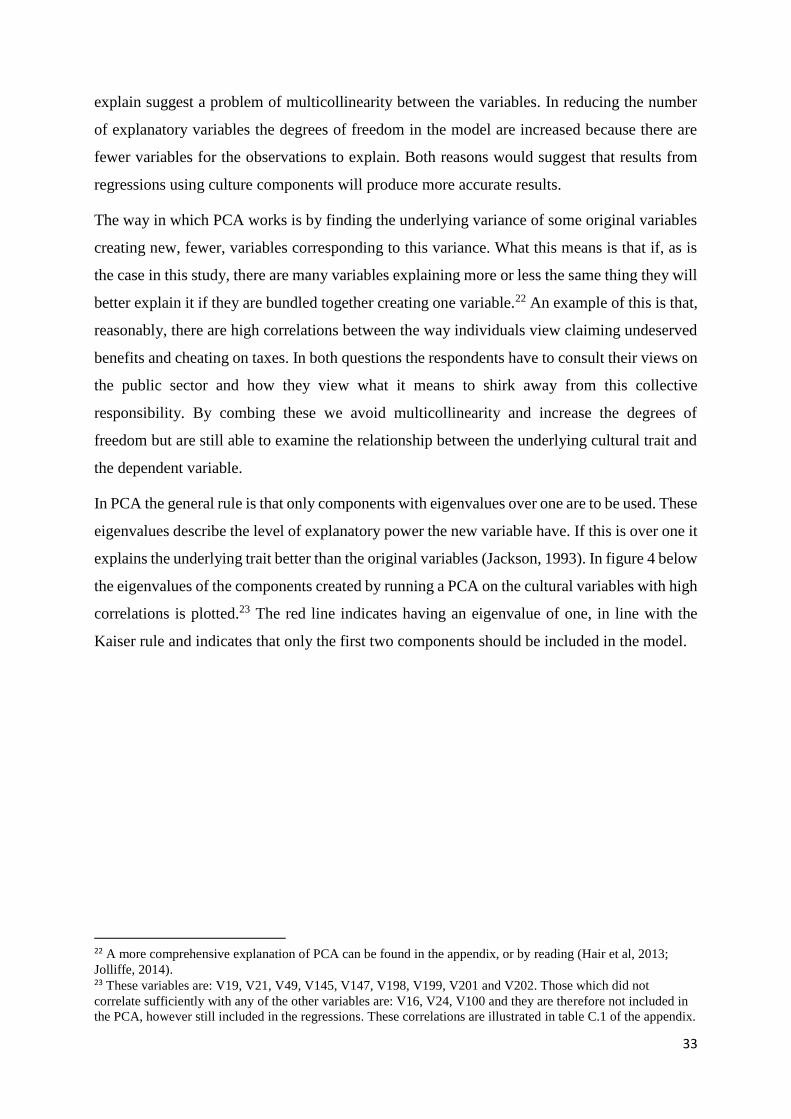
33
explain suggest a problem of multicollinearity between the variables. In reducing the number
of explanatory variables the degrees of freedom in the model are increased because there are
fewer variables for the observations to explain. Both reasons would suggest that results from
regressions using culture components will produce more accurate results.
The way in which PCA works is by finding the underlying variance of some original variables
creating new, fewer, variables corresponding to this variance. What this means is that if, as is
the case in this study, there are many variables explaining more or less the same thing they will
better explain it if they are bundled together creating one variable.22 An example of this is that,
reasonably, there are high correlations between the way individuals view claiming undeserved
benefits and cheating on taxes. In both questions the respondents have to consult their views on
the public sector and how they view what it means to shirk away from this collective
responsibility. By combing these we avoid multicollinearity and increase the degrees of
freedom but are still able to examine the relationship between the underlying cultural trait and
the dependent variable.
In PCA the general rule is that only components with eigenvalues over one are to be used. These
eigenvalues describe the level of explanatory power the new variable have. If this is over one it
explains the underlying trait better than the original variables (Jackson, 1993). In figure 4 below
the eigenvalues of the components created by running a PCA on the cultural variables with high
correlations is plotted.23 The red line indicates having an eigenvalue of one, in line with the
Kaiser rule and indicates that only the first two components should be included in the model.
22 A more comprehensive explanation of PCA can be found in the appendix, or by reading (Hair et al, 2013;
Jolliffe, 2014). 23 These variables are: V19, V21, V49, V145, V147, V198, V199, V201 and V202. Those which did not
correlate sufficiently with any of the other variables are: V16, V24, V100 and they are therefore not included in
the PCA, however still included in the regressions. These correlations are illustrated in table C.1 of the appendix.
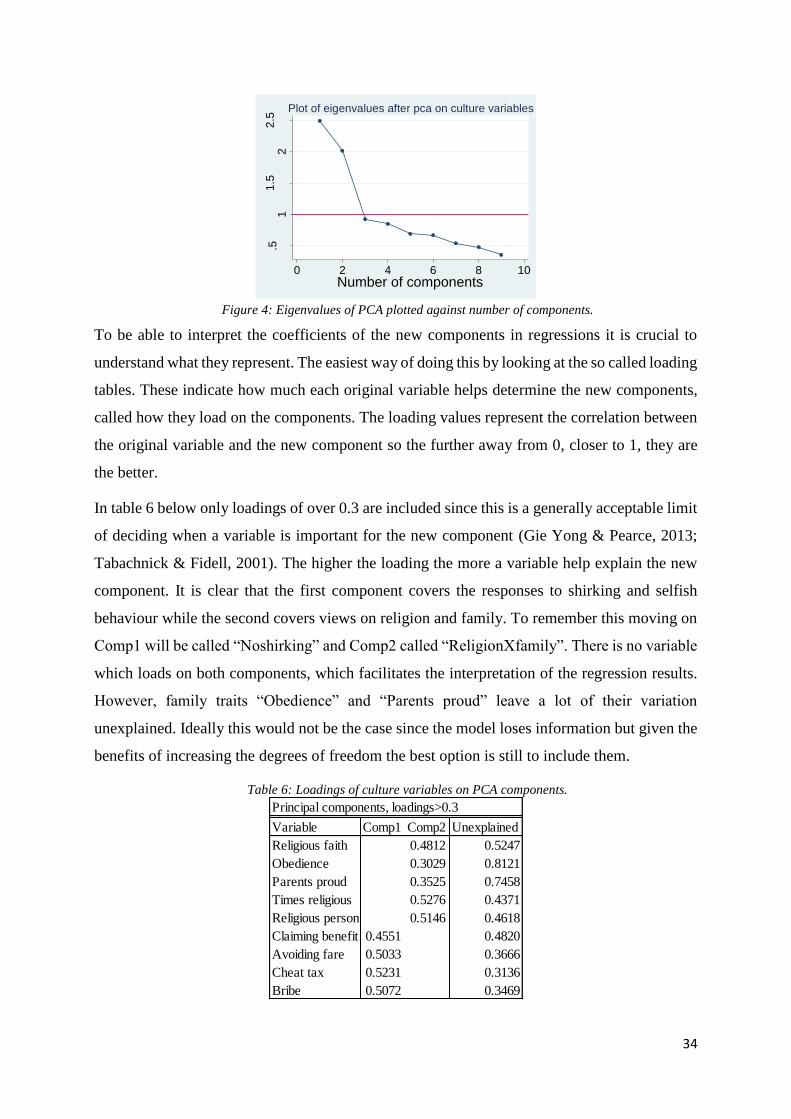
34
Figure 4: Eigenvalues of PCA plotted against number of components.
To be able to interpret the coefficients of the new components in regressions it is crucial to
understand what they represent. The easiest way of doing this by looking at the so called loading
tables. These indicate how much each original variable helps determine the new components,
called how they load on the components. The loading values represent the correlation between
the original variable and the new component so the further away from 0, closer to 1, they are
the better.
In table 6 below only loadings of over 0.3 are included since this is a generally acceptable limit
of deciding when a variable is important for the new component (Gie Yong & Pearce, 2013;
Tabachnick & Fidell, 2001). The higher the loading the more a variable help explain the new
component. It is clear that the first component covers the responses to shirking and selfish
behaviour while the second covers views on religion and family. To remember this moving on
Comp1 will be called “Noshirking” and Comp2 called “ReligionXfamily”. There is no variable
which loads on both components, which facilitates the interpretation of the regression results.
However, family traits “Obedience” and “Parents proud” leave a lot of their variation
unexplained. Ideally this would not be the case since the model loses information but given the
benefits of increasing the degrees of freedom the best option is still to include them.
Table 6: Loadings of culture variables on PCA components.
.51
1.5
22
.5
Eig
envalu
es
0 2 4 6 8 10Number of components
Plot of eigenvalues after pca on culture variables
Principal components, loadings>0.3
Variable Comp1 Comp2 Unexplained
Religious faith 0.4812 0.5247
Obedience 0.3029 0.8121
Parents proud 0.3525 0.7458
Times religious 0.5276 0.4371
Religious person 0.5146 0.4618
Claiming benefit 0.4551 0.4820
Avoiding fare 0.5033 0.3666
Cheat tax 0.5231 0.3136
Bribe 0.5072 0.3469
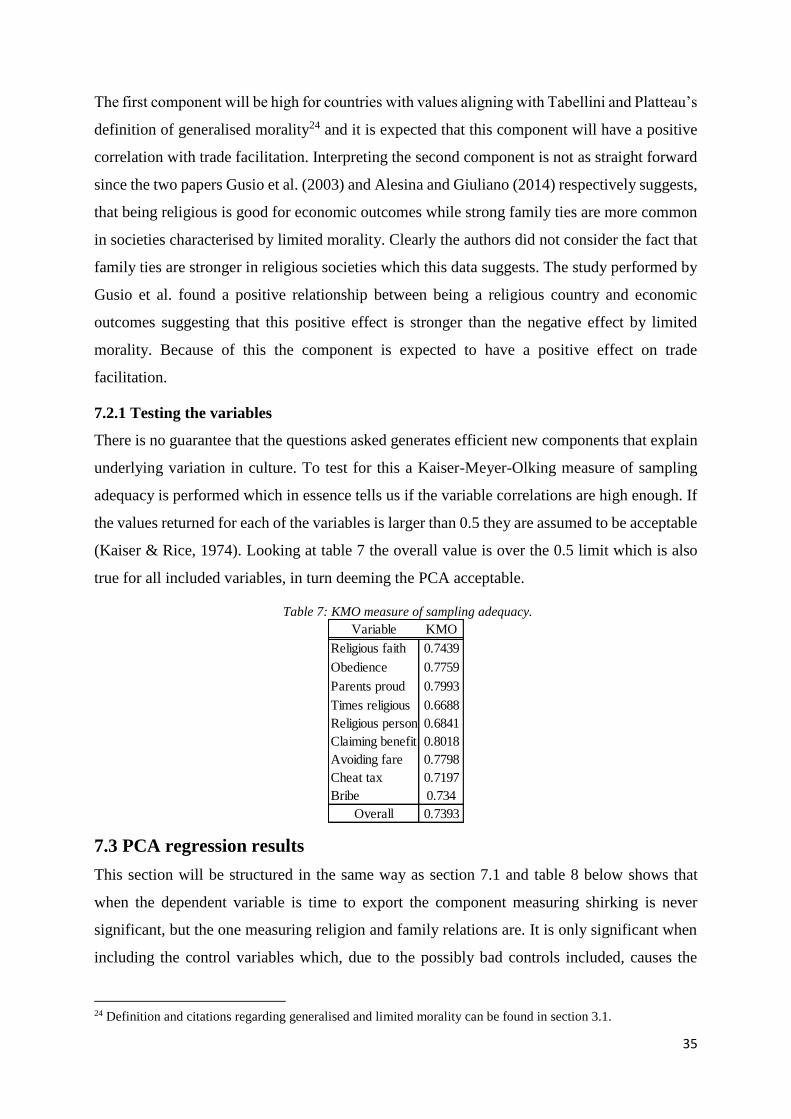
35
The first component will be high for countries with values aligning with Tabellini and Platteau’s
definition of generalised morality24 and it is expected that this component will have a positive
correlation with trade facilitation. Interpreting the second component is not as straight forward
since the two papers Gusio et al. (2003) and Alesina and Giuliano (2014) respectively suggests,
that being religious is good for economic outcomes while strong family ties are more common
in societies characterised by limited morality. Clearly the authors did not consider the fact that
family ties are stronger in religious societies which this data suggests. The study performed by
Gusio et al. found a positive relationship between being a religious country and economic
outcomes suggesting that this positive effect is stronger than the negative effect by limited
morality. Because of this the component is expected to have a positive effect on trade
facilitation.
7.2.1 Testing the variables
There is no guarantee that the questions asked generates efficient new components that explain
underlying variation in culture. To test for this a Kaiser-Meyer-Olking measure of sampling
adequacy is performed which in essence tells us if the variable correlations are high enough. If
the values returned for each of the variables is larger than 0.5 they are assumed to be acceptable
(Kaiser & Rice, 1974). Looking at table 7 the overall value is over the 0.5 limit which is also
true for all included variables, in turn deeming the PCA acceptable.
Table 7: KMO measure of sampling adequacy.
7.3 PCA regression results
This section will be structured in the same way as section 7.1 and table 8 below shows that
when the dependent variable is time to export the component measuring shirking is never
significant, but the one measuring religion and family relations are. It is only significant when
including the control variables which, due to the possibly bad controls included, causes the
24 Definition and citations regarding generalised and limited morality can be found in section 3.1.
Variable KMO
Religious faith 0.7439
Obedience 0.7759
Parents proud 0.7993
Times religious 0.6688
Religious person 0.6841
Claiming benefit 0.8018
Avoiding fare 0.7798
Cheat tax 0.7197
Bribe 0.734
Overall 0.7393
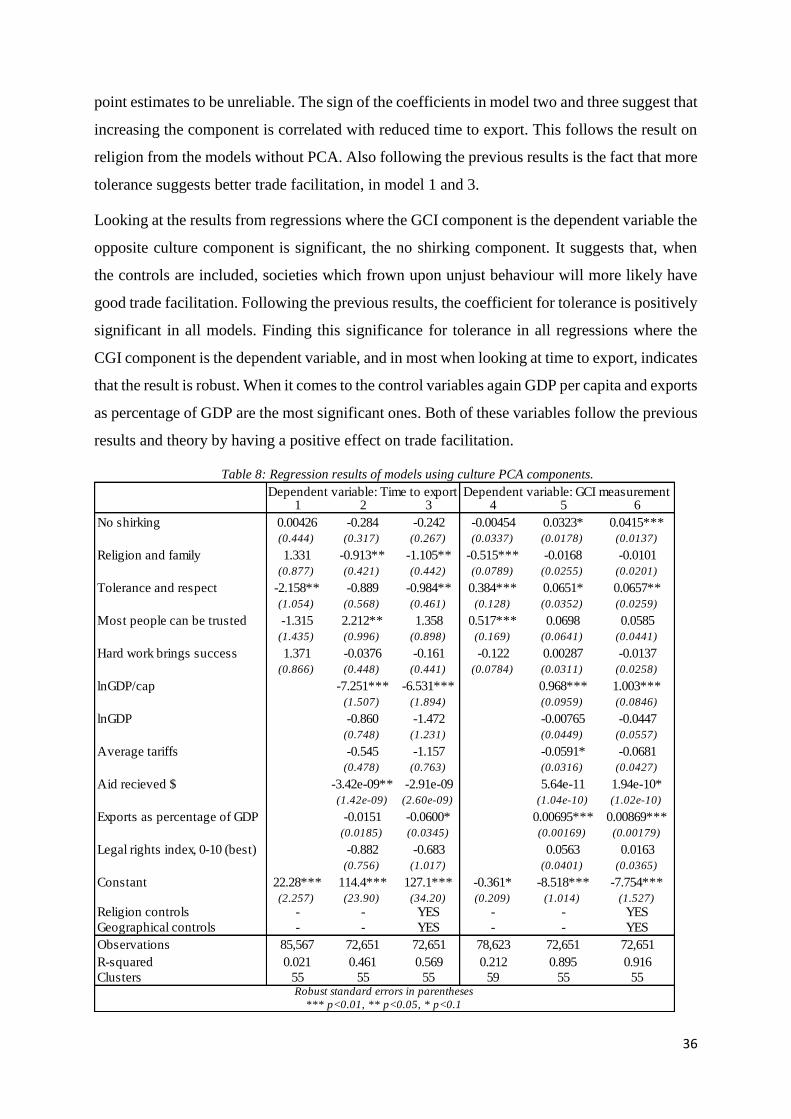
36
point estimates to be unreliable. The sign of the coefficients in model two and three suggest that
increasing the component is correlated with reduced time to export. This follows the result on
religion from the models without PCA. Also following the previous results is the fact that more
tolerance suggests better trade facilitation, in model 1 and 3.
Looking at the results from regressions where the GCI component is the dependent variable the
opposite culture component is significant, the no shirking component. It suggests that, when
the controls are included, societies which frown upon unjust behaviour will more likely have
good trade facilitation. Following the previous results, the coefficient for tolerance is positively
significant in all models. Finding this significance for tolerance in all regressions where the
CGI component is the dependent variable, and in most when looking at time to export, indicates
that the result is robust. When it comes to the control variables again GDP per capita and exports
as percentage of GDP are the most significant ones. Both of these variables follow the previous
results and theory by having a positive effect on trade facilitation.
Table 8: Regression results of models using culture PCA components.
1 2 3 4 5 6
No shirking 0.00426 -0.284 -0.242 -0.00454 0.0323* 0.0415***
(0.444) (0.317) (0.267) (0.0337) (0.0178) (0.0137)
Religion and family 1.331 -0.913** -1.105** -0.515*** -0.0168 -0.0101
(0.877) (0.421) (0.442) (0.0789) (0.0255) (0.0201)
Tolerance and respect -2.158** -0.889 -0.984** 0.384*** 0.0651* 0.0657**
(1.054) (0.568) (0.461) (0.128) (0.0352) (0.0259)
Most people can be trusted -1.315 2.212** 1.358 0.517*** 0.0698 0.0585
(1.435) (0.996) (0.898) (0.169) (0.0641) (0.0441)
Hard work brings success 1.371 -0.0376 -0.161 -0.122 0.00287 -0.0137
(0.866) (0.448) (0.441) (0.0784) (0.0311) (0.0258)
lnGDP/cap -7.251*** -6.531*** 0.968*** 1.003***
(1.507) (1.894) (0.0959) (0.0846)
lnGDP/cap -0.860 -1.472 -0.00765 -0.0447
(0.748) (1.231) (0.0449) (0.0557)
Average tariffs -0.545 -1.157 -0.0591* -0.0681
(0.478) (0.763) (0.0316) (0.0427)
Aid recieved $ -3.42e-09** -2.91e-09 5.64e-11 1.94e-10*
(1.42e-09) (2.60e-09) (1.04e-10) (1.02e-10)
Exports as percentage of GDP -0.0151 -0.0600* 0.00695*** 0.00869***
(0.0185) (0.0345) (0.00169) (0.00179)
Legal rights index, 0-10 (best) -0.882 -0.683 0.0563 0.0163
(0.756) (1.017) (0.0401) (0.0365)
Constant 22.28*** 114.4*** 127.1*** -0.361* -8.518*** -7.754***
(2.257) (23.90) (34.20) (0.209) (1.014) (1.527)
Religion controls - - YES - - YES
Geographical controls - - YES - - YES
Observations 85,567 72,651 72,651 78,623 72,651 72,651
R-squared 0.021 0.461 0.569 0.212 0.895 0.916
Clusters 55 55 55 59 55 55
*** p<0.01, ** p<0.05, * p<0.1
Robust standard errors in parentheses
Dependent variable: Time to export Dependent variable: GCI measurement
37
7.4 Robustness tests of the results
In this section all three sensitivity controls are discussed but in the spirit of brevity, full results
of these tests will not be included in the study but are available on request from the authors.
7.4.1 Leaving the WVS responses uncoded
When the responses are uncoded there is more specific information about the individual
responses and nuances in the data can be detected. However, the responses are made on a scale
which is not always in the same direction as the coded answers which makes the effect of the
coefficients unclear. Therefore, this test will only look at the significance levels and see if the
variables which are significant are the same as in the main regression.
When comparing the results of regression results using time to export as the dependent variable
the significant variables are identical between the two tables with one exception. This being the
effect of placing value on making parents proud which in the third model goes from being
significant on the 10%-level to no longer being significant. In the regressions where the GCI
measurement is the dependent variable there is again only one difference with a variable which
was significant at 10%, which in these results loses significance. This comparison confirms that
the standard errors are robust to changes in the way in which the regression is modelled.
7.4.2 Changing the limits for positive answers
In changing the limits for what constitutes a positive answer and thus what responses are coded
as ones and zeros the robustness of the main results can be assessed. Because these are chosen
by the author it is of additional importance to see that they are not selected to produce desired
results. If the results were to change significantly the validity of the study would be questioned.
There are almost no differences in any of the coefficients and where they differ it is only
slightly. In only one case the significance changes: for the coefficient indicating the effect of
believing that hard work brings success. In none of the main regressions is this coefficient
significant but when changing the limits, it becomes significant at the 5%-level when the GCI
measurement is the dependent variable and at the 10%-level when looking at time to export
using culture components. The point estimates in all cases are however quite similar. Having
this happen to only one variable suggest that the results are robust and that there is no evidence
of the author choosing the limits which produces results most in line with the hypothesis.
7.4.3 Doing a component of all DBD “Trading across borders” data
As a final robustness check the dependent variable used will be changed to the first principal
component of all three factors in the DBD trading across borders section. These results are not
38
supposed to be identical to the main regressions but rather illustrate that the channel through
which culture affects trade facilitation is not confined to time to export nor the GCI
measurement. Again, this is important since the support from previous literature is lacking and
there is no consensus regarding the correct way to measure trade facilitation.
There is no way to compare the point estimates since the component values do not match the
scale of time to export. Nevertheless, it is interesting to look at the significance and the sings
of the coefficients. All variables have the same sign when comparing the results, and in almost
all cases the significance is the same, which is what this test wanted to control for. The fact that
they have the same signs would suggest that the direction in which culture affects trade
facilitation is at least robust to the different elements included in trading across borders.
39
8. Summary and conclusions
The aim of this study is to investigate the relationship between different cultural traits and trade
facilitation, and in doing so break new ground in the separate fields of trade facilitation and
cultural economics. Given the fact that both of these fields are relatively new fields of research
in economics they lack both comprehensive and long data sets as well as a solid foundation of
previous research for this paper to build upon. Since there is, to my knowledge, no research
done on the issue, and little done on the general effects of culture on economic outcomes, the
model in this thesis is built by combining theory from different fields.
The general results from the regressions suggest that having resources is the most important
factor behind successful trade facilitation, which falls in line with theory and general economic
intuition. If countries have money to spend on reforming and improving parts of trade
facilitation such as physical and internet infrastructure, computer systems and management
coaching, it is likely to be more efficient. Given this the study clearly needs to control for
resources, introduces the problem of bad controls to the model. Resources are seen as possible
bad controls because previous research suggests that they are affected by culture through other
channels than trade. Despite this the results show that there are still significant effects of cultural
traits on levels of trade facilitation. The general conclusions of the empirical results are that
societies in which the culture fosters tolerance, respect and a sense of social responsibility and
that are generally religious will be more likely to have good trade facilitation.
The main contribution of this study is to expose the relationship between culture and trade
facilitation and the importance of further, more extensive, research. Trade organisations,
countries, politicians and trade economists can keep promoting the importance of trade
facilitation. But until it is known what actually effects trade facilitation implementation of
reforms will never be truly efficient. As shown by this paper there are cultural traits which are
prevalent to different degrees depending upon the country, that can either help or hamper the
effects of these reforms. Understanding more about the causality of this relationship and finding
more efficient estimations of the effects are therefore of great importance. It could especially
be important knowledge for low developed countries which have limited resources to spend on
trade facilitation reforms and thus are in extra need of them to be as effective as possible.
Further, more research on this relationship would most likely show that there are different
reforms which are needed in different types of countries.
40
These results do not suggest that all countries should try and change their culture in the direction
to be in line with what is correlated with better trade facilitation. It is rather information
countries can use to know what kind of trade facilitating reforms will be most efficient given
their culture and how it interacts with these reforms. As an example the study’s results show
that when shirking behaviour is more socially acceptable, the culture aligns with limited
morality, trade facilitation suffers. Countries characterised by such culture can use the
knowledge of this to focus reforms on educating managers and having better supervision of
their employees in different institutions, to improve productivity. Such a reform might be
redundant in a country which culture falls in line with generalised morality. Using this example,
the gains to be made from further studying this subject is clear.
One way of doing further studies on the topic is to look at differences between regions of a
country, if such data could be collected. This would reduce the large issues with cross-country
comparisons and thus strengthen the causal interpretation of any relationship. There is also a
need for research aimed at finding other variables which drives trade facilitation. A starting
point could be studies of the properties and policies of different kinds of countries, or regions,
that are successful in their trade facilitation.
Seeing as this is a pilot study there are certainly endless ways of furthering and improving the
research on the field. There will however continue to be a problem for some time that there are
too few observations to work with, stemming from the fact that trade facilitation measures are
relatively new. Finding a good and efficient proxy for trade facilitation with data reaching back
further than 2006 would thus be a very intriguing.
41
9. References Alesina, A., & Giuliano, P. (2013). Culture and Institutions (No. 19750). Retrieved from
http://www.nber.org/papers/w19750.pdf
Alesina, A., & Giuliano, P. (2014). Family Ties. In P. Aghion & S. Durlauf (Eds.), Handbook of
Economic Growth (Vol. 2, pp. 177–215). Elsevier.
Angrist, J. D., & Pischke, J.-S. (2009). Mostly Harmless Econometrics: An Empiricist’s Companion.
Princeton University Press.
Ashraf, N., Camerer, C. F., & Loewenstein, G. (2005). Adam Smith, Behavioral Economist. The
Journal of Economic Perspectives Journal of Economic Perspectives, 19(3), 131–145.
Baier, S. L., & Bergstrand, J. H. (2001). The growth of world trade: tariffs, transport costs, and income
similarity. Journal of International Economics, 53(1), 1–27.
Baldwin, R. E. (1982). The Political Economy of Protectionism. In J. N. Bhagwati (Ed.), Import
Competition and Response (pp. 263–292). the National Bureau of Economic Research.
Bhagwati, J. (1994). Free Trade: Old and New Challenges. The Economic Journal, 104(423), 231.
Blum, U., & Dudley, L. (2001). Religion and economic growth: was Weber right? Journal of
Evolutionary Economics, 11, 207–230.
Bornhorst, F., Ichino, A., Schlag, K. H., & Winter, E. (2004). Trust and Trustworthiness Among
Europeans: South-North Comparison (No. 4378).
Bourdet, Y., & Persson, M. (2012). Completing the European Union Customs Union: The Effects of
Trade Procedure Harmonization. JCMS: Journal of Common Market Studies, 50(2), 300–314.
Bourdet, Y., & Persson, M. (2014). Expanding and Diversifying South Mediterranean Exports through
Trade Facilitation. Development Policy Review, 32(6), 675–699.
Cameron, A. C., & Trivedi, P. K. (2009). Microeconometrics using stata. College Station: StataCorp
LP.
CIA. (2016). The World Factbook: Mauritius. Retrieved April 18, 2016, from
https://www.cia.gov/library/publications/the-world-factbook/geos/mp.html
Djankov, S., Freund, C., & Pham, C. S. (2010). Trading on Time. The Review of Economics and
Statistics, 92(1), 166–173.
Duran, P., & Sokol, J. B. (2005). Policy and operational lessons learned from eight country case
studies. In L. De Wulf & J. B. Sokol (Eds.), Customs Modernization Handbook (pp. 103–126). The
World Bank.
Fernandez, R. (2008). Economics and Culture. In S. N. Durlauf & L. E. Blume (Eds.), New Palgrave
Dictionary of Economics (2nd ed.). Palgrave Macmillan.
Gie Yong, A., & Pearce, S. (2013). A Beginner’s Guide to Factor Analysis: Focusing on Exploratory
Factor Analysis. Tutorials in Quantitative Methods for Psychology, 9(2), 79–94.
Greif, A. (1994). Cultural Beliefs and the Organization of Society: A Historical and Theoretical
Reflection on Collectivist and Individualist Societies. Journal of Political Economy, 102(5), 912–950.
Guiso, L., Sapienza, P., & Zingales, L. (2003). People’s opium? Religion and economic attitudes.
Journal of Monetary Economics, 50(1), 225–282.
Guiso, L., Sapienza, P., & Zingales, L. (2006). Does Culture Affect Economic Outcomes? Journal of
Economic Perspectives, 20(2), 23–48.
42
Gusio, L., Sapienza, P., & Zingales, L. (2008). Social Capital as Good Culture. Retrieved May 15,
2016, from http://cepr.org/active/publications/discussion_papers/dp.php?dpno=6657
Hair, J. F. J., Black, W. C., Babin, B. J., & Anderson, R. E. (2013). Multivariate data analysis.
Pearson.
Hoff, K., & Pandey, P. (2004). Belief Systems and Durable Inequalities: An Experimental
Investigation of Indian Caste (Policy Research Working Papers No. 3351). The World Bank.
Retrieved May 10, 2016, from http://elibrary.worldbank.org/doi/book/10.1596/1813-9450-3351
Ichino, A., & Maggi, G. (2000). Work Environment and Individual Background: Explaining Regional
Shirking Differentials in a Large Italian Firm. Quarterly Journal of Economics, 115(3), 1057–1090.
Inglehart, R., & Baker, W. E. (2000). Modernization, Cultural Change, and the Persistence of
Traditional Values. American Sociological Review, 65(1), 19.
ITC, I. T. C. (2013). WTO Trade Facilitation Agreement: a Business Guide for Developing Countries.
Iwanow, T., & Kirkpatrick, C. (2007). Trade facilitation, regulatory quality and export performance.
Journal of International Development, 19(6), 735–753.
Iwanow, T., & Kirkpatrick, C. (2009). Trade Facilitation and Manufactured Exports: Is Africa
Different? World Development, 37(6), 1039–1050.
Jackson, D. A. (1993). Stopping Rules in Principal Components Analysis: A Comparison of
Heuristical and Statistical Approaches. Ecology, 74(748), 2204–2214.
Jolliffe, I. (2014). Principal Component Analysis. In Wiley StatsRef: Statistics Reference Online. John
Wiley & Sons, Ltd.
Joseph, H., Boyd, R., Bowles, S., Camerer, C., Fehr, E., Gintis, H., & Mcelreath, R. (2001). In Search
of Homo Economicus: Behavioral Experiments in 15 Small-Scale Societies. The American Economic
Review, 91(2), 73–78.
Kaiser, H. F., & Rice, J. (1974). LITTLE JIFFY, MARK IV 1. Educational and Psychological
Measurement, 34, 11,117.
Knutsen, T. L., & Moses, J. W. (2012). The Comparative Method. In Ways of knowing: competing
methodologies in social and political research (2nd ed.). Palgrave Macmillan.
Kolakowski, L. (1978). Main Currents of Marxism. Oxford University Press.
Lee, H., & Park, I. (2007). In Search of Optimised Regional Trade Agreements and Applications to
East Asia. The World Economy, 30(5), 783–806.
Lee, J.-W., & Swagel, P. (1997). Trade Barriers and Trade Flows Across Countries and Industries.
The Review of Economics and Statistics, 79(3), 372–382.
Love, P., & Ralph, L. (2009). Protectionism? Tariffs and Other Barriers to Trade. In International
Trade: Free, Fair and Open? (pp. 53–75). OECD Publishing.
Maur, J.-C. (2011). Trade Facilitation. In J.-P. Chauffour & J.-C. Maur (Eds.), Preferential trade
agreement policies for development (pp. 327–346).
Nordås, H. K., Pinali, E., & Grosso, M. G. (2006). Logistics and Time as a Trade Barrier (OECD
Trade Policy Working Paper No. 35). Retrieved April 23, 2016, from
http://www.oecd.org/officialdocuments/publicdisplaydocumentpdf/?doclanguage=en&cote=td/tc/wp(2
006)3/final
OECD. (2016). Trade facilitation indicators. Retrieved May 16, 2016, from
http://www.oecd.org/tad/facilitation/indicators.htm#About-TFI
43
Orliac, T. (2012). The Economics of Trade Facilitation. l’Institut d'Etudes politiques de Paris.
Retrieved May 20, 2016, from
http://spire.sciencespo.fr/hdl:/2441/7o52iohb7k6srk09n8lgk48g7/resources/these-thomas-orliac-
2012.pdf
Oxford Dictionaries. (2016). Oxford Dictionaries: Culture. Retrieved April 19, 2016, from
http://www.oxforddictionaries.com/definition/english/culture
Persson, M. (2008). Trade Facilitation and the EU-ACP Economic Partnership Agreements. Journal of
Economic Integration, 23(3), 518–546.
Persson, M. (2012). From Trade Preferences to Trade Facilitation: Taking Stock of the Issues.
Economics: The Open-Access, Open-Assessment E-Journal, 6(2012-17), 1–33.
Platteau, J.-P. (2000). Institutions, Social Norms, and Economic Development. Psychology Press.
Schwab, K., & Sala-i-Martín, X. (2015). The Global Competitiveness Report 2015-2016: Full Data
Edition. Geneva.
Tabachnick, B. G., & Fidell, L. S. (2001). Using Multivariate Statistics. (Rebecca Pascal, Ed.) (4th
ed.). Allyn & Bacon.
Tabellini, G. (2008). Presidential Address: Institutions and Culture. Journal of the European Economic
Association, 6(2-3), 255–294.
Tabellini, G. (2010). Culture and Institutions: Economic Development in the Regions of Europe.
Journal of the European Economic Association, 8(4), 677–716.
Throsby, D. (2001). Economics and Culture. Cambridge University Press.
UNECE. (2012). Trade facilitation - principles and benefits. Retrieved April 27, 2016, from
http://tfig.unece.org/details.html
Verbeek, M. (2012). A guide to modern econometrics (4th ed.). Wiley.
Wilson, J. S., Mann, C. L., & Otsuki, T. (2003). Trade Facilitation and Economic Development: A
New Approach to Quantifying the Impact. The World Bank Economic Review, 17(3), 367–389.
World Bank. (2016a). Doing Business: Trading across borders. Retrieved May 5, 2016, from
http://www.doingbusiness.org/data/exploretopics/trading-across-borders
World Bank. (2016b). Trading Across Borders Methodology. Retrieved May 15, 2016, from
http://www.doingbusiness.org/methodology/trading-across-borders
World Economic Forum. (2015). The Global Competitiveness Report 2015-2016. Retrieved May 23,
2016, from http://reports.weforum.org/global-competitiveness-report-2015-2016/
WTO. (2015). World Trade Report 2015. Retrieved from
https://www.wto.org/english/res_e/booksp_e/world_trade_report15_e.pdf
WTO. (2016). Negotiating an agreement on trade facilitation. Retrieved April 27, 2016, from
https://www.wto.org/english/tratop_e/tradfa_e/tradfa_negoti_e.htm
WVS. (2016). World Value Survey: Findings and Insights. Retrieved April 23, 2016, from
http://www.worldvaluessurvey.org/WVSContents.jsp?CMSID=Findings
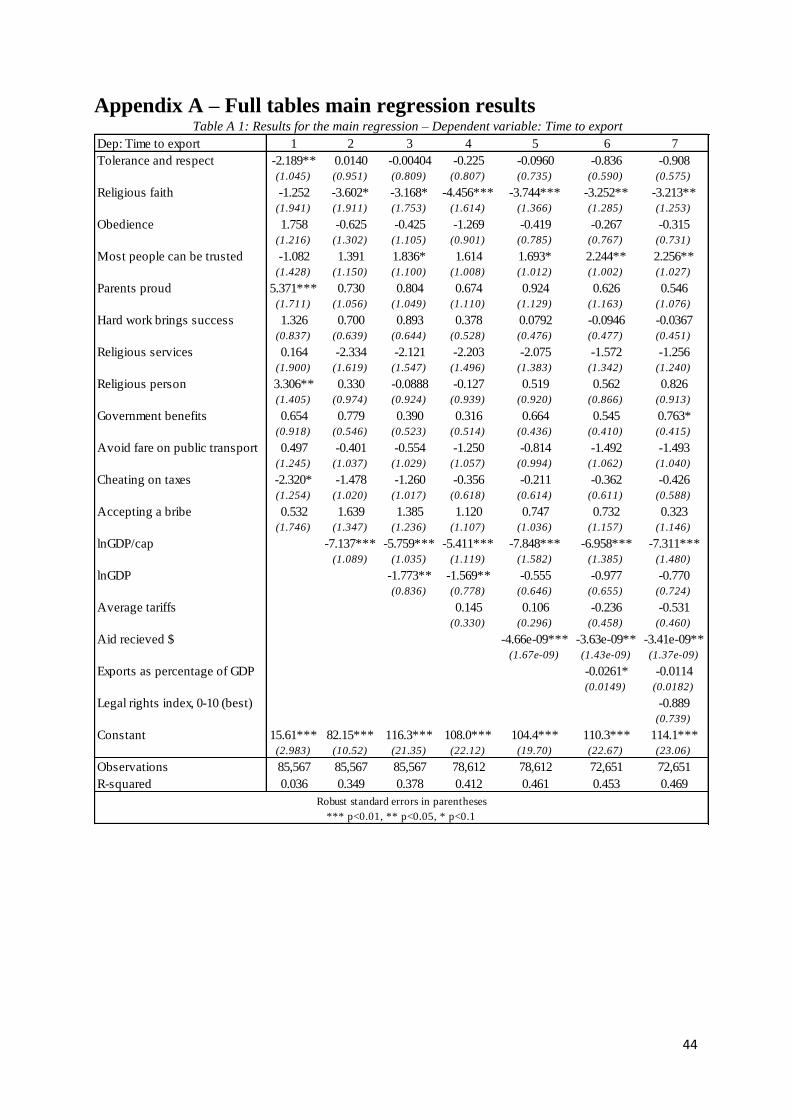
44
Appendix A – Full tables main regression results Table A 1: Results for the main regression – Dependent variable: Time to export
Dep: Time to export 1 2 3 4 5 6 7
Tolerance and respect -2.189** 0.0140 -0.00404 -0.225 -0.0960 -0.836 -0.908
(1.045) (0.951) (0.809) (0.807) (0.735) (0.590) (0.575)
Religious faith -1.252 -3.602* -3.168* -4.456*** -3.744*** -3.252** -3.213**
(1.941) (1.911) (1.753) (1.614) (1.366) (1.285) (1.253)
Obedience 1.758 -0.625 -0.425 -1.269 -0.419 -0.267 -0.315
(1.216) (1.302) (1.105) (0.901) (0.785) (0.767) (0.731)
Most people can be trusted -1.082 1.391 1.836* 1.614 1.693* 2.244** 2.256**
(1.428) (1.150) (1.100) (1.008) (1.012) (1.002) (1.027)
Parents proud 5.371*** 0.730 0.804 0.674 0.924 0.626 0.546
(1.711) (1.056) (1.049) (1.110) (1.129) (1.163) (1.076)
Hard work brings success 1.326 0.700 0.893 0.378 0.0792 -0.0946 -0.0367
(0.837) (0.639) (0.644) (0.528) (0.476) (0.477) (0.451)
Religious services 0.164 -2.334 -2.121 -2.203 -2.075 -1.572 -1.256
(1.900) (1.619) (1.547) (1.496) (1.383) (1.342) (1.240)
Religious person 3.306** 0.330 -0.0888 -0.127 0.519 0.562 0.826
(1.405) (0.974) (0.924) (0.939) (0.920) (0.866) (0.913)
Government benefits 0.654 0.779 0.390 0.316 0.664 0.545 0.763*
(0.918) (0.546) (0.523) (0.514) (0.436) (0.410) (0.415)
Avoid fare on public transport 0.497 -0.401 -0.554 -1.250 -0.814 -1.492 -1.493
(1.245) (1.037) (1.029) (1.057) (0.994) (1.062) (1.040)
Cheating on taxes -2.320* -1.478 -1.260 -0.356 -0.211 -0.362 -0.426
(1.254) (1.020) (1.017) (0.618) (0.614) (0.611) (0.588)
Accepting a bribe 0.532 1.639 1.385 1.120 0.747 0.732 0.323
(1.746) (1.347) (1.236) (1.107) (1.036) (1.157) (1.146)
lnGDP/cap -7.137*** -5.759*** -5.411*** -7.848*** -6.958*** -7.311***
(1.089) (1.035) (1.119) (1.582) (1.385) (1.480)
lnGDP/cap -1.773** -1.569** -0.555 -0.977 -0.770
(0.836) (0.778) (0.646) (0.655) (0.724)
Average tariffs 0.145 0.106 -0.236 -0.531
(0.330) (0.296) (0.458) (0.460)
Aid recieved $ -4.66e-09*** -3.63e-09** -3.41e-09**
(1.67e-09) (1.43e-09) (1.37e-09)
Exports as percentage of GDP -0.0261* -0.0114
(0.0149) (0.0182)
Legal rights index, 0-10 (best) -0.889
(0.739)
Constant 15.61*** 82.15*** 116.3*** 108.0*** 104.4*** 110.3*** 114.1***
(2.983) (10.52) (21.35) (22.12) (19.70) (22.67) (23.06)
Observations 85,567 85,567 85,567 78,612 78,612 72,651 72,651
R-squared 0.036 0.349 0.378 0.412 0.461 0.453 0.469
Robust standard errors in parentheses
*** p<0.01, ** p<0.05, * p<0.1
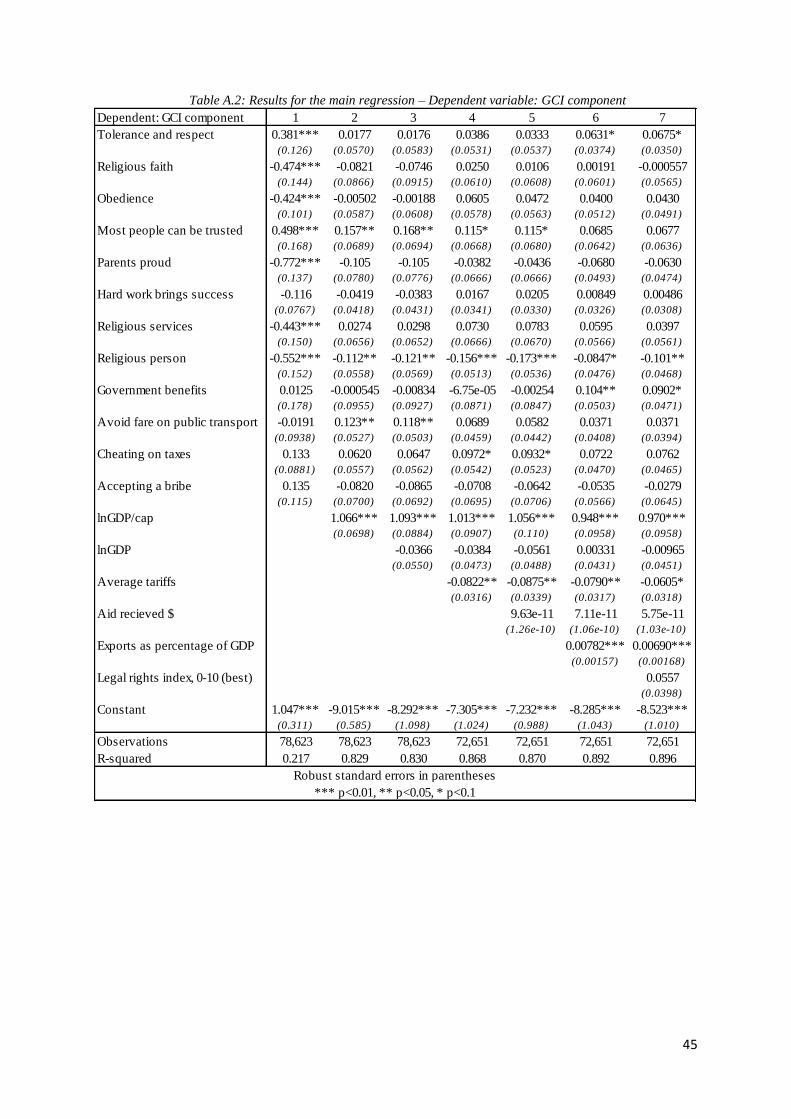
45
Table A.2: Results for the main regression – Dependent variable: GCI component
Dependent: GCI component 1 2 3 4 5 6 7
Tolerance and respect 0.381*** 0.0177 0.0176 0.0386 0.0333 0.0631* 0.0675*
(0.126) (0.0570) (0.0583) (0.0531) (0.0537) (0.0374) (0.0350)
Religious faith -0.474*** -0.0821 -0.0746 0.0250 0.0106 0.00191 -0.000557
(0.144) (0.0866) (0.0915) (0.0610) (0.0608) (0.0601) (0.0565)
Obedience -0.424*** -0.00502 -0.00188 0.0605 0.0472 0.0400 0.0430
(0.101) (0.0587) (0.0608) (0.0578) (0.0563) (0.0512) (0.0491)
Most people can be trusted 0.498*** 0.157** 0.168** 0.115* 0.115* 0.0685 0.0677
(0.168) (0.0689) (0.0694) (0.0668) (0.0680) (0.0642) (0.0636)
Parents proud -0.772*** -0.105 -0.105 -0.0382 -0.0436 -0.0680 -0.0630
(0.137) (0.0780) (0.0776) (0.0666) (0.0666) (0.0493) (0.0474)
Hard work brings success -0.116 -0.0419 -0.0383 0.0167 0.0205 0.00849 0.00486
(0.0767) (0.0418) (0.0431) (0.0341) (0.0330) (0.0326) (0.0308)
Religious services -0.443*** 0.0274 0.0298 0.0730 0.0783 0.0595 0.0397
(0.150) (0.0656) (0.0652) (0.0666) (0.0670) (0.0566) (0.0561)
Religious person -0.552*** -0.112** -0.121** -0.156*** -0.173*** -0.0847* -0.101**
(0.152) (0.0558) (0.0569) (0.0513) (0.0536) (0.0476) (0.0468)
Government benefits 0.0125 -0.000545 -0.00834 -6.75e-05 -0.00254 0.104** 0.0902*
(0.178) (0.0955) (0.0927) (0.0871) (0.0847) (0.0503) (0.0471)
Avoid fare on public transport -0.0191 0.123** 0.118** 0.0689 0.0582 0.0371 0.0371
(0.0938) (0.0527) (0.0503) (0.0459) (0.0442) (0.0408) (0.0394)
Cheating on taxes 0.133 0.0620 0.0647 0.0972* 0.0932* 0.0722 0.0762
(0.0881) (0.0557) (0.0562) (0.0542) (0.0523) (0.0470) (0.0465)
Accepting a bribe 0.135 -0.0820 -0.0865 -0.0708 -0.0642 -0.0535 -0.0279
(0.115) (0.0700) (0.0692) (0.0695) (0.0706) (0.0566) (0.0645)
lnGDP/cap 1.066*** 1.093*** 1.013*** 1.056*** 0.948*** 0.970***
(0.0698) (0.0884) (0.0907) (0.110) (0.0958) (0.0958)
lnGDP/cap -0.0366 -0.0384 -0.0561 0.00331 -0.00965
(0.0550) (0.0473) (0.0488) (0.0431) (0.0451)
Average tariffs -0.0822** -0.0875** -0.0790** -0.0605*
(0.0316) (0.0339) (0.0317) (0.0318)
Aid recieved $ 9.63e-11 7.11e-11 5.75e-11
(1.26e-10) (1.06e-10) (1.03e-10)
Exports as percentage of GDP 0.00782*** 0.00690***
(0.00157) (0.00168)
Legal rights index, 0-10 (best) 0.0557
(0.0398)
Constant 1.047*** -9.015*** -8.292*** -7.305*** -7.232*** -8.285*** -8.523***
(0.311) (0.585) (1.098) (1.024) (0.988) (1.043) (1.010)
Observations 78,623 78,623 78,623 72,651 72,651 72,651 72,651
R-squared 0.217 0.829 0.830 0.868 0.870 0.892 0.896
*** p<0.01, ** p<0.05, * p<0.1
Robust standard errors in parentheses
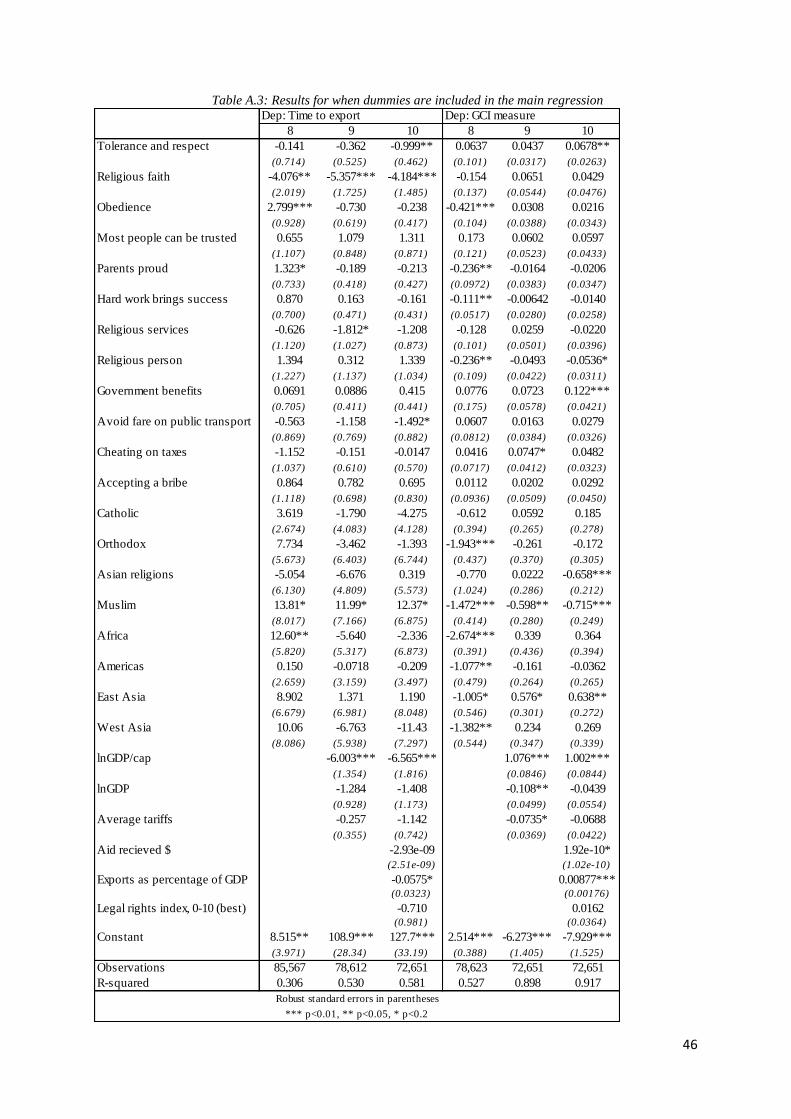
46
Table A.3: Results for when dummies are included in the main regression
Dep: Time to export Dep: GCI measure
8 9 10 8 9 10
Tolerance and respect -0.141 -0.362 -0.999** 0.0637 0.0437 0.0678**
(0.714) (0.525) (0.462) (0.101) (0.0317) (0.0263)
Religious faith -4.076** -5.357*** -4.184*** -0.154 0.0651 0.0429
(2.019) (1.725) (1.485) (0.137) (0.0544) (0.0476)
Obedience 2.799*** -0.730 -0.238 -0.421*** 0.0308 0.0216
(0.928) (0.619) (0.417) (0.104) (0.0388) (0.0343)
Most people can be trusted 0.655 1.079 1.311 0.173 0.0602 0.0597
(1.107) (0.848) (0.871) (0.121) (0.0523) (0.0433)
Parents proud 1.323* -0.189 -0.213 -0.236** -0.0164 -0.0206
(0.733) (0.418) (0.427) (0.0972) (0.0383) (0.0347)
Hard work brings success 0.870 0.163 -0.161 -0.111** -0.00642 -0.0140
(0.700) (0.471) (0.431) (0.0517) (0.0280) (0.0258)
Religious services -0.626 -1.812* -1.208 -0.128 0.0259 -0.0220
(1.120) (1.027) (0.873) (0.101) (0.0501) (0.0396)
Religious person 1.394 0.312 1.339 -0.236** -0.0493 -0.0536*
(1.227) (1.137) (1.034) (0.109) (0.0422) (0.0311)
Government benefits 0.0691 0.0886 0.415 0.0776 0.0723 0.122***
(0.705) (0.411) (0.441) (0.175) (0.0578) (0.0421)
Avoid fare on public transport -0.563 -1.158 -1.492* 0.0607 0.0163 0.0279
(0.869) (0.769) (0.882) (0.0812) (0.0384) (0.0326)
Cheating on taxes -1.152 -0.151 -0.0147 0.0416 0.0747* 0.0482
(1.037) (0.610) (0.570) (0.0717) (0.0412) (0.0323)
Accepting a bribe 0.864 0.782 0.695 0.0112 0.0202 0.0292
(1.118) (0.698) (0.830) (0.0936) (0.0509) (0.0450)
Catholic 3.619 -1.790 -4.275 -0.612 0.0592 0.185
(2.674) (4.083) (4.128) (0.394) (0.265) (0.278)
Orthodox 7.734 -3.462 -1.393 -1.943*** -0.261 -0.172
(5.673) (6.403) (6.744) (0.437) (0.370) (0.305)
Asian religions -5.054 -6.676 0.319 -0.770 0.0222 -0.658***
(6.130) (4.809) (5.573) (1.024) (0.286) (0.212)
Muslim 13.81* 11.99* 12.37* -1.472*** -0.598** -0.715***
(8.017) (7.166) (6.875) (0.414) (0.280) (0.249)
Africa 12.60** -5.640 -2.336 -2.674*** 0.339 0.364
(5.820) (5.317) (6.873) (0.391) (0.436) (0.394)
Americas 0.150 -0.0718 -0.209 -1.077** -0.161 -0.0362
(2.659) (3.159) (3.497) (0.479) (0.264) (0.265)
East Asia 8.902 1.371 1.190 -1.005* 0.576* 0.638**
(6.679) (6.981) (8.048) (0.546) (0.301) (0.272)
West Asia 10.06 -6.763 -11.43 -1.382** 0.234 0.269
(8.086) (5.938) (7.297) (0.544) (0.347) (0.339)
lnGDP/cap -6.003*** -6.565*** 1.076*** 1.002***
(1.354) (1.816) (0.0846) (0.0844)
lnGDP/cap -1.284 -1.408 -0.108** -0.0439
(0.928) (1.173) (0.0499) (0.0554)
Average tariffs -0.257 -1.142 -0.0735* -0.0688
(0.355) (0.742) (0.0369) (0.0422)
Aid recieved $ -2.93e-09 1.92e-10*
(2.51e-09) (1.02e-10)
Exports as percentage of GDP -0.0575* 0.00877***(0.0323) (0.00176)
Legal rights index, 0-10 (best) -0.710 0.0162(0.981) (0.0364)
Constant 8.515** 108.9*** 127.7*** 2.514*** -6.273*** -7.929***
(3.971) (28.34) (33.19) (0.388) (1.405) (1.525)
Observations 85,567 78,612 72,651 78,623 72,651 72,651
R-squared 0.306 0.530 0.581 0.527 0.898 0.917
Robust standard errors in parentheses
*** p<0.01, ** p<0.05, * p<0.2
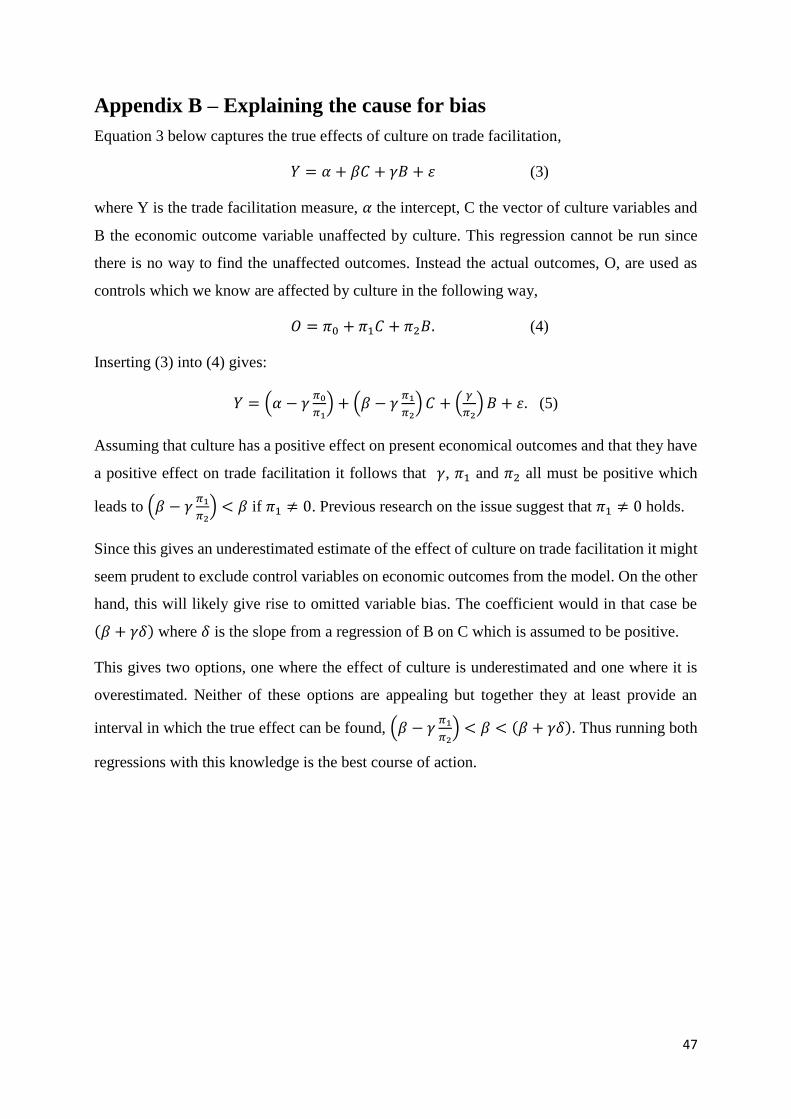
47
Appendix B – Explaining the cause for bias
Equation 3 below captures the true effects of culture on trade facilitation,
𝑌 = 𝛼 + 𝛽𝐶 + 𝛾𝐵 + 휀 (3)
where Y is the trade facilitation measure, 𝛼 the intercept, C the vector of culture variables and
B the economic outcome variable unaffected by culture. This regression cannot be run since
there is no way to find the unaffected outcomes. Instead the actual outcomes, O, are used as
controls which we know are affected by culture in the following way,
𝑂 = 𝜋0 + 𝜋1𝐶 + 𝜋2𝐵. (4)
Inserting (3) into (4) gives:
𝑌 = (𝛼 − 𝛾𝜋0
𝜋1) + (𝛽 − 𝛾
𝜋1
𝜋2)𝐶 + (
𝛾
𝜋2)𝐵 + 휀. (5)
Assuming that culture has a positive effect on present economical outcomes and that they have
a positive effect on trade facilitation it follows that 𝛾, 𝜋1 and 𝜋2 all must be positive which
leads to (𝛽 − 𝛾𝜋1
𝜋2) < 𝛽 if 𝜋1 ≠ 0. Previous research on the issue suggest that 𝜋1 ≠ 0 holds.
Since this gives an underestimated estimate of the effect of culture on trade facilitation it might
seem prudent to exclude control variables on economic outcomes from the model. On the other
hand, this will likely give rise to omitted variable bias. The coefficient would in that case be
(𝛽 + 𝛾𝛿) where 𝛿 is the slope from a regression of B on C which is assumed to be positive.
This gives two options, one where the effect of culture is underestimated and one where it is
overestimated. Neither of these options are appealing but together they at least provide an
interval in which the true effect can be found, (𝛽 − 𝛾𝜋1
𝜋2) < 𝛽 < (𝛽 + 𝛾𝛿). Thus running both
regressions with this knowledge is the best course of action.
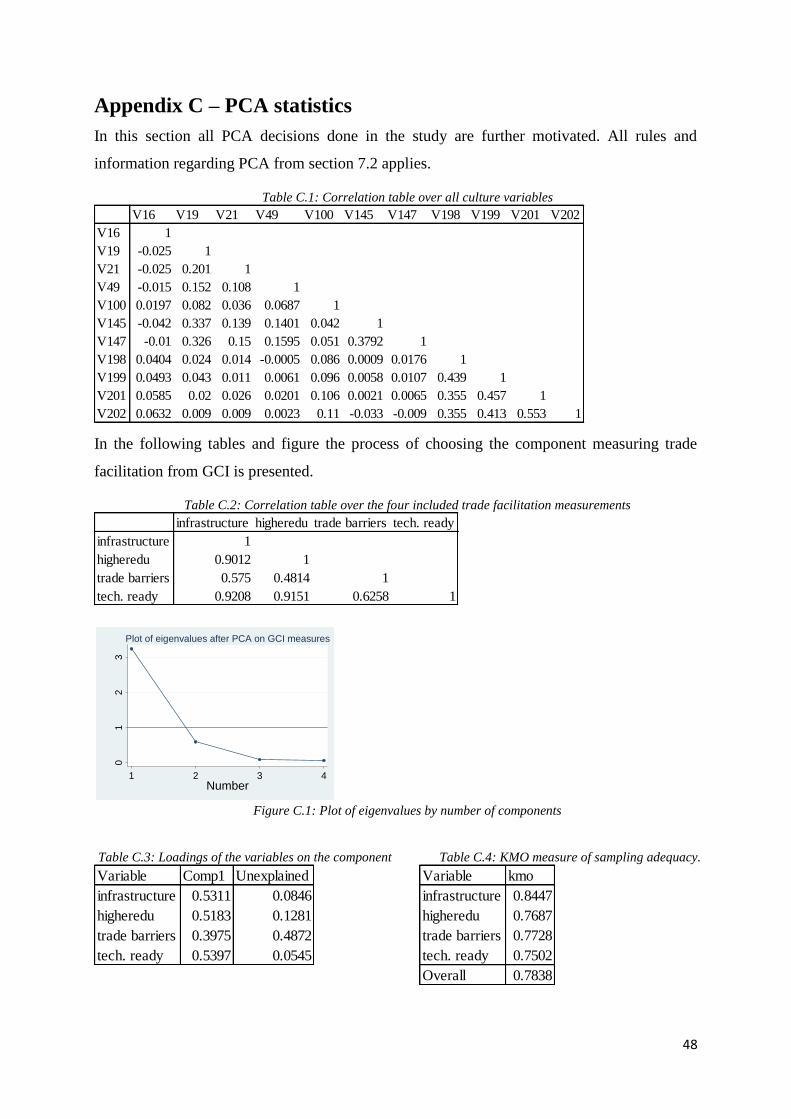
48
Appendix C – PCA statistics
In this section all PCA decisions done in the study are further motivated. All rules and
information regarding PCA from section 7.2 applies.
Table C.1: Correlation table over all culture variables
In the following tables and figure the process of choosing the component measuring trade
facilitation from GCI is presented.
Table C.2: Correlation table over the four included trade facilitation measurements
Figure C.1: Plot of eigenvalues by number of components
Table C.3: Loadings of the variables on the component
Table C.4: KMO measure of sampling adequacy.
V16 V19 V21 V49 V100 V145 V147 V198 V199 V201 V202
V16 1
V19 -0.025 1
V21 -0.025 0.201 1
V49 -0.015 0.152 0.108 1
V100 0.0197 0.082 0.036 0.0687 1
V145 -0.042 0.337 0.139 0.1401 0.042 1
V147 -0.01 0.326 0.15 0.1595 0.051 0.3792 1
V198 0.0404 0.024 0.014 -0.0005 0.086 0.0009 0.0176 1
V199 0.0493 0.043 0.011 0.0061 0.096 0.0058 0.0107 0.439 1
V201 0.0585 0.02 0.026 0.0201 0.106 0.0021 0.0065 0.355 0.457 1
V202 0.0632 0.009 0.009 0.0023 0.11 -0.033 -0.009 0.355 0.413 0.553 1
infrastructure higheredu trade barriers tech. ready
infrastructure 1
higheredu 0.9012 1
trade barriers 0.575 0.4814 1
tech. ready 0.9208 0.9151 0.6258 1
01
23
Eig
en
va
lues
1 2 3 4Number
Plot of eigenvalues after PCA on GCI measures
Variable Comp1 Unexplained
infrastructure 0.5311 0.0846
higheredu 0.5183 0.1281
trade barriers 0.3975 0.4872
tech. ready 0.5397 0.0545
Variable kmo
infrastructure 0.8447
higheredu 0.7687
trade barriers 0.7728
tech. ready 0.7502
Overall 0.7838


