
Darrell Lynn Hines College Preparatory Academy of Excellence
Programmatic Profile and Educational Performance 2010–11 School Year Report Date: October 2011
Prepared by: Janice Ereth, Ph.D. Susan Gramling Theresa Healy
Children’s Research Center A nonprofit social research agency and division of the National Council on Crime and Delinquency 426 S. Yellowstone Drive, Suite 250 Madison, WI 53719 Voice (608) 831-1180 fax (608) 831-6446 www.nccd-crc.org
https://sharepoint.nccdcrc.org/Projects/Project Documents/USA/Wisconsin/508WI_Milw/2010-11/DLH/Hines 2010-11 Yr 9 FINAL.docx © 2011 by NCCD, All Rights Reserved
TABLE OF CONTENTS
EXECUTIVE SUMMARY ............................................................................................................. i I. INTRODUCTION ...............................................................................................................1 II. PROGRAMMATIC PROFILE ............................................................................................2 A. Description and Philosophy of Educational Methodology ......................................2 1. Mission and Philosophy ...............................................................................2 2. Description of Educational Programs and Curriculum ................................3 B. Student Population ...................................................................................................4 C. School Structure .......................................................................................................6 1. Areas of Instruction ......................................................................................6 2. Classrooms ...................................................................................................7 3. Teacher Information .....................................................................................7 4. Hours of Instruction/School Calendar .......................................................11 5. Parent and Family Involvement .................................................................11 6. Waiting List ...............................................................................................12 7. Disciplinary Policy.....................................................................................12 8. Graduation and High School Information..................................................13 D. Activities for Continuous School Improvement ....................................................14 III. EDUCATIONAL PERFORMANCE ................................................................................17 A. Attendance .............................................................................................................17 B. Parent Participation ................................................................................................18 C. Special Education Needs........................................................................................18 D. Local Measures of Educational Performance ........................................................19 1. Reading Progress for Second Through Eighth Graders .............................19 a. Students Who Met Targets in 2010 ...............................................20 b. Students Who Did Not Meet Targets in 2010 ................................21 c. Students First Tested in Fall 2010 .................................................22 2. Math Progress ............................................................................................23 a. K5 and First Graders ......................................................................23 b. Second Through Eighth Graders ....................................................24 3. Language Arts Progress for Second Through Eighth Graders ...................26 4. Writing Progress ........................................................................................29 5. IEP Progress for Special Education Students ............................................31 E. External Standardized Measures of Educational Performance ..............................32 1. SDRT for K4 ..............................................................................................33 2. SDRT for K5 ..............................................................................................35 3. SDRT for First Graders ..............................................................................37 4. SDRT for Second Graders .........................................................................39 5. Standardized Tests for Third Graders ........................................................40 a. SDRT for Third Graders ................................................................40 b. WKCE for Third Graders ...............................................................41 6. WKCE for Fourth Graders .........................................................................43

https://sharepoint.nccdcrc.org/Projects/Project Documents/USA/Wisconsin/508WI_Milw/2010-11/DLH/Hines 2010-11 Yr 9 FINAL.docx © 2011 by NCCD, All Rights Reserved
TABLE OF CONTENTS (continued) 7. WKCE for Fifth Graders ............................................................................44 8. WKCE for Sixth Graders ...........................................................................46 9. WKCE for Seventh Graders .......................................................................47 10. WKCE for Eighth Graders .........................................................................48 F. Multiple-year Student Progress..............................................................................49 1. First Through Third Graders ......................................................................49 2. Progress for Students Who Met Proficiency-level Expectations ...............51 3. Progress for Students Who Did Not Meet Proficiency-level Expectations ...............................................................................................52 G. Annual Review of the School’s Adequate Yearly Progress ..................................54 1. Background Information ............................................................................54 2. Adequate Yearly Progress Review Summary ............................................55 V. SUMMARY AND RECOMMENDATIONS....................................................................57 A. Contract Compliance .............................................................................................57 B. Education-related Findings ....................................................................................57 C Local Measure Results ...........................................................................................57 D. Standardized Test Results ......................................................................................58 E. Year-to-year Academic Achievement on Standardized Tests ...............................60 F. Recommendations ..................................................................................................61 APPENDICES Appendix A: Contract Compliance Chart Appendix B: Student Learning Memorandum Appendix C: Trend Information Appendix D: Pilot Score Card
i
https://sharepoint.nccdcrc.org/Projects/Project Documents/USA/Wisconsin/508WI_Milw/2010-11/DLH/Hines 2010-11 Yr 9 FINAL.docx © 2011 by NCCD, All Rights Reserved
EXECUTIVE SUMMARY for
Darrell Lynn Hines College Preparatory Academy of Excellence 2010–11
This ninth annual report on the operation of Darrell Lynn Hines College Preparatory Academy of Excellence (DLH Academy) is a result of intensive work undertaken by the City of Milwaukee Charter School Review Committee (CSRC), DLH Academy staff, and the Children’s Research Center (CRC). Based on the information gathered and discussed in the attached report, CRC has determined the following findings. I. CONTRACT COMPLIANCE SUMMARY
For the 2010–11 academic year, DLH Academy has met all but one of its education-related contract provisions. The provision not met was that more than 58.2% of students below proficient in math on the Wisconsin Knowledge and Concepts Examination (WKCE) show advancement (actual: 41.9%). See Appendix A for an outline of specific contract provision compliance information, page references, and a description of whether or not each provision was met. II. PERFORMANCE CRITERIA A. Local Measures 1. Secondary Measures of Academic Progress
Average student attendance was 93.5%, exceeding the school’s goal of 90.0%. Parents of 97.5% of students enrolled at the time of the two scheduled
family-teacher conferences attended, falling just short of the school’s goal of all parents.
2. Primary Educational Measures of Academic Progress
The CSRC requires that the school track student progress in reading, writing, mathematics, and special education goals throughout the year to identify students in need of additional help and to assist teachers in developing strategies to improve the academic performance of all students. Students’ reading skills were tested using Measures of Academic Progress (MAP). Results include the following:
Twenty-seven (52.9%) of 51 students who met target scores last year met target scores again this year.

ii
https://sharepoint.nccdcrc.org/Projects/Project Documents/USA/Wisconsin/508WI_Milw/2010-11/DLH/Hines 2010-11 Yr 9 FINAL.docx © 2011 by NCCD, All Rights Reserved
Thirty-eight (65.5%) of 58 students who did not meet target scores last year met target scores this year.
Forty (72.7%) of 55 new or newly tested students met target scores.
In math, 41 (85.4%) of 48 kindergarten and first-grade students either met or exceeded math expectations by scoring at least 85% mastery of Everyday Math concepts.
Second- through eighth-grade student math skills were tested using MAP:
Thirty (46.9%) of 64 students who met targets last year met targets again this year.
Twenty-five (55.6%) of 45 students who did not meet target scores last year met target scores this year.
Forty (72.7%) of 55 students new or newly tested met target scores.
In writing, 162 (66.9%) of 242 K5 through eighth-grade students scored at least 3 of 4 points on grade-level writing skills, based on the Six Traits of Writing rubric.
Of the 25 students with active IEPs, 24 (96.0%) demonstrated progress on at least one goal. B. Year-to-year Academic Achievement on Standardized Tests DLH Academy administered all required standardized tests noted in its contract with the City of Milwaukee. Multiple-year advancement results indicate that second graders progressed an average of 1.2 grade-level equivalents (GLE) and third graders progressed an average of 1.0 GLE in reading on the Stanford Diagnostic Reading Test (SDRT), for an average of 1.1 GLE growth from year to year. The school therefore met the CSRC’s expectation of at least one year of advancement in reading for second and third graders. There were only eight students who tested below GLE on the SDRT in 2009–10. Due to the small size of this cohort, year-to-year advancement for these students could not be included in this report.

iii
https://sharepoint.nccdcrc.org/Projects/Project Documents/USA/Wisconsin/508WI_Milw/2010-11/DLH/Hines 2010-11 Yr 9 FINAL.docx © 2011 by NCCD, All Rights Reserved
Multiple-year advancement results for fourth- through eighth-grade students who were proficient or advanced on the WKCE in 2009–10 indicated that the school exceeded the CSRC’s expectation that at least 75.0% of these students would maintain their proficiency in reading and math (Figure ES1).
Figure ES1
Darrell Lynn Hines AcademyWKCE Results
Students Who Maintained ProficiencyFrom 2009–10 to 2010–11
82.2%
86.7%
0.0% 20.0% 40.0% 60.0% 80.0% 100.0%
Math (N = 45)
Reading (N = 60)
Multiple-year advancement results for fourth- through eighth-grade students who were below proficiency-level expectations on their 2009–10 WKCE indicated that the following percentage of students either advanced a proficiency level or at least one quartile within their previous proficiency level (see Figure ES2). The expectation was that they would exceed last year’s percentages, 45.7% in reading and 58.2% in math. The school met expectations in reading but not in math.
Figure ES2
Darrell Lynn Hines AcademyWKCE Results
Students Below Proficient Who ImprovedFrom 2009–10 to 2010–11
41.9%
55.3%
0.0% 20.0% 40.0% 60.0% 80.0% 100.0%
Math (N = 62)
Reading (N = 47)

iv
https://sharepoint.nccdcrc.org/Projects/Project Documents/USA/Wisconsin/508WI_Milw/2010-11/DLH/Hines 2010-11 Yr 9 FINAL.docx © 2011 by NCCD, All Rights Reserved
C. Adequate Yearly Progress DLH Academy met three of the four AYP objectives: test participation, attendance, and reading. The school did not meet the AYP objective for mathematics. Because the school did not miss AYP for math for two consecutive years, the school’s status for all four objectives remains “satisfactory.” An overall status of satisfactory does not require improvement under state or federal accountability requirements. III. RECOMMENDATIONS The school fully addressed the recommendations made in its 2010–11 programmatic profile and educational performance report. After reviewing the information in this report and considering the information gathered during the administration interview in May 2011, CRC and the school jointly recommend that the focus of activities for the 2011–12 school year should be as follows:
Continue the focus on data-driven decision making in order to increase the use of
student-level data to inform teacher strategies and approaches for students at all levels.
Improve the team approach to developing growth strategies.
1
https://sharepoint.nccdcrc.org/Projects/Project Documents/USA/Wisconsin/508WI_Milw/2010-11/DLH/Hines 2010-11 Yr 9 FINAL.docx © 2011 by NCCD, All Rights Reserved
I. INTRODUCTION This is the ninth annual program monitoring report to address educational outcomes for
the Darrell Lynn Hines College Preparatory Academy of Excellence (DLH Academy), one of
five schools chartered by the City of Milwaukee. This report focuses on the educational
component of the monitoring program undertaken by the City of Milwaukee Charter School
Review Committee (CSRC) and was prepared as a result of a contract between the CSRC and the
Children’s Research Center (CRC).1
The following process was used to gather the information in this report.
1. CRC staff assisted the school in developing its student learning memorandum. 2. CRC staff visited the school, conducted a structured interview with the executive director
and the principal, and reviewed pertinent documents. Additional site visits were made to observe classroom activities, student-teacher interactions, parent-staff exchanges, and overall school operations. At the end of the academic year, a structured interview was conducted with the executive director and the assistant principal to review the year and develop recommendations for school improvement.
3. CRC read case files for selected special education students to ensure that individualized
education programs (IEPs) were up-to-date. 4. DLH Academy provided electronic and paper data to CRC. Data were compiled and
analyzed at CRC.
1 CRC is a nonprofit social science research organization and division of the National Council on Crime and Delinquency.

2
https://sharepoint.nccdcrc.org/Projects/Project Documents/USA/Wisconsin/508WI_Milw/2010-11/DLH/Hines 2010-11 Yr 9 FINAL.docx © 2011 by NCCD, All Rights Reserved
II. PROGRAMMATIC PROFILE Darrell Lynn Hines College Preparatory Academy of Excellence Address: 7151 North 86th Street Milwaukee, WI 53224
Telephone: (414) 358-3542 Executive Director: Barbara P. Horton A. Description and Philosophy of Educational Methodology2 1. Mission and Philosophy The mission of DLH Academy is to accomplish excellence and equity in a kindergarten
through eighth-grade educational environment. DLH Academy provides a quality education in a
coeducational, safe, nurturing, caring, and academically challenging learning environment.
The school’s vision is that all students will:
Be given a quality education and model good character and principles;
Be afforded a quality K4–8 college preparatory education;
Experience diversity and multiculturalism;
Adhere to high moral and ethical standards;
Grow and develop their gifts, character, and academic potential;
Master high academic standards and exit the school prepared to continue their education with high expectations for successfully entering a college/university and become productive citizens;
Develop spiritually, socially, emotionally, intellectually and physically with the
support of parents, staff, and community members.
2 2009–2010 Student and Family Handbook.

3
https://sharepoint.nccdcrc.org/Projects/Project Documents/USA/Wisconsin/508WI_Milw/2010-11/DLH/Hines 2010-11 Yr 9 FINAL.docx © 2011 by NCCD, All Rights Reserved
2. Description of Educational Programs and Curriculum3 DLH Academy provided educational services to children in kindergarten (K4 and K5)
through eighth grade during the 2010–11 academic year.
DLH Academy offers a transdisciplinary curriculum through the Primary Years
Programme (PYP) of the International Baccalaureate (IB) Organization. Through the IB
curriculum, the students learn to profile all of the characteristics of educated international
persons. They are taught to value diversity and celebrate multiculturalism.
In addition to reading/literacy, language arts, and math, DLH Academy offers instruction
in science, Spanish,4 music,5 art, physical education, health, and research methods. K4 through
fifth-grade students were included in the balanced literacy approach.
This year, the school added a focus on reading and math development and improved use
of Measures of Academic Progress (MAP) data to identify gaps in student academic progress.
The school added the Woodcock-Johnson reading inventory for all new students to assess their
grade-level equivalency (GLE) in reading.
DLH Academy uses a variety of methods of instruction, including the following:
The learning principles promoted by the work of Tuck and Codding (1998). These
principles include valuing student effort; providing clear expectations that are the same for all students; utilizing a thinking curriculum; providing opportunities for students to address their own work and teach others; and having students work beside an expert who models, encourages, and guides the students.
The multiple intelligences model developed by Howard Gardner. This model includes eight intelligences characteristic of student learners: logical/mathematical, interpersonal, intrapersonal, linguistic, kinesthetic, spatial, musical, and naturalist. These intelligences are personal, interrelated, and interdependent. Multiple intelligence theory is used at DLH Academy as a learning style model.
3 Based on DLH Academy’s 2010–11 Family Handbook and interviews with school administration. 4 Spanish was provided for students grades two through five under a contract with Berlitz. 5 Music was provided through an agreement with the Wisconsin Conservatory of Music.

4
https://sharepoint.nccdcrc.org/Projects/Project Documents/USA/Wisconsin/508WI_Milw/2010-11/DLH/Hines 2010-11 Yr 9 FINAL.docx © 2011 by NCCD, All Rights Reserved
Transdisciplinary methods to integrate subject matter across themes. Promoting cohesiveness in learning by providing a central theme throughout the
various subject areas. The use of a balanced literacy program for K4 through fifth-grade students.
Balanced literacy includes graded reading and leveled books. The use of Everyday Math to develop math skills for kindergarten through sixth-
grade students and Saxon Math for seventh- and eighth-grade students. The use of the MAP program in reading and math to monitor student progress and
assist teachers with strategies to meet the needs of individual students. In addition to academic subjects, DLH Academy provides opportunities for students to
learn and be involved in community service projects.
The school provided an extended care program from 7:00 to 7:30 a.m. for no charge.
Parents were responsible for transportation.
The school’s leadership team consists of the executive director and the principal. The
executive director oversees the school’s operations, including all administrative functions and
supervision of administrative staff. The principal directs and supervises the school on a day-to-
day basis. The principal is responsible for curriculum development, academic programming, and
accountability for academic achievement. The principal provides coordination and oversight for
the IB/PYP program and ensures that appropriate guidance and support are given to staff to
implement the IB/PYP program.

5
https://sharepoint.nccdcrc.org/Projects/Project Documents/USA/Wisconsin/508WI_Milw/2010-11/DLH/Hines 2010-11 Yr 9 FINAL.docx © 2011 by NCCD, All Rights Reserved
B. Student Population
At the beginning of the year, there were 288 students, ranging from K4 through eighth
grade, enrolled in DLH Academy.6 Twenty-seven students enrolled after the school year started
and 58 students withdrew from the school prior to the end of the year. Reasons for withdrawing
included the following: 26 students moved away, 11 left because of transportation issues,
3 students were dissatisfied with the school program, and the school did not know the reasons
why 18 students left.7 Five students withdrew from K4, 7 from K5, 7 from first, 6 from second,
3 from third grade, 7 from fourth, 6 from fifth, 4 from sixth, 8 from seventh, and 5 from eighth
grade. Ten (17.2%) of the students who withdrew had special education needs. Of the
288 students who started the year at the school, 237 remained enrolled at the end of the year.
This is an 82.3% retention rate.
At the end of the year, there were 257 students enrolled at DLH Academy. They can be
described as follows:
Most (244, or 94.9%) of the students were African American, 9 (3.5%) students
were Asian, and 4 (1.6%) were Hispanic. There were 141 (54.9%) girls and 116 (45.1%) boys. Thirty-one students (12.1%) had special education needs. Ten students had special
needs in speech/language (SP/L), 5 had learning disabilities (LD), 3 had emotional/behavioral disorders (EBD), 2 had cognitive disabilities (CD), 1 had SLD with SP/L, and 10 students had other health impairments (OHI).
There were 231 (89.9%) students eligible for free (n = 207) or reduced (n = 24)
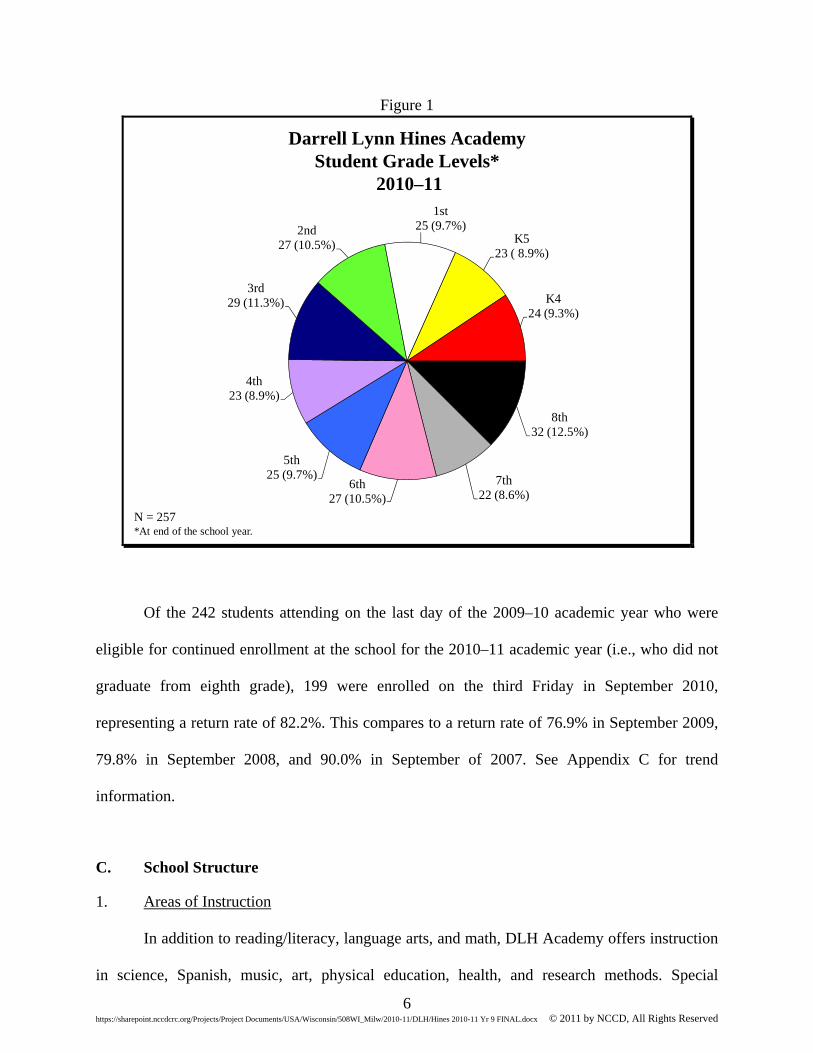
lunch prices. The remaining 26 (10.1%) were not eligible. The largest grade was eighth, with 32 students. The number of students by grade
level is illustrated in Figure 1.
6 As of September 17, 2010. 7 In the data file submitted by the school, reasons were “unknown” for 11 students and blank for 7 students.
6
https://sharepoint.nccdcrc.org/Projects/Project Documents/USA/Wisconsin/508WI_Milw/2010-11/DLH/Hines 2010-11 Yr 9 FINAL.docx © 2011 by NCCD, All Rights Reserved
Figure 1
Darrell Lynn Hines AcademyStudent Grade Levels*
2010–11
N = 257*At end of the school year.
8th 32 (12.5%)
7th 22 (8.6%)
6th 27 (10.5%)
5th 25 (9.7%)
4th 23 (8.9%)
3rd 29 (11.3%)
2nd 27 (10.5%)
1st 25 (9.7%)
K5 23 ( 8.9%)
K4 24 (9.3%)
Of the 242 students attending on the last day of the 2009–10 academic year who were
eligible for continued enrollment at the school for the 2010–11 academic year (i.e., who did not
graduate from eighth grade), 199 were enrolled on the third Friday in September 2010,
representing a return rate of 82.2%. This compares to a return rate of 76.9% in September 2009,
79.8% in September 2008, and 90.0% in September of 2007. See Appendix C for trend
information.
C. School Structure
1. Areas of Instruction
In addition to reading/literacy, language arts, and math, DLH Academy offers instruction
in science, Spanish, music, art, physical education, health, and research methods. Special

7
https://sharepoint.nccdcrc.org/Projects/Project Documents/USA/Wisconsin/508WI_Milw/2010-11/DLH/Hines 2010-11 Yr 9 FINAL.docx © 2011 by NCCD, All Rights Reserved
education programming is provided to students identified as needing an IEP. There are six
marking periods each school year. At the end of each period, or every six weeks, report cards are
distributed to parents/guardians. Midway through each period, progress reports are sent home to
update parents on student progress.
2. Classrooms
The school had 11 classrooms, each with approximately 26 students. This year, K4 was
all day as opposed to half-day in the previous year. There was one classroom per grade for
grades K4 through seventh grade and two classrooms of eighth graders. Each classroom from K4
through first grades had a teacher and an educational assistant. Two assistants were shared by
teachers in second and third grade and fourth and fifth grade. The sixth-, seventh-, and eighth-
grade teachers did not have an educational assistant.
3. Teacher Information
During the 2010–11 school year, DLH Academy employed a total of 21 instructional
staff members. There were 13 classroom teachers and 8 other instructional staff.8 Classroom
teachers consisted of 7 elementary (1 for each grade, K4 through 5) and 6 middle school
classroom teachers (2 in math and 1 each in English, science, and social studies). The 8 other
instructional staff consisted of 3 special education staff, including a special education teacher, a
school psychologist, and a speech language pathologist; 1 health/physical education teacher; 1 IB
coordinator; 1 librarian/media specialist; a reading teacher; and a principal.9
8 Six of the classroom teachers were first-year “Teach for America” teachers. 9 The teacher mentor took a middle school math teaching position in November 2010 to replace a teacher who resigned.

8
https://sharepoint.nccdcrc.org/Projects/Project Documents/USA/Wisconsin/508WI_Milw/2010-11/DLH/Hines 2010-11 Yr 9 FINAL.docx © 2011 by NCCD, All Rights Reserved
Of the 21 instructional staff who began in the fall of 2010, two resigned prior to the end
of the school year: a middle school math teacher resigned in November 2010 and a third-grade
teacher resigned in April 2011. This results in a staff retention rate of 90.5%. The 13 classroom
teachers had been teaching at the school for 1 to 6 years, with an average of 2.3 years. All 21
instructional staff combined taught at this school from 1 to 7 years, with an average of 2.7. Seven
of the staff members (6 classroom teachers and the school psychologist) were new to the school
in the fall of 2010. All six of the classroom teachers who were employed at the end of the 2009–
10 school year and who were eligible to return came back to the school in fall of 2010, for a
return rate of 100%. All of the 7 instructional staff who were employed at the end of the 2009–10
school year and were eligible to return came back to the school in fall of 2010.10 All 13
instructional staff who were eligible returned to the school. All of these professionals held a
Wisconsin Department of Public Instruction (DPI) license or permit.
The school reported the following staff development activities prior to and during the
school year:
August
» Data-driven Decisions: Teachers gathered together to discuss how student
academic data would be collected and analyzed during the school year.
» Everyday Math workshop at Central City Cyberschool (all teachers): Central City Cyberschool and DLH Academy formed a partnership surrounding an assessment project sponsored by Mary Freytag.
» Organizational Day: Subject leaders met with teachers to discuss
curriculum expectations for the year.
» Banking Day Focus: The reading teacher led a workshop with teachers on Bloom’s Taxonomy and how to increase their questioning practices with students.
10 Six classroom teachers and one instructional staff member from the prior year were not asked back for 2010–11 and therefore were not eligible to return.

9
https://sharepoint.nccdcrc.org/Projects/Project Documents/USA/Wisconsin/508WI_Milw/2010-11/DLH/Hines 2010-11 Yr 9 FINAL.docx © 2011 by NCCD, All Rights Reserved
September » Middle School Social Studies Teacher, Financial Fitness Workshop: The
social studies teacher attended a workshop where he gained information about finances and how to increase student understanding surrounding financial literacy.
» Southeastern Wisconsin Assessment Collaborative (SEWAC; all new teachers): SEWAC is a yearlong series of workshops hosted by Alverno College and funded by the Joyce Foundation. This year, the school’s newly hired teachers attended SEWAC for assessment training. There were eight sessions during the year, which provided teachers with information on formative and summative assessments.
» Middle School Science Teacher, Naviance Conference: The middle school science teacher attended a Naviance training surrounding an online college readiness program and assistance with choosing careers.
» Everyday Math Conference (fourth-, fifth-, and sixth-grade teachers): All
new fourth, fifth, and sixth grade teachers attended the Everyday Math Conference to learn how to implement the program.
October
» Banking Day, Northwest Evaluation Association Training (Math): Entire
staff learned information surrounding MAP math assessments.
» Professional Development Plan (PDP Training): The speech pathologist attended a training to become a team member for teachers interested in completing a PDP plan to update or renew teacher license.
» Response to Intervention (RtI): Charter School Collaborative Group
gathered schools together to begin to work on the implementation of the new law surrounding RtI. This group met throughout the year.
» SEWAC (all new teachers).
» School Psychologist Conference: The school psychologist attended the
conference for all school psychologists.
» Everyday Math Training (held at Central City Cyberschool; all staff).
» Research day for personal development (all teachers): Teachers use this teacher convention day as a day to attend any workshop of their choosing or as professional development research time.
10
https://sharepoint.nccdcrc.org/Projects/Project Documents/USA/Wisconsin/508WI_Milw/2010-11/DLH/Hines 2010-11 Yr 9 FINAL.docx © 2011 by NCCD, All Rights Reserved
November » PAVE: Data Team members attended several sessions throughout the
school year on how to gather and analyze data. » Trauma-informed Conference: The school psychologist attended
conference to learn about trauma and its impact on students.
» SEWAC (all new teachers).
January » SEWAC (all new teachers). » The Elementary Team attended Primary Years Programme Workshop in
Los Angeles: Each year the elementary teachers are required to attend training sponsored by the International Baccalaureate Organization as an accredited IBO school.
» The Middle School Team visited St. Marcus School, a model of a
successful school in the City of Milwaukee.
» K5/K4 Kindergarten Conference: K4 and K5 teachers attended the Kindergarten Conference to learn new strategies and techniques.
» RtI: The Charter School Collaborative Group compiled schools to begin to
work on the implementation of the new law surrounding RtI.
February
» SEWAC (new teachers).
March » SEWAC (new teachers).
» Banking Day: Teachers reviewed the Primary Years Programme planners
to note overlaps in vertical and horizontal articulation. This is also a time when teachers reviewed planners to make sure all Wisconsin standards are being addressed.
April
» SEWAC (new teachers).
May
» SEWAC (new teachers).

11
https://sharepoint.nccdcrc.org/Projects/Project Documents/USA/Wisconsin/508WI_Milw/2010-11/DLH/Hines 2010-11 Yr 9 FINAL.docx © 2011 by NCCD, All Rights Reserved
» Increase the Effectiveness of Your Language Therapy Program, Speech
Pathologist: The school speech pathologist attended this conference to learn new strategies to be used with her students.
» RtI: The Charter School Collaborative Group compiled schools to begin to
work on the implementation of the new law surrounding RtI.
First-year employees’ performance was evaluated formally twice during the year.
Returning staff received a formal evaluation one time during the year.
4. Hours of Instruction/School Calendar
The regular school day for all students began at 7:55 a.m. and ended at 3:15 p.m.11 The
first day of school was September 1, 2010, and the last day of school was June 13, 2011.12 The
highest possible number of days for student attendance in the academic year was 175. Five
additional days were “banked” for teacher work days. DLH Academy has met the City of
Milwaukee’s requirement of providing at least 875 instructional hours, as well as its contract
provision requiring the school to publish an annual calendar.
5. Parent and Family Involvement
DLH Academy’s 2010–11 Family Handbook was provided to every family prior to the
start of the school year. In this handbook, DLH Academy invites parents to become active
members of the family involvement team (FIT), which is composed of all parents and guardians
of DLH Academy students. Its purpose is to provide positive communication between
parents/guardians/family members and the school administration, to facilitate parental
11 Breakfast was served daily. 12 Based on a calendar provided by the school in the 2010–11 Family Handbook.

12
https://sharepoint.nccdcrc.org/Projects/Project Documents/USA/Wisconsin/508WI_Milw/2010-11/DLH/Hines 2010-11 Yr 9 FINAL.docx © 2011 by NCCD, All Rights Reserved
involvement in school governance and educational issues, to organize volunteers, to review and
discuss school performance issues, and to assist in fundraising and family education training.
DLH Academy offers parents/guardians/family members an opportunity to review and
sign its family agreement. This agreement is a contract that describes the roles of the school and
the family in partnership to achieve academic and school goals for students. This year the
administrator of the school reported that 236 (99.6%) of 237 DLH Academy families signed the
agreement known as the “School-Parent Compact.”
Parents/guardians of all new students were required to attend a mandatory orientation
session with their child prior to the start of school. Parents/guardians of returning students who
had not consistently adhered to school policies and guidelines were invited to individual
meetings to determine strategies to ensure the child’s future success. Family-teacher conferences
were scheduled twice during the year, in October and March. Telephone conferences were
substituted for in-person conferences when parents/guardians were unable to attend. Families
were also invited to attend special programs and events scheduled throughout the year such as
Founder’s Day, Harvest Day, Honors and Awards Convocation and Reception, Science Fair, and
the fifth-grade Rites of Passage ceremony and luncheon.
6. Waiting List
In September 2010, the school’s leadership reported that the school did not have an active
waiting list. At the end of the academic year, the school leadership indicated that as of June 1,
2011, the school had no waiting list and was still enrolling students.
13
https://sharepoint.nccdcrc.org/Projects/Project Documents/USA/Wisconsin/508WI_Milw/2010-11/DLH/Hines 2010-11 Yr 9 FINAL.docx © 2011 by NCCD, All Rights Reserved
7. Disciplinary Policy DLH Academy clearly explains its discipline policy and plan to parents and students in
its Family Handbook. The student management section of the handbook includes a statement of
student expectations, parent and guardian expectations, and an explanation of the “School-Parent
Compact.” In addition, an explanation of the school’s discipline plan and disciplinary actions is
provided. The types of disciplinary referrals include conferences with the student, the teacher,
and the parent or guardian; referral to administration for Saturday detention; in-house
suspension; out-of-school suspension; and expulsion recommendation. Each of these is explained
in the handbook, along with appeal rights and procedures. The school also has an explicit
weapons and criminal offense policy that prohibits guns and other weapons, alcohol or drugs,
and bodily harm to any member of the school community. These types of offenses can result in
expulsion. The discipline plan states an action for each type of infraction.
Students are also referred for awards. These include awards for attendance and the
academic honor roll. An annual awards convocation honors students who have excelled in
academic achievement and have demonstrated positive behavior and character traits that
exemplify a model student.
8. Graduation and High School Information
DLH Academy provides an eighth-grade advisor who works with students and parents to
assist students with their high school choices and apply for enrollment by the early admission
timeline established by Milwaukee Public Schools (MPS). This advisor helps students and
parents with completing and tracking the paperwork for high school admission, and school
personnel provide letters of recommendation as needed. In addition, students were encouraged to

14
https://sharepoint.nccdcrc.org/Projects/Project Documents/USA/Wisconsin/508WI_Milw/2010-11/DLH/Hines 2010-11 Yr 9 FINAL.docx © 2011 by NCCD, All Rights Reserved
attend a local fair hosted by Great Schools. DLH Academy also hosted a team of students from
one of the local high schools who came to recruit new students.
This year, 32 students graduated from DLH Academy. At the time of this report, 4
students were enrolled at Destiny High School, 4 at Wisconsin Lutheran High School, 3 at
Messmer High School, 3 at Milwaukee High School of the Arts, 3 at Rufus King, 2 at
Milwaukee Lutheran High School, 2 at Vincent High School, 1 at Alexander Hamilton High
School, 1 at Cedarburg High School, 1 at Homestead, 1 at Marquette University High School,
and 7 were undecided as to where to attend high school.
The spring of 2011 is the second year that former DLH Academy eighth graders
graduated from high school. The school set up a DLH Academy alumni and friends Facebook
page as an attempt to track the eighth-grade graduates of the classes of 2006 and 2007. The
school intends to use Facebook to identify former students who might be enrolled in a
university/college, a community college, in the military, and/or actively employed, etc. One
anecdotal report is that a former DLH valedictorian received an IB diploma from Rufus King
High School and was on the National Honor Roll.
D. Activities for Continuous School Improvement
The following is a description of DLH Academy’s response to the activities that were
recommended in its programmatic profile and education performance report for the 2009–10
academic year.
Recommendation: Implement more focused staff development, especially with
newer staff, that specifically addresses the need for commitment to developing excellence. Response: The new classroom teachers all participated in SEWAC. SEWAC is a yearlong series of workshops hosted by Alverno College with funding from the Joyce Foundation. Its purpose is to support schools and districts in and around the
15
https://sharepoint.nccdcrc.org/Projects/Project Documents/USA/Wisconsin/508WI_Milw/2010-11/DLH/Hines 2010-11 Yr 9 FINAL.docx © 2011 by NCCD, All Rights Reserved
greater Milwaukee area in building their capacity to use formative classroom assessment to support student learning. Schools are encouraged to send teams of four to eight teachers plus an administrator to the workshops. This year, there were eight one-day sessions during the year, which provided teachers with information on formative and summative assessments.
The school partnered with Central City Cyberschool for math training twice during the year. DLH Academy staff also visited Cyberschool and St. Marcus to observe classrooms.
Recommendation: Increase the use of student-level data to inform teacher strategies and approaches to meet the needs of individual students.
Response: Teachers met over the summer of 2010 to develop a “school pacing guide” that aligns the curriculum with the state reading and math standards. This leveling guide, in draft form, addresses the skills students need in each grade to meet the state standards. The teachers also developed an assessment calendar prior to the start of the school year. The school formed a data team consisting of subject leaders in math, reading, and writing plus a middle school representative, the PYP coordinator, the principal, and the school’s executive director. The data team met with primary grade teachers and middle school teachers to review the data from their in-class assessments. The teaching staff posted student data in their classrooms, which resulted in students and teachers becoming more involved in their classroom outcomes. The students could track how much they were growing. The school also held curriculum meetings and used a Teach for America–designed MAP tracker, which allowed tracking of each student’s reading and math, for grades two through eight. In addition, the Everyday Math tracker was used for tracking each student’s math results at the elementary level. This information was used during tutoring and for accelerated reading and math. This information was also shared with parents. The school also held Saturday meetings where teachers examined student data on an individual basis. The results of these meetings were also shared with parents. During the second semester, the teachers created action plans for students who were not functioning at grade level. As part of the action plans, teachers created calendars and made assignments to parents. This system will be implemented in the fall of 2011.
16
https://sharepoint.nccdcrc.org/Projects/Project Documents/USA/Wisconsin/508WI_Milw/2010-11/DLH/Hines 2010-11 Yr 9 FINAL.docx © 2011 by NCCD, All Rights Reserved
Recommendation: Increase the math block across all grade levels.
Results: The math time was increased to 90 minutes for all students at all grade levels. In addition, struggling students were pulled out of class for extra math instruction twice per week.
Recommendation: Realign math standards so that the math curriculum adequately addresses the second- and third-grade standards.
Results: In addition to the collaboration with Central City Cyberschool and the math consultant, the school implemented a process to align the math curriculum with state standards. In the summer of 2010, the school created pacing guides to align curricula related to the state standards for each grade level. The staff completed the standards curriculum for most of the grades during the school year. Each grade level will ultimately have curriculum that includes an end-of-the-year introduction to the next year’s standards. The school’s goal is to complete the curriculum that addresses each year’s grade-level standards as soon as possible.
Recommendation: Target second- and third-grade students by introducing test-
taking strategies and identifying enrichment activities to increase performance on the Stanford Diagnostic Reading Test (SDRT). Target second- and third-grade students with more intense phonics instruction
Response: The reading specialist assisted in the implementation of a new phonics curriculum. In second grade, the curriculum included phonemic awareness and phonics. Students in grades three through five were grouped by ability for specific instruction for 30 minutes per day as part of a concentrated effort to address the students’ needs in phonemic awareness and phonics.
The school is also exploring the possibility of obtaining the extended SDRT testing to allow assessing K4 through seventh-grade students to obtain a grade-level equivalency in reading. Twenty second- and third-grade students below grade level will be attending summer school in the summer of 2011.
17
https://sharepoint.nccdcrc.org/Projects/Project Documents/USA/Wisconsin/508WI_Milw/2010-11/DLH/Hines 2010-11 Yr 9 FINAL.docx © 2011 by NCCD, All Rights Reserved
III. EDUCATIONAL PERFORMANCE To monitor activities as described in the school’s contract with the City of Milwaukee, a
variety of qualitative and quantitative information was collected at specific intervals during the
past several academic years. At the start of this year, the school established attendance and
parent participation goals, as well as goals related to special education student records. The
school also identified local and standardized measures of academic performance to monitor
student progress. The local assessment measures included reading assessments based on the
MAP for second through eighth graders; mathematics progress reports for K5 and first graders
and MAP math results for students in second through eighth grades; language arts progress as
measured by MAP for second through eighth graders; and results of the Six Traits of Writing
assessment for all students.
The standardized assessment measures used were the SDRT and the Wisconsin
Knowledge and Concepts Examination (WKCE). The WKCE is administered to all public school
third- through eighth-grade students to meet federal No Child Left Behind requirements that
schools test students’ skills in reading and math.
A. Attendance
CRC examined student attendance in two ways. The first reflected the average time
students actually attended school and the second rate included excused absences. Both rates
include all students enrolled in the school at any time. The school considered a student present if
she/he attended the school for at least half of the day. CRC also examined the time students
spent, on average, suspended (in or out of school).
This year, 131 students were suspended at least once. Grade levels ranged from K5 to
eighth grade. Eighty-five students spent, on average, 3.5 days out of school on suspension, and

18
https://sharepoint.nccdcrc.org/Projects/Project Documents/USA/Wisconsin/508WI_Milw/2010-11/DLH/Hines 2010-11 Yr 9 FINAL.docx © 2011 by NCCD, All Rights Reserved
99 students spent an average of 2.3 days in school and on suspension. (Note that some students
were given in- and out-of-school suspensions during the year.) The attendance rate this year was
93.5%.13 When excused absences were included, the attendance rate rose to 96.8%.
At the beginning of the academic year, the school established a goal of maintaining an
average attendance rate of 90.0%. Based on these calculations, DLH Academy exceeded its
attendance goal.
B. Parent Participation
At the beginning of the academic year, the school set a goal that parents/guardians would
attend at least two scheduled family-teacher conferences. This year, conferences were held in
October and March. There were 237 students enrolled at the time of both conferences (i.e., for
the year). Parents of 231 (97.5%) children attended the first and parents of 236 (99.6%) attended
the second conferences. Parents of 231 (97.5%) attended both. DLH Academy has, therefore,
met its goal related to parent participation.
C. Special Education Needs
This year, the school set a goal to develop and maintain records for all special education
students. Nine students were assessed for eligibility this year and IEPs were completed for all of
them. Parents of 8 of the 9 students participated in completing the IEP. IEP reviews were
scheduled for an additional 36 students. Eight of these students were dropped from services prior
to the meeting and three students were no longer eligible. IEPs were completed for the remaining
25 students. Parents of 24 of the 25 students participated in the review. Overall, IEPs were
completed for all students with special education needs, and IEP reviews were conducted for all
13 Individual student attendance rates were calculated by dividing the total number of days present by the total number of days that the student was enrolled. Individual rates were then averaged across all students.

19
https://sharepoint.nccdcrc.org/Projects/Project Documents/USA/Wisconsin/508WI_Milw/2010-11/DLH/Hines 2010-11 Yr 9 FINAL.docx © 2011 by NCCD, All Rights Reserved
students requiring one; the school has therefore met its goal. In addition, CRC conducted a
review of a representative number of files during the year. This review showed that students had
current IEPs indicating their eligibility for special education services, the IEPs were reviewed in
a timely manner, and that parents were invited to develop and be involved in their child’s IEP.
D. Local Measures of Educational Performance
Charter schools, by their definition and nature, are autonomous schools with curricula
that reflect each school’s individual philosophy, mission, and goals. In addition to administering
standardized tests, each charter school is responsible for describing goals and expectations for its
students in the context of that school’s unique approach to education. These goals and
expectations are established by each City of Milwaukee–chartered school at the beginning of the
academic year to measure the educational performance of its students. These local measures are
useful for monitoring and reporting progress, guiding and improving instruction, clearly
expressing the expected quality of student work, and providing evidence that students are
meeting local benchmarks. The CSRC expectation is that at a minimum, schools must establish
local measures in reading, writing, math, and special education.
A description of the local measures developed by DLH Academy and a discussion of
outcomes follows.
1. Reading Progress for Second Through Eighth Graders
This year, the school set goals for returning students and for new students. The goal for
returning students was that at least 75% of students who met target RIT scores in the spring of
2010 would again meet their target score in the spring of 2011, and that at least 10% for students
who did not meet target scores in 2010 would meet target scores in 2011 as measured by MAP

20
https://sharepoint.nccdcrc.org/Projects/Project Documents/USA/Wisconsin/508WI_Milw/2010-11/DLH/Hines 2010-11 Yr 9 FINAL.docx © 2011 by NCCD, All Rights Reserved
test results.14 Goals for new students (i.e., those without spring 2010 scores) were that 50%
would meet target scores based on the spring 2011 MAP test.
a. Students Who Met Targets in 2010
As illustrated in Table 1, of the 51 students who met target scores when given the exam
in the spring of 2010, 27 (52.9%) met their target reading score on the spring 2011 test
administration, falling short of the school’s goal of 75%.
Table 1
Darrell Lynn Hines Academy
Reading Progress for Students Who Met Target Reading Scores in Spring 2010
2nd Through 8th Grade Based on Measures of Academic Progress Tests
Grade N Met Target RIT Score in Spring 2011
N %
2nd* N/A N/A N/A
3rd 10 7 70.0%
4th 6 Cannot report due to N size
5th 13 9 69.2%
6th 8 Cannot report due to N size
7th 5 Cannot report due to N size
8th 9 Cannot report due to N size
Total 51 27 52.9%
*Second graders were not tested as first graders in 2010.
14 The RIT score indicates student skills on developmental curriculum scales or continua. There are RIT scales for each subject, so scores from one subject are not the same as for another. Individual growth targets are defined as the average amount of RIT growth observed for students in the latest Northwest Evaluation Association (NWEA) norming study who started the year with a RIT score in the same 10-point RIT block as the individual student. For more information on the RIT score and the mean growth target score, see the NWEA website, www.nwea.org/assessments/researchbased.asp.

21
https://sharepoint.nccdcrc.org/Projects/Project Documents/USA/Wisconsin/508WI_Milw/2010-11/DLH/Hines 2010-11 Yr 9 FINAL.docx © 2011 by NCCD, All Rights Reserved
b. Students Who Did Not Meet Targets in 2010
As illustrated in Table 2, there were 58 students who did not meet targets in spring 2010.
Thirty-eight (65.5%) of these students met targets this year, exceeding the school’s goal of 10%.
Table 2
Darrell Lynn Hines Academy
Reading Progress for Students Who Did Not Meet Target Reading Scores in Spring 2010
2nd Through 8th Grade Based on Measures of Academic Progress Tests
Grade N Met Target in Spring 2011
N %
2nd* N/A N/A N/A
3rd 11 9 81.8%
4th 9 Cannot report due to N size
5th 16 13 81.3%
6th 5 Cannot report due to N size
7th 4 Cannot report due to N size
8th 13 7 53.8%
Total 58 38 65.5%
*Second graders were not tested as first graders in 2010.
22
https://sharepoint.nccdcrc.org/Projects/Project Documents/USA/Wisconsin/508WI_Milw/2010-11/DLH/Hines 2010-11 Yr 9 FINAL.docx © 2011 by NCCD, All Rights Reserved
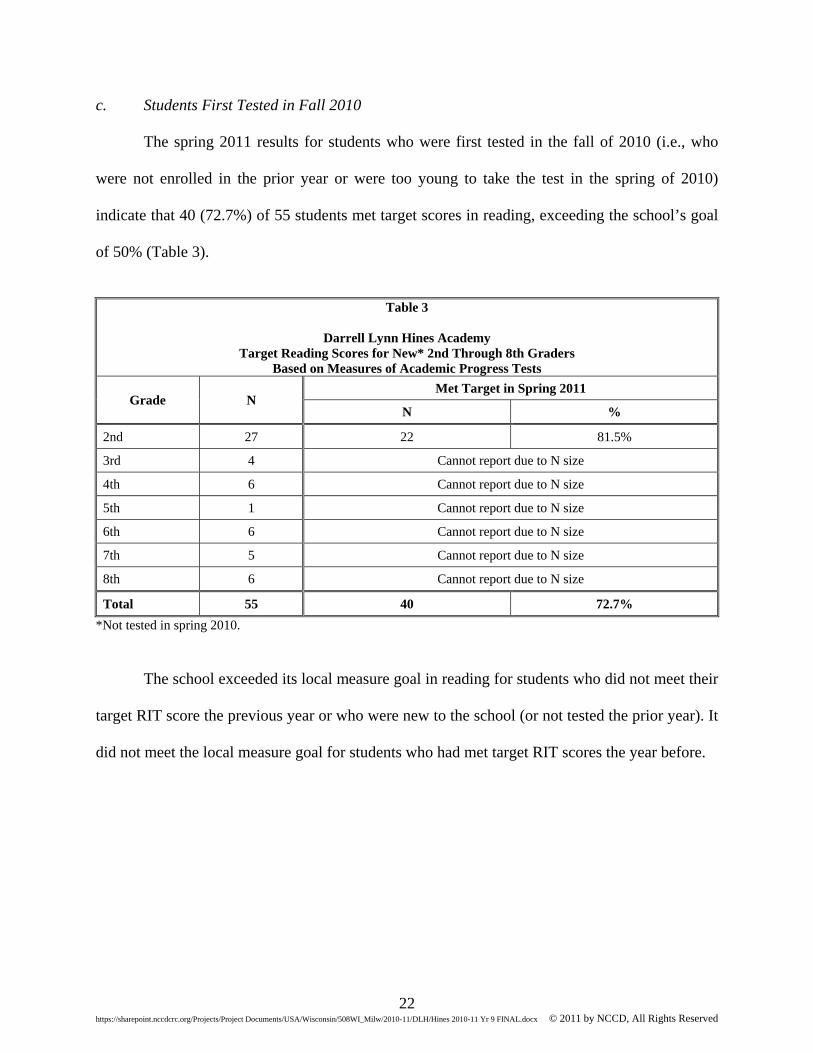
c. Students First Tested in Fall 2010
The spring 2011 results for students who were first tested in the fall of 2010 (i.e., who
were not enrolled in the prior year or were too young to take the test in the spring of 2010)
indicate that 40 (72.7%) of 55 students met target scores in reading, exceeding the school’s goal
of 50% (Table 3).
Table 3
Darrell Lynn Hines Academy
Target Reading Scores for New* 2nd Through 8th Graders Based on Measures of Academic Progress Tests
Grade N Met Target in Spring 2011
N %
2nd 27 22 81.5%
3rd 4 Cannot report due to N size
4th 6 Cannot report due to N size
5th 1 Cannot report due to N size
6th 6 Cannot report due to N size
7th 5 Cannot report due to N size
8th 6 Cannot report due to N size
Total 55 40 72.7%
*Not tested in spring 2010.
The school exceeded its local measure goal in reading for students who did not meet their
target RIT score the previous year or who were new to the school (or not tested the prior year). It
did not meet the local measure goal for students who had met target RIT scores the year before.

23
https://sharepoint.nccdcrc.org/Projects/Project Documents/USA/Wisconsin/508WI_Milw/2010-11/DLH/Hines 2010-11 Yr 9 FINAL.docx © 2011 by NCCD, All Rights Reserved
2. Math Progress
a. K5 and First Graders
Math skills for students in K5 and first grade are assessed on a 4-point rubric in which 4
is advanced, 3 is proficient, 2 is basic, and 1 indicates a minimal skill level. To track math
progress at a local level, the school set a goal that at least 85% of K5 and first-grade students
would demonstrate a 3 or 4 on at least 75% of grade-level math concepts taught during the year.
There were 57 concepts taught to K5 and 61 taught to first graders.
This year, 41 (85.4%) of 48 students met the goal to score proficient or higher on 75% of
math skills (Figure 2).
Figure 2
Darrell Lynn Hines AcademyMath Progress
K5 and 1st Graders2010–11
N = 48
Did Not Meet Expectations
7 (14.6%)
Met Expectations 41 (85.4%)

24
https://sharepoint.nccdcrc.org/Projects/Project Documents/USA/Wisconsin/508WI_Milw/2010-11/DLH/Hines 2010-11 Yr 9 FINAL.docx © 2011 by NCCD, All Rights Reserved
b. Second Through Eighth Graders
This year, the school set the following goals: (1) at least 75% of students who met target
scores in the spring of 2010 would again meet target scores; (2) at least 10% of students who did
not meet target scores would meet target scores; and (3) 50% of students who were not tested in
the spring of 2010 but were tested in the fall of 2010 would meet target scores. MAP results were
submitted for students who were administered the test in the spring of 2010 and/or the spring of
2011.15
Results indicate that 46.9% of 64 students who previously met their target math scores
met their target score again (Table 4), falling short of the school’s goal of 75%.
Table 4
Darrell Lynn Hines Academy
Progress for Students Who Met Target Math Scores in Spring 2010 2nd Through 8th Graders
Based on Measures of Academic Progress Tests
Grade N Met Target in Spring 2011
N %
2nd* N/A N/A N/A
3rd 15 7 46.7%
4th 8 Cannot report due to N size
5th 20 11 55.0%
6th 6 Cannot report due to N size
7th 5 Cannot report due to N size
8th 10 4 40.0%
Total 64 30 46.9%
*Second graders were not tested as first graders in 2010.
15 Spring 2010 scores were provided in the summer of 2010.
25
https://sharepoint.nccdcrc.org/Projects/Project Documents/USA/Wisconsin/508WI_Milw/2010-11/DLH/Hines 2010-11 Yr 9 FINAL.docx © 2011 by NCCD, All Rights Reserved
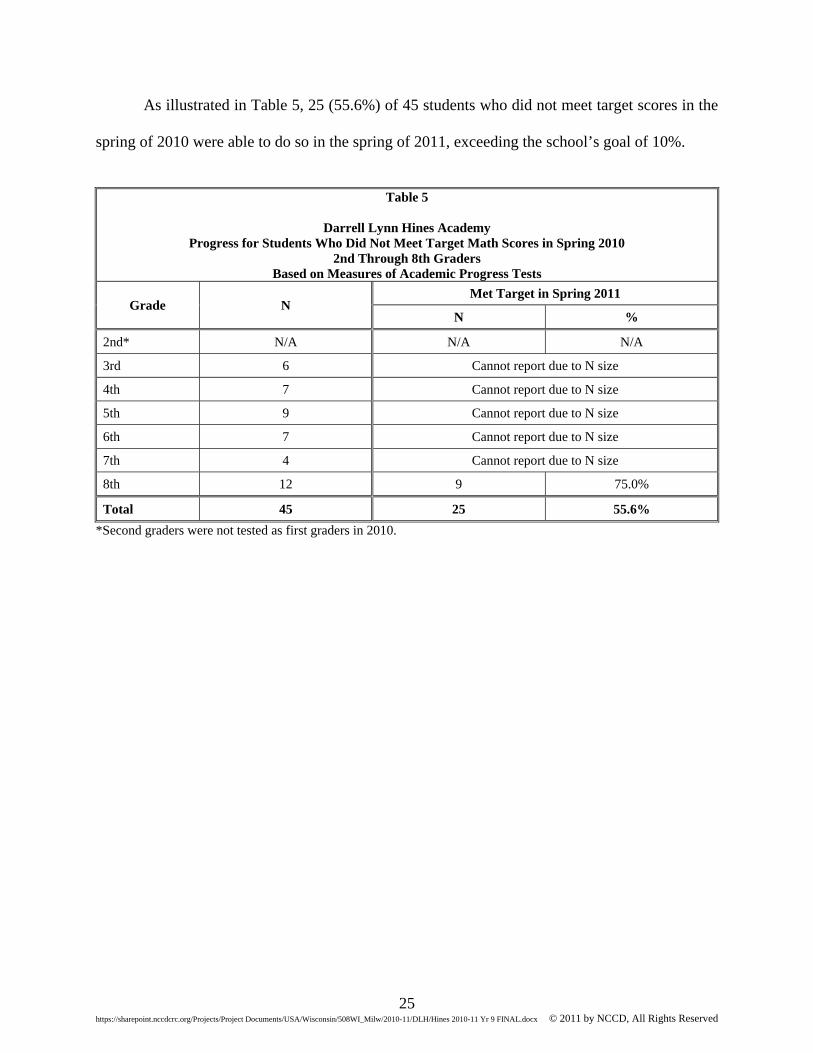
As illustrated in Table 5, 25 (55.6%) of 45 students who did not meet target scores in the
spring of 2010 were able to do so in the spring of 2011, exceeding the school’s goal of 10%.
Table 5
Darrell Lynn Hines Academy
Progress for Students Who Did Not Meet Target Math Scores in Spring 2010 2nd Through 8th Graders
Based on Measures of Academic Progress Tests
Grade N Met Target in Spring 2011
N %
2nd* N/A N/A N/A
3rd 6 Cannot report due to N size
4th 7 Cannot report due to N size
5th 9 Cannot report due to N size
6th 7 Cannot report due to N size
7th 4 Cannot report due to N size
8th 12 9 75.0%
Total 45 25 55.6%
*Second graders were not tested as first graders in 2010.

26
https://sharepoint.nccdcrc.org/Projects/Project Documents/USA/Wisconsin/508WI_Milw/2010-11/DLH/Hines 2010-11 Yr 9 FINAL.docx © 2011 by NCCD, All Rights Reserved
Results for the 55 students were not tested in the spring of 2010 (i.e., who were in first
grade in 2010 or were new to the school this year) indicate that 40 (72.7%) met target scores in
math. See Table 6.
Table 6
Darrell Lynn Hines Academy
Target Math Scores for New* 2nd Through 8th Graders Based on Measures of Academic Progress Tests
Grade N Met Target in Spring 2011
N %
2nd 27 23 85.2%
3rd 4 Cannot report due to N size
4th 6 Cannot report due to N size
5th 1 Cannot report due to N size
6th 6 Cannot report due to N size
7th 5 Cannot report due to N size
8th 6 Cannot report due to N size
Total 55 40 72.7%
*Students not tested in the spring of 2010.
Overall, the school met local measures in math for students in K5 though first grade, and
for students in second through eighth grades who either did not meet their RIT target score the
previous year or who were new to the school (or not tested the prior year). However, the school
did not meet its local measure goal for second- through eighth-grade students who had met their
RIT target score the year before.
3. Language Arts Progress for Second Through Eighth Graders
The school also used MAP test results from the fall and spring to assess student progress
in language arts. The school’s goal was that at least 75% of students who reached their target
score on the spring 2010 test administration would again meet target goals on the spring 2011
test; that 10% of the students who did not meet targets in spring 2010 would reach target scores;

27
https://sharepoint.nccdcrc.org/Projects/Project Documents/USA/Wisconsin/508WI_Milw/2010-11/DLH/Hines 2010-11 Yr 9 FINAL.docx © 2011 by NCCD, All Rights Reserved
and that 50% of new students (i.e., those not tested in spring 2010) would reach target scores in
the spring of 2011. Test results were submitted for students who were administered MAP in the
spring of 2010 and/or the spring of 2011.
Results indicate that 62.1% of students who met their target score in the spring of 2010
again met their target score (Table 7),16 falling short of the goal of 75%.
Table 7
Darrell Lynn Hines Academy
Language Arts Scores for 2nd Through 8th Graders Who Met Target in Spring 2010 Based on Measures of Academic Progress Tests
Grade N Met Target in Spring 2011
N %
2nd* N/A N/A N/A
3rd 11 7 63.6%
4th 10 4 40.0%
5th 13 11 84.6%
6th 10 5 50.0%
7th 5 Cannot report due to N size
8th 9 Cannot report due to N size
Total 58 36 62.1%
*Second graders were not tested as first graders in the spring of 2010.
16 Spring 2010 test scores were provided in the summer of 2010.

28
https://sharepoint.nccdcrc.org/Projects/Project Documents/USA/Wisconsin/508WI_Milw/2010-11/DLH/Hines 2010-11 Yr 9 FINAL.docx © 2011 by NCCD, All Rights Reserved
Results for 51 students who did not reach target goals in the spring of 2010 indicate that
24 (47.1%) were able to meet target scores in the spring of 2011, exceeding the school’s goal of
10%.
Table 8
Darrell Lynn Hines Academy
Language Arts Scores for 2nd Through 8th Graders Who Did Not Meet Target in Spring 2010 Based on Measures of Academic Progress Tests
Grade N Met Target in Spring 2011
N %
2nd* N/A N/A N/A
3rd 10 4 40.0%
4th 5 Cannot report due to N size
5th 16 8 50.0%
6th 3 Cannot report due to N size
7th 4 Cannot report due to N size
8th 13 8 61.5%
Total 51 24 47.1%
*Second graders were not tested as first graders in the spring of 2010.

29
https://sharepoint.nccdcrc.org/Projects/Project Documents/USA/Wisconsin/508WI_Milw/2010-11/DLH/Hines 2010-11 Yr 9 FINAL.docx © 2011 by NCCD, All Rights Reserved
Results for the 55 students not tested in the spring of 2010 (i.e., who were in first grade in
the spring of 2010 or were new to the school this year) indicate that at the time of the spring
2011 test administration, 39 (70.9%) met target scores, exceeding the school’s goal of 50%. See
Table 9.
Table 9
Darrell Lynn Hines Academy
Target Language Arts Scores for New* 2nd Through 8th Graders Based on Measures of Academic Progress Tests
Grade N Met Target in Spring 2011
N %
2nd 27 23 85.2%
3rd 4 Cannot report due to N size
4th 6 Cannot report due to N size
5th 1 Cannot report due to N size
6th 6 Cannot report due to N size
7th 5 Cannot report due to N size
8th 6 Cannot report due to N size
Total 55 39 70.9%
*Students not tested in the spring of 2010.
The language arts scores for students in second through eighth grades indicated that the
school exceeded its local measure goal in math for students who did not meet their RIT target
score the previous year, who were new to the school, or were not tested the prior year. However,
the school did not meet its local measure goal for students who had met their RIT target score the
year before.
4. Writing Progress
To assess writing skills at the local level, the school set a goal that by May 31, 2011,
students would be able to produce a grade-appropriate piece of writing. The grade-level written
assignment was assessed using the Six Plus 1 Traits of Writing rubric. The Six Traits of Writing
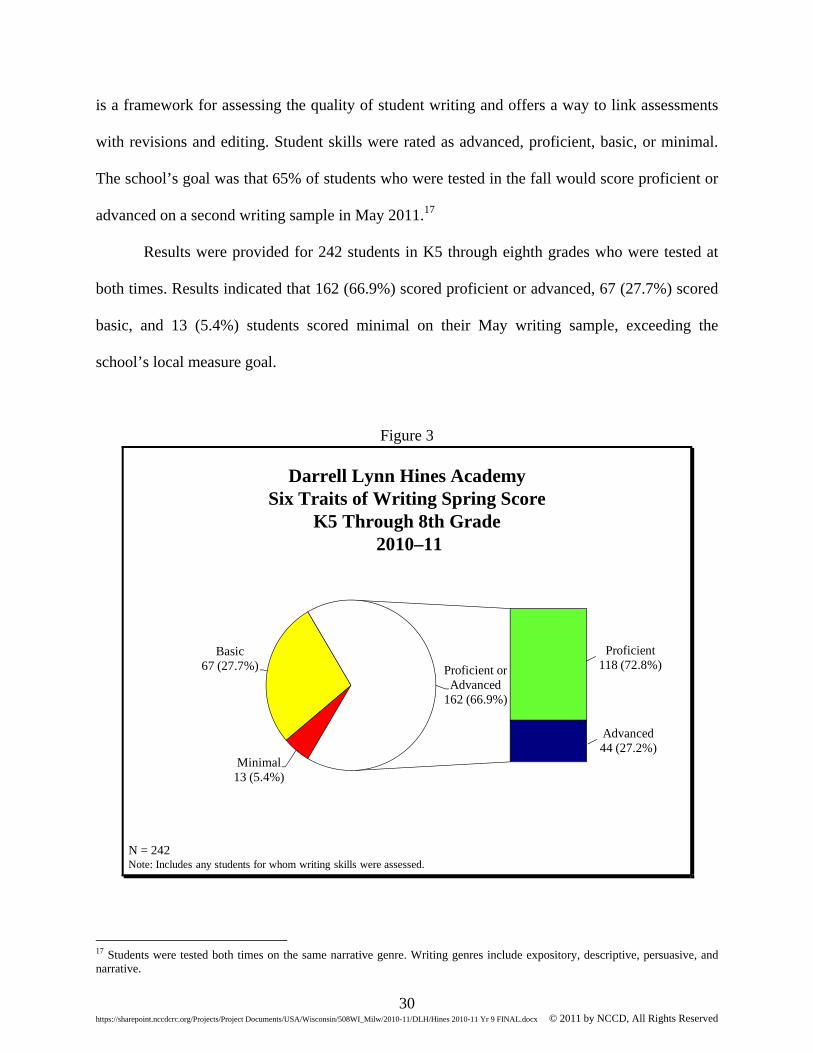
30
https://sharepoint.nccdcrc.org/Projects/Project Documents/USA/Wisconsin/508WI_Milw/2010-11/DLH/Hines 2010-11 Yr 9 FINAL.docx © 2011 by NCCD, All Rights Reserved
is a framework for assessing the quality of student writing and offers a way to link assessments
with revisions and editing. Student skills were rated as advanced, proficient, basic, or minimal.
The school’s goal was that 65% of students who were tested in the fall would score proficient or
advanced on a second writing sample in May 2011.17
Results were provided for 242 students in K5 through eighth grades who were tested at
both times. Results indicated that 162 (66.9%) scored proficient or advanced, 67 (27.7%) scored
basic, and 13 (5.4%) students scored minimal on their May writing sample, exceeding the
school’s local measure goal.
Figure 3
Darrell Lynn Hines AcademySix Traits of Writing Spring Score
K5 Through 8th Grade2010–11
N = 242Note: Includes any students for whom writing skills were assessed.
Minimal 13 (5.4%)
Basic 67 (27.7%)
Proficient 118 (72.8%)
Advanced 44 (27.2%)
Proficient or Advanced
162 (66.9%)
17 Students were tested both times on the same narrative genre. Writing genres include expository, descriptive, persuasive, and narrative.

31
https://sharepoint.nccdcrc.org/Projects/Project Documents/USA/Wisconsin/508WI_Milw/2010-11/DLH/Hines 2010-11 Yr 9 FINAL.docx © 2011 by NCCD, All Rights Reserved
Table 10 illustrates the Six Traits of Writing proficiency levels for each grade. There
were 118 (48.8%) students with proficient and 44 (18.2%) with advanced writing skills.
Table 10
Darrell Lynn Hines Academy
Six Traits of Writing Assessment Proficiency Levels Results by Grade 2010–11
Grade
Results
Minimal Basic Proficient Advanced Total
N % N % N % N % N %
K5 3 12.0% 2 8.0% 16 64.0% 4 16.0% 25 100.0%
1st 0 0.0% 0 0.0% 18 69.2% 8 30.8% 26 100.0%
2nd 0 0.0% 6 21.4% 16 57.1% 6 21.4% 28 100.0%
3rd 0 0.0% 15 53.6% 9 32.1% 4 14.3% 28 100.0%
4th 2 9.1% 8 36.4% 11 50.0% 1 4.5% 22 100.0%
5th 1 3.3% 10 33.3% 15 50.0% 4 13.3% 30 100.0%
6th 3 10.7% 11 39.3% 12 42.9% 2 7.1% 28 100.0%
7th 4 17.4% 6 26.1% 9 39.1% 4 17.4% 23 100.0%
8th 0 0.0% 9 28.1% 12 37.5% 11 34.4% 32 100.0%
Total 13 5.4% 67 27.7% 118 48.8% 44 18.2% 242 100.0%
5. IEP Progress for Special Education Students The school also set a goal that students who had active IEPs would demonstrate progress
towards meeting their IEP goals at the time of their annual review or re-evaluation. During the
year, there were 25 students with active IEPs that were reviewed/re-evaluated and who continued
in special education services. Students had between one and six goals. This year, 24 (96.0%) of
25 special education students were able to demonstrate progress (including achieving) on at least
one goal. On average, students exhibited progress in 81.3% of IEP goals. The school has met its
goal related to special education students.

32
https://sharepoint.nccdcrc.org/Projects/Project Documents/USA/Wisconsin/508WI_Milw/2010-11/DLH/Hines 2010-11 Yr 9 FINAL.docx © 2011 by NCCD, All Rights Reserved
E. External Standardized Measures of Educational Performance
The CSRC requires that the school administer certain standardized tests to students in
city-chartered schools. The school is required to administer the SDRT to all first, second, and
third graders, while third through eighth graders take the WKCE. The WKCE is aligned with
Wisconsin model academic standards and meets federal No Child Left Behind requirements to
test students’ reading and math skills. The SDRT was administered in April 2011 and the WKCE
in October 2010. The following section describes results of these standardized tests for all
children who took the tests. This includes student who have been enrolled in the school for at
least a full academic year (FAY) as well as students who were new to the school.

33
https://sharepoint.nccdcrc.org/Projects/Project Documents/USA/Wisconsin/508WI_Milw/2010-11/DLH/Hines 2010-11 Yr 9 FINAL.docx © 2011 by NCCD, All Rights Reserved
1. SDRT for K4
Although not required to do so by the CSRC, the school administered the SDRT to K4
students. Results provide a measure of student skills at the end of four-year-old kindergarten.
This year, the test was given to 26 K4 students. Results indicate that students were reading, on
average, at the K.2 to K.9 level, depending on the area tested. See Figure 4 and Table 11.
Figure 4
Darrell Lynn Hines AcademyStanford Diagnostic Reading Test
Average* Grade-level Equivalent for K42010–11
N = 26*Results are rounded to the nearest one tenth. Pre-K scores were converted to -0.1.
K.7
K.9
K.3
K.2
K.4
K.7
0.0
0.1
0.2
0.3
0.4
0.5
0.6
0.7
0.8
0.9
1.0
Words Stories Sounds Letters Pictures SDRT Total

34
https://sharepoint.nccdcrc.org/Projects/Project Documents/USA/Wisconsin/508WI_Milw/2010-11/DLH/Hines 2010-11 Yr 9 FINAL.docx © 2011 by NCCD, All Rights Reserved
Table 11
Darrell Lynn Hines Academy Stanford Diagnostic Reading Test
GLE Range for K4 2010–11 (N = 26)
Area Tested Lowest Grade Level
Scored Highest Grade Level
Scored Median
Words PK 1.4 K.6
Stories K.0 1.9 K.9
Sounds PK 1.0 K.0
Letters PK 1.4 K.0
Pictures PK 1.9 K.0
SDRT Total K.0 1.5 K.6
Note: Pre-K scores were converted to -0.1.

35
https://sharepoint.nccdcrc.org/Projects/Project Documents/USA/Wisconsin/508WI_Milw/2010-11/DLH/Hines 2010-11 Yr 9 FINAL.docx © 2011 by NCCD, All Rights Reserved
2. SDRT for K5
Although not required to do so by the CSRC, DLH administered the SDRT to K5
students. Results provide a measure of student skills at the end of kindergarten. This year, the
test was given to 26 K5 students. Results indicate that students were reading, on average, at the
K.0 to 1.2 level, depending on the area tested. See Figure 5 and Table 12.
Figure 5
Darrell Lynn Hines AcademyStanford Diagnostic Reading Test
Average* Grade-level Equivalent for K52010–11
N = 26*Results are rounded to the nearest one tenth. Pre-K scores were converted to -0.1.
K.9
1.2
K.0
K.7
K.3
K.8
0.0
0.2
0.4
0.6
0.8
1.0
1.2
1.4
Words Stories Sounds Letters Pictures SDRT Total

36
https://sharepoint.nccdcrc.org/Projects/Project Documents/USA/Wisconsin/508WI_Milw/2010-11/DLH/Hines 2010-11 Yr 9 FINAL.docx © 2011 by NCCD, All Rights Reserved
Table 12
Darrell Lynn Hines Academy
Stanford Diagnostic Reading Test GLE Range for K5
2010–11 (N = 26)
Area Tested Lowest Grade Level
Scored Highest Grade Level
Scored Median
Words K.2 1.6 K.9
Stories K.6 1.6 1.2
Sounds PK 1.0 PK
Letters PK 5.1 K.4
Pictures PK 2.8 K.0
SDRT Total K.4 1.6 K.8
Note: Pre-K scores were converted to -0.1.
37
https://sharepoint.nccdcrc.org/Projects/Project Documents/USA/Wisconsin/508WI_Milw/2010-11/DLH/Hines 2010-11 Yr 9 FINAL.docx © 2011 by NCCD, All Rights Reserved
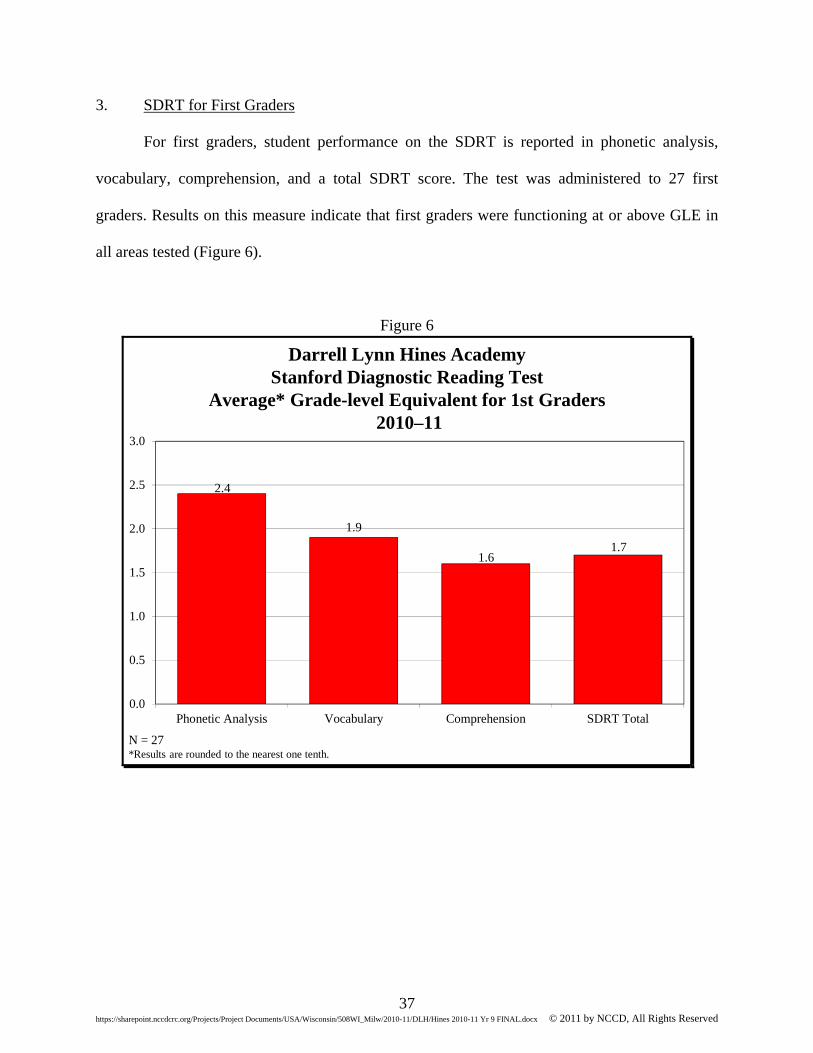
3. SDRT for First Graders
For first graders, student performance on the SDRT is reported in phonetic analysis,
vocabulary, comprehension, and a total SDRT score. The test was administered to 27 first
graders. Results on this measure indicate that first graders were functioning at or above GLE in
all areas tested (Figure 6).
Figure 6
Darrell Lynn Hines AcademyStanford Diagnostic Reading Test
Average* Grade-level Equivalent for 1st Graders2010–11
N = 27*Results are rounded to the nearest one tenth.
2.4
1.9
1.61.7
0.0
0.5
1.0
1.5
2.0
2.5
3.0
Phonetic Analysis Vocabulary Comprehension SDRT Total
38
https://sharepoint.nccdcrc.org/Projects/Project Documents/USA/Wisconsin/508WI_Milw/2010-11/DLH/Hines 2010-11 Yr 9 FINAL.docx © 2011 by NCCD, All Rights Reserved
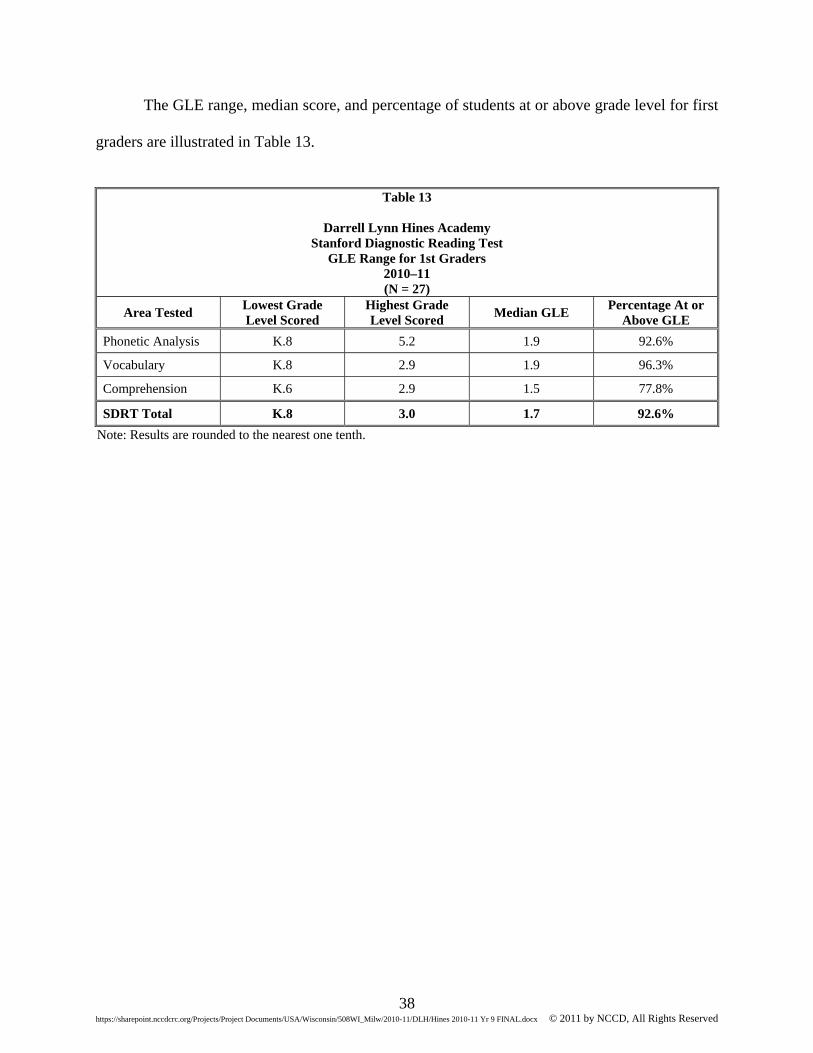
The GLE range, median score, and percentage of students at or above grade level for first
graders are illustrated in Table 13.
Table 13
Darrell Lynn Hines Academy
Stanford Diagnostic Reading Test GLE Range for 1st Graders
2010–11 (N = 27)
Area Tested Lowest Grade Level Scored
Highest Grade Level Scored
Median GLE Percentage At or
Above GLE
Phonetic Analysis K.8 5.2 1.9 92.6%
Vocabulary K.8 2.9 1.9 96.3%
Comprehension K.6 2.9 1.5 77.8%
SDRT Total K.8 3.0 1.7 92.6%
Note: Results are rounded to the nearest one tenth.

39
https://sharepoint.nccdcrc.org/Projects/Project Documents/USA/Wisconsin/508WI_Milw/2010-11/DLH/Hines 2010-11 Yr 9 FINAL.docx © 2011 by NCCD, All Rights Reserved
4. SDRT for Second Graders
Results for second graders are presented in Figure 7 and Table 14. As illustrated, second
graders were, on average, reading at 3.1 to 4.4 GLE in the areas tested. Ranges indicate a wide
range of skills among students.
Figure 7
Darrell Lynn Hines AcademyStanford Diagnostic Reading Test
Average* Grade-level Equivalent for 2nd Graders2010–11
N = 29*Results are rounded to the nearest one tenth.
4.4
3.1
4.2
3.6
0.0
0.5
1.0
1.5
2.0
2.5
3.0
3.5
4.0
4.5
5.0
Phonetic Analysis Vocabulary Comprehension SDRT Total
Table 14
Darrell Lynn Hines Academy Stanford Diagnostic Reading Test
GLE Range for 2nd Graders 2010–11 (N = 29)
Area Tested Lowest Grade Level Scored
Highest Grade Level Scored
Median GLE Percentage At or
Above GLE
Phonetic Analysis 1.1 10.9 3.4 82.8%
Vocabulary K.9 5.6 3.1 86.2%
Comprehension 1.7 8.9 3.6 93.1%
SDRT Total 1.4 7.3 3.4 89.7%

40
https://sharepoint.nccdcrc.org/Projects/Project Documents/USA/Wisconsin/508WI_Milw/2010-11/DLH/Hines 2010-11 Yr 9 FINAL.docx © 2011 by NCCD, All Rights Reserved
5. Standardized Tests for Third Graders a. SDRT for Third Graders
Results for third graders indicate that students were, on average, reading at third- to
fourth-grade levels in the areas tested. Over half (55.2%) are reading at or above grade level (see
Figure 8 and Table 15).
Figure 8
Darrell Lynn Hines AcademyStanford Diagnostic Reading Test
Average* Grade-level Equivalent for 3rd Graders2010–11
N = 29*Results are rounded to the nearest one tenth.
3.5
3.0
4.0
3.3
0.0
0.5
1.0
1.5
2.0
2.5
3.0
3.5
4.0
4.5
Phonetic Analysis Vocabulary Comprehension SDRT Total

41
https://sharepoint.nccdcrc.org/Projects/Project Documents/USA/Wisconsin/508WI_Milw/2010-11/DLH/Hines 2010-11 Yr 9 FINAL.docx © 2011 by NCCD, All Rights Reserved
Table 15
Darrell Lynn Hines Academy Stanford Diagnostic Reading Test
GLE Range for 3rd Graders 2010–11 (N = 29)
Area Tested Lowest Grade Level Scored
Highest Grade Level Scored
Median GLE Percentage At or
Above GLE
Phonetic Analysis 1.2 7.7 3.2 51.7%
Vocabulary 1.5 4.5 2.8 48.3%
Comprehension 1.5 10.1 3.4 65.5%
SDRT Total 1.6 7.1 3.1 55.2%
b. WKCE for Third Graders
Every year, the CSRC requires its charter schools to administer the WKCE to third
graders. Based on how they scored on these assessments, students’ skills were rated in one of
four proficiency categories: advanced, proficient, basic, and minimal performance.18 Results
were used to assess third-grade reading and math skills, as well as to provide scores against
which to measure progress over multiple years.
18 Advanced: Demonstrates in-depth understanding of academic knowledge and skills; proficient: demonstrates competency in the academic knowledge and skills; basic: demonstrates some academic knowledge and skills; and minimal: demonstrates very limited academic knowledge and skills.
42
https://sharepoint.nccdcrc.org/Projects/Project Documents/USA/Wisconsin/508WI_Milw/2010-11/DLH/Hines 2010-11 Yr 9 FINAL.docx © 2011 by NCCD, All Rights Reserved
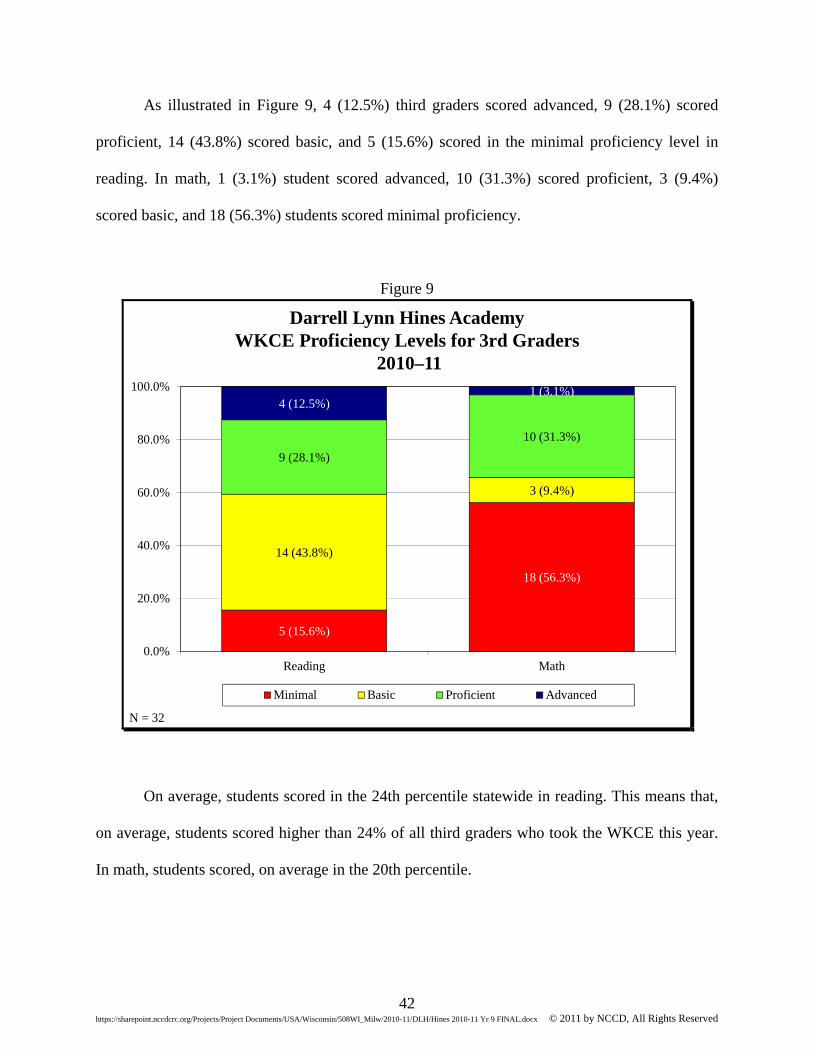
As illustrated in Figure 9, 4 (12.5%) third graders scored advanced, 9 (28.1%) scored
proficient, 14 (43.8%) scored basic, and 5 (15.6%) scored in the minimal proficiency level in
reading. In math, 1 (3.1%) student scored advanced, 10 (31.3%) scored proficient, 3 (9.4%)
scored basic, and 18 (56.3%) students scored minimal proficiency.
Figure 9
Darrell Lynn Hines AcademyWKCE Proficiency Levels for 3rd Graders
2010–11
N = 32
5 (15.6%)
18 (56.3%)
14 (43.8%)
3 (9.4%)
9 (28.1%)
10 (31.3%)
4 (12.5%)1 (3.1%)
0.0%
20.0%
40.0%
60.0%
80.0%
100.0%
Reading Math
Minimal Basic Proficient Advanced
On average, students scored in the 24th percentile statewide in reading. This means that,
on average, students scored higher than 24% of all third graders who took the WKCE this year.
In math, students scored, on average in the 20th percentile.

43
https://sharepoint.nccdcrc.org/Projects/Project Documents/USA/Wisconsin/508WI_Milw/2010-11/DLH/Hines 2010-11 Yr 9 FINAL.docx © 2011 by NCCD, All Rights Reserved
6. WKCE for Fourth Graders
The WKCE for fourth graders consists of subtests in reading, math, language arts,
science, and social studies. The CSRC requires that schools report student achievement on the
WKCE in reading, language arts, and math for fourth graders.
The WKCE was administered to 28 fourth-grade students. This year, in reading,
3 (10.7%) fourth graders scored advanced, 11 (39.3%) scored proficient, 10 (35.7%) scored
basic, and 4 (14.3%) fourth graders scored in the minimal category. In math, no students
exhibited advanced skills, 11 (39.3%) students scored proficient, 8 (28.6%) scored basic, and
9 (32.1%) students exhibited minimal skills. In language arts, 1 (3.6%) student was advanced,
10 (35.7%) were proficient, 8 (28.6%) had basic skills, and 9 (32.1%) students exhibited minimal
skills (Figure 10).
Figure 10
Darrell Lynn Hines AcademyWKCE Proficiency Levels for 4th Graders
2010–11
N = 28
4 (14.3%)
9 (32.1%) 9 (32.1%)
10 (35.7%)
8 (28.6%) 8 (28.6%)
11 (39.3%)
11 (39.3%) 10 (35.7%)
3 (10.7%)1 (3.6%)
0.0%
20.0%
40.0%
60.0%
80.0%
100.0%
Reading Math Language Arts
Minimal Basic Proficient Advanced
44
https://sharepoint.nccdcrc.org/Projects/Project Documents/USA/Wisconsin/508WI_Milw/2010-11/DLH/Hines 2010-11 Yr 9 FINAL.docx © 2011 by NCCD, All Rights Reserved
On average, students scored in the 23rd percentile statewide in reading and the 19th in
math.
The final score from the WKCE is a writing score. The extended writing sample is
evaluated using two holistic rubrics. A 6-point composition rubric evaluates students’ ability to
control purpose, organization, content development, sentence fluency, and word choice. A
3-point conventions rubric evaluates students’ ability to manage punctuation, grammar,
capitalization, and spelling. Rubric scores are combined to produce a single score ranging from
0.0 to a maximum possible score of 9.0. DLH Academy’s fourth graders’ writing scores ranged
from 2.0 to 6.0. The average score was 4.8. The median score was 5.0, meaning half of students
scored at or below 5.0 and half scored 5.0 to 6.0.
7. WKCE for Fifth Graders
As required by the CSRC, fifth graders were administered the WKCE reading and math
subtests. Results indicated that 3 (10.3%) fifth graders scored advanced, 10 (34.5%) were
proficient, 10 (34.5%) scored basic, and 6 (20.7%) scored in the minimal reading level. In math,
3 (10.3%) fifth graders scored advanced, 7 (24.1%) scored proficient, 2 (6.9%) scored basic, and
17 (58.6%) scored in the minimal proficiency level (Figure 11). Note that one fifth grader was
given the WAA-SwD, an alternative to the WKCE. This student’s scores were not included in
the analysis.

45
https://sharepoint.nccdcrc.org/Projects/Project Documents/USA/Wisconsin/508WI_Milw/2010-11/DLH/Hines 2010-11 Yr 9 FINAL.docx © 2011 by NCCD, All Rights Reserved
Figure 11
Darrell Lynn Hines AcademyWKCE Proficiency Levels for 5th Graders
2010–11
6 (20.7%)
17 (58.6%)
10 (34.5%)
2 (6.9%)
10 (34.5%)7 (24.1%)
3 (10.3%) 3 (10.3%)
0.0%
20.0%
40.0%
60.0%
80.0%
100.0%
Reading Math
Minimal Basic Proficient Advanced
N = 29
On average, students scored in the 21st percentile statewide in reading and the 20th
percentile in math.
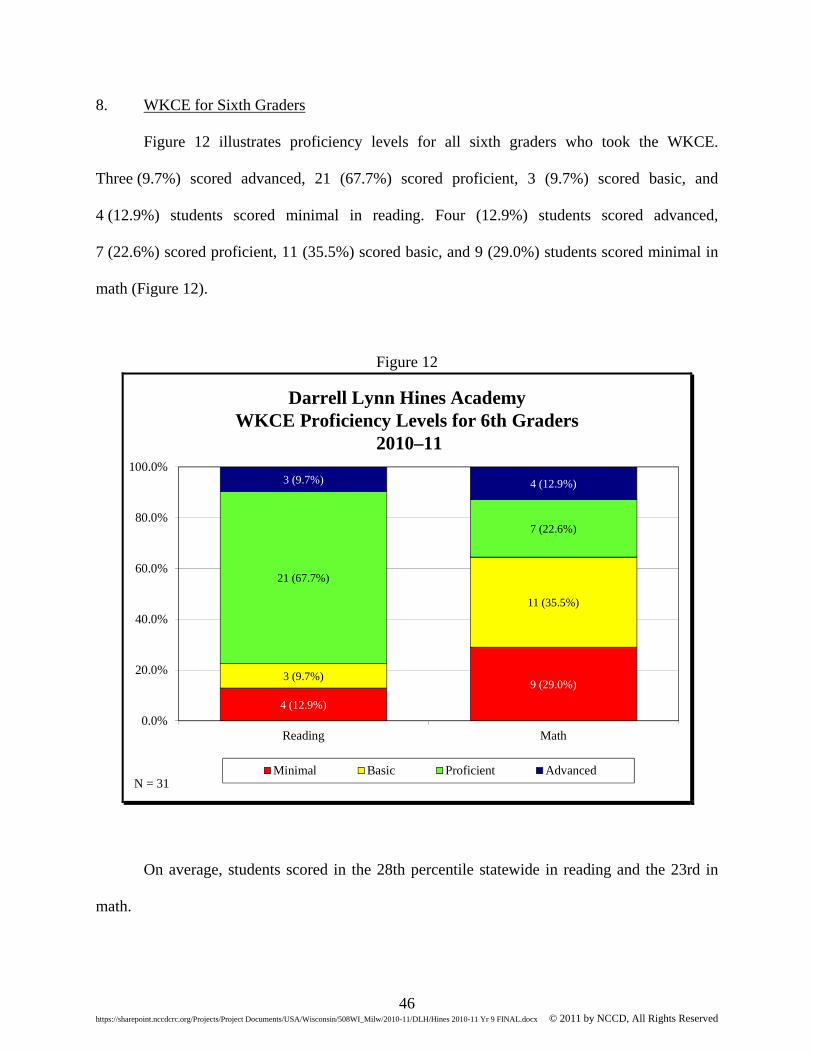
46
https://sharepoint.nccdcrc.org/Projects/Project Documents/USA/Wisconsin/508WI_Milw/2010-11/DLH/Hines 2010-11 Yr 9 FINAL.docx © 2011 by NCCD, All Rights Reserved
8. WKCE for Sixth Graders
Figure 12 illustrates proficiency levels for all sixth graders who took the WKCE.
Three (9.7%) scored advanced, 21 (67.7%) scored proficient, 3 (9.7%) scored basic, and
4 (12.9%) students scored minimal in reading. Four (12.9%) students scored advanced,
7 (22.6%) scored proficient, 11 (35.5%) scored basic, and 9 (29.0%) students scored minimal in
math (Figure 12).
Figure 12
Darrell Lynn Hines AcademyWKCE Proficiency Levels for 6th Graders
2010–11
N = 31
4 (12.9%)
9 (29.0%)3 (9.7%)
11 (35.5%)
21 (67.7%)
7 (22.6%)
3 (9.7%) 4 (12.9%)
0.0%
20.0%
40.0%
60.0%
80.0%
100.0%
Reading Math
Minimal Basic Proficient Advanced
On average, students scored in the 28th percentile statewide in reading and the 23rd in
math.

47
https://sharepoint.nccdcrc.org/Projects/Project Documents/USA/Wisconsin/508WI_Milw/2010-11/DLH/Hines 2010-11 Yr 9 FINAL.docx © 2011 by NCCD, All Rights Reserved
9. WKCE for Seventh Graders
Figure 13 illustrates the proficiency levels from the seventh-grade WKCE, administered
to 22 students. In reading, 3 (13.6%) seventh graders scored advanced, 13 (59.1%) scored
proficient, 5 (22.7%) scored basic, and 1 (4.5%) scored at the minimal level. In math, 1 (4.5%)
seventh grader scored advanced, 8 (36.4%) scored proficient, 7 (31.8%) scored basic, and
6 (27.3%) seventh graders were at the minimal level.
Figure 13
Darrell Lynn Hines AcademyWKCE Proficiency Levels for 7th Graders
2010–11
1 (4.5%)
6 (27.3%)5 (22.7%)
7 (31.8%)
13 (59.1%)
8 (36.4%)
3 (13.6%)1 (4.5%)
0.0%
20.0%
40.0%
60.0%
80.0%
100.0%
Reading Math
Minimal Basic Proficient Advanced
N = 22
On average, students scored in the 24th percentile statewide in reading and the 22nd
percentile in math.
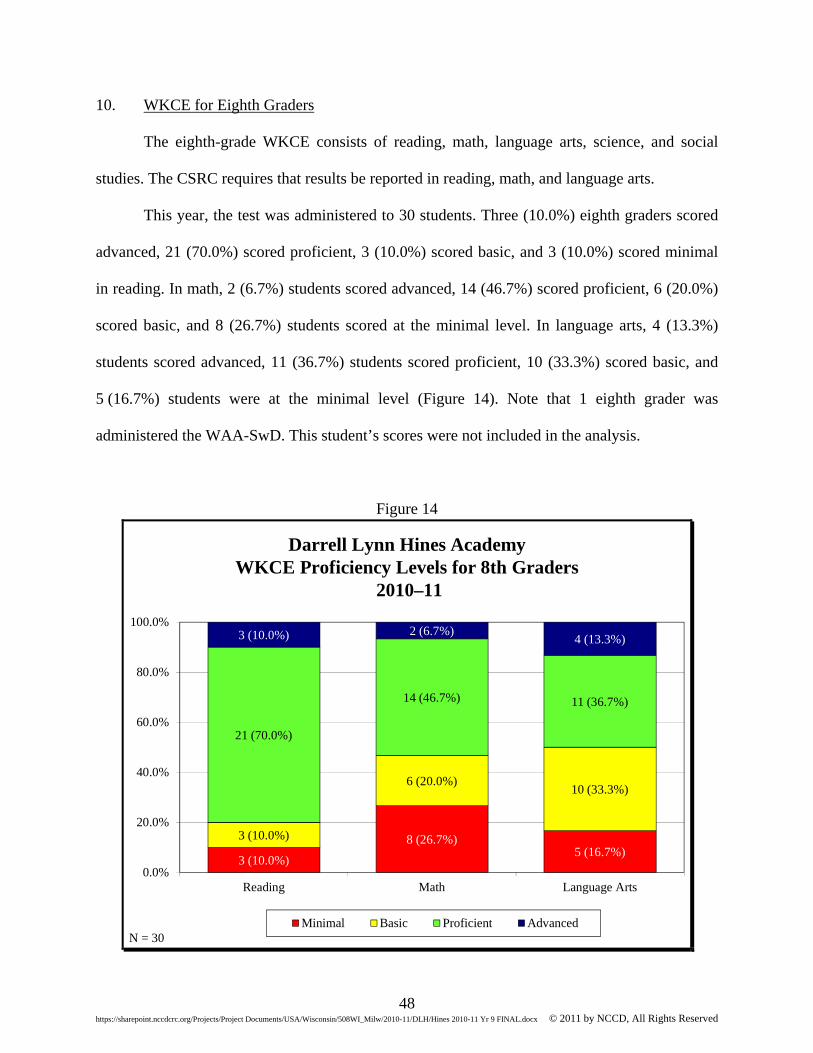
48
https://sharepoint.nccdcrc.org/Projects/Project Documents/USA/Wisconsin/508WI_Milw/2010-11/DLH/Hines 2010-11 Yr 9 FINAL.docx © 2011 by NCCD, All Rights Reserved
10. WKCE for Eighth Graders The eighth-grade WKCE consists of reading, math, language arts, science, and social
studies. The CSRC requires that results be reported in reading, math, and language arts.
This year, the test was administered to 30 students. Three (10.0%) eighth graders scored
advanced, 21 (70.0%) scored proficient, 3 (10.0%) scored basic, and 3 (10.0%) scored minimal
in reading. In math, 2 (6.7%) students scored advanced, 14 (46.7%) scored proficient, 6 (20.0%)
scored basic, and 8 (26.7%) students scored at the minimal level. In language arts, 4 (13.3%)
students scored advanced, 11 (36.7%) students scored proficient, 10 (33.3%) scored basic, and
5 (16.7%) students were at the minimal level (Figure 14). Note that 1 eighth grader was
administered the WAA-SwD. This student’s scores were not included in the analysis.
Figure 14
Darrell Lynn Hines AcademyWKCE Proficiency Levels for 8th Graders
2010–11
3 (10.0%)
8 (26.7%)5 (16.7%)
3 (10.0%)
6 (20.0%)10 (33.3%)
21 (70.0%)
14 (46.7%) 11 (36.7%)
3 (10.0%) 2 (6.7%)4 (13.3%)
0.0%
20.0%
40.0%
60.0%
80.0%
100.0%
Reading Math Language Arts
Minimal Basic Proficient AdvancedN = 30

49
https://sharepoint.nccdcrc.org/Projects/Project Documents/USA/Wisconsin/508WI_Milw/2010-11/DLH/Hines 2010-11 Yr 9 FINAL.docx © 2011 by NCCD, All Rights Reserved
On average, eighth graders scored in the 33rd percentile statewide in reading, and the
26th percentile in math.
Eighth graders are also assessed on an extended writing sample. The extended writing
sample is assigned up to 3 points for punctuation, grammar, capitalization, and spelling, and up
to 6 points for purpose, organization, content development, sentence fluency, and word choice.
The maximum possible score is 9 points. This year, eighth graders’ scores ranged from 4.0 to
7.0. The average score was 5.3, and the median score was 5.0.
F. Multiple-year Student Progress Year-to-year progress is measured by comparing scores in reading, language, and math
on standardized tests from one year to the next. The tests used to examine progress are the SDRT
(reading only) and the WKCE.
The CSRC requires that multiple-year student progress in first through third grades be
reported for all students tested in consecutive years. Progress for fourth through eighth graders is
to be reported for students enrolled for a FAY, i.e., since September 18, 2009. In addition to
reporting GLE growth for second and third graders, the CSRC requires that progress for students
who met proficiency expectations during the prior year be reported separately from those who
did not.
1. First Through Third Graders
First- through third-grade reading progress is measured using the SDRT. Results from
this test are stated in GLE and do not translate into proficiency levels. The CSRC expects
students to advance, on average, at least 1.0 GLE per year from spring-to-spring testing. Results
in this section include all students who were administered the SDRT in consecutive years.
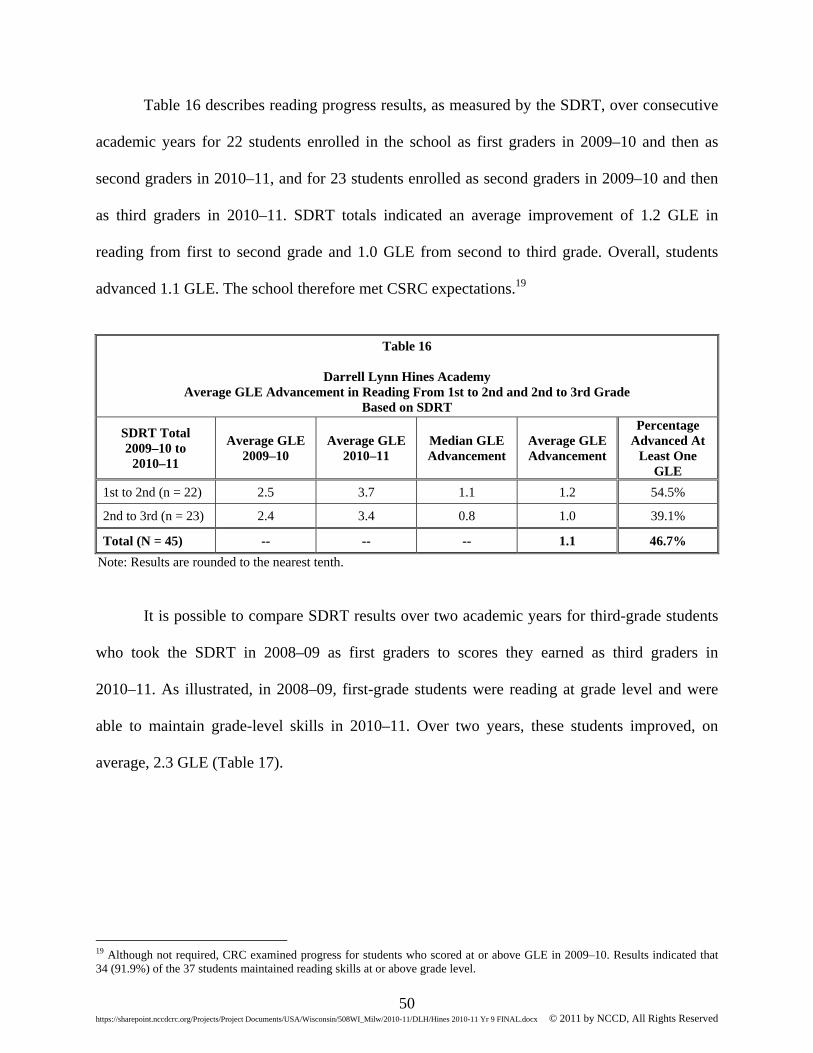
50
https://sharepoint.nccdcrc.org/Projects/Project Documents/USA/Wisconsin/508WI_Milw/2010-11/DLH/Hines 2010-11 Yr 9 FINAL.docx © 2011 by NCCD, All Rights Reserved
Table 16 describes reading progress results, as measured by the SDRT, over consecutive
academic years for 22 students enrolled in the school as first graders in 2009–10 and then as
second graders in 2010–11, and for 23 students enrolled as second graders in 2009–10 and then
as third graders in 2010–11. SDRT totals indicated an average improvement of 1.2 GLE in
reading from first to second grade and 1.0 GLE from second to third grade. Overall, students
advanced 1.1 GLE. The school therefore met CSRC expectations.19
Table 16
Darrell Lynn Hines Academy
Average GLE Advancement in Reading From 1st to 2nd and 2nd to 3rd Grade Based on SDRT
SDRT Total 2009–10 to
2010–11
Average GLE 2009–10
Average GLE 2010–11
Median GLE Advancement
Average GLE Advancement
Percentage Advanced At
Least One GLE
1st to 2nd (n = 22) 2.5 3.7 1.1 1.2 54.5%
2nd to 3rd (n = 23) 2.4 3.4 0.8 1.0 39.1%
Total (N = 45) -- -- -- 1.1 46.7%
Note: Results are rounded to the nearest tenth.
It is possible to compare SDRT results over two academic years for third-grade students
who took the SDRT in 2008–09 as first graders to scores they earned as third graders in
2010–11. As illustrated, in 2008–09, first-grade students were reading at grade level and were
able to maintain grade-level skills in 2010–11. Over two years, these students improved, on
average, 2.3 GLE (Table 17).
19 Although not required, CRC examined progress for students who scored at or above GLE in 2009–10. Results indicated that 34 (91.9%) of the 37 students maintained reading skills at or above grade level.
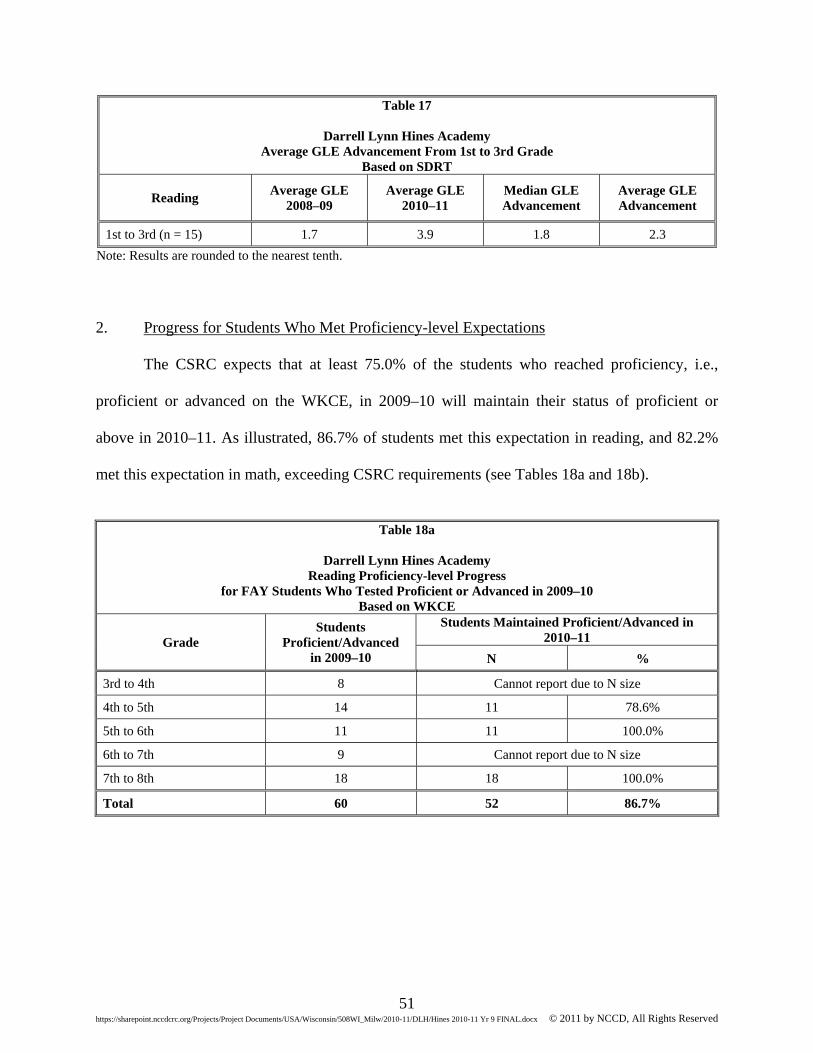
51
https://sharepoint.nccdcrc.org/Projects/Project Documents/USA/Wisconsin/508WI_Milw/2010-11/DLH/Hines 2010-11 Yr 9 FINAL.docx © 2011 by NCCD, All Rights Reserved
Table 17
Darrell Lynn Hines Academy Average GLE Advancement From 1st to 3rd Grade
Based on SDRT
Reading Average GLE
2008–09 Average GLE
2010–11 Median GLE Advancement
Average GLE Advancement
1st to 3rd (n = 15) 1.7 3.9 1.8 2.3
Note: Results are rounded to the nearest tenth. 2. Progress for Students Who Met Proficiency-level Expectations The CSRC expects that at least 75.0% of the students who reached proficiency, i.e.,
proficient or advanced on the WKCE, in 2009–10 will maintain their status of proficient or
above in 2010–11. As illustrated, 86.7% of students met this expectation in reading, and 82.2%
met this expectation in math, exceeding CSRC requirements (see Tables 18a and 18b).
Table 18a
Darrell Lynn Hines Academy
Reading Proficiency-level Progress for FAY Students Who Tested Proficient or Advanced in 2009–10
Based on WKCE
Grade Students
Proficient/Advanced in 2009–10
Students Maintained Proficient/Advanced in 2010–11
N %
3rd to 4th 8 Cannot report due to N size
4th to 5th 14 11 78.6%
5th to 6th 11 11 100.0%
6th to 7th 9 Cannot report due to N size
7th to 8th 18 18 100.0%
Total 60 52 86.7%

52
https://sharepoint.nccdcrc.org/Projects/Project Documents/USA/Wisconsin/508WI_Milw/2010-11/DLH/Hines 2010-11 Yr 9 FINAL.docx © 2011 by NCCD, All Rights Reserved
Table 18b
Darrell Lynn Hines Academy Math Proficiency-level Progress
for FAY Students Proficient or Advanced in 2009–10 Based on WKCE
Grade Students
Proficient/Advanced in 2009–10
Students Maintained Proficient/Advanced in 2010–11
N %
3rd to 4th 6 Cannot report due to N size
4th to 5th 12 10 83.3%
5th to 6th 9 Cannot report due to N size
6th to 7th 6 Cannot report due to N size
7th to 8th 12 8 66.7%
Total 45 37 82.2%
3. Progress for Students Who Did Not Meet Proficiency-level Expectations
The CSRC requires that student progress be examined separately for students who did not
meet proficiency-level expectations in 2009–10. Progress for first- through third-grade students
is assessed using the SDRT. The SDRT results do not translate into proficiency levels.
Therefore, CRC selected students who scored below GLE in 2009–10. It is expected that these
students would improve more than one GLE. This year, there were no second graders and eight
third graders who tested below grade-level expectations in the prior year as first and second
graders. Due to the small size of the cohorts, results could not be included in this report.
Table 19
Darrell Lynn Hines Academy
Reading Progress for Students Below GLE on 2009–10 SDRT
Grade Average GLE
2009–10 Average GLE
2010–11 Average GLE Advancement
Percentage Advanced At Least
One GLE
1st to 2nd (n=0) Cannot report due to N size
Cannot report due to N size
Cannot report due to N size
Cannot report due to N size
2nd to 3rd (n=8) Cannot report due to N size
Cannot report due to N size
Cannot report due to N size
Cannot report due to N size
Total (N = 8) -- -- -- --
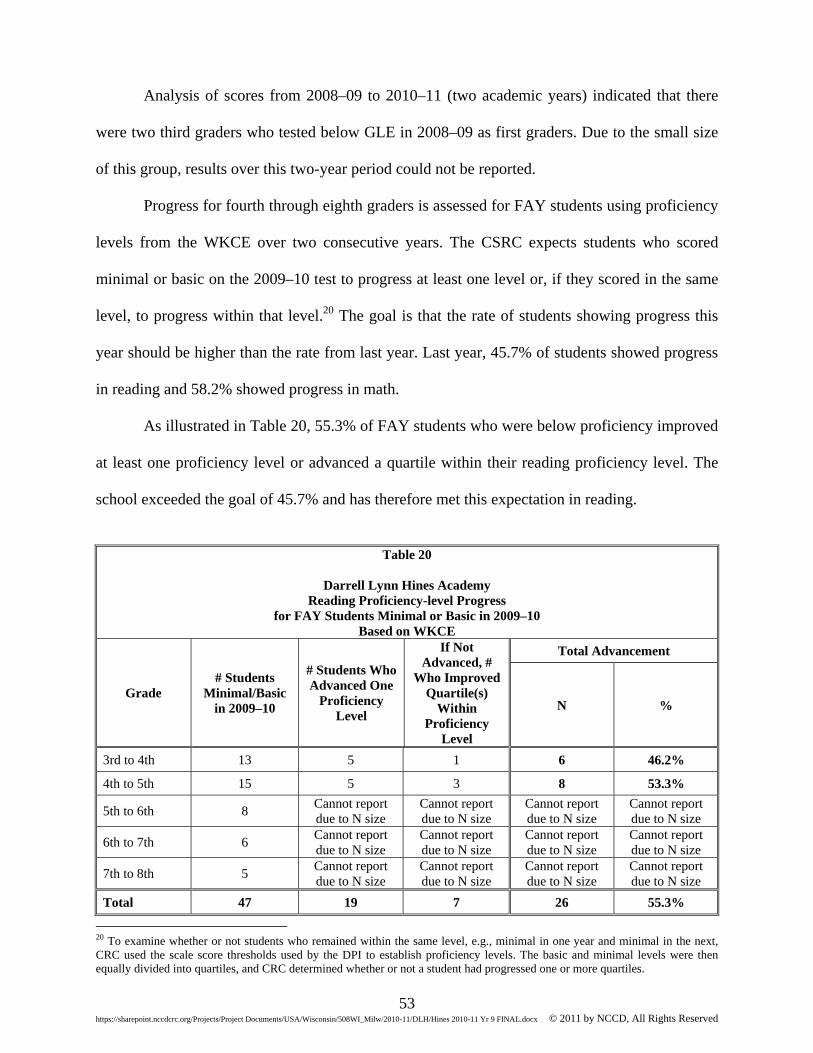
53
https://sharepoint.nccdcrc.org/Projects/Project Documents/USA/Wisconsin/508WI_Milw/2010-11/DLH/Hines 2010-11 Yr 9 FINAL.docx © 2011 by NCCD, All Rights Reserved
Analysis of scores from 2008–09 to 2010–11 (two academic years) indicated that there
were two third graders who tested below GLE in 2008–09 as first graders. Due to the small size
of this group, results over this two-year period could not be reported.
Progress for fourth through eighth graders is assessed for FAY students using proficiency
levels from the WKCE over two consecutive years. The CSRC expects students who scored
minimal or basic on the 2009–10 test to progress at least one level or, if they scored in the same
level, to progress within that level.20 The goal is that the rate of students showing progress this
year should be higher than the rate from last year. Last year, 45.7% of students showed progress
in reading and 58.2% showed progress in math.
As illustrated in Table 20, 55.3% of FAY students who were below proficiency improved
at least one proficiency level or advanced a quartile within their reading proficiency level. The
school exceeded the goal of 45.7% and has therefore met this expectation in reading.
Table 20
Darrell Lynn Hines Academy
Reading Proficiency-level Progress for FAY Students Minimal or Basic in 2009–10
Based on WKCE
Grade # Students
Minimal/Basic in 2009–10
# Students Who Advanced One
Proficiency Level
If Not Advanced, #
Who Improved Quartile(s)
Within Proficiency
Level
Total Advancement
N %
3rd to 4th 13 5 1 6 46.2%
4th to 5th 15 5 3 8 53.3%
5th to 6th 8 Cannot report due to N size
Cannot report due to N size
Cannot report due to N size
Cannot report due to N size
6th to 7th 6 Cannot report due to N size
Cannot report due to N size
Cannot report due to N size
Cannot report due to N size
7th to 8th 5 Cannot report due to N size
Cannot report due to N size
Cannot report due to N size
Cannot report due to N size
Total 47 19 7 26 55.3%
20 To examine whether or not students who remained within the same level, e.g., minimal in one year and minimal in the next, CRC used the scale score thresholds used by the DPI to establish proficiency levels. The basic and minimal levels were then equally divided into quartiles, and CRC determined whether or not a student had progressed one or more quartiles.
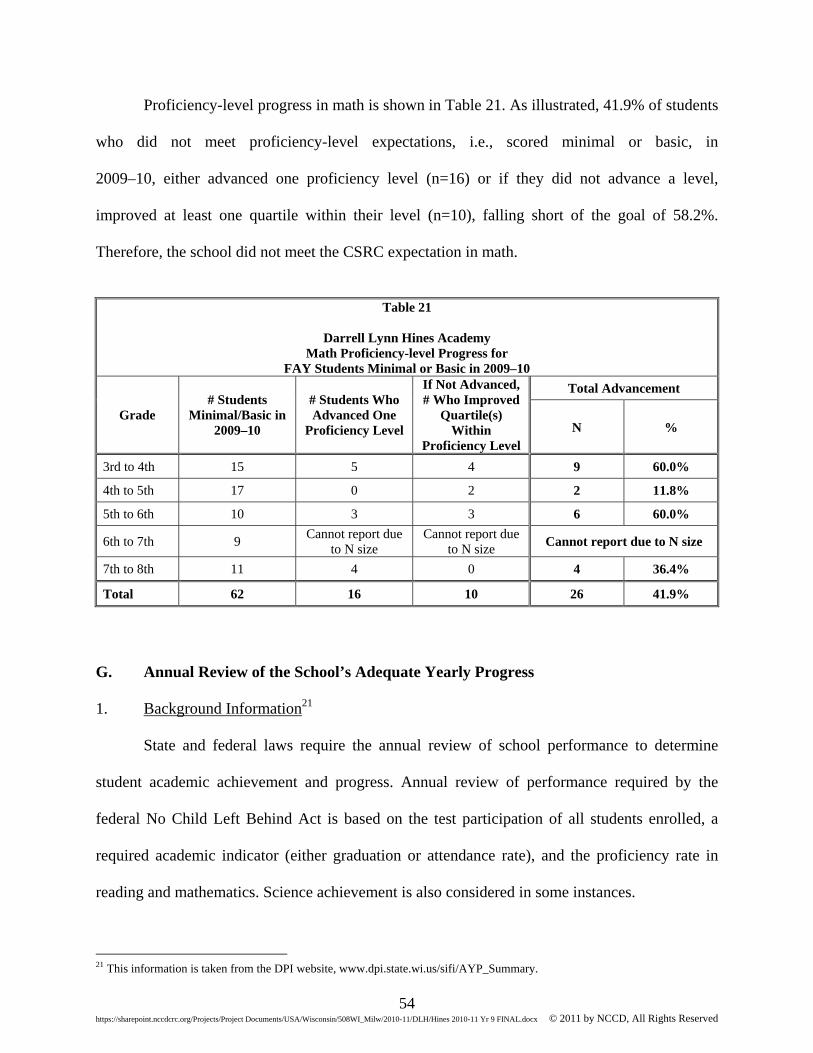
54
https://sharepoint.nccdcrc.org/Projects/Project Documents/USA/Wisconsin/508WI_Milw/2010-11/DLH/Hines 2010-11 Yr 9 FINAL.docx © 2011 by NCCD, All Rights Reserved
Proficiency-level progress in math is shown in Table 21. As illustrated, 41.9% of students
who did not meet proficiency-level expectations, i.e., scored minimal or basic, in
2009–10, either advanced one proficiency level (n=16) or if they did not advance a level,
improved at least one quartile within their level (n=10), falling short of the goal of 58.2%.
Therefore, the school did not meet the CSRC expectation in math.
Table 21
Darrell Lynn Hines Academy
Math Proficiency-level Progress for FAY Students Minimal or Basic in 2009–10
Grade # Students
Minimal/Basic in 2009–10
# Students Who Advanced One
Proficiency Level
If Not Advanced, # Who Improved
Quartile(s) Within
Proficiency Level
Total Advancement
N %
3rd to 4th 15 5 4 9 60.0%
4th to 5th 17 0 2 2 11.8%
5th to 6th 10 3 3 6 60.0%
6th to 7th 9 Cannot report due
to N size Cannot report due
to N size Cannot report due to N size
7th to 8th 11 4 0 4 36.4%
Total 62 16 10 26 41.9%
G. Annual Review of the School’s Adequate Yearly Progress
1. Background Information21
State and federal laws require the annual review of school performance to determine
student academic achievement and progress. Annual review of performance required by the
federal No Child Left Behind Act is based on the test participation of all students enrolled, a
required academic indicator (either graduation or attendance rate), and the proficiency rate in
reading and mathematics. Science achievement is also considered in some instances.
21 This information is taken from the DPI website, www.dpi.state.wi.us/sifi/AYP_Summary.
55
https://sharepoint.nccdcrc.org/Projects/Project Documents/USA/Wisconsin/508WI_Milw/2010-11/DLH/Hines 2010-11 Yr 9 FINAL.docx © 2011 by NCCD, All Rights Reserved
In Wisconsin, DPI releases an annual review of school performance for each chartered
school with information about whether that school has met the criteria for each of the four
required adequate yearly progress (AYP) objectives. If a school fails to make AYP for two
consecutive years in the same objective, the school is designated as “identified for
improvement.” Once designated as identified for improvement, the school must meet the annual
review criteria for two consecutive years in the same objective to be removed from this
designation.
The possible school status designations are as follows:
“Satisfactory,” which means the school is not in improvement status. “School Identified for Improvement” (SIFI), which means the school has not met
AYP for two consecutive years in the same objective. SIFI Levels 1–5, which means the school missed at least one of the AYP
objectives and is subject to the state requirements and additional Title I sanctions assigned to that level.
SIFI Levels 1–4 Improved, which means the school met AYP in the year tested
but remains subject to sanctions due to the prior year. AYP must be met for two consecutive years in that objective to be removed from “improvement” status and returned to “satisfactory” status.
Title I status, which identifies if Title I funds are directed to the school. If so, the
schools are subject to federal sanctions. 2. Adequate Yearly Progress Review Summary According to DLH Academy’s Adequate Yearly Progress Review for 2010–11, published
on the DPI’s website, DLH Academy met three of the four AYP objectives: test participation,
attendance, and reading. The school did not meet the AYP objective for mathematics.22
22 For a copy of DLH Academy’s Annual Review of School Performance, see www.dpi.state.wi.us/sifi/AYP_Summary.
56
https://sharepoint.nccdcrc.org/Projects/Project Documents/USA/Wisconsin/508WI_Milw/2010-11/DLH/Hines 2010-11 Yr 9 FINAL.docx © 2011 by NCCD, All Rights Reserved
Because the school did not miss the AYP objective for math for two consecutive years,
i.e., it met AYP for the 2009–10, the school’s status for all four objectives remains
“satisfactory.” An overall status of satisfactory does not require improvement under state or
federal accountability requirements.

57
https://sharepoint.nccdcrc.org/Projects/Project Documents/USA/Wisconsin/508WI_Milw/2010-11/DLH/Hines 2010-11 Yr 9 FINAL.docx © 2011 by NCCD, All Rights Reserved
V. SUMMARY AND RECOMMENDATIONS
A. Contract Compliance
This report covers the ninth year that DLH Academy has operated as a City of
Milwaukee–chartered school. For the 2010–11 academic year, DLH Academy met all but one of
its education-related contract provisions. That provision was that more than 58.2% of students
below proficient in math on the WKCE show advancement (actual: 41.9%).
See Appendix A for an outline of specific contract provision compliance information,
page references, and a description of whether or not each provision was met.
B. Education-related Findings
Average student attendance was 93.5%, exceeding the school’s goal of 90.0%. Parents of 97.5% of the students enrolled at the time of the two scheduled
family-teacher conferences attended, falling just short of DLH Academy’s goal of 100%.
C. Local Measure Results
Students’ reading skills were tested using MAP. Results show the following:
Twenty-seven (52.9%) of 51 students who met target scores last year again met target scores this year.
Thirty-eight (65.5%) of 58 students who did not meet target scores last year met target scores this year.
Forty (72.7%) of 55 new or newly tested students met target scores.
In math, 41 (85.4%) of 48 kindergarten and first-grade students either met or exceeded
math expectations by scoring at least 85% mastery of Everyday Math concepts.
58
https://sharepoint.nccdcrc.org/Projects/Project Documents/USA/Wisconsin/508WI_Milw/2010-11/DLH/Hines 2010-11 Yr 9 FINAL.docx © 2011 by NCCD, All Rights Reserved
Second- through eighth-grade student math skills were tested using MAP. Results show
the following:
Thirty (46.9%) of 64 students who met targets last year met targets again this
year.
Twenty-five (55.6%) of 45 students who did not meet target scores last year met target scores this year.
Forty (72.7%) of 55 students new or newly tested met target scores.
In writing, 162 (66.9%) of 242 K5 through eighth-grade students scored proficient or
advanced on grade-level writing skills, based on the Six Traits of Writing rubric.
Of the 25 students with active IEPs, 24 (96.0%) demonstrated progress on at least one
goal.
D. Standardized Test Results
The April 2011 SDRT results indicate the following: Kindergarteners were, on average, reading at K.8 GLE overall; First graders were, on average, reading at 1.7 GLE overall; Second graders were reading at 3.6 GLE; and Third graders were reading at 3.3 GLE overall.
The WKCE reading and math results are summarized in Figures 15 and 16.

59
https://sharepoint.nccdcrc.org/Projects/Project Documents/USA/Wisconsin/508WI_Milw/2010-11/DLH/Hines 2010-11 Yr 9 FINAL.docx © 2011 by NCCD, All Rights Reserved
Figure 15
Darrell Lynn Hines AcademyWKCE Reading
Proficient or Advanced2010–11
40.1%
50.0%44.8%
77.4%72.7%
80.0%
0.0%
20.0%
40.0%
60.0%
80.0%
100.0%
3rd 4th 5th 6th 7th 8th
N = 32 N = 28 N = 29 N = 31 N = 22 N = 30
Overall, 104 (60.5%) of 172 students exhibited proficient or advanced reading skills.
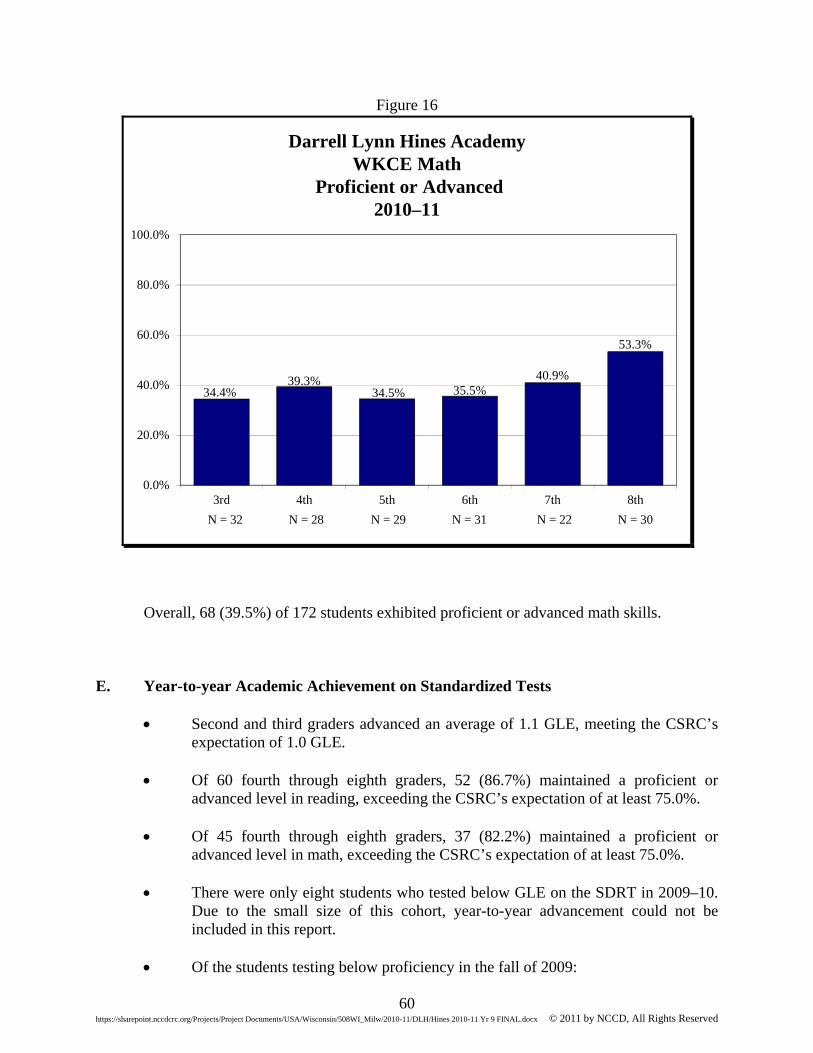
60
https://sharepoint.nccdcrc.org/Projects/Project Documents/USA/Wisconsin/508WI_Milw/2010-11/DLH/Hines 2010-11 Yr 9 FINAL.docx © 2011 by NCCD, All Rights Reserved
Figure 16
Darrell Lynn Hines AcademyWKCE Math
Proficient or Advanced2010–11
34.4%39.3%
34.5% 35.5%40.9%
53.3%
0.0%
20.0%
40.0%
60.0%
80.0%
100.0%
3rd 4th 5th 6th 7th 8th
N = 32 N = 28 N = 29 N = 31 N = 22 N = 30
Overall, 68 (39.5%) of 172 students exhibited proficient or advanced math skills.
E. Year-to-year Academic Achievement on Standardized Tests
Second and third graders advanced an average of 1.1 GLE, meeting the CSRC’s expectation of 1.0 GLE.
Of 60 fourth through eighth graders, 52 (86.7%) maintained a proficient or
advanced level in reading, exceeding the CSRC’s expectation of at least 75.0%. Of 45 fourth through eighth graders, 37 (82.2%) maintained a proficient or
advanced level in math, exceeding the CSRC’s expectation of at least 75.0%. There were only eight students who tested below GLE on the SDRT in 2009–10.
Due to the small size of this cohort, year-to-year advancement could not be included in this report.
Of the students testing below proficiency in the fall of 2009:

61
https://sharepoint.nccdcrc.org/Projects/Project Documents/USA/Wisconsin/508WI_Milw/2010-11/DLH/Hines 2010-11 Yr 9 FINAL.docx © 2011 by NCCD, All Rights Reserved
» Of 47 fourth through eighth graders, 55.3% either advanced one
proficiency level or one quartile within the previous year’s proficiency level in reading. This exceeds the goal of 45.7%, which reflects the percentage of students who advanced last year.
» Of 62 fourth through eighth graders, 41.9% either advanced one proficiency level or one quartile within the previous year’s proficiency level in math. This fell short of the goal of 58.2%, which reflects the percentage of students who advanced last year.
F. Recommendations
After reviewing the information in this report and considering the information gathered
during the administration interview in May 2011, CRC and the school jointly recommend that
the focus of activities for the 2011–12 school year should be as follows:
Continue to focus on data-driven decision making in order to increase the use of
student-level data to inform teacher strategies and approaches for students at all levels.
Improve the team approach to developing growth strategies.

https://sharepoint.nccdcrc.org/Projects/Project Documents/USA/Wisconsin/508WI_Milw/2010-11/DLH/Hines 2010-11 Yr 9 FINAL.docx © 2011 by NCCD, All Rights Reserved
Appendix A
Contract Compliance Chart
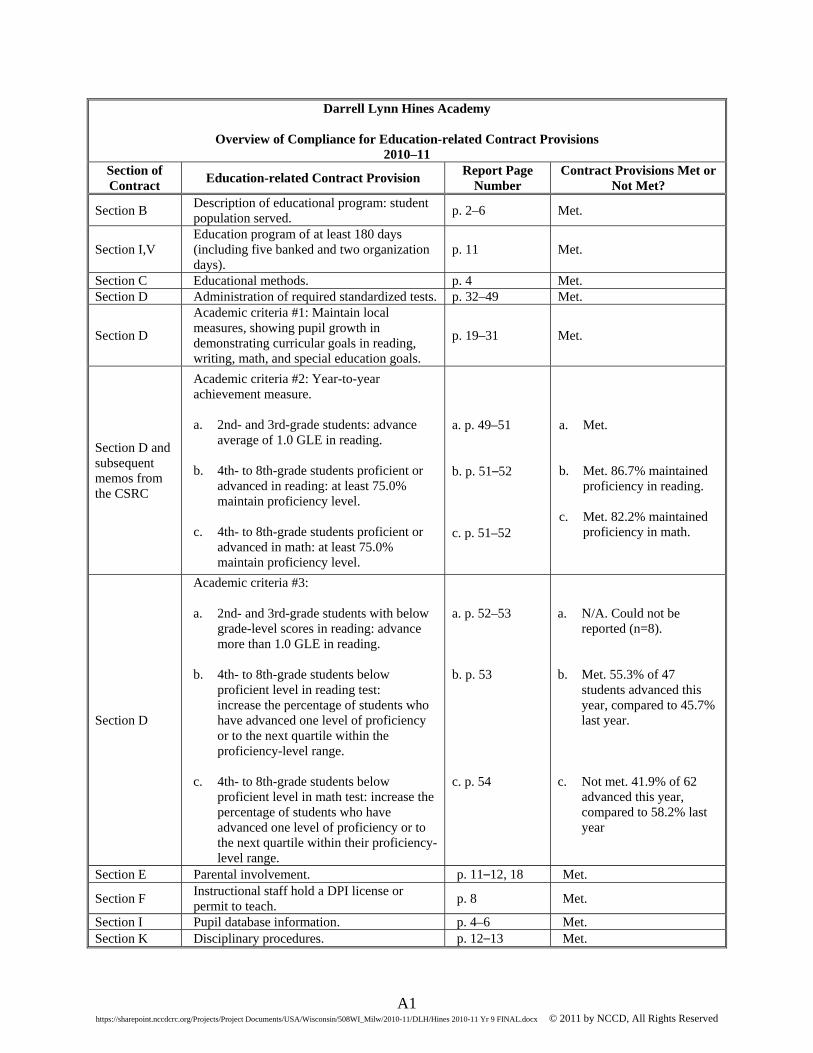
A1
https://sharepoint.nccdcrc.org/Projects/Project Documents/USA/Wisconsin/508WI_Milw/2010-11/DLH/Hines 2010-11 Yr 9 FINAL.docx © 2011 by NCCD, All Rights Reserved
Darrell Lynn Hines Academy
Overview of Compliance for Education-related Contract Provisions 2010–11
Section of Contract
Education-related Contract Provision Report Page
Number Contract Provisions Met or
Not Met?
Section B Description of educational program: student population served.
p. 2–6 Met.
Section I,V Education program of at least 180 days (including five banked and two organization days).
p. 11 Met.
Section C Educational methods. p. 4 Met. Section D Administration of required standardized tests. p. 32–49 Met.
Section D
Academic criteria #1: Maintain local measures, showing pupil growth in demonstrating curricular goals in reading, writing, math, and special education goals.
p. 19–31 Met.
Section D and subsequent memos from the CSRC
Academic criteria #2: Year-to-year achievement measure. a. 2nd- and 3rd-grade students: advance
average of 1.0 GLE in reading. b. 4th- to 8th-grade students proficient or
advanced in reading: at least 75.0% maintain proficiency level.
c. 4th- to 8th-grade students proficient or
advanced in math: at least 75.0% maintain proficiency level.
a. p. 49–51 b. p. 51–52 c. p. 51–52
a. Met. b. Met. 86.7% maintained
proficiency in reading.
c. Met. 82.2% maintained proficiency in math.
Section D
Academic criteria #3: a. 2nd- and 3rd-grade students with below
grade-level scores in reading: advance more than 1.0 GLE in reading.
b. 4th- to 8th-grade students below
proficient level in reading test: increase the percentage of students who
have advanced one level of proficiency or to the next quartile within the proficiency-level range.
c. 4th- to 8th-grade students below
proficient level in math test: increase the percentage of students who have advanced one level of proficiency or to the next quartile within their proficiency-level range.
a. p. 52–53 b. p. 53 c. p. 54
a. N/A. Could not be
reported (n=8). b. Met. 55.3% of 47
students advanced this year, compared to 45.7% last year.
c. Not met. 41.9% of 62
advanced this year, compared to 58.2% last year
Section E Parental involvement. p. 11–12, 18 Met.
Section F Instructional staff hold a DPI license or permit to teach.
p. 8 Met.
Section I Pupil database information. p. 4–6 Met. Section K Disciplinary procedures. p. 12–13 Met.
https://sharepoint.nccdcrc.org/Projects/Project Documents/USA/Wisconsin/508WI_Milw/2010-11/DLH/Hines 2010-11 Yr 9 FINAL.docx © 2011 by NCCD, All Rights Reserved
Appendix B
Student Learning Memorandum

B1
https://sharepoint.nccdcrc.org/Projects/Project Documents/USA/Wisconsin/508WI_Milw/2010-11/DLH/Hines 2010-11 Yr 9 FINAL.docx© 2011 by NCCD, All Rights Reserved
Learning Memo for Darrell Lynn Hines College Preparatory Academy Of Excellence To: City of Milwaukee Charter School Review Committee and Children’s Research
Center From: Darrell Lynn Hines College Preparatory Academy of Excellence Re: Student Learning Memorandum for the 2010-11 School Year Date: October 22, 2010 The following procedures and outcomes will be used for the 2010-11 school year to monitor the educationally-related activities described in the Darrell Lynn Hines College Preparatory Academy of Excellence’s charter school contract with the City of Milwaukee. The data will be provided to the Children’s Research Center (CRC), the monitoring agent contracted by the City of Milwaukee Charter School Review Committee. Data will be reported in a spreadsheet or database that includes each student’s Wisconsin student identification number (WSN) number(s). All spreadsheets and/or the database will include all students enrolled at any time during the school year. Attendance The school will maintain an average daily attendance rate of 90.0%. Attendance will be reported as present, excused absence, or unexcused absence. A student is considered present for the day if he/she is in attendance for half a day or more. Enrollment The school will record the enrollment date for every student. Upon admission, individual student information, including WSN, name, grade, gender, race/ethnicity, eligibility for free/reduced lunch and special education status will be added to the school database. Termination The date and reason for every student leaving the school will be recorded in the school database. Parent Participation On average, parents will participate in at least two of the scheduled parent-teacher conferences. The date of the conference and whether a parent/guardian or other interested person participated in the conference will be recorded by the school for each student. Special Education Needs Students The school will maintain updated records on all special education students, including disability type, date of the individualized education program (IEP) team eligibility assessment, eligibility assessment outcome, IEP completion date, parent participation in IEP completion, IEP review date, and review results, and parent participation in review. Students who have active IEPs will demonstrate progress toward meeting their IEP goals at the time of their annual review or reevaluation. Progress will be demonstrated by reporting the number of sub-goals identified for each student and the number of subgoals that have been met for each student. Please note that ongoing student progress on IEP goals is monitored and reported throughout the academic year through the special education progress reports that are attached to the regular report cards.

B2
https://sharepoint.nccdcrc.org/Projects/Project Documents/USA/Wisconsin/508WI_Milw/2010-11/DLH/Hines 2010-11 Yr 9 FINAL.docx© 2011 by NCCD, All Rights Reserved
Academic Achievement: Local Measures Mathematics for K5 and First Grade At least 85% of K5 students will demonstrate a 4 or 3 on at least 75% of the grade level concepts
taught throughout the year. There are 57 concepts expected for K5 students.23
At least 85% of 1st grade students will demonstrate a 4 or a 3 on at least 75% of the grade level concepts taught throughout the year. There are 61 concepts expected for 1st grade students. The scoring rubric is 4, 3, 2 1. 4 = Advanced: Student demonstrates an advanced understanding of the concept or skill and is consistently working above grade level expectations. Student repeatedly uses unique problem –solving tasks. Student communicates a sophisticated, well articulated mathematical understanding of the concept. 3 = Proficient: Student solves problems independently, consistently, and efficiently (any errors that the student may make are infrequent and minor). Student may have some difficulty communicating his/her mathematical understanding of the concept. 2= Student demonstrates a basic understanding of the concept or skill and is performing below grade level expectations. Correct answers are not consistent/efficient and/or reminders, suggestions, and learning aids may be necessary to complete the task. 1= Student demonstrates a minimal understanding of the concept or skill and is performing noticeably-below grade level expectations. Student may require intensive assistance from the teacher to further develop his/her understanding. Reading, Mathematics, and Language Arts for Second through Eighth Grade Students from second through eighth grades will demonstrate progress in reading, language arts, and mathematics on the Measures of Academic Progress (MAP) tests administered in the fall and again in the spring. Specifically:
For returning students:24
At least 75% of the students who met their target RIT score in reading, math and/or language arts in the spring of 2010 will again meet their target RIT score on the spring 2011 MAP test.
At least 10% of students who did not meet target RIT scores on the spring 2010 test will meet target RIT scores on the spring 2011 test.
23 Teachers document proficiency of each concept for each student on a school designed excel spreadsheet. 24 Students who completed all MAP assessments in 2009–10.

B3
https://sharepoint.nccdcrc.org/Projects/Project Documents/USA/Wisconsin/508WI_Milw/2010-11/DLH/Hines 2010-11 Yr 9 FINAL.docx© 2011 by NCCD, All Rights Reserved
Of the students who are not in the year to year cohort, i.e., those who were first graders last year, did not complete all MAP assessments in 2009–10, or are new to the school this year, at least 50% will meet target scores in reading, 50% will meet target scores in math, 50% will meet target scores in language arts on the spring 2011 MAP test. Writing for K5 through Eighth Grade Using the 6 Plus 1 Traits of Writing, students in grades K5 through eighth will complete a writing sample no later than October 30th. Of those students completing the writing sample in October, 65% will achieve an overall score of 3 or higher on a second writing sample taken between May 1st and May 31st. The prompt for both writing samples will be the same and will be based on grade level topics with the narrative genre.25 Academic Achievement: Standardized Measures The following standardized test measures will assess academic achievement in reading and/or mathematics. CSRC Expectations
On average, second- and third-grade students will demonstrate a minimum increase of one grade level on the Stanford Diagnostic Reading Test (SDRT) as measured by the year-to-year SDRT scores. Students who initially test below grade level on the SDRT will demonstrate more than one grade level gain.
At least 75.0% of the students who were proficient or advanced on the Wisconsin
Knowledge and Concepts Examination (WKCE) in 2009–10 will maintain their status of proficient or above.
More than 45.7% of fourth- through eighth-grade students who tested below
proficient (basic or minimal) in reading on the WKCE in 2009–10 will improve a level or move at least one quartile within their level.
Of the fourth- through eighth-grade students who tested below proficient (basic or
minimal) in mathematics on the WKCE in 2009–10, more than 58.2% will improve a level or move at least one quartile within their level.
Grades 1, 2, and 3 The SDRT will be administered between March 15 and April 15, 2010. The first-year testing will serve as baseline data. Progress will be assessed based on the results of the test in reading in the second and subsequent years. Grades 3 Through 8 The WKCE will be administered on an annual basis in the timeframe identified by the Wisconsin Department of Public Instruction. The WKCE reading subtest will provide each student with a proficiency level, scale score and State percentile in reading and math. Fourth and eighth graders
25 Writing genres include expository, descriptive, persuasive and narrative.
B4
https://sharepoint.nccdcrc.org/Projects/Project Documents/USA/Wisconsin/508WI_Milw/2010-11/DLH/Hines 2010-11 Yr 9 FINAL.docx© 2011 by NCCD, All Rights Reserved
will also be assessed for proficiency in science, social studies, and language arts. In addition, fourth and eighth grade writing skills will be assessed.

B5
https://sharepoint.nccdcrc.org/Projects/Project Documents/USA/Wisconsin/508WI_Milw/2010-11/DLH/Hines 2010-11 Yr 9 FINAL.docx© 2011 by NCCD, All Rights Reserved
Learning Memo Data Addendum Darrell Lynn Hines College Preparatory Academy Of Excellence
The following describes the data collection and submission process related to each of the outcomes in the learning memo for the academic year. Additionally, there are important principles applicable to all data collection that must be considered. 1. All students attending the school at any time during the academic year should be included
in all student data files. This includes students who enroll after the first day of school and students who withdraw before the end of the school year. Be sure to include each student’s unique Wisconsin student ID number and school-based ID number in each data file.
2. All data fields must be completed for each student enrolled at any time during the school
year. If a student is not enrolled when a measure is completed, record N/E to indicate “not enrolled.” If the measure did not apply to the student for another reason, enter N/A for that student to indicate “not applicable.” N/E may occur if a student enrolls after the beginning of the school year or withdraws prior to the end of the school year. N/A may apply if a student is absent when a measure is completed.
3. Record and submit a score/response for each student. Please do not submit aggregate data
(e.g., 14 students scored 75.0%, or the attendance rate was 92.0%).
Staff person(s) responsible for year-end data submission: Cathy Stampley

B6
https://sharepoint.nccdcrc.org/Projects/Project Documents/USA/Wisconsin/508WI_Milw/2010-11/DLH/Hines 2010-11 Yr 9 FINAL.docx © 2011 by NCCD, All Rights Reserved
Learning Memo Section/Outcome
Data Description Location of Data Person(s)
Responsible for Collecting Data
Enrollment, Termination, and Attendance
Create a column for each of the following. Include for all students enrolled at any time during the school year: WI student ID number (WSN) School student ID number
(school-based) Student name Grade level Race/ethnicity Gender (M/F) Eligibility for free/reduced
lunch Enrollment date Termination date, or N/A if
the student did not withdraw Reason for termination The number of days the
student was enrolled at the school this year
The number of days the student attended this year
The number of excused absences this year
The number of unexcused absences this year
Indicate if the student had and/or was assessed for special education needs during the school year (yes and eligible, yes and not eligible, or no)
Cathy Stampley

B7
https://sharepoint.nccdcrc.org/Projects/Project Documents/USA/Wisconsin/508WI_Milw/2010-11/DLH/Hines 2010-11 Yr 9 FINAL.docx © 2011 by NCCD, All Rights Reserved
Learning Memo Section/Outcome
Data Description Location of Data Person(s)
Responsible for Collecting Data
Parent Participation
Create a column for each of the following. Include for all students enrolled at any time during the school year: WSN School student ID number Student name Create one column labeled
conference 1. In this column, indicate with a Y or N whether a parent/guardian/adult attended the first conference. If the student was not enrolled at the time of this conference, enter N/E.
Create one column labeled conference 2. In this column, indicate with a Y or N whether a parent/guardian/adult attended the second conference. If the student was not enrolled at the time of this conference, enter N/E.
Excel spreadsheet designed by school
Cathy Stampley
Special Education Needs Students
For each student who had or was assessed for special education, i.e., with “yes and eligible” in the enrollment data file above, include the following: WSN School student ID number Student name The special education need,
e.g., ED, CD, LD, OHI, etc. Eligibility assessment date IEP completion date Parent participate in IEP
completion (Y/N) IEP review date IEP review results, e.g.,
continue in special education, no longer eligible for special education
Parent participation in IEP review (Y/N)
Number of goals, including sub-goals, on IEP
Number of goals, including sub-goals, met on IEP
Excel spreadsheet designed by school
Cathy Stampley
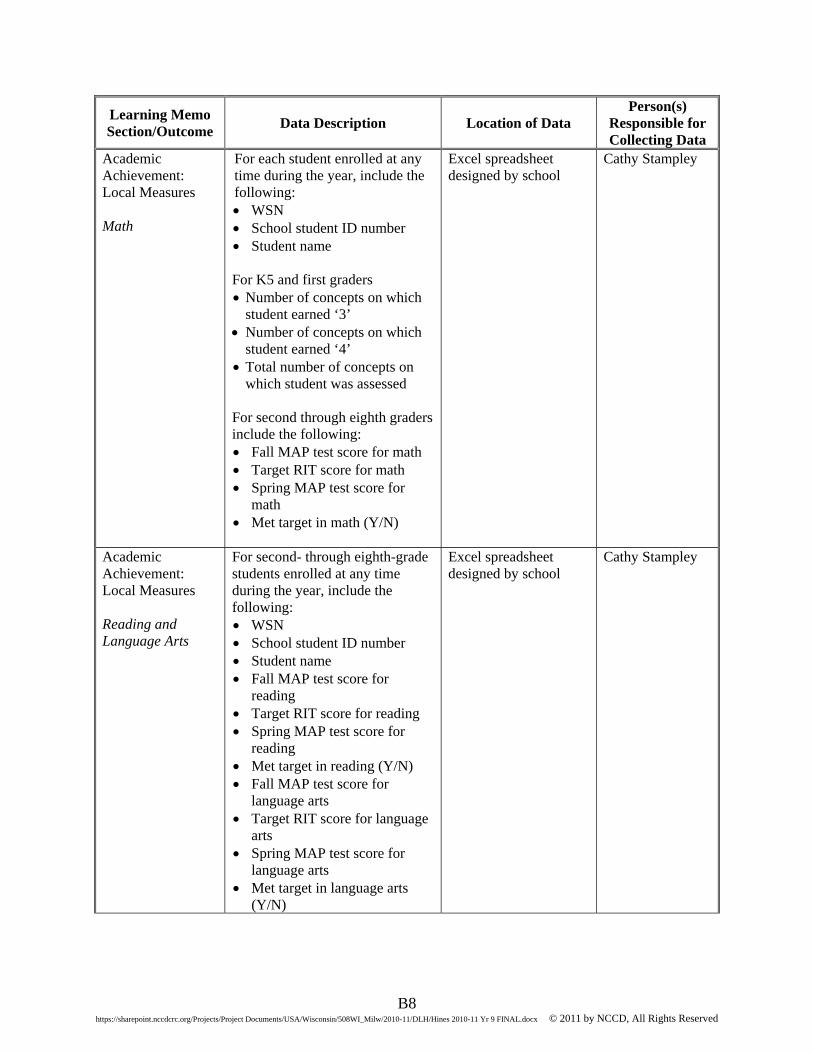
B8
https://sharepoint.nccdcrc.org/Projects/Project Documents/USA/Wisconsin/508WI_Milw/2010-11/DLH/Hines 2010-11 Yr 9 FINAL.docx © 2011 by NCCD, All Rights Reserved
Learning Memo Section/Outcome
Data Description Location of Data Person(s)
Responsible for Collecting Data
Academic Achievement: Local Measures Math
For each student enrolled at any time during the year, include the following: WSN School student ID number Student name For K5 and first graders Number of concepts on which
student earned ‘3’ Number of concepts on which
student earned ‘4’ Total number of concepts on
which student was assessed For second through eighth graders include the following: Fall MAP test score for math Target RIT score for math Spring MAP test score for
math Met target in math (Y/N)
Excel spreadsheet designed by school
Cathy Stampley
Academic Achievement: Local Measures Reading and Language Arts
For second- through eighth-grade students enrolled at any time during the year, include the following: WSN School student ID number Student name Fall MAP test score for
reading Target RIT score for reading Spring MAP test score for
reading Met target in reading (Y/N) Fall MAP test score for
language arts Target RIT score for language
arts Spring MAP test score for
language arts Met target in language arts
(Y/N)
Excel spreadsheet designed by school
Cathy Stampley

B9
https://sharepoint.nccdcrc.org/Projects/Project Documents/USA/Wisconsin/508WI_Milw/2010-11/DLH/Hines 2010-11 Yr 9 FINAL.docx © 2011 by NCCD, All Rights Reserved
Learning Memo Section/Outcome
Data Description Location of Data Person(s)
Responsible for Collecting Data
Academic Achievement: Local Measures Writing
For each student enrolled at any time during the year, include the following: WSN School student ID number Student name Fall writing score Spring writing score Spring writing level (minimal,
basic, proficient, advanced)
Excel spreadsheet designed by school
Cathy Stampley
Academic Achievement: Standardized Measures SDRT
Create a spreadsheet including all first- through third-grade students enrolled at any time during the school year. Include the following: WSN School student ID number Student name Grade Phonetics scale score Phonetics GLE Vocabulary scale score Vocabulary GLE Comprehension scale score Comprehension GLE Total scale score Total GLE
Please provide the test date(s) in an email or other document.
Excel spreadsheet designed by school
Cathy Stampley
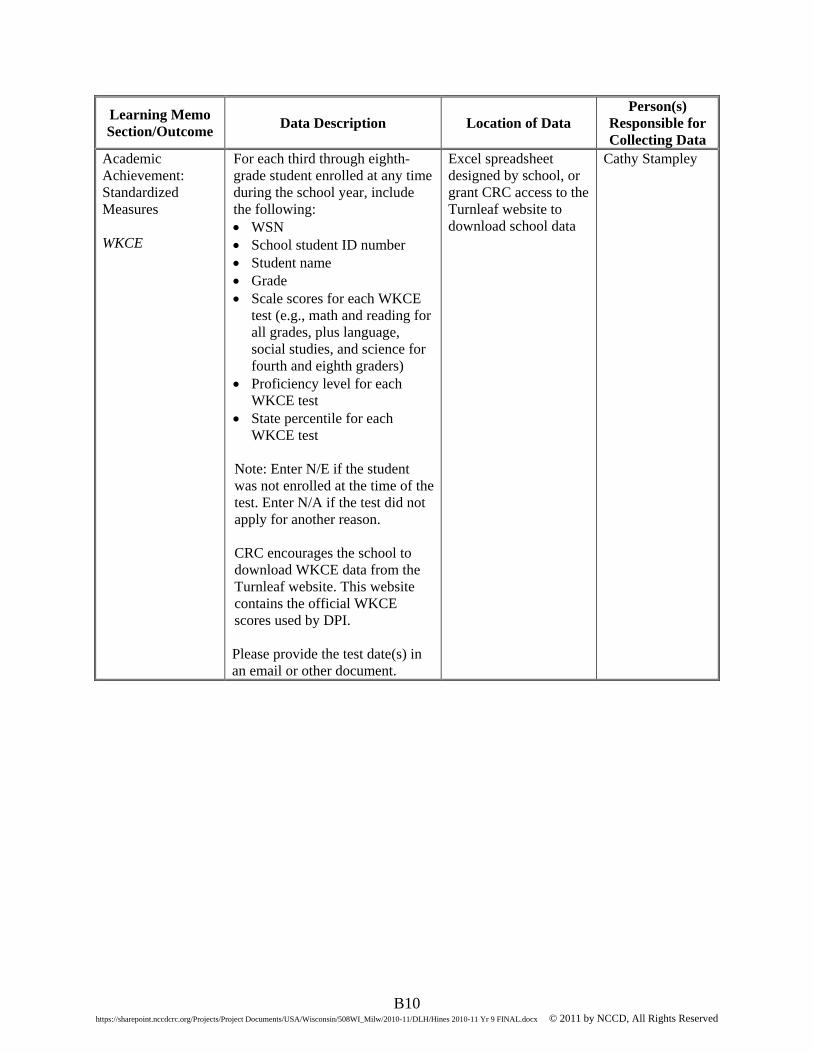
B10
https://sharepoint.nccdcrc.org/Projects/Project Documents/USA/Wisconsin/508WI_Milw/2010-11/DLH/Hines 2010-11 Yr 9 FINAL.docx © 2011 by NCCD, All Rights Reserved
Learning Memo Section/Outcome
Data Description Location of Data Person(s)
Responsible for Collecting Data
Academic Achievement: Standardized Measures WKCE
For each third through eighth-grade student enrolled at any time during the school year, include the following: WSN School student ID number Student name Grade Scale scores for each WKCE
test (e.g., math and reading for all grades, plus language, social studies, and science for fourth and eighth graders)
Proficiency level for each WKCE test
State percentile for each WKCE test
Note: Enter N/E if the student was not enrolled at the time of the test. Enter N/A if the test did not apply for another reason. CRC encourages the school to download WKCE data from the Turnleaf website. This website contains the official WKCE scores used by DPI. Please provide the test date(s) in an email or other document.
Excel spreadsheet designed by school, or grant CRC access to the Turnleaf website to download school data
Cathy Stampley

https://sharepoint.nccdcrc.org/Projects/Project Documents/USA/Wisconsin/508WI_Milw/2010-11/DLH/Hines 2010-11 Yr 9 FINAL.docx © 2011 by NCCD, All Rights Reserved
Appendix C
Trend Information
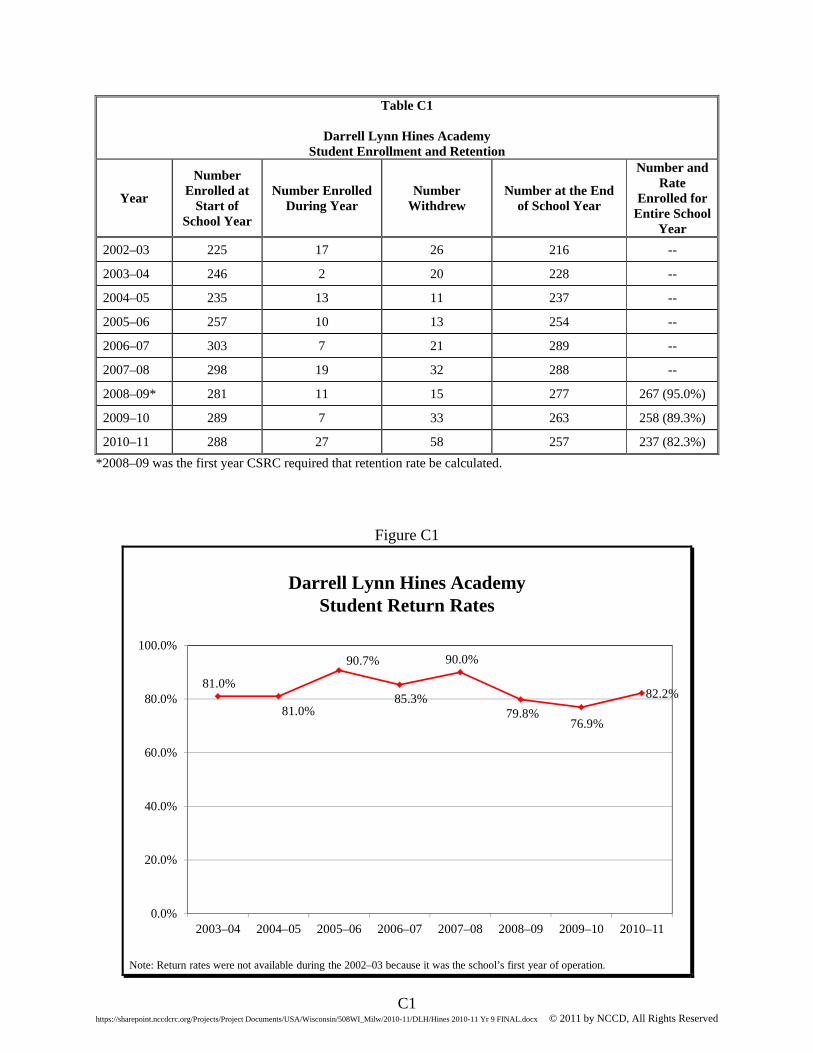
C1
https://sharepoint.nccdcrc.org/Projects/Project Documents/USA/Wisconsin/508WI_Milw/2010-11/DLH/Hines 2010-11 Yr 9 FINAL.docx © 2011 by NCCD, All Rights Reserved
Table C1
Darrell Lynn Hines Academy Student Enrollment and Retention
Year
Number Enrolled at
Start of School Year
Number Enrolled During Year
Number Withdrew
Number at the End of School Year
Number and Rate
Enrolled for Entire School
Year
2002–03 225 17 26 216 --
2003–04 246 2 20 228 --
2004–05 235 13 11 237 --
2005–06 257 10 13 254 --
2006–07 303 7 21 289 --
2007–08 298 19 32 288 --
2008–09* 281 11 15 277 267 (95.0%)
2009–10 289 7 33 263 258 (89.3%)
2010–11 288 27 58 257 237 (82.3%)
*2008–09 was the first year CSRC required that retention rate be calculated.
Figure C1
Darrell Lynn Hines AcademyStudent Return Rates
81.0%
81.0%
90.7%
85.3%
90.0%
79.8%76.9%
82.2%
0.0%
20.0%
40.0%
60.0%
80.0%
100.0%
2003–04 2004–05 2005–06 2006–07 2007–08 2008–09 2009–10 2010–11
Note: Return rates were not available during the 2002–03 because it was the school’s first year of operation.
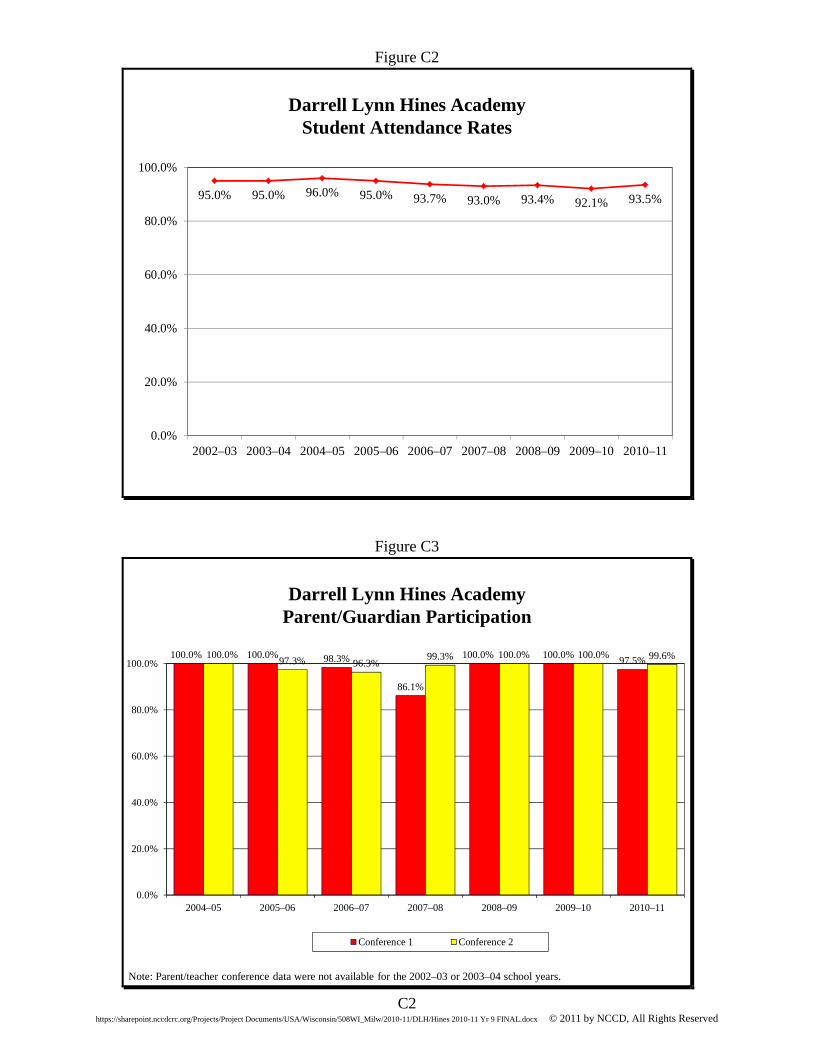
C2
https://sharepoint.nccdcrc.org/Projects/Project Documents/USA/Wisconsin/508WI_Milw/2010-11/DLH/Hines 2010-11 Yr 9 FINAL.docx © 2011 by NCCD, All Rights Reserved
Figure C2
Darrell Lynn Hines AcademyStudent Attendance Rates
95.0% 95.0% 96.0% 95.0% 93.7% 93.0% 93.4% 92.1% 93.5%
0.0%
20.0%
40.0%
60.0%
80.0%
100.0%
2002–03 2003–04 2004–05 2005–06 2006–07 2007–08 2008–09 2009–10 2010–11
Figure C3
Darrell Lynn Hines AcademyParent/Guardian Participation
100.0% 100.0% 98.3%
86.1%
100.0% 100.0%97.5%
100.0%97.3% 96.3%
99.3% 100.0% 100.0% 99.6%
0.0%
20.0%
40.0%
60.0%
80.0%
100.0%
2004–05 2005–06 2006–07 2007–08 2008–09 2009–10 2010–11
Conference 1 Conference 2
Note: Parent/teacher conference data were not available for the 2002–03 or 2003–04 school years.

C3
https://sharepoint.nccdcrc.org/Projects/Project Documents/USA/Wisconsin/508WI_Milw/2010-11/DLH/Hines 2010-11 Yr 9 FINAL.docx © 2011 by NCCD, All Rights Reserved
Table C2
Darrell Lynn Hines Academy Stanford Diagnostic Reading Test Year-to-year Progress
Average Grade-level Advancement Grades 1–3
School Year N Average Grade-level
Advancement
2004–05 38 0.9
2005–06 41 1.0
2006–07 46 0.5
2007–08 52 0.7
2008–09 45 0.9
2009–10 36 0.7
2010–11 45 1.1
Note: SDRT scores were not calculated the same way during the 2002–03 and 2003–04 school years. Therefore, data for those years are not included in this table.
Table C3
Darrell Lynn Hines Academy WKCE Year-to-year Progress
Students Who Remained Proficient or Showed Advancement Grades 4–8
School Year Reading Math
2005–06 72.7% 64.2%
2006–07 82.2% 73.1%
2007–08 83.8% 76.7%
2008–09 80.0% 67.9%
2009–10 80.6% 94.3%
2010–11 86.7% 82.2%
Note: WKCE scores were not reported the same way during the 2002–03, 2003–04, and 2004–05 school years. Therefore, data for those years are not included in this table.
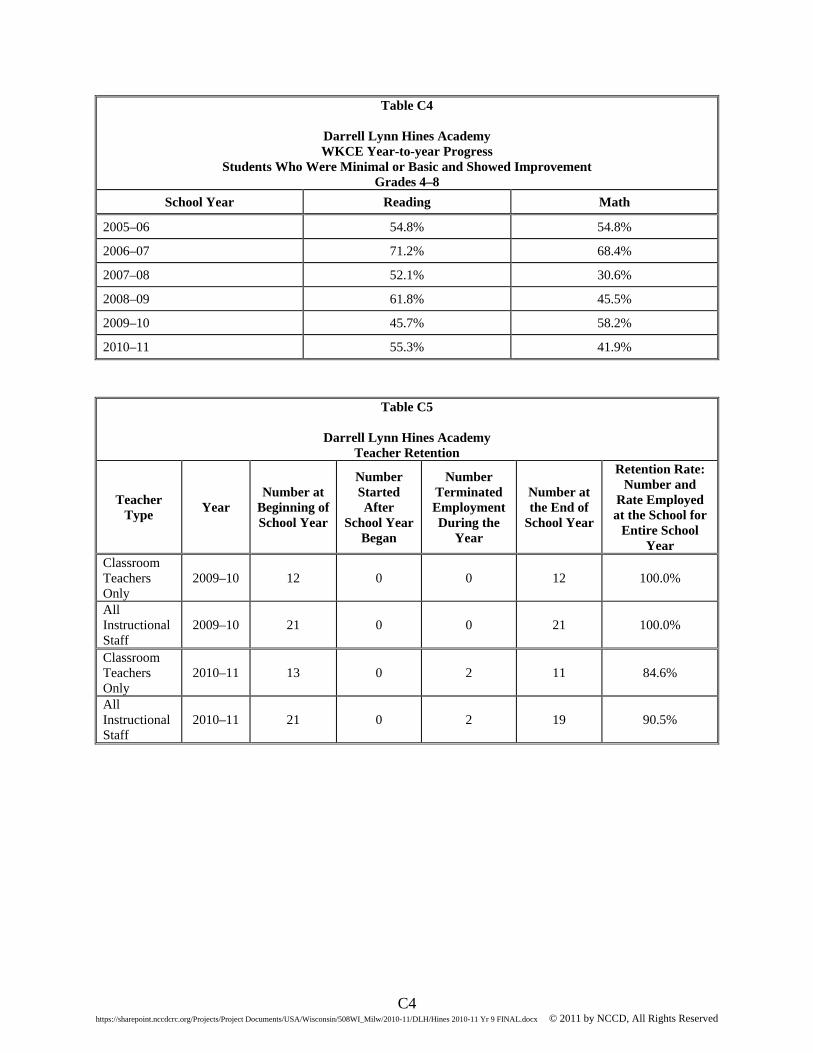
C4
https://sharepoint.nccdcrc.org/Projects/Project Documents/USA/Wisconsin/508WI_Milw/2010-11/DLH/Hines 2010-11 Yr 9 FINAL.docx © 2011 by NCCD, All Rights Reserved
Table C4
Darrell Lynn Hines Academy WKCE Year-to-year Progress
Students Who Were Minimal or Basic and Showed Improvement Grades 4–8
School Year Reading Math
2005–06 54.8% 54.8%
2006–07 71.2% 68.4%
2007–08 52.1% 30.6%
2008–09 61.8% 45.5%
2009–10 45.7% 58.2%
2010–11 55.3% 41.9%
Table C5
Darrell Lynn Hines Academy Teacher Retention
Teacher Type
Year Number at
Beginning of School Year
Number Started After
School Year Began
Number Terminated Employment During the
Year
Number at the End of
School Year
Retention Rate: Number and
Rate Employed at the School for
Entire School Year
Classroom Teachers Only
2009–10 12 0 0 12 100.0%
All Instructional Staff
2009–10 21 0 0 21 100.0%
Classroom Teachers Only
2010–11 13 0 2 11 84.6%
All Instructional Staff
2010–11 21 0 2 19 90.5%

C5
https://sharepoint.nccdcrc.org/Projects/Project Documents/USA/Wisconsin/508WI_Milw/2010-11/DLH/Hines 2010-11 Yr 9 FINAL.docx © 2011 by NCCD, All Rights Reserved
Table C6
Darrell Lynn Hines Academy
Teacher Return Rate*
Teacher Type Year Number at End of Prior School
Year
Number Returned at Beginning of
Current School Year
Return Rate
Classroom Teachers Only 2009–10 11 11 100.0%
All Instructional Staff 2009–10 19 18 94.7%
Classroom Teachers Only 2010–11 6 6 100.0%
All Instructional Staff 2010–11 13 13 100.0%
*Includes only teachers who were eligible to return, i.e., were offered a position for fall.
Table C7
Darrell Lynn Hines Academy Adequate Yearly Progress
Year Met Improvement Status
2003–04 Yes Satisfactory
2004–05 Yes Satisfactory
2005–06 Yes Satisfactory
2006–07 Yes Satisfactory
2007–08 No Satisfactory
2008–09 Yes Satisfactory
2009–10 Yes Satisfactory
2010–11 No Satisfactory

https://sharepoint.nccdcrc.org/Projects/Project Documents/USA/Wisconsin/508WI_Milw/2010-11/DLH/Hines 2010-11 Yr 9 FINAL.docx © 2011 by NCCD, All Rights Reserved
Appendix D
Pilot Scorecard
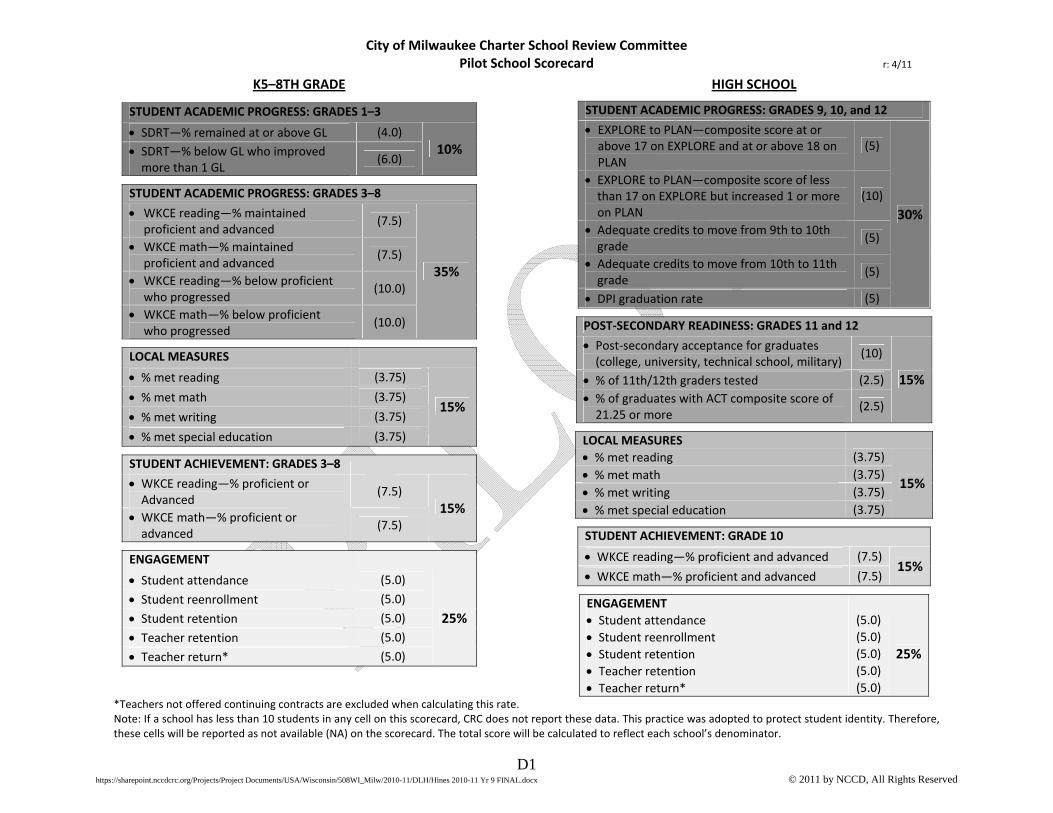
D1
https://sharepoint.nccdcrc.org/Projects/Project Documents/USA/Wisconsin/508WI_Milw/2010-11/DLH/Hines 2010-11 Yr 9 FINAL.docx © 2011 by NCCD, All Rights Reserved
City of Milwaukee Charter School Review Committee Pilot School Scorecard r: 4/11
K5–8TH GRADE
STUDENT ACADEMIC PROGRESS: GRADES 1–3
SDRT—% remained at or above GL (4.0)
10% SDRT—% below GL who improved more than 1 GL
(6.0)
STUDENT ACADEMIC PROGRESS: GRADES 3–8 WKCE reading—% maintained
proficient and advanced (7.5)
35%
WKCE math—% maintained proficient and advanced
(7.5)
WKCE reading—% below proficient who progressed
(10.0)
WKCE math—% below proficient who progressed
(10.0)
LOCAL MEASURES
% met reading (3.75)
15% % met math (3.75)
% met writing (3.75)
% met special education (3.75)
STUDENT ACHIEVEMENT: GRADES 3–8 WKCE reading—% proficient or Advanced
(7.5)
15% WKCE math—% proficient or advanced
(7.5)
ENGAGEMENT
Student attendance (5.0)
25% Student reenrollment (5.0)
Student retention (5.0)
Teacher retention (5.0)
Teacher return* (5.0)
HIGH SCHOOL
STUDENT ACADEMIC PROGRESS: GRADES 9, 10, and 12 EXPLORE to PLAN—composite score at or above 17 on EXPLORE and at or above 18 on PLAN
(5)
30%
EXPLORE to PLAN—composite score of less than 17 on EXPLORE but increased 1 or more on PLAN
(10)
Adequate credits to move from 9th to 10th grade
(5)
Adequate credits to move from 10th to 11th grade
(5)
DPI graduation rate (5)
POST‐SECONDARY READINESS: GRADES 11 and 12 Post‐secondary acceptance for graduates (college, university, technical school, military)
(10)
15% % of 11th/12th graders tested (2.5)
% of graduates with ACT composite score of 21.25 or more
(2.5)
LOCAL MEASURES % met reading (3.75)
15% % met math (3.75)
% met writing (3.75)
% met special education (3.75)
STUDENT ACHIEVEMENT: GRADE 10
WKCE reading—% proficient and advanced (7.5) 15%
WKCE math—% proficient and advanced (7.5)
ENGAGEMENT Student attendance (5.0)
25% Student reenrollment (5.0)
Student retention (5.0)
Teacher retention (5.0)
Teacher return* (5.0) *Teachers not offered continuing contracts are excluded when calculating this rate. Note: If a school has less than 10 students in any cell on this scorecard, CRC does not report these data. This practice was adopted to protect student identity. Therefore, these cells will be reported as not available (NA) on the scorecard. The total score will be calculated to reflect each school’s denominator.

D2 https://sharepoint.nccdcrc.org/Projects/Project Documents/USA/Wisconsin/508WI_Milw/2010-11/DLH/Hines 2010-11 Yr 9 FINAL.docx © 2011 by NCCD, All Rights Reserved
City of Milwaukee Charter School Review Committee Scorecard
Darrell Lynn Hines Academy 2010–11 School Year
Area Measure Max. Points
% Total Score
Performance Points Earned
Student Academic Progress Grades 1–3
SDRT: % remained at or above GL
4 10%
91.9% 3.7
SDRT: % below GL who improved more than 1 GL
N/A (6)
-- --
Student Academic Progress Grades 3–8
WKCE reading: % maintained proficient and
advanced 7.5
35%
86.7% 6.5
WKCE math: % maintained proficient and
advanced 7.5 82.2% 6.2
WKCE reading: % below proficient who
progressed 10 55.3% 5.5
WKCE math: % below proficient who
progressed 10 41.9% 4.2
Local Measures
% met reading 3.75
15%
64.0% 2.4
% met math 3.75 64.2% 2.4
% met writing 3.75 66.9% 2.5
% met special education 3.75 96.0% 3.6
Student Achievement Grades 3–8
WKCE reading: % proficient or advanced
7.5 15%
60.5% 4.5
WKCE math: % proficient or advanced
7.5 39.5% 3.0
Engagement
Student attendance 5
25%
93.5% 4.7
Student reenrollment 5 82.2% 4.1
Student retention 5 82.3% 4.1
Teacher retention rate 5 90.5% 4.5
Teacher return rate 5 100.0% 5.0
TOTAL 94 66.9 (71.2%)
Note: If a school has fewer than 10 students in any cell on this scorecard, CRC does not report these data. This practice was adopted to protect student identity. These cells are reported as not available (N/A). The percentage is calculated based on the modified denominator, rather than 100 possible points. Teacher retention and return rates include both classroom teachers and other instructional staff.


