Download - December 2009 - Your Markets Monthly
December 2009Volume 1, Edition 13
Don’t forget to join
www.toptraderthinking.com
as a FREE Member so you can access a whole lot of other great info for Top Traders!
CONTACT US FOR A FREE EVALUATION OF YOUR SHARE PORTFOLIO OR TRADING HISTORY
Or call us DIRECTLY (in Aust.)1300 73 66 11Outside Australia+617 5504 2222
•FUTURES•GLOBAL SHARES•CFDs•FX TRADING•PRECIOUS METALS•RECOMMENDATION PROGRAMS•ONLINE TRADIN G•FREE WEBINARS for members•P ERSONAL SERVICE•DAILY MARKET REPORTS
AND MUCH MORE…
In this edition:
• Will 2010 Be as Good as 2009? - Guest Contributor: Simon Maierhofer
• FAQ: What is a Margin?• FAQ: How much should you trade? - Guest Contributor: Guy Bower
• CFD Commodity Recommendations are here! - Information on our new service
• Technical Indicator of the Month: Williams’ %R - by Jason Achjian
• Recommendation Program update - Commodities Basket Recommendations - William Chien's CFDs - Seasonal Spread Trading
29-Dec-09
Our Affiliates & Partners include:
Will 2010 Be as Good as 2009? by Simon Maierhofer
John Templeton's observation that bull markets are born on pessimism, grow on skepticism, mature on optimism and die on euphoria might never have been more apropos than it is today.
There are many pieces of Wall Street wisdom, some work, others don't, but John Templeton's quote is one to remember. In fact, it may be the single most important and most profitable principle for investors.
History shows that this principle is as easily forgotten, as it is simple. That's probably what makes it so effective. Investors, in particular fund managers and analysts (more about that in a moment), should frame John Templeton's advice and display it prominently, or use it as screensaver.
The reason we talk about investor sentiment is because it has reached extremes not seen in years. Couple this with a 65% rally in the S&P (SNP: ^GSPC), Dow Jones (DJI: ^DJI) and Nasdaq (Nasdaq: ^IXIC) and you have a possible recipe for disaster.
A bittersweet privilege
21st century investors had the bittersweet privilege of eyewitnessing the bust of several bubbles. Even though the bubbles all occurred in different asset classes, they had one common denominator - sudden and unexpected destruction.
A balloon that has been punctured does not deflate in an orderly way. That has been the case with technology (NYSEArca: XLK - News) in 2000, real estate (NYSEArca: IYR - News) following its 2005 top, and the broad US stock market (NYSEArca: SCHB - News), which topped in 2007 and tumbled in 2008/2009.
If you are one of the lucky few investors who foresaw all those asset bubbles, there is no reason to continue reading, if you aren't, it might be a good opportunity to reevaluate following the guidance that didn't keep you out of asset bubbles.
2010 - On the cusp
As 2009 is winding down, various indicators have reached trigger levels not seen in months, even years. None of those trusted gauges have bullish implications. This means that 2010 might get off to a very rocky start.
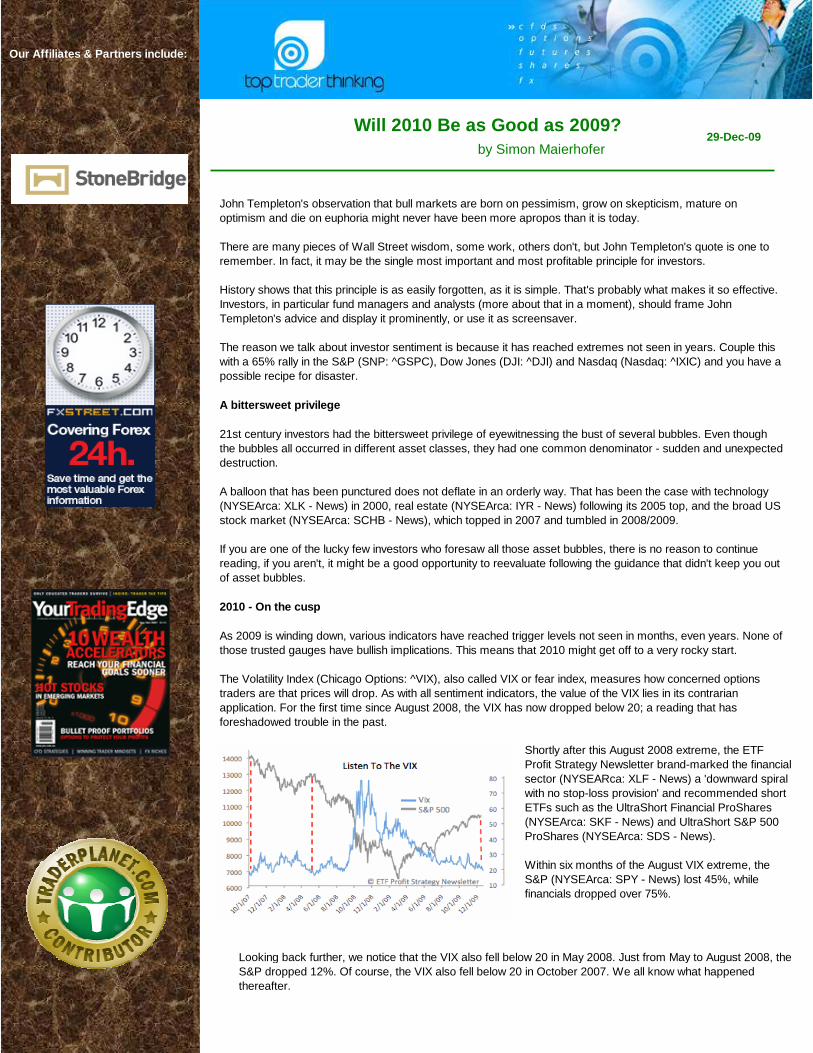
The Volatility Index (Chicago Options: ^VIX), also called VIX or fear index, measures how concerned options traders are that prices will drop. As with all sentiment indicators, the value of the VIX lies in its contrarian application. For the first time since August 2008, the VIX has now dropped below 20; a reading that has foreshadowed trouble in the past.
Shortly after this August 2008 extreme, the ETF Profit Strategy Newsletter brand-marked the financial sector (NYSEARca: XLF - News) a 'downward spiral with no stop-loss provision' and recommended short ETFs such as the UltraShort Financial ProShares (NYSEArca: SKF - News) and UltraShort S&P 500 ProShares (NYSEArca: SDS - News).
Within six months of the August VIX extreme, the S&P (NYSEArca: SPY - News) lost 45%, while financials dropped over 75%.
Looking back further, we notice that the VIX also fell below 20 in May 2008. Just from May to August 2008, the S&P dropped 12%. Of course, the VIX also fell below 20 in October 2007. We all know what happened thereafter.
Be careful who you trustMost of us look for a pro when it comes to matters beyond our knowledge. For a health issue, we visit a physician, for car trouble we go to a mechanic, etc. When it comes to investment guidance, however, trusting an advisor may not be the best thing to do.
Investors Intelligence is an organization that tracks about 140 financial newsletters. In October 2007, 62% of the polled newsletter writers/advisors thought prices would go up further. Only 19.6% were bearish. The rest thought that the market would move higher after a brief correction. We know today that 81.6% of those advisors were proven wrong.
The opposite happened in March 2009, when only 26.4% of the advisors were bullish. This time, 73.6% were proven wrong. Going against the grain, the ETF Profit Strategy Newsletter issued a strong buy alert on March 2nd. Stocks have rallied 65% since.
From blessing to curseWhat goes up must come down. That pattern has been established by history and the latter part (coming down) generally happens when least expected. This 65% rally from the March lows has morphed from blessing to curse. Now that the profits have been reaped, all that this rally does is mortgage 2010 growth.
The above Investors Intelligence and VIX readings show that the majority of traders, investors, and advisors did not see any of the major market turns coming since 2007. In fact, the vast majority of Wall Street has been wrong-footed consistently.
Once again, investors and advisors have set the stage for a major blindside. The number of bulls tracked by Investors Intelligence has reached the highest level since December 2007 while the number of bears clocked in at the lowest level in over six years. This is in addition to the message conveyed by the VIX.
The extent of the damageWe mentioned above the declines following extreme readings in October 2007, May 2008 and October 2008. Each decline was different in character but each lead to lower lows. October 2007 was followed by lower prices in May 2008, which was followed by lower prices in September 2008.
The rallies in between the above-mentioned secondary highs never advanced beyond flash in the pan status and did nothing more than once again trick investors into buying stocks at higher prices. Odds are, the rally from the March low will become known as the biggest flash in the pan, or sucker rally, since the Great Depression.
But, this time is differentThe most fascinating facet of investment research is the consistent appearance of the 'this time is different syndrome.' The market does what it's always done, but every time a top of larger degree is upon us, we find excuses for stocks to move even higher - just to be disappointed time and again.
If the stock market were a person or entity, it would probably compare investors to a poker player that falls again and again for the same bluff. The best way to call your opponents bluff is by knowing his hand. Well, here's what the stock market has in store for us.
Perception, to a large extent, is what drives the market, but perception is not real. Perception, like a poker player's face (aka poker face) can differ widely from the true value (aka the actual hand of cards).
If you boil it down to the basics, you come up with this formula:
Valuation + Perception = Market Value
Obviously, perception is the big fluctuating variable. Eventually, however, the market will always disregard perception and reset the market to its proper valuation. At that time the formula is: Market Value = Valuations
In other words, your opponents poker face may be enough to up the ante for a while, but when it comes time to settle the score, only what's in your hand counts. The same is true for stocks. In the end, only true value counts.
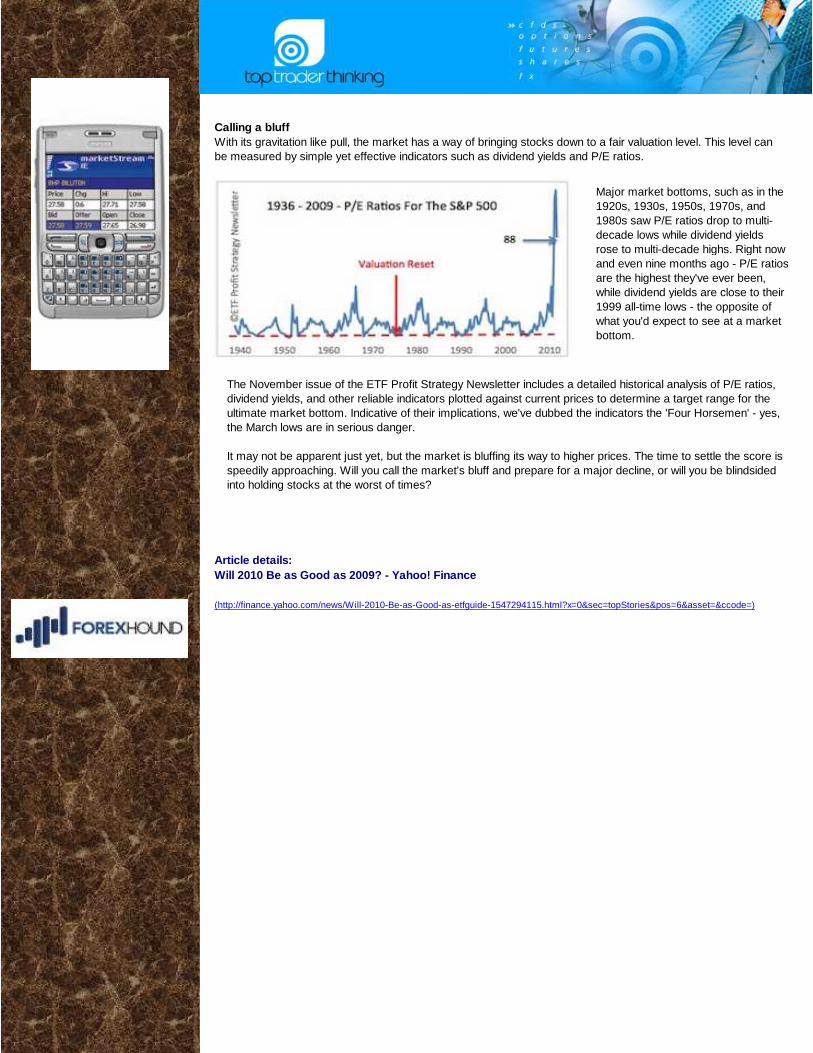
Calling a bluffWith its gravitation like pull, the market has a way of bringing stocks down to a fair valuation level. This level can be measured by simple yet effective indicators such as dividend yields and P/E ratios.
Major market bottoms, such as in the 1920s, 1930s, 1950s, 1970s, and 1980s saw P/E ratios drop to multi-decade lows while dividend yields rose to multi-decade highs. Right now - and even nine months ago - P/E ratios are the highest they've ever been, while dividend yields are close to their 1999 all-time lows - the opposite of what you'd expect to see at a market bottom.
The November issue of the ETF Profit Strategy Newsletter includes a detailed historical analysis of P/E ratios, dividend yields, and other reliable indicators plotted against current prices to determine a target range for the ultimate market bottom. Indicative of their implications, we've dubbed the indicators the 'Four Horsemen' - yes, the March lows are in serious danger.
It may not be apparent just yet, but the market is bluffing its way to higher prices. The time to settle the score is speedily approaching. Will you call the market's bluff and prepare for a major decline, or will you be blindsided into holding stocks at the worst of times?
Article details:Will 2010 Be as Good as 2009? - Yahoo! Finance
(http://finance.yahoo.com/news/Will-2010-Be-as-Good-as-etfguide-1547294115.html?x=0&sec=topStories&pos=6&asset=&ccode=)
Larry Williams
Tom Scollon
Daryl Guppy
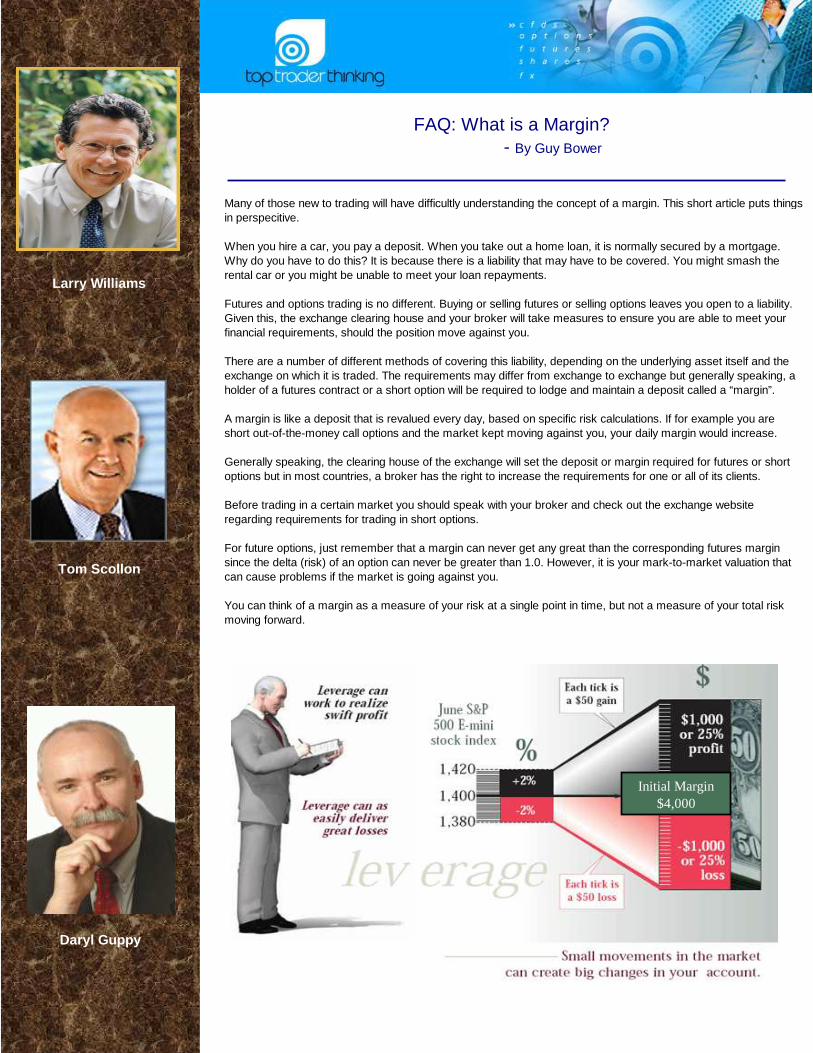
Many of those new to trading will have difficultly understanding the concept of a margin. This short article puts things in perspecitive.
When you hire a car, you pay a deposit. When you take out a home loan, it is normally secured by a mortgage. Why do you have to do this? It is because there is a liability that may have to be covered. You might smash the rental car or you might be unable to meet your loan repayments.
Futures and options trading is no different. Buying or selling futures or selling options leaves you open to a liability. Given this, the exchange clearing house and your broker will take measures to ensure you are able to meet your financial requirements, should the position move against you.
There are a number of different methods of covering this liability, depending on the underlying asset itself and the exchange on which it is traded. The requirements may differ from exchange to exchange but generally speaking, a holder of a futures contract or a short option will be required to lodge and maintain a deposit called a “margin”.
A margin is like a deposit that is revalued every day, based on specific risk calculations. If for example you are short out-of-the-money call options and the market kept moving against you, your daily margin would increase.
Generally speaking, the clearing house of the exchange will set the deposit or margin required for futures or short options but in most countries, a broker has the right to increase the requirements for one or all of its clients.
Before trading in a certain market you should speak with your broker and check out the exchange website regarding requirements for trading in short options.
For future options, just remember that a margin can never get any great than the corresponding futures margin since the delta (risk) of an option can never be greater than 1.0. However, it is your mark-to-market valuation that can cause problems if the market is going against you.
You can think of a margin as a measure of your risk at a single point in time, but not a measure of your total risk moving forward.
FAQ: What is a Margin? - By Guy Bower
Initial Margin$4,000

Guy Bower
Catherine Davey
Sari Mustonen-Kirk
FAQ: How much should you trade? - By Guy Bower
An important consideration in any trading strategy is how many contracts to trade or how much money to allocate to a particular trade. This article answers this very question.
There are two parts to this question:
How much capital should you commit? How many contracts should you trade? 1. Capital to commit
Futures and options trading is far from a risk-free pursuit. Careful consideration, therefore, must be given to how much of your total purse to put towards derivatives trading.
Risk adverse logic tells you the less, the better for the beginner. It all comes down to your aversion to risk. Those who find it hard to sleep while positions are open should not risk very much (in fact, they should probably not be trading in the first place). Those who can place a position and have the confidence that it is under control can afford to risk a little more. Many think 10 to 20 per cent of your total investment pool is an ideal place to start.
The correct answer differs from one person to the next.
2. Contracts to trade
There is also the issue of how much of your trading stake to risk on any one trade. If you read Market Wizards: Interviews with Top Traders by Jack Schwager, you will see the majority of successful traders interviewed suggest no more than 5 per cent of your money should be risked on any one trade. This 5 per cent refers to your stop-loss level, not the theoretical risk of the trade (since some strategies have theoretically unlimited risk).
Whatever you decide to place on any one trade, keep this in mind: use small amounts when you first start, since this is when you will make the most mistakes.
The most common approach to money management is the Percent at Risk method and this is best explained by example. Let’s say you have an account size of $50,000 and want to risk no more than 10% ($5,000) on any one trade.
You’ll need to make an estimate of your maximum risk on anyone trade. Let’s say it is $2,500. This means you can trade just two contracts ($5,000 / $2,500). If your stop levels are tighter and prefer to risk only $1000, you can trade 5 contracts ($5,000 / $1,000).
It is a relatively simple method but is actually quite common.
To be fair the subject of money management is a large one. Entire books have been written on the subject. It is a fascinating area, particularly for those that like reading about numbers. Two great books on the subject are:
Trade Your Way to Financial Freedom by Van TharpandPortfolio Management Formulas by Ralph Vince
http://www.toptraderthinking.com/toptrader/shop.asp ?id=42
Contributor information:Guy Bower is professional futures, options and spread trader. Guy is the author of two books:
Options: A Complete Guide and Hedging: Simple Strategies
HAVEN’T GOT A COPY OF ‘BULLSEYE – TOP TRADER THINKING’ YET…?
GRAB IT NOW & GET YOUR TRADERS BRAIN ON TRACK THROUGHOUT 2010!
Click the link below for info about ‘Bullseye – Top Trader Thinking’ and to buy your copy.
Great new global commodity product for smaller accounts…
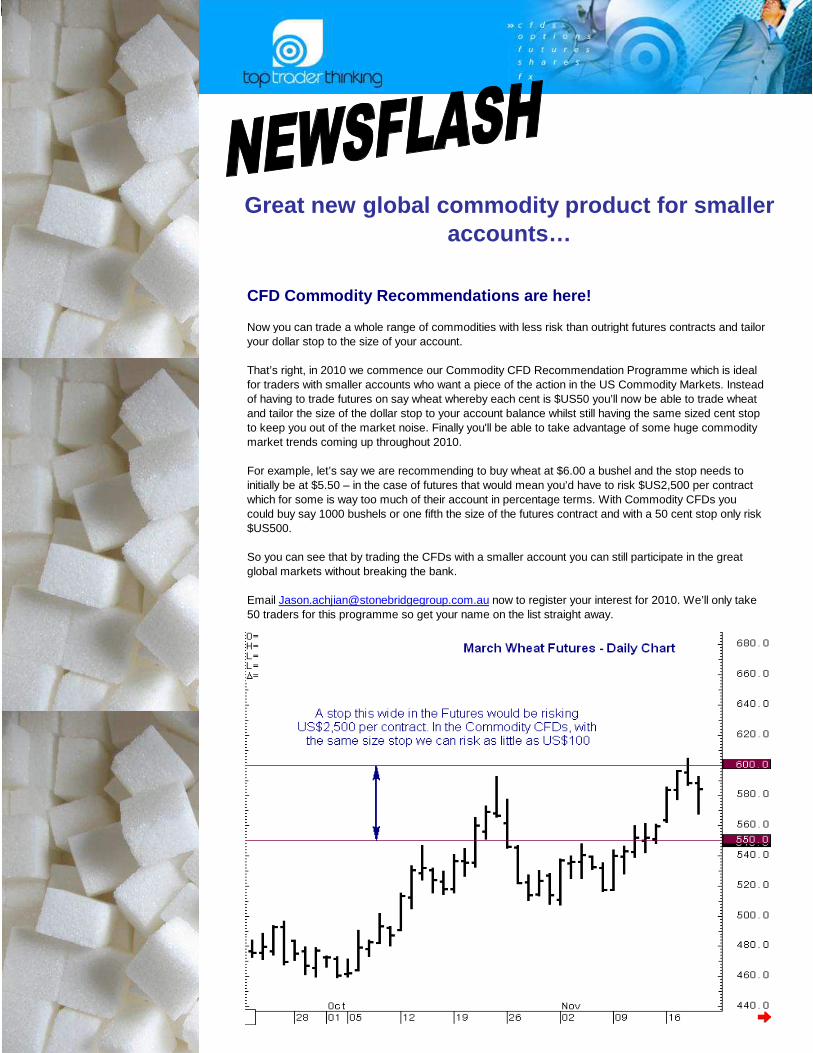
CFD Commodity Recommendations are here!
Now you can trade a whole range of commodities with less risk than outright futures contracts and tailor your dollar stop to the size of your account.
That’s right, in 2010 we commence our Commodity CFD Recommendation Programme which is ideal for traders with smaller accounts who want a piece of the action in the US Commodity Markets. Instead of having to trade futures on say wheat whereby each cent is $US50 you’ll now be able to trade wheat and tailor the size of the dollar stop to your account balance whilst still having the same sized cent stop to keep you out of the market noise. Finally you'll be able to take advantage of some huge commodity market trends coming up throughout 2010.
For example, let’s say we are recommending to buy wheat at $6.00 a bushel and the stop needs to initially be at $5.50 – in the case of futures that would mean you’d have to risk $US2,500 per contract which for some is way too much of their account in percentage terms. With Commodity CFDs you could buy say 1000 bushels or one fifth the size of the futures contract and with a 50 cent stop only risk $US500.
So you can see that by trading the CFDs with a smaller account you can still participate in the great global markets without breaking the bank.
Email [email protected] now to register your interest for 2010. We’ll only take 50 traders for this programme so get your name on the list straight away.
Technical Indicator of the MonthBy: Jason Achjian
Williams’ %R Indicator
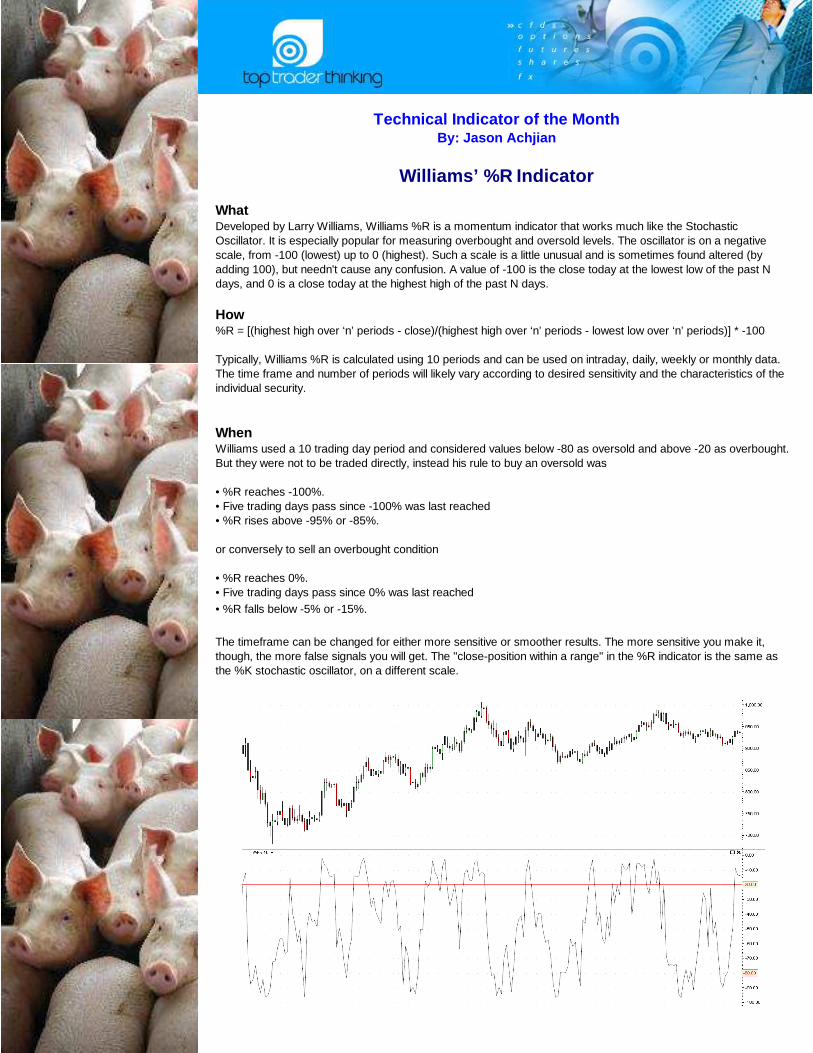
WhatDeveloped by Larry Williams, Williams %R is a momentum indicator that works much like the Stochastic Oscillator. It is especially popular for measuring overbought and oversold levels. The oscillator is on a negative scale, from -100 (lowest) up to 0 (highest). Such a scale is a little unusual and is sometimes found altered (by adding 100), but needn't cause any confusion. A value of -100 is the close today at the lowest low of the past N days, and 0 is a close today at the highest high of the past N days.
How%R = [(highest high over ‘n’ periods - close)/(highest high over ‘n’ periods - lowest low over ‘n’ periods)] * -100
Typically, Williams %R is calculated using 10 periods and can be used on intraday, daily, weekly or monthly data. The time frame and number of periods will likely vary according to desired sensitivity and the characteristics of the individual security.
WhenWilliams used a 10 trading day period and considered values below -80 as oversold and above -20 as overbought. But they were not to be traded directly, instead his rule to buy an oversold was
• %R reaches -100%. • Five trading days pass since -100% was last reached • %R rises above -95% or -85%.
or conversely to sell an overbought condition
• %R reaches 0%. • Five trading days pass since 0% was last reached • %R falls below -5% or -15%.
The timeframe can be changed for either more sensitive or smoother results. The more sensitive you make it, though, the more false signals you will get. The "close-position within a range" in the %R indicator is the same as the %K stochastic oscillator, on a different scale.
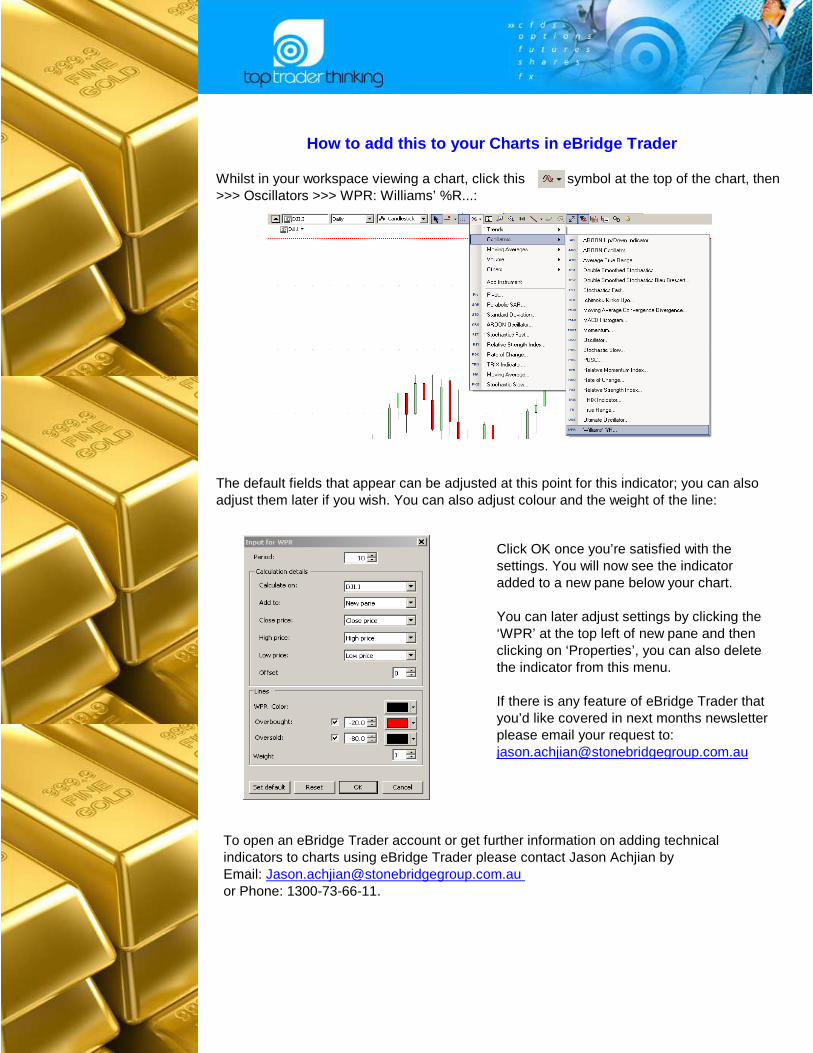
Click OK once you’re satisfied with the settings. You will now see the indicator added to a new pane below your chart.
You can later adjust settings by clicking the ‘WPR’ at the top left of new pane and then clicking on ‘Properties’, you can also delete the indicator from this menu.
If there is any feature of eBridge Trader that you’d like covered in next months newsletter please email your request to: [email protected]
How to add this to your Charts in eBridge Trader
Whilst in your workspace viewing a chart, click this symbol at the top of the chart, then >>> Oscillators >>> WPR: Williams’ %R...:
The default fields that appear can be adjusted at this point for this indicator; you can also adjust them later if you wish. You can also adjust colour and the weight of the line:
To open an eBridge Trader account or get further information on adding technical indicators to charts using eBridge Trader please contact Jason Achjian by Email: [email protected] or Phone: 1300-73-66-11.
http://www.toptraderthinking.com/toptrader/shop.asp?id=42http://www.toptraderthinking.com/toptrader/shop.asp?id=42
http://www.toptraderthinking.com/toptrader/shop.asp?id=42
http://www.toptraderthinking.com/toptrader/shop.asp?id=42
http://www.toptraderthinking.com/toptrader/shop.asp?id=42
http://www.toptraderthinking.com/toptrader/shop.asp?id=42
http://www.toptraderthinking.com/toptrader/shop.asp?id=42
http://www.toptraderthinking.com/toptrader/shop.asp?id=42
http://www.toptraderthinking.com/toptrader/shop.asp?id=42
http://www.toptraderthinking.com/toptrader/shop.asp?id=42
http://www.toptraderthinking.com/toptrader/shop.asp?id=42
http://www.toptraderthinking.com/toptrader/shop.asp?id=42
http://www.toptraderthinking.com/toptrader/shop.asp?id=42http://www.toptraderthinking.com/toptrader/shop.asp?id=42
Matt Kirk
Jason Achjian
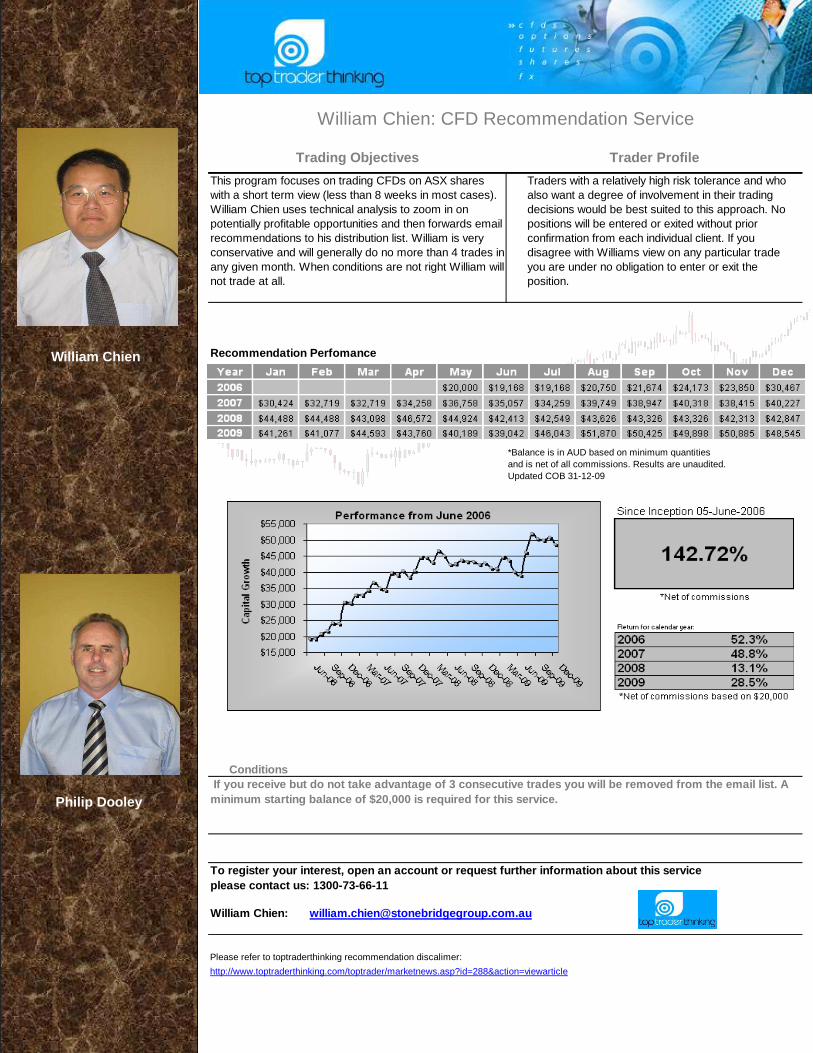
Recommendation Perfomance
Conditions
William Chien: [email protected]
William Chien: CFD Recommendation Service
*Balance is in AUD based on minimum quantities and is net of all commissions. Results are unaudited.Updated COB 31-12-09
Trading Objectives Trader Profile
This program focuses on trading CFDs on ASX shares with a short term view (less than 8 weeks in most cases). William Chien uses technical analysis to zoom in on potentially profitable opportunities and then forwards email recommendations to his distribution list. William is very conservative and will generally do no more than 4 trades in any given month. When conditions are not right William will not trade at all.
Traders with a relatively high risk tolerance and who also want a degree of involvement in their trading decisions would be best suited to this approach. No positions will be entered or exited without prior confirmation from each individual client. If you disagree with Williams view on any particular trade you are under no obligation to enter or exit the position.
If you receive but do not take advantage of 3 cons ecutive trades you will be removed from the email l ist. A minimum starting balance of $20,000 is required for this service.
To register your interest, open an account or reque st further information about this service please contact us: 1300-73-66-11
Please refer to toptraderthinking recommendation discalimer:
http://www.toptraderthinking.com/toptrader/marketnews.asp?id=288&action=viewarticle
William Chien
Philip Dooley
Jason Achjian: [email protected]
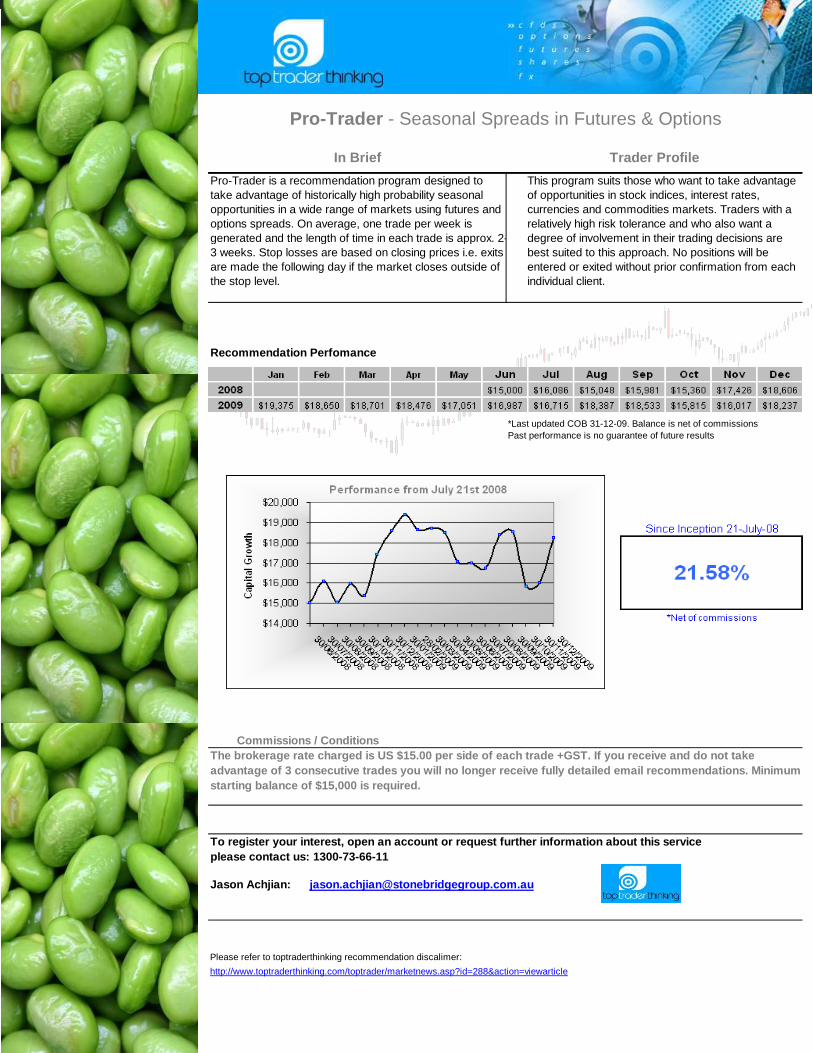
Pro-Trader - Seasonal Spreads in Futures & Options
Commissions / Conditions
In Brief Trader Profile
Pro-Trader is a recommendation program designed to take advantage of historically high probability seasonal opportunities in a wide range of markets using futures and options spreads. On average, one trade per week is generated and the length of time in each trade is approx. 2-3 weeks. Stop losses are based on closing prices i.e. exits are made the following day if the market closes outside of the stop level.
This program suits those who want to take advantage of opportunities in stock indices, interest rates, currencies and commodities markets. Traders with a relatively high risk tolerance and who also want a degree of involvement in their trading decisions are best suited to this approach. No positions will be entered or exited without prior confirmation from each individual client.
To register your interest, open an account or reque st further information about this service please contact us: 1300-73-66-11
Please refer to toptraderthinking recommendation discalimer:
http://www.toptraderthinking.com/toptrader/marketnews.asp?id=288&action=viewarticle
Recommendation Perfomance
*Last updated COB 31-12-09. Balance is net of commissionsPast performance is no guarantee of future results
The brokerage rate charged is US $15.00 per side of each trade +GST. If you receive and do not take advantage of 3 consecutive trades you will no longe r receive fully detailed email recommendations. Min imum starting balance of $15,000 is required.
Please contact the Futures dealing desk for further information on recommendation programsPhone: 1300 73 66 11 Email: [email protected]
RECOMMENDATION PROGRAMS – UPDATE
PRO-TRADER (SEASONAL SPREAD TRADING)
MINIMUM ENTRY LEVEL $A20,000
OCTOBER 2007 TO NOVEMBER 2009
MINIMUM ENTRY LEVEL $A10,000
WILLIAM CHIENS CFD RECOMMENDATIONS
UP 142.72% NET OF COMMISSIONS
JUNE 2008 TO NOVEMBER 2009
JUNE 2006 TO NOVEMBER 2009
NOTE: RESULTS ARE UNAUDITED – PLEASE CALL OR EMAIL TO REQUEST SUPPORTING DOCUMENTATION IF YOU ARE CONSIDERING PARTICIPATING IN ANY OF OUR RECOMMENDATION PROGRAMS
COMMODITY BASKET RECOMMENDATIONS (CBR)
MINIMUM ENTRY LEVEL $A15,000 UP 21.58% NET OF COMMISSIONS
UP 54.90% NET OF COMMISSIONS
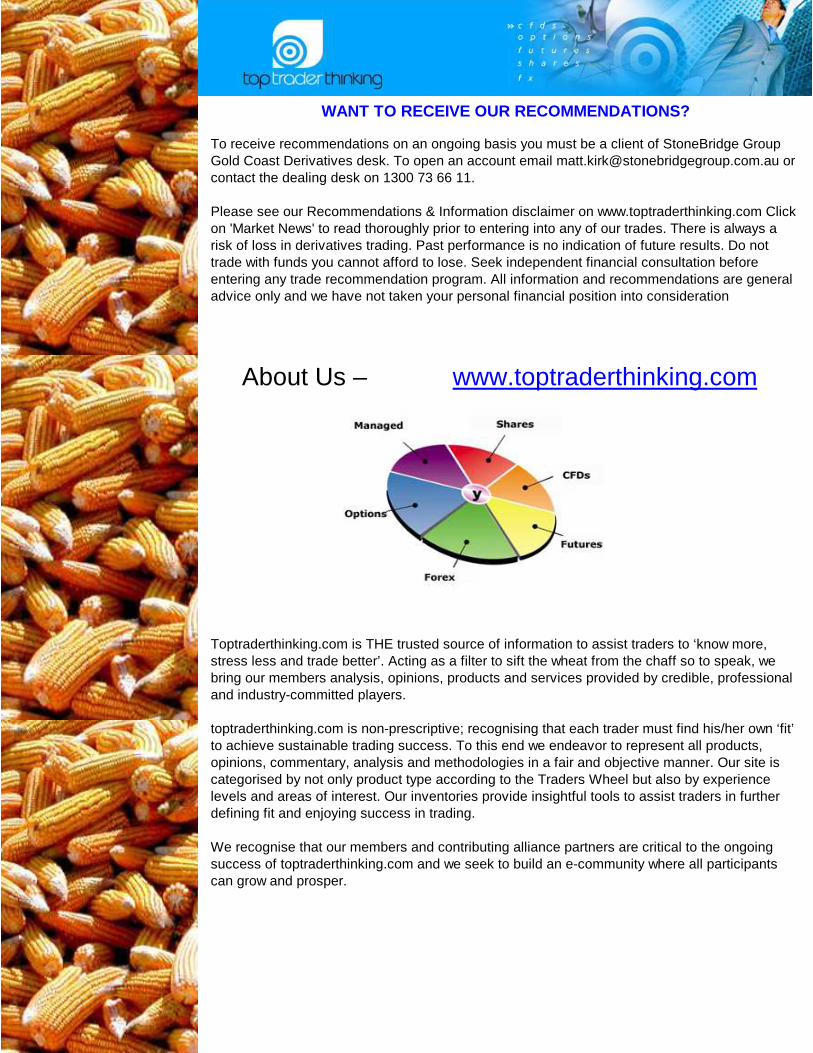
Toptraderthinking.com is THE trusted source of information to assist traders to ‘know more, stress less and trade better’. Acting as a filter to sift the wheat from the chaff so to speak, we bring our members analysis, opinions, products and services provided by credible, professional and industry-committed players.
toptraderthinking.com is non-prescriptive; recognising that each trader must find his/her own ‘fit’ to achieve sustainable trading success. To this end we endeavor to represent all products, opinions, commentary, analysis and methodologies in a fair and objective manner. Our site is categorised by not only product type according to the Traders Wheel but also by experience levels and areas of interest. Our inventories provide insightful tools to assist traders in further defining fit and enjoying success in trading.
We recognise that our members and contributing alliance partners are critical to the ongoing success of toptraderthinking.com and we seek to build an e-community where all participants can grow and prosper.
To receive recommendations on an ongoing basis you must be a client of StoneBridge Group Gold Coast Derivatives desk. To open an account email [email protected] or contact the dealing desk on 1300 73 66 11. Please see our Recommendations & Information disclaimer on www.toptraderthinking.com Click on 'Market News' to read thoroughly prior to entering into any of our trades. There is always a risk of loss in derivatives trading. Past performance is no indication of future results. Do not trade with funds you cannot afford to lose. Seek independent financial consultation before entering any trade recommendation program. All information and recommendations are general advice only and we have not taken your personal financial position into consideration
WANT TO RECEIVE OUR RECOMMENDATIONS?
About Us – www.toptraderthinking.com
�
�
�
�
�
�

�
uROk 33 DAY CHALLENGE - BRILLIANT FOR TRADERS
A complete DIY life management and goal achievement tool the uROk 33 Day Challenge is great for traders as well. We all know that to t rade successfully and consistently we need a plan but we also need a balanced life. The uROk 33 Day Challenge will help you reach new h eights in all areas including: Health, Wealth, Self, Love, Work, Create and Y (per sonal purpose and who you really are).
The Challenge is ideal for both new and seasoned tr aders and will help you cement what you've learned and take action to realise the goals you truly desire in the markets and in life in general.
Includes:
1. uROk 33 DAY CHALLENGE Dream Your Life, Live Your Dream PERSONAL PLANNING WORKBOOK
2. GUIDED VISUALISATION CD by SARI
Dream Your Life, Live Your Dream for Contribution & Achievement Compact Disc.
3. uROk.tv MEMBERSHIP
It's easy, it's enjoyable and it actually works. If you're ready to have more, be more, give more, do more, and get more out of life (and tradin g the markets) then order this revolutionary programme today.
PAY ONLINE WITH Mastercard and Visa http://www.toptraderthinking.com/toptrader/shop.asp ?id=82
(Aust Only) Call Matt on 0409 208 658 for AMEX orde rs or email: [email protected]


