
www.cushmanwakefield.com
Derbyshire Dales District Council Local Plan & Community Infrastructure Levy
Viability Study
14 December 2016

Derbyshire Dales District Council
Contents
1. Introduction 2
2. Local Plan Context 4
3. Community Infrastructure Levy Context 12
4. Viability Testing Methodology 16
5. Viability Assumptions 21
6. Viability Results 41
7. Implications of Viability Results for Local Plan and CIL 50
8. Strategic Site Sampling 55
9. Conclusions and Recommendations 61
Appendix 1: Open space cost impact assumptions
Appendix 2: Market evidence
Appendix 3: Summary of stakeholder responses to questionnaire survey
Appendix 4: List of stakeholders invited to participate in viability consultation June 2015
Appendix 5: Residential development appraisal results
Appendix 6: Strategic site sampling appraisals


Derbyshire Dales District Council
Report Disclaimer
This report should not be relied upon as a basis for entering into transactions without seeking
specific, qualified, professional advice. Whilst facts have been rigorously checked, Cushman
& Wakefield can take no responsibility for any damage or loss suffered as a result of any
inadvertent inaccuracy within this report. Information contained herein should not, in whole or
part, be published, reproduced or referred to without prior approval. Any such reproduction
should be credited to Cushman & Wakefield.
Version Prepared by Approved by Date
Viability Study
Stephanie Hiscott
MRICS
Stephen Miles
MRICS, RTPI
14 December 2016
In light of the recent Referendum concerning the UK’s membership of the EU, we are now in
a period of uncertainty in relation to many factors that impact the property investment and
letting markets. At this time organisations involved in the industry are reflecting on the
potential implications of the UK leaving the EU. Since the Referendum date it has not been
possible to gauge the effect of the impact on rental and capital values, along with other
elements affecting property appraisal. Cushman & Wakefield continues to closely monitor
market developments and trends in order that we can provide clients with the most up to date
advice. The views contained in this document are provided in the context of this market
uncertainty and as such our estimates and opinions are susceptible to change. Development
appraisal results are particularly sensitive to changes in key variables such as cost and
values. Accordingly we advise that clients have regard to this risk and may need to
commission further advice before acting on the opinions expressed


Derbyshire Dales District Council
2
1. Introduction
1.1 Purpose
Cushman & Wakefield has been commissioned by Derbyshire Dales District Council to produce
viability evidence to inform the Council’s emerging Local Plan and Community Infrastructure
Levy (CIL). The study assesses sites included within the Council’s Strategic Housing Land
Availability Assessment (SHLAA), draft policies of the emerging Local Plan and identifies the
viability headroom available for a Community Infrastructure Levy.
In parallel with this work Fore Consulting is assessing the critical infrastructure required to deliver
the growth across the District and to prepare a draft Infrastructure Delivery Plan.
This report represents an update to the version that was produced in September 2015, providing
revised market data, additional site sampling and taking account of the latest policies and
proposals of the Draft Local Plan.
1.2 Method of approach
The approach to the study has involved the following tasks:
A. A market assessment, to profile the types of development likely to come forward and the
economics of development within the District (i.e. costs, rents/capital values and other
relevant development appraisal assumptions)
B. Analysis of sites in the SHLAA, to identify the sites and scheme typologies to be tested
through the viability assessment. Preferred sites from the SHLAA have been assimilated
into a series of hypothetical schemes that have been tested in different locations across the
District
C. Review of draft and policies, to ‘screen’ those policies that are likely to have a direct impact
on development costs/viability that require testing
D. Consultation with developers, to test and refine the appraisal assumptions base
E. Viability modelling, assessment of the selected schemes, scenarios and sensitivities
F. Further testing of a number of the strategic development sites within the SHLAA. This
includes residential development sites and mixed use development sites.
G. Interpretation/development of policy implications for the Local Plan and CIL.
This document makes recommendations on the standards that could viably be applied to
development in Derbyshire Dales, in respect of Local Plan policies, Strategic Housing Land
Availability and CIL.

Derbyshire Dales District Council
3
A separate report has been produced by Fore which provides an Infrastructure Delivery Plan
which the Council will be able to use as a working document to inform the production of a
Regulation 123 list.
1.3 Structure of report
This report is structured in nine sections. Section 2 sets the Local Plan Policy context and
analysis of the Strategic Housing Land Availability. Section 3 sets out the background to CIL,
the regulations governing CIL and recent changes to the regulations. The methodology is
explained in Section 4 followed by the assumptions in Section 5 and results in Section 6. Section
7 provides a commentary on the implications for the Local Plan and CIL. Section 8 then models
the viability of a finer grain sampling of strategic sites included in the Local Plan to retest the
conclusions of the area wide work. The final conclusions and recommendations are summarised
in Section 9.
Derbyshire Dales District Council
4
2. Local Plan Context
2.1. Local Plan viability context
The need for viability testing of Local Plans has arisen as a result of the requirements of the
National Planning Policy Framework (NPPF) published in March 2012. The NPPF has
strengthened the importance of viability in the planning process and particularly in respect of
development plan preparation. In order to ensure viability and deliverability of Local Plans, the
NPPF states:
“Plans should be deliverable. Therefore, the sites and the scale of development identified in the
plan should not be subject to such a scale of obligations and policy burdens that their ability to be
developed viably is threatened. To ensure viability, the costs of any requirements likely to be
applied to development, such as requirements for affordable housing, standards, infrastructure
contributions or other requirements should, when taking account of the normal cost of
development and mitigation, provide competitive returns to a willing land owner and willing
developer to enable the development to be deliverable.” Para 173.
The NPPF has reinforced the requirements for the provision of a deliverable supply of housing
land, stipulating the need for a rolling five year supply of deliverable sites with a buffer of 20% for
authorities where there has been ‘persistent under delivery’. It also requires local authorities to
identify sites for years 6-10 and 11-15 which should be realistically deliverable over the
development plan period. In respect of the five year supply, it clarifies the definition of ‘deliverable’
stating:
“To be considered deliverable, sites should be available now, offer a suitable location for
development now, and be achievable with a realistic prospect that housing will be delivered on
the site within five years and in particular that development of the site is viable. Sites with planning
permission should be considered deliverable until permission expires, unless there is clear
evidence that schemes will not be implemented within five years, for example they will not be
viable, there is no longer a demand for the type of units or sites have long term phasing plans.”
Footnote 11.
The online National Planning Policy Guidance provides the following guidance regarding the
production of viability assessments in support of plan making:
Local authorities should ensure that the Local Plan vision and policies are realistic and
provide high level assurance that plan policies are viable.
Development of plan policies should be iterative – with draft policies tested against evidence
of the likely ability of the market to deliver the plan’s policies, and revised as part of a dynamic
process.

Derbyshire Dales District Council
5
Assessing the viability of plans does not require individual testing of every site or assurance
that individual sites are viable; site typologies may be used to determine viability at policy
level.
The cumulative cost of planning standards and obligations should be tested to ensure
viability
Plan makers should not plan to the margin of viability but should allow for a buffer to respond
to changing markets and to avoid the need for frequent plan updating.
Policies should be deliverable and should not be based on an expectation of future rises in
values at least for the first five years of the plan period.
Local Plan policies should reflect the desirability of re-using brownfield land, and the fact that
brownfield land is often more expensive to develop.
The publication of Viability Testing Local Plans by the Local Housing Delivery Group, May 2012,
offers guidance for local authorities in assessing local plan viability in accordance with the NPPF.
It suggests the need for a distinct Local Plan Viability Assessment to demonstrate that the policies
put forward in a Local Plan are viable and accord with the requirements of the NPPF, and
therefore the plan meets the tests of soundness.
The guidance underlines the importance of assessing the cumulative impact of policies on
development viability and suggests a structured and transparent means of assessing viability. It
recommends an economic viability testing model that can be applied area-wide and over the short
(0 to 5 years), medium (6-10 years) and long (11-15 years) term. It also suggests close
collaboration with the development industry throughout the process.
2.2. Derbyshire Dales Local Plan
Following the withdrawal of the Derbyshire Dales Local Plan in October 2014, the District Council
has been undertaking a refresh of its evidence base to support the preparation of a new Local
Plan that will set out the policies and proposals for the period up to 2033.
Cushman & Wakefield has carried out an assessment of the Draft Local Plan policies to determine
those that have the potential to impinge on development viability and therefore necessitate testing
through this study.
Table 2.1 lists the policies by reference number, together with the categorisation of whether or
not they could affect development viability, a description of the impact and details of the
assessment required to determine their viability. Where policies explicitly state a requirement for
a specific standard it is judged to have the potential to affect development viability.

Derbyshire Dales District Council
6
Table 2.1 Derbyshire Dales Local Plan, Pre Submission Draft Plan - August 2016
Impact on
development
viability?
Strategic Policies
S1 Presumption in Favour of Sustainable
Development
Potential
S2 Sustainable Development Principles Potential
S3 Settlement Hierarchy No
S4 Development Within Defined Settlement
Boundaries
Potential
S5 Development in the Countryside No
S6 Strategic Housing Development No
S7 Strategic Employment Development No
S8 Matlock/Wirksworth/Darley Dale Development
Area Strategy
No
S9 Ashbourne Development Strategy No
S10 Rural Parishes Development Strategy No
S11 Local Infrastructure Provision and Developer
Contributions
Potential
The District Council will support high
quaity sustainable development which
protects, conserves and enhances the
built and natural environment of the Plan
Area. All developments should seek to
ensure that they make a positive
contribution towards the acheivement of
sustainable development.
The District Council will accommodate at
least 6015 new dwellings over the period
2013-2033.
The release of land for development will
be informed by capacity in the existing
local infrastructure to meet the additonal
requirements arising from new
development. Suitable arrangements will
be put in place to improve infrastructure,
services and community facilities, where
necessary. To be tested through the site
specific analysis.
Comments
The Council will take a positive approach
that reflects the presumption in favour of
sustanable development contaned within
the NPPF.
Proposals for new development will be
directed towards the most sustainable
locations in accordance with the
District's settlement hierarchy.
This will need to be assessed on a case
by case basis. It is not possible to
prescribe specific costs. The viability
test includes provision for abnormal site
costs which might typically be expected
to account for such factors. In addition,
the viability assessments include a
sensitivity around build costs.
Policy

Derbyshire Dales District Council
7
Impact on
development
viability?
Protecting
Derbyshire Dales
CharacterPD1 Design & Place Making Potential
PD2 Protecting the Historic Environment Potential
PD3 Biodiversity & the Natural Environment Potential
PD4 Green Infrastructure Potential
PD5 Landscape Character Potential
The Council will require the layout and
design of new development to create well
designed, socially integrated, high quality
sustainable places, where people enjoy
living and working. All developments
should respond positively to both the
environment and the challenge of climate
change, whilst also contributing to local
distinctiveness and sense of place. It is
not possible to prescribe specific costs.
This will need to be assessed on a case
by case basis. It is not possible to
prescribe specific costs. The viability
test includes provision for abnormal site
costs which might typically be expected
to account for such factors. In addition,
the viability assessments include a
sensitivity around build costs. Site
Specific Appraisals include indicative
provision for meeting Secured By Design
Standards.
CommentsPolicy
The District Council will seek to conserve
manage and where feasible enhamce
the historic environment of the Plan Area.
It is not possible to prescribe specific
costs. This will need to be assessed on
a case by case basis. It is not possible
to prescribe specific costs. The viability
test includes provision for abnormal site
costs which might typically be expected
to account for such factors. In addition,
the viability assessments include a
sensitivity around build costs.
The District Council will seek to protect
manage and where possible enhance the
biodiversity and geological resources of
the Plan Area and its surroundings by
ensuring that development proposals will
not result in harm to biodiversity or
geodiversity interests and by taking full
account the hierarchy of protected sites.
It is not possible to prescribe specific
costs. The viability test includes
allowance for abnormal costs as well as
£1,000 per unit s106 contribution.
Will depend on a case by case basis and
not possible to prescribe specific costs -
viability test to include a 10% uplift in
build costs as sensitivity.
Will depend on a case by case basis and
not possible to prescribe specific costs -
viability test to include a 10% uplift in
build costs as sensitivity.

Derbyshire Dales District Council
8
Impact on
development
viability?
Protecting
Derbyshire Dales
CharacterPD6 Trees, Hedgerows and Woodlands Potential
PD7 Climate Change Potential
PD8 Flood Risk Management & Water Quality Potential
PD9 Pollution Control and Unstable Land Potential
PD10 Matlock to Darley Dale A6 Corridor No
CommentsPolicy
Development should seek, where
approporiate, to enhamce and expand
the District's tree and woodland
resource. The viability test includes a
10% uplift in build costs as sensitivity as
well as £1,000 per unit s106 contribution.
Viability test to include a sensitivity for 5%
uplift in build costs to account for
achieving Zero Carbon Homes. /
BREEAM cost uplift on commercial
developments
Site specific viability test include
indicative costs for SUDS or on site
attenuation tanks.
The District Council will ensure that sites
are suitable for their proposed use taking
account of ground conditions and land
instability, including from natural hazards
such as radon gas, former activities
such as mining, or pollution arising from
previouls uses. Planning permission will
only be granted for development on land
potentially affected by land contamination
provided effective and sustainable
measures are taken to assess , treat,
contain or control the contamination. The
viability test includes allowance for
abnormal costs as well as £1,000 per
unit s106 contribution.
Impact on
development
viability?
Healthy & Sustainable
Communities
HC 1 Location of Housing Development No
HC 2 Housing Land Allocations Potential
HC 3 Self-Build Housing No
HC 4 Affordable Housing Yes
CommentsPolicy
Sites have been allocated in accordance
with SHLAA which considered
deliverability. The viability report does not
assess individual site allocation viability.
Viability test to include provision for 30%
AH provision on sites of more than 10
dwellings to accord with NPPG.

Derbyshire Dales District Council
9
Impact on
development
viability?
HC 5 Meeting Local Housing Need (Exception Sites) Yes
HC 6 Gypsy and Traveller Provision No
HC 7 Replacement Dwellings No
HC 8 Conversion and Re-Use of Buildings for
Residential Accommodation.
No
HC 9 Residential Sub-Division of Dwellings No
HC 10 Extensions to Dwellings No
HC 11 Housing Mix and Type Yes
HC 12 Elderly Needs Accommodation No
HC 13 Agricultural and Rural Workers Dwellings No
HC 14 Open Space, Sports and Recreation Facilities Yes
HC 15 Community Facilities and Services Potential
HC 16 Notified Sites No
HC 17 Promoting Sport, Leisure and Recreation Potential
HC 18 Provision of Public Transport Facilities No
HC 19 Accessibility and Transport Potential
HC 20 Managing Travel Demand Yes
HC 21 Car Parking Standards No
Indicative sum towards the provision of
enhanced pedestrian crossing facilities
and cycleways are included within the
Site Specific Viability Appraisals,
Provision for public transport, cycle and
pedestiran routes to town centres
included in s106 costs where applicable.
Viability test to include a sum of £1,000
per unit to include all site specific S106
requirements
Viability test to include a sum of £1,000
per unit to include all site specific S106
requirements
Cost impacts of meeting standards to be
applied.
Viability test to include a sum of £1,000
per unit to include all site specific S106
requirements
No viability impact
CommentsPolicy
Viability test to include provision for 30%
AH provision on sites of more than 10
dwellings to accord with NPPG.
Viability test to include specified housing
mix. Costs allowed for in build and
contingencies for designing 10% of
homes for wheel chair accessibility

Derbyshire Dales District Council
10
This ‘screening exercise’ has identified there are a number of policies which impose specific
standards that require viability testing. These standards have been tested in the area wide
viability model and site specific viability appraisals as outlined in the following sections of this
report.
The remaining policies are those which indicate that standards will be required in certain
circumstances but not universally; and it is not possible to pinpoint specific cost impacts in an
area wide analysis of this type. The cost impact of these policies, which are referenced in the
table above as having the ‘potential’ to affect viability, is considered to be allowed for within the
general appraisal assumptions used in the viability assessments detailed later in this report.
Impact on
development
viability?
Strengthening the
Economy
EC1 New Employment Development No
EC2 Employment Land Allocations No
EC3 Existing Employment Land and Premises No
EC4 Retention of Key Employment Sites No
EC5 Regenerating an Industrial Legacy No
EC6 Town and Local Centres No
EC7 Primary Shopping Frontages No
EC8 Promoting Peak District Tourism and Culture No
EC9 Holiday Chalets, Caravan and Campsite
Developments
No
EC10 Farm Enterprises and Diversification No
EC11 Protecting and Extending the Cycle Network Potential Viability test to include a sum of £1,000
per unit to include all site specific S106
requirements
CommentsPolicy
Impact on
development
viability?
Strategic Allocations
DS1 Land at Ashbourne Airfield (Phase 1), Ashbourne Yes
DS2 Land to the Rear of Former RBS premises,
Darley Dale
Yes
DS3 Land at Stancliffe Quarry, Darley Dale Yes
DS4 Land off Gritstone Road/Pinewood Road, Matlock Yes
DS5 Land at Halldale Quarry/Matlock Spa Road,
Matlock
Yes
DS6 Land off Middleton Road/Cromford Road,
Wirksworth
Yes
DS7 Land at Middle Peak Quarry, Wirksworth Yes
DS8 Land at Ashbourne Airfield (Phase 2), Ashbourne Yes
DS9 Land at Cawdor Quarry, Matlock Yes
Site specific testing of policies
Site specific testing of policies
Site specific testing of policies
Site specific testing of policies
Limited information is available in terms
of site costs as such Site Spefic Viability
Appraisal has not been undertaken at this
stage.
Site specific testing of policies
Site specific testing of policies
Site specific testing of policies
Site specific testing of policies
CommentsPolicy

Derbyshire Dales District Council
11
2.3. Derbyshire Dales Strategic Housing Land Availability Assessment
Details of the sites identified through the SHLAA process were provided by the Council and used
as the basis for selecting hypothetical development sites for the viability assessment. This
enabled us to effectively determine the viability for the emerging local plan policies on residential
development and the level of CIL that could be supported. It also enabled the results to be used
to reinforce the tests of viability and delivery in accordance with the NPPF

Derbyshire Dales District Council
12
3. Community Infrastructure Levy Context
3.1 Background
Community Infrastructure Levy (CIL) is a discretionary tariff introduced by the 2008 Planning Act
which local authorities in England and Wales can charge on each net additional sq. m of new floor
space (above a minimum scheme of 100 sq. m gross internal area). CIL is the mechanism for
securing funding for local infrastructure projects. It is discretionary for local authorities however
from April 2015 it will replace that part of the existing S106 agreements that are used for pooled
developer contributions.
CIL was brought into effect by the 2010 CIL regulations which have been subsequently updated
in 2011, 2012, 2013 and finally in 2014. The updates have been the response to criticism that
the levy is too inflexible and have generally sought to make it more practical to implement. The
following paragraphs summarise the key elements of CIL.
3.2 Liability for CIL
Landowners are ultimately liable to pay the Levy although anyone can take responsibility for
paying the levy such as a developer or planning applicant. ‘Charging authorities’ are district and
metropolitan district councils who are responsible for determining the charging levels and
collecting the levy.
Liability for payment is generally triggered by the grant of planning permission (although some
forms of development not requiring planning permission such as Permitted Development or Local
Development Orders are also required to pay the levy).
Payment is due at the point of commencement of development although charging authorities are
able to establish policies for payment by instalments and also where planning applications are
phased each phase can be treated as a separate chargeable development.
3.3 Rate setting
The proposed CIL charging rates must be set out in a Charging Schedule and expressed as
pounds per sq. m, applied to the gross internal floor space of the net additional development liable
for the levy.
Charging Authorities have autonomy to set their own charging rates however they are required to
do so with regard to viability. The regulations state that they should set rates at a level which do
not threaten the ability to develop viably the sites and scale of development identified in their
Local Plan and should strike an appropriate ‘balance’ between the desirability of funding
infrastructure from the levy and the potential impact on viability.
CIL should be set based on a ‘Relevant Plan’ and with regard to the infrastructure requirements
of the growth proposed within that Plan. Further, Charging Authorities are required to

Derbyshire Dales District Council
13
demonstrate that there is a funding gap (between the total anticipated costs of infrastructure and
funding sources available) that necessitates CIL.
Differential rates may be set in relation to:
Geographical zones within the charging authority’s boundaries
Types of development; and / or
Scales of development.
However, any such differentials must be justified according to viability evidence (and not, for
instance, based on assisting planning policy objectives).
3.4 The process for rate setting
The process for adopting a CIL Charging Schedule is as follows:
the charging authority prepares its evidence base in order to determine its draft levy rates
and collaborates with neighbouring/overlapping authorities (and other stakeholders)
the charging authority prepares a preliminary draft charging schedule and publishes this for
consultation
consultation process takes place
the charging authority prepares and publishes a draft charging schedule
period of further representations based on the published draft
an independent person (the “examiner”) examines the charging schedule in public
the examiner’s recommendations are published
the charging authority considers the examiner’s recommendations
the charging authority approves the charging schedule
3.5 Collecting the levy
The charging authority calculates the CIL payment that is due and is responsible for ensuring that
payment is made. The process is as follows:

Derbyshire Dales District Council
14
Planning applicants are required to complete ‘Additional CIL Information Form’ with their
application documents
Where development is permitted other than through grant of planning permission, the
Charging Authority issues a ‘Notice of Chargeable Development’
Applicant submits ‘Assumption of Liability Form’ confirming identify of land or developer
assuming liability for payment
Collecting Authority submits a ‘Liability Notice’ to the applicant which sets out the charge
due and payment procedure
Applicant submits a ‘Commencement Notice’ confirming when it is expected development
will commence
Collecting Authority then issues a ‘Demand Notice’ setting out the payment due dates
Collecting Authority must issue receipt to acknowledge payments
The CIL charges will become due for payment from the point at which the chargeable
development commences.
A Charging Authority may allow payment instalments but to do so must produce and publish a
payment instalments policy. Where planning permissions are phased, each phase can be treated
as a separate chargeable development and therefore payment timescales be reflected by the
commencement of each phase (as well as instalments within each phase).
3.6 Spending the levy
CIL can be used to fund a wide range of infrastructure including transport, schools, flood
defences, health facilities, play areas, parks, recreation and other community facilities. It should
be used on new infrastructure and not to remedy pre-existing deficiencies unless those
deficiencies will be made more severe by the development.
Charging Authorities are required to allocate at least 15% of the levy to spend on priorities agreed
with the local community in areas where the development is taking place. This percentage
increases to 25% in instances where communities have produced a Neighbourhood Plan.
Charging Authorities may also pass money to bodies outside their area to deliver infrastructure
that will benefit the development of the area. For Derbyshire Dales, this could enable an
arrangement with Sheffield City Region authorities and potentially D2N2 authorities (Derby,
Derbyshire, Nottingham and Nottinghamshire) to pool a portion of levy receipts to pay for strategic
cross border infrastructure.

Derbyshire Dales District Council
15
3.7 CIL and other planning obligations
CIL replaces that part of S106 agreements that have historically been used for pooling
contributions from several developments (e.g. school places). However S106 remains in place
for non-pooled contributions that are considered necessary to make development acceptable in
planning terms. In addition, Section 278 agreements will remain in place and will allow local
authorities to continue to pool contributions for highway projects.
Charging Authorities must avoid ‘double dipping’ where multiple contributions are secured from a
single development for the same infrastructure item through both CIL and S106/278. They are
required to publish a Regulation 123 list to accompany the Charging Schedule making clear what
items will be funded by CIL to ensure that no such duplication takes place.
3.8 Relief
As stated above social housing is exempt from paying the levy including charitable developments.
In addition, the Government Regulations allow for exceptional circumstances under which a
development that is liable to pay CIL could be exempt from paying the charge. The exceptional
circumstances are:
A section 106 agreement must exist on the planning permission permitting the chargeable
development and
The charging authority must consider that paying the full levy would have an unacceptable
impact on the development’s economic viability and
The relief must not constitute a notifiable state aid
The third requirement is the most restricting of the three and in practice is likely to significantly
limit the quantity of cases in which exceptional circumstances can be deployed. The local
authority is also required to publicise the fact that it is proposing to offer exceptional circumstances
relief.

Derbyshire Dales District Council
16
4. Viability Testing Methodology
4.1. Guidance on Viability Testing of CIL
4.1.1 National Planning Policy Framework
The NPPF makes it clear that viability considerations should be at the heart of plan making:
“To ensure viability, the costs of any requirements likely to be applied to development, such as
requirements for affordable housing, standards, infrastructure contributions or other
requirements should, when taking account of the normal cost of development and mitigation,
provide competitive returns to a willing land owner and willing developer to enable the
development to be deliverable.” (Para 173 NPPF)
In relation to CIL it states:
“Community Infrastructure Levy charges should be worked up and tested alongside the Local
Plan. The Community Infrastructure Levy should support and incentivise new development,
particularly by placing control over a meaningful proportion of the funds raised with the
neighbourhoods where development takes place.” (Para 175 NPPF).
4.1.2 National Planning Practice Guidance requirements for CIL viability evidence
To underpin the charging levels and demonstrate that the right ‘balance’ has been struck, NPPG
recommends the following principles for viability evidence in support of CIL:
Area based approach involving a broad test of viability across their area
Must use ‘appropriate available evidence’
No specific requirement to use any particular valuation model or methodology
Draw on existing evidence where available including values of land and property prices
Directly sample an appropriate range of sites across its area, focusing on strategic sites on
which the Local Plan relies
The rates proposed should be consistent with the viability evidence but need not exactly
mirror the evidence
Rates should not be set to the limit of viability and allow a viability buffer
Full account of development costs should be included in the viability evidence

Derbyshire Dales District Council
17
National Guidance is clear that assessing the viability of local plans does not require the
individual testing of every development site. Site typologies may be used to determine area wide
viability at a policy level. Viability assessments should therefore reflect the range of different
development typologies (both residential and commercial) which are likely to come forward.
At the heart of assessing viability is land or site value. There are various approaches to
determining land value which will be outlined in more detail below; however NPPF guidance
states that in all cases, land value should reflect emerging policy requirements and planning
obligations, provide a competitive return to willing developers and landowners, be informed by
comparable, market based evidence.
Paragraph 015 reference ID 10-015-220140306 of the NPPF states that viability should consider
“competitive returns to a willing landowner and willing developer to enable development to be
deliverable”. A competitive return is defined as “the price at which a reasonable landowner would
be willing to sell their land for development.” Those options may include the current use value
of the land or its value for a realistic alternative use that is in line with the local planning policy.
4.1.3 RICS Financial Viability in Planning 2012
The RICS Practice guidance, Financial Viability in Planning (2012), is the viability methodology
for chartered surveyors practicing in this area. This document provides the following definition:
“An objective financial viability test is the ability of a development project to meet its costs
including the costs of planning obligations, while ensuring an appropriate site value for the land
owner and market risk adjusted return to the developer in delivering the project” (para 2.1)
This is illustrated in Figure 4.1 which compares two developments. Development 1 demonstrates
a viable development whereby the land value, development costs, planning obligations and
developers return are equal to the value of development. Development 2 has increased
development costs which put downward pressure on the land value capable of being achieved
and renders the development unviable as the developer’s return and planning obligations remain
constant. That all development costs (including land, profit and planning gain) must not exceed
the value of development is the guiding principle of all viability assessments and has been
applied to our analysis of CIL viability in Derbyshire Dales.

Derbyshire Dales District Council
18
Figure 4.1: Comparative development viability
Source: RICS Financial Viability in Planning Guidance Note (1st Edition, 2012)
4.2. Cushman & Wakefield viability testing methodology
Cushman & Wakefield has developed a viability model which involves the analysis of a selection
of hypothetical development schemes which reflect the wide range of circumstances in which
development is anticipated to come forward across the Derbyshire Dales district.
The assessment involves a residual appraisal methodology in accordance with the above
guidance. Cushman & Wakefield has developed an Excel spreadsheet based economic viability
model that allows a number of development sites to be assessed and sensitivity testing of key
variables.
This approach involves the following key steps:
Determination of residential value areas, development schemes and viability assumptions.
A residual appraisal is then carried out subtracting all anticipated development costs from
the scheme’s Gross/Net Development Value to arrive at a residual site value for each
development scheme. The appraisal includes provision for affordable housing, planning
standards and S106 obligations as inputs.
The residual site value for each development scheme is then benchmarked against a site
value threshold to determine the ‘headroom’ available for CIL/other planning requirements.

Derbyshire Dales District Council
19
Figure 4.2: Viability testing methodology
4.3. Site specific viability testing
Within this report we have supplemented the area wide viability modelling of hypothetical
schemes with the testing of strategic real world sites. The sites have been sampled from the
Draft Local Plan allocations. In accordance with the National Planning Policy Guidance, the sites
that have been selected are large / strategic sites. The viability of these sites has been tested
using Argus Developer software which is an industry standard software model for appraisal and
valuation of single sites. Rather than indicate the headroom for CIL, these appraisals have
incorporated the level of CIL indicated by the area wide assessments alongside the affordable
housing and other standards required by the Local Plan.
4.4. Ensuring a suitable balance – the viability buffer
As highlighted above, Government guidance underlines the importance of pragmatism and that
CIL rates should be reasonable. At Paragraph 019 Reference ID: 25-019-20140612 of NPPG it
specifies that “It would be appropriate to ensure that a ‘buffer’ or margin is included, so that the
levy rate is able to support development when economic circumstances adjust”.
Case Law indicates that a 25-30% discount from the CIL headroom is a suitable viability buffer.
However, each local area may justify its own approach based on the evidence.
Gross Development Value
Less all development costs including profit
and planning requirements
Equals residual site value (RSV)
Benchmark site value
Value areas
Schemes
Appraisal assumptions
Inputs Valuation Viability test
= Viability headroom
Less

Derbyshire Dales District Council
20
Therefore, we have applied an appropriate viability buffer to reflect these recommendations
which puts in place safeguards to ensure that Derbyshire Dales’ CIL strategy is “viability proofed”
and not realistically likely to put development delivery at risk.
4.5. Developer consultation
Cushman & Wakefield consulted on the assumptions used to inform the area wide viability testing
in June 2015 through a survey of developers, house-builders, registered housing providers, retail
operators and property and planning agents. The consultation was used to test and refine the
approach and assumptions behind the viability modelling.
Those who engaged in the consultation are listed below and a summary of their responses to
our questionnaire survey is available at Appendix 2.
Emery Planning
William Davies
The Guinness Partnership
NCHA
Acclaim Housing Group Limited
Fisher German LLP
Radleigh Group Limited
Westleigh Partnerships Limited
A full list of those invited to participate in the consultation is provided at Appendix 3.

Derbyshire Dales District Council
21
5. Viability Assumptions
This section outlines the assumptions that have been used in the viability analysis. The
assumptions take into consideration the views of landowners and developers who engaged in
the stakeholder consultation in May 2015.
5.1. Residential development
5.1.1 Value areas
Three value areas have been selected as geographical zones for viability testing housing
development as shown in Figure 5.1:
Value Area 1 £300,000 to £407,000 average house price
Value Area 2 £235,000 to £299,000 average house price
Value Area 3 £181,000 to £234,99 average house price
These zones are based on the average achieved house prices for all postcode sectors in
Derbyshire Dales as recorded by HM Land Registry over the 12 month period to December 2015.

Derbyshire Dales District Council
22
Figure 5.1 Derbyshire Dales achieved residential land values. Source: HM Land Registry

Derbyshire Dales District Council
23
5.1.2 Residential development scheme selection
Eight residential schemes have been tested on the range of site sizes, mix and densities set out
in Table 5.1. The schemes are based on an analysis of site sizes and typologies which are most
likely to come forward for development and SHLAA data. The housing mix is based on that
prescribed by Local Plan Policy HC11, which puts the emphasis on small units of 2 and 3 bed
houses. The percentages are illustrated in the table below although it is noted that the actual
appraisals involve some minor differences to the percentages as a result of rounding of units up
or down according to the mix requirements.
Two densities have been selected, the first at 30 DPH. This dwelling density is typically the level
that has been observed in Derbyshire Dales. However, because the dwelling mix prescribed by
Policy HC11 focuses units at the smaller end of the spectrum, this results in a low site cover of
approximately 10,000 sq ft per acre. Based on our experience, house builders generally seek
to deliver a minimum of 14,000 sq ft per acre. Therefore, reflecting the small size of the units, a
larger number of units could be accommodated on any given development parcel. An alternative
higher dwelling density has therefore also been tested which gives a site cover of approximately
14,000 sq ft per acre, more line with market requirements.
Each of the eight residential schemes have been tested across the three value areas illustrated
above (thus, effectively 24 notional residential schemes have been assessed).
Table 5.1a Residential development site selection (30 DPH)
Net developable
area (Ha)
Development density (DPH)
No of
units
Housing mix %
1 bed house
2 bed house
3 bed house
4 bed house
5 bed house
Scheme 1 0.25 30 8 5% 40% 50% 2.5% 2.5%
Scheme 2 0.50 30 15 5% 40% 50% 2.5% 2.5%
Scheme 3 0.70 30 21 5% 40% 50% 2.5% 2.5%
Scheme 4 1.00 30 30 5% 40% 50% 2.5% 2.5%
Scheme 5 1.50 30 45 5% 40% 50% 2.5% 2.5%
Scheme 6 3.00 30 90 5% 40% 50% 2.5% 2.5%
Scheme 7 5.00 30 150 5% 40% 50% 2.5% 2.5%
Scheme 8 10.00 30 300 5% 40% 50% 2.5% 2.5%

Derbyshire Dales District Council
24
Table 5.1b Residential development site selection (40 DPH)
Net developable
area (Ha)
Development density (DPH)
No of
units
Housing mix %
1 bed house
2 bed house
3 bed house
4 bed house
5 bed house
Scheme 1 0.25 40 10 5% 40% 50% 2.5% 2.5%
Scheme 2 0.50 40 20 5% 40% 50% 2.5% 2.5%
Scheme 3 0.70 40 28 5% 40% 50% 2.5% 2.5%
Scheme 4 1.00 40 40 5% 40% 50% 2.5% 2.5%
Scheme 5 1.50 40 60 5% 40% 50% 2.5% 2.5%
Scheme 6 3.00 40 120 5% 40% 50% 2.5% 2.5%
Scheme 7 5.00 40 200 5% 40% 50% 2.5% 2.5%
Scheme 8 10.00 40 400 5% 40% 50% 2.5% 2.5%
NB affordable units are subject to a different mix in accordance with Policy HC11 as follows:
40% 1 bed
35% 2 bed
20% 3 bed
5% 4 and 5 bed.
5.1.3 Unit sizes
The residential unit sizes listed in Table 5.2 are based on Cushman & Wakefield’s research of local
schemes appended with this evidence. The areas quoted are net sales areas which have been
grossed up for cost purposes.
Table 5.2 Residential unit sizes (net sales areas)
House type Size (sq m) Size (Sq ft)
1 bed house 56 600
2 bed house 65 704
3 bed house 95 1021
4 bed house 131 1413
5 bed house 174 1878
5.1.4 Sales values
Capital revenues are used in the viability model on the basis of £ per sq m. The sales revenue
assumptions are based on market evidence gathered from Cushman & Wakefield’s research of
new build developments in Derbyshire Dales.
The market evidence set out in Appendix 1, indicates a tone of new build evidence in the range
of £2,368 per sq m to £2,692 per sq m (£220 to £260 per sq ft). The new build evidence is
largely for the low and mid value areas with limited recent transactional evidence available for

Derbyshire Dales District Council
25
the high value areas, therefore we have had to make something of a judgement in respect of the
likely levels achievable based on a combination of average house prices derived from the Land
Registry (as detailed above under paragraph 5.1.1) and consultation with local developers and
agents. There are some limited examples of sales values below this level however these are
generally more dated and are outweighed by the more up to date evidence.
The net capital sales value assumptions are therefore as follows:
Table 5.3 Residential sales values
Current net sales values
assumptions
£ per sq m £ per sq ft
High Value (Value Area 1) 2,798 260
Mid Value (Value Area 2) 2,583 240
Lower Value (Value Area 3) 2,368 220
Sensitivity testing of both a 10% reduction and 10% increase has been undertaken to explore the effect of
variation to this key assumption.
5.1.5 Build costs
The development appraisals include the build costs for flats and houses as shown in Table 5.4.
BCIS build costs have been used (rebased for Derbyshire) with an uplift of 10% for external
works. The cost rate which this generates is above that which Cushman & Wakefield has observed
as typical for volume house builders at regional level however it caters for all developers including
those smaller builders who typically experience higher costs than national house builders.
Table 5.4 Residential build costs
Build cost (£) Plus 10% uplift for external works (£)
£ per sq m £ per sq ft £ per sq m £ per sq ft
Houses 1,020 95 1,122 104
Flats 1,203 112 1,323 123
It should be noted that in relation to the strategic sites a separate lower build cost of £1,022 per
sq m (£95 per sq ft) has been applied (inclusive of external works) on advice from Cushman &
Wakefield’s in house quantity surveyor as a ‘volume house builder build cost’ which would apply
to such larger sites.

Derbyshire Dales District Council
26
5.1.6 Other costs / appraisal assumptions
Table 5.5 identifies the other development assumptions that have been applied in the appraisal
model. Blended rates of developer profit have been applied reflecting a level of 20% on GDV
for market units and 6% for affordable. The lower rate on the affordable housing reflects the
different risk profile for affordable units which are transferred on a pre-sale basis and therefore
effectively justifying a contractor’s profit level as opposed to a developer’s profit. The blended
rate therefore varies according to the affordable housing scenario that is applied.
Table 5.5 Residential development costs
Other development costs
Sensitivity for abnormals n/a – site abnormals allowed for in site value benchmark
Professional fees (inc planning) 8% on construction costs
Contingencies 3% on construction costs
Marketing, sales agent and legal fees 3.5% of sales revenue
Purchaser's costs 6.8% on purchase price*
Finance 6.75% on negative balance
Developer's profit
Blended rate (20% of GDV on market units & 6% of GDV on affordable units) 30% affordable housing – 17.37%
* Stamp duty changes brought into effect by the March 2014 budget have affected both the level
and approach to assessing stamp duty. Prior to the budget, the maximum duty on land was 4%
which has now increased to 5%. In the revised viability appraisals, purchaser’s costs have been
increased to 6.8% to allow for the highest rate of stamp duty at 5% (with an additional 1.8% to
allow for legal and agents fees).
5.1.7 Timing assumptions
The following delivery rate assumptions have been assumed. These are based on Cushman &
Wakefield’s research of the market and consultation with agents and developers. Site sizes
yielding 200 units or more are assumed to have at least two delivery outlets and therefore a
higher rate of sale than those of a smaller size which are assumed to have just a single outlet.

Derbyshire Dales District Council
27
Table 5.6 Residential delivery assumptions
Delivery assumptions
Lead in 3 months
Construction / sales Sales staggered six months after construction start
Sales rates 30 units per annum per outlet. All sites assume a single house builder except sites of 10 ha where two house builders are assumed delivering on two outlets at a combined rate of 60 units per annum. On the larger strategic sites tested, separate delivery rates are assumed as detailed in Appendix 5.
Payments for land are assumed at the outset of the development programme. Whilst some of
the larger sites tested (e.g. those over 5 ha and more) could in practice result in a series of
payment instalments which would create finance savings and enhance viability, the model
assumes a single payment for land at the outset. This provides a further area of conservatism
in the analysis.
5.1.8 Policy standards
Table 5.7 details the assumptions have been applied relating to the proposed draft policy
standards in development of the Derbyshire Dales Local Plan as summarised in the screening
exercise in Section 2:
Table 5.7 Policy standards
Policy reference Standards Application in appraisals
HC4 Affordable
Housing
30% of all dwellings in
schemes of more than
10 units with 80% of
which social rent and
20% shared
ownership
Policy applied to all schemes except scheme 1
which falls below the required threshold. Transfer
values 70% for shared ownership and 50% for
Social Rent.
HC11 Housing Mix
and Housing Type
Housing mix
prescription with
emphasis on smaller
sized units.
10% of schemes to be
accessible by wheel
chair access
Housing mix based on policy position as set out in
Tables 5.1a and 5.1b.
Typically the costs for enhancing accessibility of
housing are 0.5% of build cost
(http://www.lifetimehomes.org.uk/pages/costs.html )
The area wide model is based on BCIS build cost
which is above typical house builder costs in the
order of 5 to 10%. It is considered any such costs
could also be absorbed by the abnormal allowance.

Derbyshire Dales District Council
28
HC13 Open Space,
Sports and
Recreational Facilities
Standards for
contribution to a range
of facilities
Cost assessment identifies circa £100 per unit with
potential for higher cost of £500 per unit on large
scale sites (i.e. over 500 units) (See Appendix 0).
These costs are provided for through the S106
allowance in the appraisals.
PD7 Climate change BREEAM
requirements for new
employment
development
10% cost uplift sensitivity
The allowance of £1,000 per unit for Section 106 contributions for each residential development
scheme is based on Cushman & Wakefield’s analysis of Section 106 contributions across
Derbyshire Dales since 2010 and taking into account the draft policies listed above. Where site
specific S106 requirements exceed such an allowance it is reasonable to expect that they would
result in a reduction in the site values thus allowed for within the appraisals.
5.1.9 Residential land values
Guidance on Site Value Benchmarks
The Local Housing Delivery Group: Viability Testing Local Plans advice for planning practitioners
(July 2012), states that viability studies should incorporate a threshold land value based on ‘a
premium over current use values and credible alternative use values’. It also highlights the
limitations of using market values for policy-making viability evidence recognising that historic
market values do not take into account the impact of future policy on land prices.
The RICS guidance note Financial Viability in Planning 2012 defines site value as follows:
“Site Value should equate to the market value subject to the following assumption: that the value
has regard to development plan policies and all other material planning considerations and
disregards that which is contrary to the development plan.”
It also states that when undertaking Local Plan or CIL (area-wide) viability testing, a second
assumption needs to be applied to the above:
“Site Value (as defined above) may need to be further adjusted to reflect the emerging policy /
CIL charging level. The level of the adjustment assumes that site delivery would not be
prejudiced. Where an adjustment is made, the practitioner should set out their professional
opinion underlying the assumptions adopted. These include, as a minimum, comments on the
state of the market and delivery targets as at the date of assessment.”
Whilst there appears to be an inconsistency in the recommendations of the two guidance
documents, both effectively recommend that site value thresholds for area wide viability studies
Derbyshire Dales District Council
29
should be set somewhere between existing use/credible alternative use and market values
assuming planning permission without planning obligations.
Derbyshire Dales Land Value Evidence
Recent transactional evidence is limited in Derbyshire Dales and as a result the evidence is
somewhat anecdotal. A review of Estates Gazette Interactive (EGi) reveals significant
transactional activity in respect of existing/former farms however the actual prices at which such
sites have transacted is not readily available.
The evidence gathered from consultation with local landowners and developers was limited, but
suggested that minimum land values are typically in the order of £200,000 to £250,000 per acre,
but that higher land values are evident up to £500,000 per acre. Evidence produced by the
Valuation Office Agency for Derbyshire Dales District Council in February 2014 indicated a range
of land values from £100,000 to £500,000 per acre.
National research
The Department for Communities and Local Government published a paper on Land value estimates for policy appraisal in February 2015. The paper includes residential land value estimates using a “truncated residual valuation model” for local authority areas in England. The purpose of the paper is to appraise land projects from a social perspective and as such nil affordable housing provision is assumed. A number of assumptions are outlined in the paper including:
100% private housing
No CIL liability is included
Full planning permission is secured
No grants in place and no major allowances are needed for s106/s278
Assumes sites are 1 ha in size, of regular shape and fully serviced, no contamination or abnormals
Net developable area of 80%
Outside London – A density of 35 dwellings per hectare is assumed. Two storey, 2, 3, and 4 bed dwellings with a total floor area of 3,150 sq m
The residential land value identified for the Derbyshire Dales District is £2,100,000 per hectare (£849,823 per acre). Proposed benchmarks
As demonstrated by the above, evidence relating to market values of specific land transactions is limited and to provide a complete picture of relevant up to date site values across the District would necessitate the use of anecdotal evidence that we consider does not provide a reliable guide.

Derbyshire Dales District Council
30
Consultation with developers and land owners indicated that a range of 494,200 - £617,750 per hectare (£200,000 - £250,000 per acre) is commonly accepted as a typical minimum net land price within Derbyshire Dales. However, this figure is a net land price and because the area wide assessments within this study do not incorporate abnormal site development costs, we consider it appropriate to inflate this level to represent the price of a serviced site free from abnormal development costs. To do this, we have utilised the data from the DCLG data on gross land values for the District and applied a formula based on an equitable sharing of the land value between land owner and community benefit. This approach is based on the well-publicised precedent established in ‘The Shinfield’ case (University of Reading versus Wokingham Council 2012). The formula sets the site value threshold at half of the gross land value indicated by the DCLG study (excluding all planning obligations and site abnormals) plus existing use value:
Benchmark site value = (Gross Land Value / 2) + Existing Use Value Where:
Gross Land Value is the land value without any planning obligations or site abnormals. This is based on the DCLG Land Values for Policy Appraisal (February 2015) which indicated a typical gross land value of £2.1m per ha (£849,823 per acre) for Derbyshire Dales
Existing use value is based on agricultural land values reflecting the predominantly greenfield character of development land across the District. The DCLG paper identifies a national average of £21,000 per ha (£8,500 per acre) for agricultural land which is considered to be a reasonable benchmark for Derbyshire Dales
Applying this formula to the data provided in the DCLG study produces a site value threshold of £1,071,000 per ha (£433,000 per acre). This level has been used in the area wide assessments and it should be noted that it represents the price for a serviced site free from abnormals. Therefore, where sites are expected to encounter significant abnormal development costs, these costs would be reflected in a lower land price that any rational developer would be willing to pay for the land. Comparing this figure against the minimum net site values of £494,200 per ha (£200,000 per acre) identified through consultation with developers indicates that the £1,071,000 per ha benchmark effectively provides an allowance for abnormal site works in the order of £577,000 per ha / £233,000 per acre (the difference between the two figures). In order to reflect the small variations in values in the three value zones the land value benchmark has been referenced to the mid value zone with a 10% increase applied for the high value zone and a 10% decrease for the low value zone. Therefore, the benchmarks used in the area wide viability analysis are as follows:
Value Area 1 – High £1,178,100 per ha (£477,000 per acre)
Value Area 2 – Mid £1,070,000 per ha (£433,000 per acre)
Value Area 3 – Low £963,900 per ha (£390,000 per acre)
In relation to the testing of strategic sites in Section 8 of this report, individual site abnormal costs have been assessed and included within the appraisals. This effectively means that a developer

Derbyshire Dales District Council
31
is meeting these costs and as the land is being sold prior to servicing, a lower land price benchmark is applicable. In this case the base net land value indicated in our consultation with land owners and developers of £494,200 - £617,750 per hectare (£200,000 - £250,000 per acre) has been referenced.
5.2. Retail Development Assumptions
5.3.1 Retail scheme selection
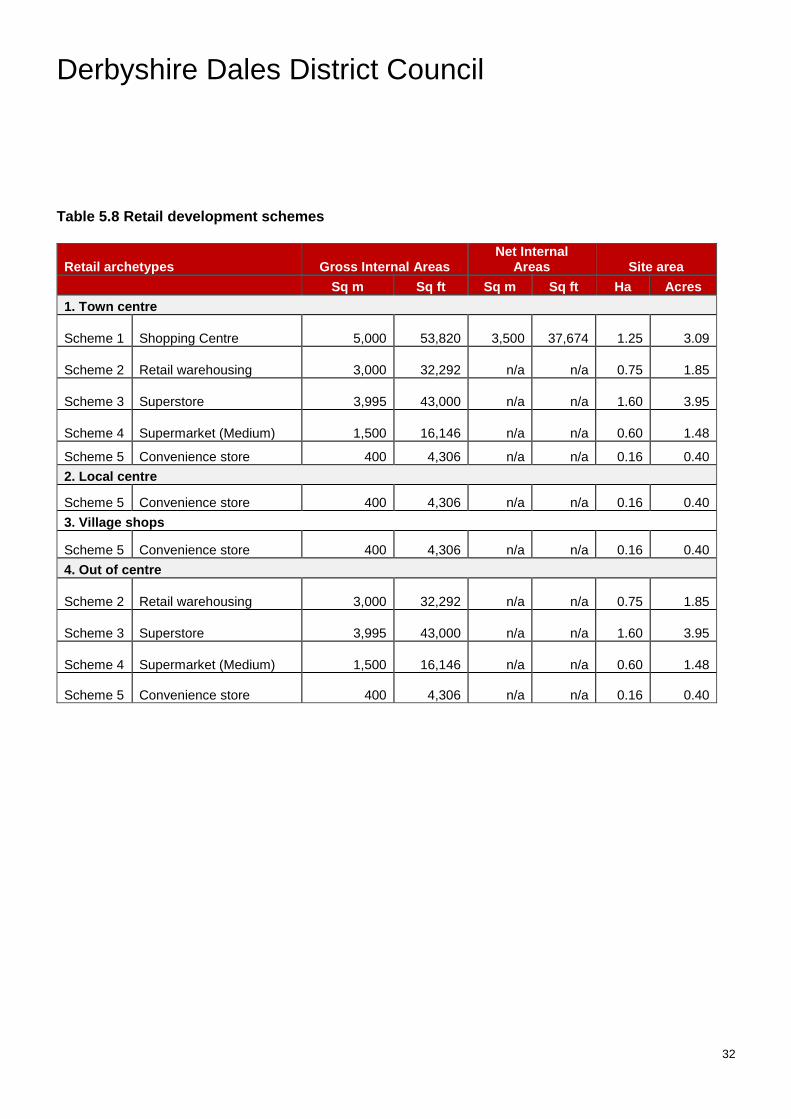
Five hypothetical schemes have been selected for retail viability testing. Table 5.8 presents the
details of the schemes, floor area and site coverage.
These schemes have been tested in the following locations:
Town Centre
Local Centres
Villages
Out of Centre
Variations to the appraisal assumptions have been applied based on market research of each
location.
In considering the floor area, the following definitions are applied: Gross Floorspace is defined as “The area of a building measured to the internal face of the perimeter walls at each floor level1”. Net Floorspace is defined as “The internal floor area of the shop unit used for selling and displaying goods and services. It comprises the floor area to which customers have access, counter space, checkout space, window and other display space, fitting rooms and space immediately behind counters. Lobbies, staircases, cloakrooms and other amenity rooms are excluded. It is measured from the internal faces of walls and partition2.
1 Royal Institute of Chartered Surveyors, Code of Measuring Practice.
2 The Unit for Retail Planning Information Ltd Information Brief 85/7. Note, this is different from net sales floorspace
Derbyshire Dales District Council
32
Table 5.8 Retail development schemes
Retail archetypes Gross Internal Areas Net Internal
Areas Site area
Sq m Sq ft Sq m Sq ft Ha Acres
1. Town centre
Scheme 1 Shopping Centre 5,000
53,820
3,500
37,674 1.25 3.09
Scheme 2 Retail warehousing 3,000
32,292 n/a n/a 0.75 1.85
Scheme 3 Superstore 3,995
43,000 n/a n/a 1.60 3.95
Scheme 4 Supermarket (Medium) 1,500
16,146 n/a n/a 0.60 1.48
Scheme 5 Convenience store 400 4,306 n/a n/a 0.16 0.40
2. Local centre
Scheme 5 Convenience store 400 4,306 n/a n/a 0.16 0.40
3. Village shops
Scheme 5 Convenience store 400 4,306 n/a n/a 0.16 0.40
4. Out of centre
Scheme 2 Retail warehousing 3,000
32,292 n/a n/a 0.75 1.85
Scheme 3 Superstore 3,995
43,000 n/a n/a 1.60 3.95
Scheme 4 Supermarket (Medium) 1,500
16,146 n/a n/a 0.60 1.48
Scheme 5 Convenience store 400 4,306 n/a n/a 0.16 0.40

Derbyshire Dales District Council
33
5.3.2 Retail sales values
The following table details the base values which have been used in the development appraisals
based on market research of comparable schemes locally and regionally and consultation with
retail agents:
Table 5.9 Retail rental values
Retail archetypes Rental value (£)
Sq m Sq ft Yield Rent free (months)
1. Town centre
Scheme 1 Shopping Centre 130 12.00 8.0 18
Scheme 2 Retail warehousing 135 12.50 7.5 18
Scheme 3 Superstore 161 15.00 5.5 6
Scheme 4 Supermarket (Medium) 140 13.00 5.5 6
Scheme 5 Convenience store 175 12.50 5.5 6
2. Local centre
Scheme 5 Convenience store 118 11.00 5.5 6
3. Village shops
Scheme 5 Convenience store 108 10.00 5.5 6
4. Out of centre
Scheme 2 Retail warehousing (bulky goods) 135 12.50 7.5 18
Scheme 3 Superstore 161 15.00 5.5 6
Scheme 4 Supermarket (Medium) 145 13.50 5.5 6
Scheme 5 Convenience store 135 12.50 5.5 6
5.3.3 Retail build costs
Table 5.10 outlines the build costs which have been used which are sourced from BCIS rebased
for Derbyshire. An uplift of 15% has been allowed for external works.
Table 5.10 Retail build costs
Build cost (£) Build cost inc. 15% uplift
for external works
Sq m Sq ft Sq m Sq ft
Scheme 1 Shopping centre 1,089 101 1252 116
Scheme 2 Retail warehousing 592 55 681 63
Scheme 3 Superstore 966 90 1111 103
Scheme 4 Supermarket (Medium) 1,539 143 1770 164
Scheme 5 Convenience store 1,203 112 1383 129

Derbyshire Dales District Council
34
5.3.4 Development cost and phasing assumptions
The following development cost and phasing assumptions have been used in our appraisals:
Table 5.11 Retail development costs
Other development costs
Sensitivity for abnormals (% uplift in build costs) 10%
Site specific S106 costs £50 per sq m
Professional fees as % of construction costs 10%
Contingencies on construction costs 5%
Letting costs (% of rental value) 10%
Letting legal costs (% of rental value) 5%
Investment sale (% of Net Development Value) 1%
Investment sale legal costs (% of NDV) 0.25%
Purchaser's costs (% on purchase price) 6.8%*
Finance on negative balance 6.75%
Developer profit (% on cost) 20%
*This represents the maximum stamp duty brought into effect by the March 2016 budget. As a fixed percentage in the appraisal it represents the maximum possible stamp duty that would apply, hence providing an in built viability buffer. The 6.8% includes agent and legal fees. Table 5.12 Retail phasing assumptions
Phasing assumptions
Lead in 6 months
Construction period 12 months
Construction period (shopping centre) 18 months
Sale On practical completion
5.3.5 Retail land values
Land values for retail developments have been changing as a result of the retrenchment of the
‘big four’ acquisition programme.
In recent years land values for large food stores ranged from £1million to £3million per acre,
although prices were driven according to the level of operator appetite and the level of
competition between operators.
Although there is still demand for new stores, there are a lower volume of requirements which
means there is less competition bidding up prices and they have generally been at the smaller
end of the spectrum.

Derbyshire Dales District Council
35
A land value benchmark of £1,235,500 per ha / £500,000 per acre is adopted for retail
development schemes.
5.3. Office development assumptions
5.4.1 Scheme selection
Two hypothetical schemes have been selected for viability testing of CIL. Table 5.13 details the
schemes, floor area and site coverage used in the appraisals.
Table 5.13 Office development schemes
Floor area (GIA)
Floor area (NIA) Site area
Sq m Sq ft Sq m Sq ft Ha Acres
Scheme 1 Town centre, over two floors 3,000 32,292 2,550 27,448 0.38 0.93
Scheme 2 Out of town, over two floors 3,000 32,292 2,550 27,448 0.38 0.93
5.4.2 Office rental values
Table 5.14 details the rental values, development yield and incentives which have been used in
our development appraisals:
Table 5.14 Office rental values
Rental value (£) Yield Rent free
Sq m Sq ft % (months)
Scheme 1 Town centre, over two floors 106.79 10.00 8.5% 30
Scheme 2 Out of town, over two floors 106.79 10.00 8.5% 30
5.4.3 Office build costs
We have used the following build costs which are based on BCIS rebased for Derbyshire. We
have included a 15% uplift for external works.
Table 5.15 Office build costs
Build cost (£) Build cost including 15% uplift for external works
Sq m Sq ft Sq m Sq ft
Scheme 1 Town centre, over two floors 1,531 142 1,761 164
Scheme 2 Out of town, over two floors 1,430 133 1,645 153

Derbyshire Dales District Council
36
5.4.4 Development cost and phasing assumptions The following development cost and phasing assumptions have been used which typically reflect
local market conditions:
Table 5.16 Office development costs
Other development costs
Sensitivity for abnormals (% uplift on build costs) 10%
Site specific S106 costs £0
Professional fees as % of construction costs 10%
Contingencies on construction costs 5%
Letting costs (% of rental value) 10%
Letting legal costs (% of rental value) 5%
Investment sale (% of Net Development Value) 1%
Investment sale legal costs (% of NDV) 0.25%
Purchaser's costs (% on purchase price) 6.8%*
Finance on negative balance 6.75%
Developer profit (% on cost) 20%
*This represents the maximum stamp duty brought into effect by the March 2016 budget. As a fixed percentage in the appraisal it represents the maximum possible stamp duty that would apply, hence providing an in built viability buffer. The 6.8% includes agent and legal fees.
Table 5.17 Office phasing assumptions
Phasing assumptions
Lead in 6 months
Construction period 12 months
Sale On practical completion
5.4.5 Office land values
A land value benchmark of £494,200 per ha / £200,000 per acre is adopted for office
development schemes.

Derbyshire Dales District Council
37
5.4. Industrial development assumptions
5.5.1 Industrial scheme selection
Three hypothetical schemes have been selected for viability testing. Illustrated in Table 5.18
are the schemes, unit sizes and site coverage.
Table 5.18 Industrial development typologies
5.5.2 Industrial rental values Table 5.19 details the rental values and incentives which have been used in the development
appraisals:
Table 5.19 Industrial rental values
Rental value (£)
Yield Rent free
Sq m Sq ft % (months)
Small industrial / warehouse 51.00 4.75 6.75% 6
Medium industrial / warehouse 48.00 4.50 6.75% 6
5.5.3 Industrial build costs
The following build costs have been applied which are based on BCIS rebased for Derbyshire
Dales. A 15% uplift for external works has also been added to the build cost consistent with the
approach to all commercial schemes.
Table 5.20 Industrial build costs
Build cost (£) Build cost including 15% uplift for external works
Sq m Sq ft Sq m Sq ft
Small industrial /warehouse 973.00 90.00 1,119 104.00
Medium industrial / warehouse 574.00 53.00 660 61.00
5.5.4 Industrial development cost and phasing assumptions
The following development cost and phasing assumptions have been applied:
Floor area (GIA) Floor area (NIA) Site area
Sq m Sq ft Sq m Sq ft Ha Acres
Small industrial /warehouse 2,500 26,910 2,500 26,910 0.71 1.77
Medium industrial / warehouse 5,000 53,820 5,000 53,820 1.43 3.53

Derbyshire Dales District Council
38
Table 5.21 Industrial development costs
Other development costs
Sensitivity for abnormals (% uplift on build costs) 10%
Site specific S106 costs £0
Professional fees as % of construction costs 10%
Contingencies on construction costs 5%
Letting costs (% of rental value) 10%
Letting legal costs (% of rental value) 5%
Investment sale (% of Net Development Value) 1%
Investment sale legal costs (% of NDV) 0.25%
Purchaser's costs (% on purchase price) 6.8%*
Finance on negative balance 6.75%
Developer profit (% on cost) 20%
*This represents the maximum stamp duty brought into effect by the March 2016 budget. As a fixed percentage in the appraisal it represents the maximum possible stamp duty that would apply, hence providing an in built viability buffer. The 6.8% includes agent and legal fees.
Table 5.22 Industrial phasing assumptions
Phasing assumptions
Lead in 6 months
Construction period 12 months
Sale On practical completion
5.5.5 Industrial land values
A land value benchmark of £494,200 per ha / £200,000 per acre is adopted for industrial
development schemes.
5.5. Other commercial development schemes
We have also tested a number of additional commercial sectors to determine whether they are
able to support any level of CIL. Table 5.23 details the commercial schemes, floor areas and
site coverage.
Table 5.23 Other commercial development typologies
Floor area (GIA) Floor area (NIA) Site area
Sq m Sq ft Sq m Sq ft Ha Acres
Scheme 1 Hotel 60 bed budget 1,800 19,375 1,350 14,531 0.45 1.11
Scheme 2 Restaurant Restaurant 400 4,306 400 4,306 0.16 0.40
Scheme 3 Care home 60 bed care home 2,586 27,835 840 9,042 0.65 1.60

Derbyshire Dales District Council
39
5.6.1 Commercial rental values
Table 5.24 provides details of the rental values, development yields and incentives assumed in
our development appraisals:
Table 5.24 Other commercial development rental values
Rental values (£) Yield Incentives
Sq m Sq ft % Months
Scheme 1 Hotel £161.46 £15.00 6.5 6
Scheme 2 Restaurant £161.46 £15.00 6.5 12
Scheme 3 Care home (60 bed) £429.05 £39.86 6.5 6
5.6.2 Commercial build costs
The following build costs have been applied based on BCIS rebased for Derbyshire. A 15%
uplift for external works has been allowed for.
Table 5.25 Other commercial development build costs
Build cost (£) Build cost inc. 15% uplift for external works
Sq m Sq ft Sq m Sq ft
Scheme 1 Hotel 1,373 128 1579 147
Scheme 2 Restaurant 1,661 154 1910 177
Scheme 3 Care home (60 bed) 1,022 95 1175 109
The following development cost and phasing assumptions have been applied:
Table 5.26 Commercial development costs
Other development costs
Sensitivity for abnormals (% uplift on build costs) 10%
Site specific S106 costs £0
Professional fees as % of construction costs 10%
Contingencies on construction costs 5%
Letting costs (% of rental value) 10%
Letting legal costs (% of rental value) 5%
Investment sale (% of Net Development Value) 1%
Investment sale legal costs (% of NDV) 0.25%
Purchaser's costs (% on purchase price) 6.8%*
Finance on negative balance 6.75%
Developer profit (% on cost) 20%
Derbyshire Dales District Council
40
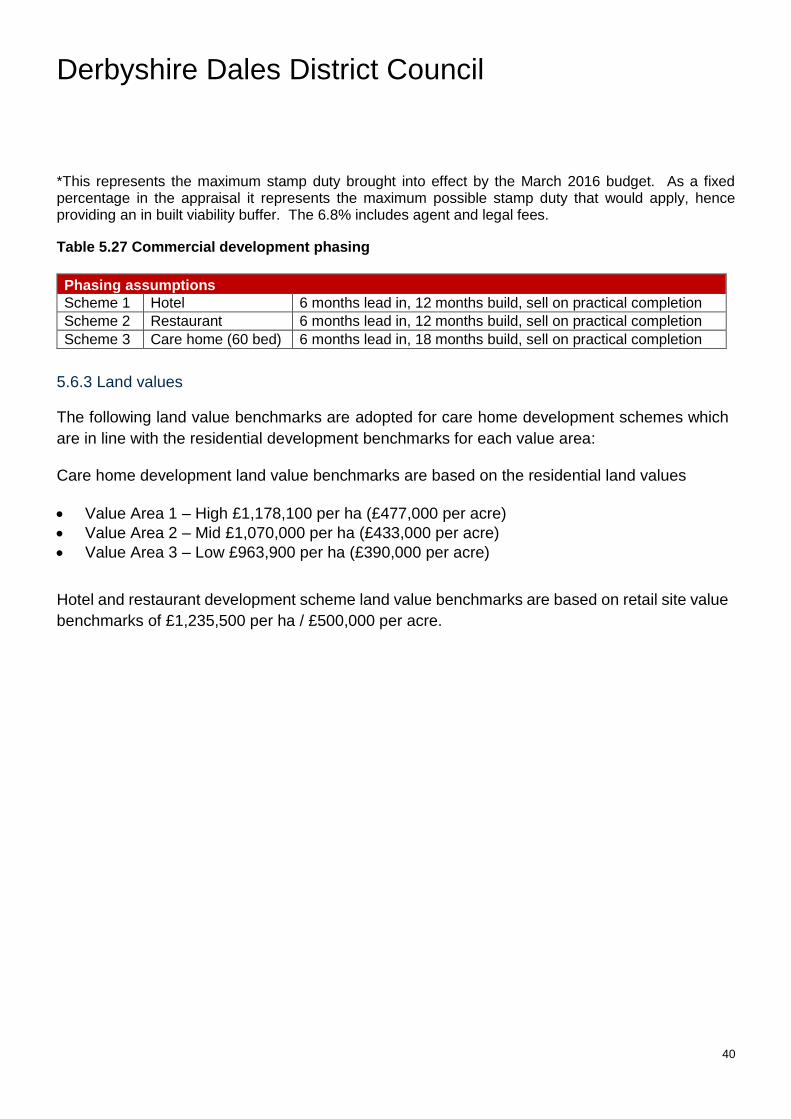
*This represents the maximum stamp duty brought into effect by the March 2016 budget. As a fixed percentage in the appraisal it represents the maximum possible stamp duty that would apply, hence providing an in built viability buffer. The 6.8% includes agent and legal fees.
Table 5.27 Commercial development phasing
Phasing assumptions
Scheme 1 Hotel 6 months lead in, 12 months build, sell on practical completion
Scheme 2 Restaurant 6 months lead in, 12 months build, sell on practical completion
Scheme 3 Care home (60 bed) 6 months lead in, 18 months build, sell on practical completion
5.6.3 Land values
The following land value benchmarks are adopted for care home development schemes which
are in line with the residential development benchmarks for each value area:
Care home development land value benchmarks are based on the residential land values
Value Area 1 – High £1,178,100 per ha (£477,000 per acre)
Value Area 2 – Mid £1,070,000 per ha (£433,000 per acre)
Value Area 3 – Low £963,900 per ha (£390,000 per acre)
Hotel and restaurant development scheme land value benchmarks are based on retail site value
benchmarks of £1,235,500 per ha / £500,000 per acre.

Derbyshire Dales District Council
41
6. Viability Results
This section sets out the results of the area wide viability testing. A summary of the ‘headroom’
that is available for CIL is provided for each of the hypothetical schemes that have been tested,
and in the case of the residential sector, the level of affordable housing. Where appropriate, cost
and value sensitivities have also been modelled to demonstrate the effect of adjustment to key
variables.
6.1. Residential viability results
In the earlier version of our viability evidence report produced in September 2015 we assessed
a range of affordable housing scenarios to inform the development and refinement of policies.
We produced graphs to illustrate the trade-off between affordable housing and CIL. As a result
of this work, it was deemed that affordable housing policies should seek no more than 30% of
units to be affordable, given the additional competing pressures on development costs:
Figure 6.1: CIL headroom and affordable housing scenarios
As illustrated, there is an inverse relationship between the level of CIL headroom and affordable
housing that is viable; that is to say, the higher the affordable housing scenario, the lower the
rate of CIL that is viable. The results vary across the three value areas with the higher value
areas capable of absorbing higher levels of affordable housing and CIL. There is also variation
across the different site typologies; in the main, the smaller sites are capable of carrying slightly
more planning gain per sq m than the larger sites which is due to cashflow with prolonged delivery
timescales stretching finance costs.
-£200
-£100
£0
£100
£200
£300
£400
45% 33% 30% 20% 15% 0%
Value area 1 Value area 2 Value area 3
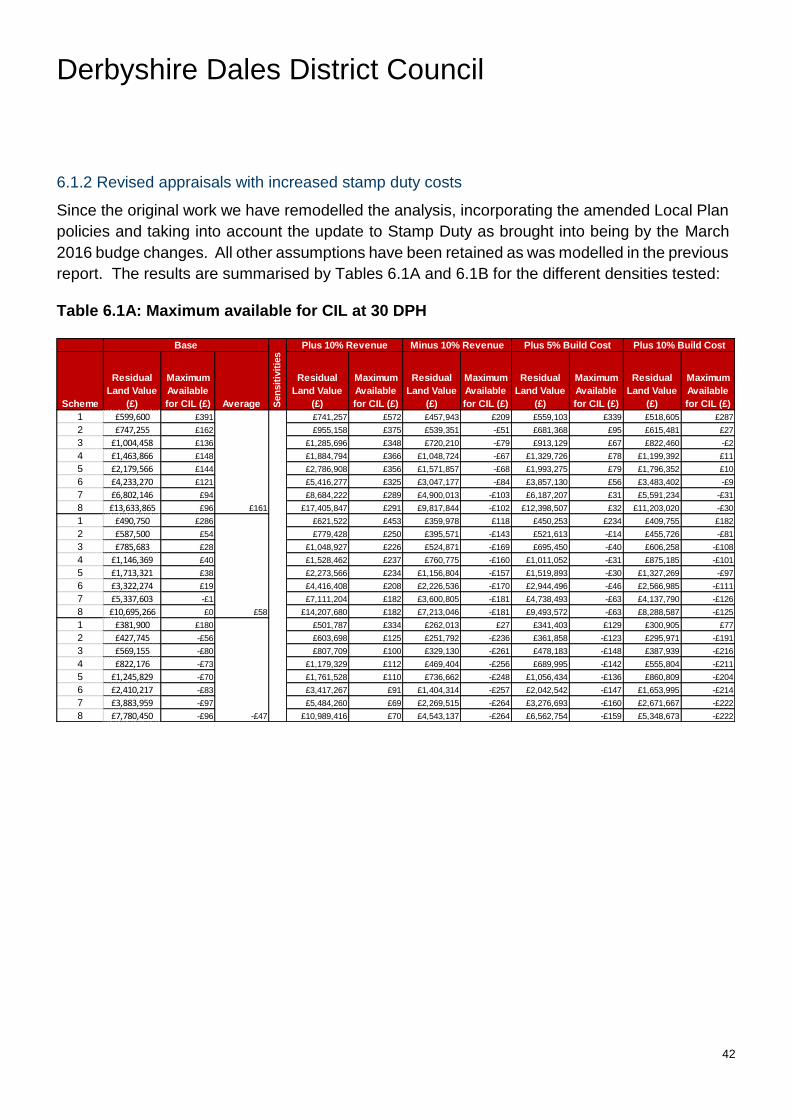
Derbyshire Dales District Council
42
6.1.2 Revised appraisals with increased stamp duty costs
Since the original work we have remodelled the analysis, incorporating the amended Local Plan
policies and taking into account the update to Stamp Duty as brought into being by the March
2016 budge changes. All other assumptions have been retained as was modelled in the previous
report. The results are summarised by Tables 6.1A and 6.1B for the different densities tested:
Table 6.1A: Maximum available for CIL at 30 DPH
Scheme
Residual
Land Value
(£)
Maximum
Available
for CIL (£) Average
Residual
Land Value
(£)
Maximum
Available
for CIL (£)
Residual
Land Value
(£)
Maximum
Available
for CIL (£)
Residual
Land Value
(£)
Maximum
Available
for CIL (£)
Residual
Land Value
(£)
Maximum
Available
for CIL (£)
1 £599,600 £391 £741,257 £572 £457,943 £209 £559,103 £339 £518,605 £287
2 £747,255 £162 £955,158 £375 £539,351 -£51 £681,368 £95 £615,481 £27
3 £1,004,458 £136 £1,285,696 £348 £720,210 -£79 £913,129 £67 £822,460 -£2
4 £1,463,866 £148 £1,884,794 £366 £1,048,724 -£67 £1,329,726 £78 £1,199,392 £11
5 £2,179,566 £144 £2,786,908 £356 £1,571,857 -£68 £1,993,275 £79 £1,796,352 £10
6 £4,233,270 £121 £5,416,277 £325 £3,047,177 -£84 £3,857,130 £56 £3,483,402 -£9
7 £6,802,146 £94 £8,684,222 £289 £4,900,013 -£103 £6,187,207 £31 £5,591,234 -£31
8 £13,633,865 £96 £17,405,847 £291 £9,817,844 -£102 £12,398,507 £32 £11,203,020 -£30
1 £490,750 £286 £621,522 £453 £359,978 £118 £450,253 £234 £409,755 £182
2 £587,500 £54 £779,428 £250 £395,571 -£143 £521,613 -£14 £455,726 -£81
3 £785,683 £28 £1,048,927 £226 £524,871 -£169 £695,450 -£40 £606,258 -£108
4 £1,146,369 £40 £1,528,462 £237 £760,775 -£160 £1,011,052 -£31 £875,185 -£101
5 £1,713,321 £38 £2,273,566 £234 £1,156,804 -£157 £1,519,893 -£30 £1,327,269 -£97
6 £3,322,274 £19 £4,416,408 £208 £2,226,536 -£170 £2,944,496 -£46 £2,566,985 -£111
7 £5,337,603 -£1 £7,111,204 £182 £3,600,805 -£181 £4,738,493 -£63 £4,137,790 -£126
8 £10,695,266 £0 £14,207,680 £182 £7,213,046 -£181 £9,493,572 -£63 £8,288,587 -£125
1 £381,900 £180 £501,787 £334 £262,013 £27 £341,403 £129 £300,905 £77
2 £427,745 -£56 £603,698 £125 £251,792 -£236 £361,858 -£123 £295,971 -£191
3 £569,155 -£80 £807,709 £100 £329,130 -£261 £478,183 -£148 £387,939 -£216
4 £822,176 -£73 £1,179,329 £112 £469,404 -£256 £689,995 -£142 £555,804 -£211
5 £1,245,829 -£70 £1,761,528 £110 £736,662 -£248 £1,056,434 -£136 £860,809 -£204
6 £2,410,217 -£83 £3,417,267 £91 £1,404,314 -£257 £2,042,542 -£147 £1,653,995 -£214
7 £3,883,959 -£97 £5,484,260 £69 £2,269,515 -£264 £3,276,693 -£160 £2,671,667 -£222
8 £7,780,450 -£96 £10,989,416 £70 £4,543,137 -£264 £6,562,754 -£159 £5,348,673 -£222
Minus 10% Revenue Plus 5% Build Cost Plus 10% Build CostBase
£161
Sen
sit
ivit
ies
Plus 10% Revenue
£58
-£47

Derbyshire Dales District Council
43
Table 6.1b: Maximum available for CIL at 40 DPH including sensitivities
The results demonstrate that there is a significant different between the two density scenarios.
At 30 DPH, affordable housing and other costs are largely viable although in the lower of the
three value areas viability becomes marginal as indicated by the negative headroom calculation
figures. At 40 DPH the various planning standards are indicated to be viable with the capacity
to support a Community Infrastructure Levy range of £63 per sq m in the low value area to £293
per sq m in the high value area. At the mix of units applied in this assessment, we consider that
40 DPH generates the more relevant indicator which aligns with typical levels of site cover that
house builders will seek to achieve.
The sensitivities modelled illustrate the impact of small variations in cost and value on viability.
6.2. Commercial viability results
6.2.1 Retail development
As illustrated in Table 6.6, the analysis identifies that in current market conditions there is only
headroom to charge CIL in town centres for superstores and convenience stores. The
development of convenience stores in local centres and villages has no headroom for CIL. In
out of centre locations only supermarkets have capacity for CIL up to a maximum of £165 per sq
m.
Value
Area Scheme
Residual
Land Value
(£)
Maximum
Available
for CIL (£) Average
Residual
Land Value
(£)
Maximum
Available
for CIL (£)
Residual
Land Value
(£)
Maximum
Available
for CIL (£)
Residual
Land Value
(£)
Maximum
Available
for CIL (£)
Residual
Land Value
(£)
Maximum
Available
for CIL (£)
1 £701,227 £451 £867,163 £635 £535,292 £267 £653,789 £398 £606,351 £346
2 £923,530 £275 £1,186,842 £492 £658,985 £58 £838,862 £205 £753,144 £135
3 £1,389,115 £310 £1,784,088 £527 £998,269 £95 £1,263,419 £241 £1,140,917 £174
4 £1,994,999 £309 £2,549,808 £518 £1,432,994 £96 £1,814,838 £241 £1,635,844 £173
5 £2,903,021 £294 £3,721,568 £506 £2,093,066 £84 £2,645,988 £228 £2,388,922 £161
6 £5,509,699 £256 £7,079,395 £459 £3,961,414 £55 £5,016,507 £192 £4,523,058 £128
7 £8,774,117 £224 £11,199,661 £412 £6,335,364 £35 £8,014,070 £165 £7,250,853 £106
8 £17,627,910 £227 £22,495,744 £415 £12,734,096 £37 £16,104,029 £168 £14,573,765 £108
1 £573,722 £339 £726,906 £509 £419,431 £168 £526,283 £287 £478,845 £234
2 £720,107 £152 £964,850 £353 £476,484 -£48 £637,497 £84 £550,851 £13
3 £1,089,959 £187 £1,449,913 £385 £727,143 -£12 £963,478 £118 £838,862 £49
4 £1,562,291 £186 £2,082,925 £383 £1,049,027 -£8 £1,384,568 £119 £1,212,323 £54
5 £2,280,678 £175 £3,028,339 £369 £1,532,425 -£19 £2,031,082 £110 £1,768,252 £42
6 £4,320,226 £144 £5,748,548 £329 £2,884,579 -£42 £3,826,417 £80 £3,328,891 £15
7 £6,931,807 £123 £9,145,562 £295 £4,665,219 -£53 £6,134,206 £61 £5,372,264 £2
8 £13,936,871 £125 £18,373,224 £297 £9,383,096 -£51 £12,331,579 £63 £10,803,853 £4
1 £446,216 £228 £586,650 £383 £305,782 £72 £398,778 £175 £351,339 £122
2 £517,616 £29 £740,666 £213 £293,937 -£155 £432,423 -£41 £347,540 -£111
3 £785,171 £61 £1,120,902 £245 £452,957 -£122 £661,382 -£7 £535,611 -£76
4 £1,137,128 £65 £1,605,788 £243 £664,054 -£113 £956,374 -£3 £782,837 -£68
5 £1,657,765 £55 £2,343,791 £233 £974,059 -£122 £1,400,715 -£12 £1,148,682 -£77
6 £3,124,964 £30 £4,440,905 £201 £1,811,580 -£140 £2,629,197 -£34 £2,131,456 -£98
7 £5,041,292 £17 £7,106,314 £178 £2,967,185 -£144 £4,272,203 -£42 £3,503,349 -£102
8 £10,137,704 £19 £14,281,698 £180 £5,975,913 -£142 £8,595,642 -£40 £7,056,431 -£100
Minus 10% Revenue Plus 5% Build Cost Plus 10% Build CostBase
£293
Sen
sit
ivit
ies
High
Medium
Low
Plus 10% Revenue
£179
£63

Derbyshire Dales District Council
44
Table 6.6 Commercial viability results – current values
6.2.2 Office development
The viability analysis indicates that there is no headroom for CIL on office development, reflecting
the weak strength of the office sector in Derbyshire Dales at the current time.
Scheme
Site Size
(hectares)
GIA Floor
coverage
(Sq m)
Benchmark Land
Value per
hectare (£)
Actual
Benchmark
Land Value
(scaled to site
area - £)
Residual Land
Value
(£)
Residual
Land Value
minus
actual
benchmark
Land Value
(£)
Maximum
Available for
CIL
(£)
Retail
Town Centre
Shopping Centre 1.25 5000 £1,235,500 £1,544,375 -£3,575,631 -£5,120,006 -£1,024
Retail Warehousing 0.75 3000 £1,235,500 £926,625 £856,596 -£70,029 -£23
Superstore 1.60 3995 £1,235,500 £1,976,800 £2,636,145 £659,345 £165
Supermarket 0.60 1500 £1,235,500 £741,300 -£383,489 -£1,124,789 -£750
Convenience Store 0.16 400 £1,235,500 £197,680 £217,177 £19,497 £49
Local Centre
Convenience Store 0.16 400 £1,235,500 £197,680 -£43,655 -£241,335 -£603
Village Shops
Convenience Store 0.16 400 £1,235,500 £197,680 -£90,481 -£288,161 -£720
Out of Centre
Retail Warehousing 0.75 3000 £1,235,500 £926,625 £856,596 -£70,029 -£23
Superstore 1.60 3995 £1,235,500 £1,976,800 £2,636,145 £659,345 £165
Supermarket 0.60 1500 £1,235,500 £741,300 -£296,198 -£1,037,498 -£692
Convenience Store 0.16 400 £1,235,500 £197,680 £34,420 -£163,260 -£408
Office
Town centre 0.38 3,000 £494,200 £187,796 -£3,951,462 -£4,139,258 -£1,380
Out of town 0.38 3,000 £494,200 £187,796 -£3,577,429 -£3,765,225 -£1,255
Industrial
Small industrial / warehouse 0.71 2,500 £494,200 £350,882 -£1,755,837 -£2,106,719 -£843
Medium industrial / warehouse1.43 5,000 £494,200 £706,706 -£1,206,229 -£1,912,935 -£383
Other commercial
Hotel 0.45 1,800 £1,235,500 £555,975 -£838,680 -£1,394,655 -£775
Restaurant 0.16 400 £1,235,500 £197,680 -£97,394 -£295,074 -£738
Carehome High Value Area 0.65 2,586 £1,178,100 £765,765 £156,913 -£608,852 -£235
Carehome Mid Value Area 0.65 2,586 £1,070,000 £695,500 £156,913 -£538,587 -£208
Carehome Lower Value Area 0.65 2,586 £963,900 £626,535 £156,913 -£469,622 -£182
Commercial Viability Analysis - Baseline

Derbyshire Dales District Council
45
6.2.3 Industrial development
The viability analysis demonstrates that there is no headroom for CIL on industrial development.
Rental values are not strong enough to support speculative development on a general basis at
the current time. However, as market conditions improve and land opportunities are brought
forward, we would expect to see some improvement in rents which could enhance viability.
6.2.4 Other commercial development sectors
Table 6.6 illustrates that there is no headroom for CIL on the development of hotels, restaurants
and care homes in Derbyshire Dales at the current time.
6.2.5 Sensitivity testing
Sensitivity analysis has been carried out on rental values and yields to reflect fluctuations in
property market conditions over the Local Plan period. We have increased rental values by 10%
and reduced property yields by 100 base points (1%) to reflect market growth. Conversely, we
have decreased rental values by 10% and increased property yields by 100 base points (1%) to
demonstrate the impact of declining market conditions on commercial development. The results
of our analysis are presented in Tables 6.7 and 6.8.
As with the residential development typologies, we have also tested the impact of an increase in
build costs to account for Strategic Polices 4 and 9. The results of this sensitivity analysis is
shown in Tables 6.9 and 6.10.

Derbyshire Dales District Council
46
Table 6.7 Commercial development viability results plus 10% rental values
As demonstrated by Table 6.7, increasing rental costs and property yields by 10% to reflect
improved local property market conditions improves development viability. For town centre
locations, this enables up to a maximum of £282 per sq m CIL charge on retail warehousing,
however shopping centres reman unable to support CIL. Retail development in out of centre
locations is also able to support CIL at up to £812 per sq m (superstores). The development of
convenience stores in Local Centres and villages is still unable to support CIL despite higher
revenues and property yields. With the exception of care homes (up to £210 per sq m), all other
commercial development has no headroom for CIL, despite a 10% projected growth in rents and
yield compression.
Scheme
Site Size
(hectares)
GIA Floor
coverage
(Sq m)
Benchmark Land
Value per
hectare (£)
Actual
Benchmark
Land Value
(scaled to site
area - £)
Residual Land
Value
(£)
Residual
Land Value
minus actual
benchmark
Land Value
(£)
Maximum
Available for
CIL
(£)
Retail
Town Centre
Shopping Centre 1.25 5000 £1,235,500 £1,544,375 -£2,648,316 -£4,192,691 -£839
Retail Warehousing 0.75 3000 £1,235,500 £926,625 £1,774,046 £847,421 £282
Superstore 1.60 3995 £1,235,500 £1,976,800 £5,222,691 £3,245,891 £812
Supermarket 0.60 1500 £1,235,500 £741,300 £473,791 -£267,509 -£178
Convenience Store 0.16 400 £1,235,500 £197,680 £500,058 £302,378 £756
Local Centre
Convenience Store 0.16 400 £1,235,500 £197,680 £147,536 -£50,144 -£125
Village Shops
Convenience Store 0.16 400 £1,235,500 £197,680 £85,906 -£111,774 -£279
Out of Centre
Retail Warehousing 0.75 3000 £1,235,500 £926,625 £1,774,046 £847,421 £282
Superstore 1.60 3995 £1,235,500 £1,976,800 £5,222,691 £3,245,891 £812
Supermarket 0.60 1500 £1,235,500 £741,300 £588,810 -£152,490 -£102
Convenience Store 0.16 400 £1,235,500 £197,680 £252,536 £54,856 £137
Office
Town centre 0.38 3,000 £494,200 £187,796 -£3,452,009 -£3,639,805 -£1,213
Out of town 0.38 3,000 £494,200 £187,796 -£3,080,882 -£3,268,678 -£1,090
Industrial
Small industrial / warehouse 0.71 2,500 £494,200 £350,882 -£1,385,849 -£1,736,731 -£695
Medium industrial / warehouse1.43 5,000 £494,200 £706,706 -£522,857 -£1,229,563 -£246
Other commercial
Hotel 0.45 1,800 £1,235,500 £555,975 -£170,956 -£726,931 -£404
Restaurant 0.16 400 £1,235,500 £197,680 £10,280 -£187,400 -£469
Carehome High Value Area 0.65 2,586 £1,178,100 £765,765 £1,168,538 £402,773 £156
Carehome Mid Value Area 0.65 2,586 £1,070,000 £695,500 £1,168,538 £473,038 £183
Carehome Lower Value Area 0.65 2,586 £963,900 £626,535 £1,168,538 £542,003 £210
Commercial Viability Analysis - Sensitivity Analysis (plus 10% rental values minus 1% property yields)

Derbyshire Dales District Council
47
Conversely, as shown in Table 6.8, the analysis demonstrates that a decline in market conditions
(where rental values reduce by 10%) negates CIL headroom for commercial development
schemes across the board.
Table 6.8 Commercial Development Viability Results minus 10% rental values
Table 6.9 and 6.10 demonstrate the impact of Local Plan policies on commercial development in current
market conditions. Increasing build costs by 5% and 10% to account for the provision of renewable and
low carbon technologies and green infrastructure respectively, does adversely impact on viability, however
there is still headroom for CIL on certain retail developments.
Scheme
Site Size
(hectares)
GIA Floor
coverage
(Sq m)
Benchmark Land
Value per
hectare (£)
Actual
Benchmark
Land Value
(scaled to site
area - £)
Residual Land
Value
(£)
Residual
Land Value
minus actual
benchmark
Land Value
(£)
Maximum
Available for
CIL
(£)
Retail
Town Centre
Shopping Centre 1.25 5000 £1,235,500 £1,544,375 -£4,301,663 -£5,846,038 -£1,169
Retail Warehousing 0.75 3000 £1,235,500 £926,625 £186,055 -£740,570 -£247
Superstore 1.60 3995 £1,235,500 £1,976,800 £846,855 -£1,129,945 -£283
Supermarket 0.60 1500 £1,235,500 £741,300 -£991,936 -£1,733,236 -£1,155
Convenience Store 0.16 400 £1,235,500 £197,680 £22,178 -£175,502 -£439
Local Centre
Convenience Store 0.16 400 £1,235,500 £197,680 -£179,579 -£377,259 -£943
Village Shops
Convenience Store 0.16 400 £1,235,500 £197,680 -£215,843 -£413,523 -£1,034
Out of Centre
Retail Warehousing 0.75 3000 £1,235,500 £926,625 £186,055 -£740,570 -£247
Superstore 1.60 3995 £1,235,500 £1,976,800 £846,855 -£1,129,945 -£283
Supermarket 0.60 1500 £1,235,500 £741,300 -£923,911 -£1,665,211 -£1,110
Convenience Store 0.16 400 £1,235,500 £197,680 -£118,764 -£316,444 -£791
Office
Town centre 0.38 3,000 £494,200 £187,796 -£4,336,367 -£4,524,163 -£1,508
Out of town 0.38 3,000 £494,200 £187,796 -£3,961,436 -£4,149,232 -£1,383
Industrial
Small industrial / warehouse 0.71 2,500 £494,200 £350,882 -£2,030,689 -£2,381,571 -£953
Medium industrial / warehouse1.43 5,000 £494,200 £706,706 -£1,715,646 -£2,422,352 -£484
Other commercial
Hotel 0.45 1,800 £1,235,500 £555,975 -£1,332,437 -£1,888,412 -£1,049
Restaurant 0.16 400 £1,235,500 £197,680 -£329,270 -£526,950 -£1,317
Carehome High Value Area 0.65 2,586 £1,178,100 £765,765 -£593,990 -£1,359,755 -£526
Carehome Mid Value Area 0.65 2,586 £1,070,000 £695,500 -£593,990 -£1,289,490 -£499
Carehome Lower Value Area 0.65 2,586 £963,900 £626,535 -£593,990 -£1,220,525 -£472
Commercial Viability Analysis - Sensitivity Analysis (minus 10% rental values plus 1% property yields)

Derbyshire Dales District Council
48
Table 6.9 Commercial Development Viability Results 5% cost uplift
Assuming a 5% uplift in build costs, up to £109 per sq m CIL can be charged on superstores in
town centres and out of centre locations. It should be noted however that all other commercial
development has no headroom for CIL.
With a 10% increase in build costs the headroom for CIL is reduced, however up to £51 per sq m
can be charged on superstores. All other commercial development has no headroom for CIL.
Scheme
Site Size
(hectares)
GIA Floor
coverage (Sq
m)
Benchmark Land
Value per hectare
(£)
Actual Benchmark
Land Value
(scaled to site area
- £)
Residual Land
Value
(£)
Residual Land
Value minus
actual benchmark
Land Value (£)
Maximum
Available for CIL
(£)
Retail
Town Centre
Shopping Centre 1.25 5000 £1,235,500 £1,544,375 -£3,911,609 -£5,455,984 -£1,091
Retail Warehousing 0.75 3000 £1,235,500 £926,625 £752,933 -£173,692 -£58
Superstore 1.60 3995 £1,235,500 £1,976,800 £2,411,004 £434,204 £109
Supermarket 0.60 1500 £1,235,500 £741,300 -£523,789 -£1,265,089 -£843
Convenience Store 0.16 400 £1,235,500 £197,680 £189,104 -£8,576 -£21
Local Centre
Convenience Store 0.16 400 £1,235,500 £197,680 -£72,685 -£270,365 -£676
Village Shops
Convenience Store 0.16 400 £1,235,500 £197,680 -£119,841 -£317,521 -£794
Out of Centre
Retail Warehousing 0.75 3000 £1,235,500 £926,625 £752,933 -£173,692 -£58
Superstore 1.60 3995 £1,235,500 £1,976,800 £2,411,004 £434,204 £109
Supermarket 0.60 1500 £1,235,500 £741,300 -£437,330 -£1,178,630 -£786
Convenience Store 0.16 400 £1,235,500 £197,680 £6,551 -£191,129 -£478
Office
Town centre 0.38 3,000 £494,200 £187,796 -£4,234,978 -£4,422,774 -£1,474
Out of town 0.38 3,000 £494,200 £187,796 -£3,843,290 -£4,031,086 -£1,344
Industrial
Small industrial /
warehouse 0.71 2,500 £494,200 £350,882 -£1,905,078 -£2,255,960 -£902
Medium industrial /
warehouse 1.43 5,000 £494,200 £706,706 -£1,381,809 -£2,088,515 -£418
Other commercial
Hotel 0.45 1,800 £1,235,500 £555,975 -£989,825 -£1,545,800 -£859
Restaurant 0.16 400 £1,235,500 £197,680 -£212,546 -£410,226 -£1,026
Carehome High Value Area 0.65 2,586 £1,178,100 £765,765 £6,555 -£759,210 -£294
Carehome Mid Value Area 0.65 2,586 £1,070,000 £695,500 £6,555 -£688,945 -£266
Carehome Lower Value Area 0.65 2,586 £963,900 £626,535 £6,555 -£619,980 -£240
Commercial Viability Analysis - Sensitivity Analysis (plus 5% build costs)

Derbyshire Dales District Council
49
Table 6.10 Commercial Development Viability Results 10% cost uplift
Scheme
Site Size
(hectares)
GIA Floor
coverage
(Sq m)
Benchmark Land
Value per
hectare (£)
Actual
Benchmark
Land Value
(scaled to
site area - £)
Residual
Land Value
(£)
Residual Land
Value minus
actual
benchmark
Land Value
(£)
Maximum
Available
for CIL
(£)
Retail
Town Centre
Shopping Centre 1.25 5000 £1,235,500 £1,544,375 -£4,246,539 -£5,790,914 -£1,158
Retail Warehousing 0.75 3000 £1,235,500 £926,625 £646,841 -£279,784 -£93
Superstore 1.60 3995 £1,235,500 £1,976,800 £2,179,463 £202,663 £51
Supermarket 0.60 1500 £1,235,500 £741,300 -£663,760 -£1,405,060 -£937
Convenience Store 0.16 400 £1,235,500 £197,680 £160,486 -£37,194 -£93
Local Centre
Convenience Store 0.16 400 £1,235,500 £197,680 -£101,549 -£299,229 -£748
Village Shops
Convenience Store 0.16 400 £1,235,500 £197,680 -£148,954 -£346,634 -£867
Out of Centre
Retail Warehousing 0.75 3000 £1,235,500 £926,625 £646,841 -£279,784 -£93
Superstore 1.60 3995 £1,235,500 £1,976,800 £2,179,463 £202,663 £51
Supermarket 0.60 1500 £1,235,500 £741,300 -£574,135 -£1,315,435 -£877
Convenience Store 0.16 400 £1,235,500 £197,680 -£21,758 -£219,438 -£549
Office
Town centre 0.38 3,000 £494,200 £187,796 -£4,518,146 -£4,705,942 -£1,569
Out of town 0.38 3,000 £494,200 £187,796 -£4,107,924 -£4,295,720 -£1,432
Industrial
Small industrial / warehouse 0.71 2,500 £494,200 £350,882 -£2,056,492 -£2,407,374 -£963
Medium industrial / warehouse 1.43 5,000 £494,200 £706,706 -£1,556,544 -£2,263,250 -£453
Other commercial
Hotel 0.45 1,800 £1,235,500 £555,975 -£1,141,464 -£1,697,439 -£943
Restaurant 0.16 400 £1,235,500 £197,680 -£265,887 -£463,567 -£1,159
Carehome High Value Area 0.65 2,586 £1,178,100 £765,765 -£150,795 -£916,560 -£354
Carehome Mid Value Area 0.65 2,586 £1,070,000 £695,500 -£150,795 -£846,295 -£327
Carehome Lower Value Area 0.65 2,586 £963,900 £626,535 -£150,795 -£777,330 -£301
Commercial Viability Analysis - Sensitivity Analysis (plus 10% build costs)

Derbyshire Dales District Council
50
7. Implications of Viability Results for Local Plan and CIL
7.1. Local Plan policies
HC4 Affordable Housing
The District will seek to maximise the delivery of affordable housing across the plan area by
working in partnership with the Homes and Communities Agency and registered social landlords,
developers and communities.
The previous viability report tested in September 2015 included the provision of 45% affordable
housing on sites of 25 units or more or on sites of 0.75 hectares or more. We also tested 33%
affordable housing on sites of 10-24 units or more or on sites of 0.1 hectares or more.
However we also tested the viability of residential development by varying the affordable housing
contributions to 30%, 20% and 15% to demonstrate the impact of such changes on the headroom
available for schemes. Following changes in planning policy guidelines on planning obligations,
we have also tested the impact of affordable housing on all residential schemes – thereby
reducing the minimum threshold where sites of less than 10 units are exempt from CIL.
Our initial analysis indicated that the Council’s draft policy of 45% on large sites and 33% on small
sites was not viable except for in the highest value parts of the District. Value Area 1 displayed
the ability to bear this level of affordable housing but Value Area 2 was marginally viable and
Value Area 3 could bear no more than 30% affordable housing in current market conditions.
Value Area 3 includes several of the main settlements and is where a large proportion of the
future development of the area is to be accommodated.
We recommended that as a District wide affordable housing target policy should not exceed 30%.
This level is predicated on the viability of development in the lower value area (Value Area 3).
The Council has taken on board our recommendations and has reduced the policy requirement
for affordable housing to 30% of all housing units with a threshold of 10 dwellings or more or with
a combined floor space of more than 1000 sq m.
The sensitivity analysis has demonstrated that variation in market conditions and individual
development circumstances could have a significant effect on affordable housing viability, both
positive and negative. Therefore we consider that in terms of policy structure, there should be
both flexibility such that the affordable housing level is sought as a target (but with a viability
clause to reflect individual / exceptional circumstances), and that it is subject to review through
the plan period to ensure consistency with market capacity. We would also note that the emerging
national requirement for a portion of affordable homes to be ‘starter’ could, subject to clarification
of regulations, have the beneficial impact of enhancing viability of development since the overall
transfer values of the affordable housing would be increased (starter home values will be fixed at
80% of OMV compared with shared ownership at 70% of OMV and affordable rent at 50% of
OMV).

Derbyshire Dales District Council
51
HC11 Housing Mix and Housing Type
The housing mix prescribed by the Local Plan must be implemented in a flexible way in order to
ensure compatibility with market requirements. The mix indicated by policy puts the emphasis at
the smaller end of the size spectrum which could result in house builders seeking to increase the
dwelling capacity to achieve target site cover. The analysis contained in our report shows that by
increasing the density of dwellings on site, viability levels can be upheld. However this does not
reflect the possibility that such a prescriptive mix could stymie delivery rates and market appetite.
Therefore we consider it essential that this policy is implemented in a cautious manner.
In respect of the requirement for 10% of homes on sites over 10 units to meet wheel chair
accessibility requirements is not considered would onerously affect viability. The appraisals
carried out in our assessment provide adequate costs and buffers to absorb such factors.
HC14 Open space, Sport and Recreational Facilities
We consider that the majority of contributions for such facilities will be collected via the Community
Infrastructure. However, for those where on site requirements will be prevail, we have allowed
adequate allowance within the S106 budget to cover such costs. Therefore, as worded, we do
not consider that the policy presents any difficulties in terms of compliance from a viability
perspective.
PD7 Climate Change
The Council will support the provision of renewable and low-carbon technologies, including both
standalone installations, and micro-renewables integrated within new or existing development.
Our analysis has shown that by increasing the build costs of residential and commercial
development by 5% to account for the increased costs in providing renewable and low carbon
technologies reduces the viability of development. This is based on evidence presented by Zero
Carbon Hub in their report “Cost Analysis: Meeting the Zero Carbon Standard”, February 2014.
In the case of commercial development schemes the headroom for CIL decreases from £165 per
sq m to £109 per sq m for superstore developments and from £49 per sq m to £0 per sq m for
convenience stores when compared to the headroom for CIL at baseline costs. However despite
the increase in build costs of 5% per sq m, there is still headroom to charge CIL on some forms
of retail development whilst including a contribution for renewables and low carbon technologies.
Because this policy is worded in a flexible way with a caveat relating to viability, it is not considered
it would place an immovable burden on development that could place deliverability at risk.
7.2. CIL
The evidence presented in this report demonstrates the diversity of development viability across
Derbyshire Dales. Residential and retail are the only development typologies considered to be
generally capable of bearing CIL at the current time.
The viability of CIL on residential development is limited to high and mid value areas of the
District when a policy of 33% and 45% affordable housing contributions is applied. However, at

Derbyshire Dales District Council
52
30% affordable housing, there is considered to be potential for CIL within all areas of the District
albeit at a relatively nominal level in Value Area 3. Reducing the affordable housing requirements
to 20% would dramatically increase the level of CIL viability, however there is an important
balance to be struck between affordable housing provision and securing funding for infrastructure
which is necessary to deliver economic growth.
Smaller sites of under 1 hectare have slightly higher capacity to support CIL than larger sites.
As CIL rates can be differentiated according to scheme size, understanding this differing viability
impact is helpful in forming the parameters for the Council’s CIL charging strategy – especially
when the majority of sites (74%) coming forward for residential development in Derbyshire Dales
are less than 3 hectares in size. However, the difference is relatively small and we consider that
such differences could be negated by the higher construction costs encountered on smaller sites.
The viability to charge CIL on commercial development is limited. Some types of retail
development are able to bear a CIL, with certain formats of supermarket indicated to have
headroom – although this varies in terms of the location of the development with only town centre
and out of centre locations being able to support CIL. All other commercial development
typologies have no headroom for CIL in current market conditions.
Viability Proofing – Accounting for the “Buffer”
Caution is required to ensure that the rates that are set for CIL are not at a level that would
undermine the delivery of development. CIL is not easy to vary on a case by case basis once
set and therefore there is a risk that if not set at an appropriate level that the effect could be
either to reduce other planning obligation requirements or in a worst case scenario prevent land
from coming forward for development.
The analysis contained in this report is predicated on high level and indicative schemes and
assumptions. It should be noted that in reality, the development market is not homogenous and
there is potential for wide variation in many of the inputs to a viability appraisal including the price
of land, the developer’s return and site development costs.
There is also potential for variation in both market conditions and construction costs arising from
changes to building regulations which will influence changes in viability headroom for CIL.
Government guidance makes it clear that CIL rates should not be set right at the margins of
viability. At Paragraph 019 Reference ID: 25-019-20140612), the guidance specifies that “there
is room for some pragmatism. It would be appropriate to ensure that a ‘buffer’ or margin is
included, so that the levy rate is able to support development when economic circumstances
adjust”. Evidence from recent CIL examinations indicates that a minimum discount of 25-30%
from the maximum CIL viability is considered reasonable to demonstrate that the ‘balance’ has
been struck.

Derbyshire Dales District Council
53
CIL charging scenarios
The table below outlines recommended maximum CIL charging scenarios based on the above
viability analysis. For the residential sector, three CIL scenarios are outlined to reflect the
potential CIL levies at the various affordable housing rates. The maximum headroom figures are
based on averages from the range of schemes tested, which have then been discounted to allow
for the ‘viability buffer’. Although this approach results in a relatively small discount in the low
value area, We consider that this reduced discount is justified due to the various in built viability
buffers which would insulate the impacts of CIL on deliverability.
In respect of retail rates, only the large superstore and convenience store indicate CIL headroom.
An approximate 50% discount has been applied to these property types consistent with the
approach taken to the residential CIL levels.

Derbyshire Dales District Council
54
Table 7.2 CIL Charging Scenarios per sq m
Maximum CIL Headroom range (30 DPH / 40 DPH)
With allowance for buffer
Residential at 30% AH
Value Area High £161-£293 £120
Value Area Medium £58-£179 £50
Value Area Lower £0-63 £10
Retail
Town Centre
Shopping Centre £0 £0
Retail Warehousing £0 £0
Superstore £165 £80
Supermarket £0 £0
Convenience Store £49 £20
Local Centre
Convenience Store £0 £0
Villages
Convenience store £0 £0
Out of Centre
Retail Warehousing £0 £0
Superstore £165 £80
Supermarket £0 £0
Convenience Store £0 £0
Care homes £0 £0
All other commercial uses £0 £0

Derbyshire Dales District Council
55
8. Strategic Site Sampling
National Planning Practice Guidance recommends that viability evidence prepared in support of
CIL should involve sampling of sites from its area:
“A charging authority should directly sample an appropriate range of types of sites across its
area, in order to supplement existing data. This will require support from local developers. The
exercise should focus on strategic sites on which the relevant Plan (the Local Plan in England,
Local Development Plan in Wales, and the London Plan in London) relies, and those sites where
the impact of the levy on economic viability is likely to be most significant (such as brownfield
sites)” Paragraph: 019 Reference ID: 25-019-20140612.
Whilst the area wide viability model presented earlier in this report is based on area wide
schemes, those schemes are nonetheless based on typologies of sites and developments either
already underway or anticipated to come forward through the Local Plan in Derbyshire Dales.
Moreover the appraisal assumptions selected have been devised with in-built contingency to
cater for a range of circumstances. They therefore provide a robust basis from which to draw
conclusions on viability.
However, there is merit in assessing viability on an individual site basis to test and reinforce the
evidence, particularly in relation to the various large scale site allocations proposed as part of
the Draft Local Plan. Large scale sites can experience a higher level of cost due to the need to
open up a site for development, on site planning obligations and longer lead-in and delivery
times. As a result the economics of development can vary when compared with smaller sites.
These matters are examined in this section of the report.
A sample of sites have been chosen based on those major allocations which form a key part of
the Local Plan’s housing delivery. Housing sites have been prioritised over commercial since it
is housing development which will bear the majority of Local Plan and CIL standards. A number
of the sites are identified as mixed use developments and in this case a land sale for the
employment land has been assumed alongside the build out of the housing (much in the way a
housebuilder would approach the delivery of a residential led mixed use site). The following nine
sites have been selected:

Derbyshire Dales District Council
56
Table 8.1: Strategic Sites Selected for Viability Analysis
Figure 8.1 overleaf illustrates the location of each of the selected strategic sites. All of the sites
are located in Value Area 2 with the exception of Land at Halldale Quarry and Land off Gritstone
Road and Pinewood Road which are located in the low Value Area 3.
Derbyshire Dales District Council has provided information on each of the development sites
including the site size and the housing numbers proposed. The strategic site development
policies have also been reviewed and used to inform the development appraisal assumptions.
Fore Consulting has provided indicative, high level cost assumptions on infrastructure / access
improvements for each site. High level, indicative cost advice has been secured from Cushman
& Wakefield’s in house quantity surveyor on abnormal costs to supplement these infrastructure
costs.
Development appraisals have been produced using Argus Developer software incorporating the
appropriate level of CIL for each development based on the proposed CIL rates in Table 7.2.
Argus Developer provides a period by period residual development appraisal cashflow which
enables the costs and revenues from a development to be modelled over time with the residual
land price being inserted at the outset of the development programme.
Appendix 5 provides site proformas detailing each of the sites together with appraisal
assumptions and appraisal summaries.
Ref Address Town Gross area (ha)
Capacity /No
of units Brownfield Greenfield 1 2 3
SHLAA167 Leys Farm, Ashbourne Ashbourne 15.59 115 X X
SHLAA241 Land to the rear of RBS Darley Dale Darley Dale 10.18 143 X X X
SHLAA266 Land at Ashbourne Airfield, Ashbourne Phase 1 Ashbourne 367 X X
SHLAA266 Land at Ashbourne Airfield, Ashbourne Phase 2 Ashbourne 1100 X X
SHLAA269 Land off Middleton Road and Cromford Road, Wirksworth Wirksworth 9.04 126 X X
SHLAA281 Land at A6 (Stancliffe Quarry), Dale Road North, Darley DaleDarley Dale 10.15 100 X X
SHLAA435 Land at Halldale Quarry, Matlock Spa Road, Matlock Matlock 7.9 220 X X
SHLAA473 Land at Middle Peak Quarry, Wirksworth Wirksworth 72 645 X X X
SHLAA 224 Land off Gritstone Road / Pinewood Road, Matlock Matlock 20.8 430 X X
Type Value area
49.9

Derbyshire Dales District Council
57
Figure 8.1: Location of Strategic Sites

Derbyshire Dales District Council
58
8.1. Appraisal Assumptions
The development assumptions and appraisals for each of the strategic sites are tabled in
Appendix 5. The key differences in variables to those in the area wide analysis are:
We have tailored the delivery programme for each strategic site to reflect the number of
units being delivered. However the principle of a six month lead-in prior to construction
with sales staggered six months after construction commencement has been applied
across all sites.
Indicative cost assumptions have been made for on-site contributions for site specific S106
payments and Local Plan Policy standards as opposed to the application of a general
allowance of £1,000 per unit in the area wide viability analysis. Cost assumptions are
based on advice provided by Cushman and Wakefield’s in house QS and Fore Consulting.
A Community Infrastructure Levy has been incorporated at the appropriate level as
detailed in the preceding chapter. The timing of payments has been phased (with a pro
rata attribution according to the level of houses payable at the commencement of each
phase).
Professional fees have been increased from 8% to 12% to reflect the requirements for
masterplans and other technical studies on larger scale sites.
Contingencies have been increased from 3% to 5% to reflect the increased risk in
delivering large scale development sites.
Capital receipts from the disposal of land for employment are phased with receipts profiled
at the commencement of each development phase.
An affordable housing contribution of 30% is assumed. This incorporates a mix of
affordable rent (80%) and shared ownership (20%) with transfer values at 70% OMV for
shared ownership and 50% OMV for affordable rent.
Sites have been assessed to determine their infrastructure and abnormal costs in
accordance with site masterplans (where available) and Local Plan policies. This is based
on advice provided by Fore Consulting in respect of infrastructure requirements and
Cushman & Wakefield Cost Consultancy. However it should be noted that the costs are
indicative / high level as they have not been provided without the benefit of detailed
feasibility or site investigations and as such, they are not comprehensive or definitive and
exclude certain abnormal costs that may be necessary in order to deliver the development
scheme.
Build costs have been adjusted downwards from the BCIS level to a volume house builder
rate of £1022 per sq m (£95 per sq ft) in accordance with cost advice. A 0.5% increase on
this level has been applied for ‘accessible homes’ in accordance with the effect of the Local
Plan policy

Derbyshire Dales District Council
59
A minimum net land value benchmark of £494,200 per ha has been referenced to reflect
the minimum price for an un-serviced site. However for reference the benchmark for a full
serviced site free from abnormals has also been included.
8.2. Results
A summary of the results of the development appraisals illustrating the residual land value of
each of the strategic development sites is presented in Table 8.2 below. The appraisals have
been modelled at the two density scenarios to illustrate the impact on net land values.
Table 8.2: Results of Strategic Site Viability Analysis
30 dwellings per hectare
40 dwellings per hectare
The results illustrate that the residual land values per hectare achieved for each of the strategic
sites are above the range of £619,325 - £1,195,450 per hectare (£250,627 - £483,772 per acre).
All of the strategic sites tested have the capacity to support CIL, affordable housing at 30% and
payments towards policy requirements such as green infrastructure / open space provision and
SHLAA
Reference
Site Value
Area
Net site
Area
(Hectares)
Residual
Land Value
(£)
Residual
Land Value
per hectare
(£)
Benchmark
minimum
land value
per hectare
(£)
Benchmark
for
serviced
site free
from
abnormals
(£)SHLAA167 Leys Farm, Ashbourne 2 3.8 £2,651,011 £691,568 £494,200 £1,070,000
SHLAA241 Land to the rear of RBS, Darley Dale 2 4.8 £2,952,114 £619,325 £494,200 £1,070,000
SHLAA266 Land at Ashbourne Airfield, Ashbourne Phase 1 2 12.2 £14,624,343 £1,195,450 £494,200 £1,070,000
SHLAA266 Land at Ashbourne Airfield, Ashbourne Phase 2 2 36.7 £38,112,597 £1,039,434 £494,200 £1,070,000
SHLAA269 Land off Middleton Road and Cromford Road, Wirksworth 2 4.2 £4,207,227 £1,001,721 £494,200 £1,070,000
SHLAA281 Land at A6 (Stancliffe Quarry), Dale Road North, Darley Dale 2 3.3 £2,394,525 £718,358 £494,200 £1,070,000
SHLAA435 Land at Halldale Quarry, Matlock Spa Road, Matlock 3 7.3 £5,925,284 £807,993 £494,200 £963,900
SHLAA473 Land at Middle Peak Quarry, Wirksworth 2 21.5 £17,926,512 £833,791 £494,200 £1,070,000
SHLAA 224 Land off Gritstone Road / Pinewood Road, Matlock 3 14.3 £9,299,796 £648,823 £494,200 £963,900
SHLAA
Reference
Site Value
Area
Net site
Area
(Hectares)
Residual
Land Value
(£)
Residual
Land Value
per hectare
(£)
Benchmark
minimum
land value
per hectare
(£)
Benchmark
for
serviced
site free
from
abnormals
(£)
SHLAA167 Leys Farm, Ashbourne 2 2.9 £2,651,011 £922,091 £494,200 £1,070,000
SHLAA241 Land to the rear of RBS, Darley Dale 2 3.6 £2,952,114 £825,766 £494,200 £1,070,000
SHLAA266 Land at Ashbourne Airfield, Ashbourne Phase 1 2 9.2 £14,624,343 £1,593,934 £494,200 £1,070,000
SHLAA266 Land at Ashbourne Airfield, Ashbourne Phase 2 2 27.5 £38,112,597 £1,385,913 £494,200 £1,070,000
SHLAA269 Land off Middleton Road and Cromford Road, Wirksworth 2 3.2 £4,207,227 £1,335,628 £494,200 £1,070,000
SHLAA281 Land at A6 (Stancliffe Quarry), Dale Road North, Darley Dale 2 2.5 £2,394,525 £957,810 £494,200 £1,070,000
SHLAA435 Land at Halldale Quarry, Matlock Spa Road, Matlock 3 5.5 £5,925,284 £1,077,324 £494,200 £963,900
SHLAA473 Land at Middle Peak Quarry, Wirksworth 2 16.1 £17,926,512 £1,111,722 £494,200 £1,070,000
SHLAA 224 Land off Gritstone Road / Pinewood Road, Matlock 3 10.8 £9,299,796 £865,097 £494,200 £936,900

Derbyshire Dales District Council
60
on site infrastructure such as cycle paths, access improvements and SUDS or attenuation tanks
to mitigate against flood risk.
It should be noted that there may be additional costs required in order to bring forward
development on the strategic sites which are identified as a result of further due diligence;
however the residual land values identified allow sufficient buffer to account for a level of
additional cost without compromising the ability to deliver the Local Plan policy requirements and
CIL.

Derbyshire Dales District Council
61
9. Conclusions and Recommendations
Prior to the referendum relating to the UK’s membership of the European Union and the
associated ‘Brexit’ uncertainty, market conditions had undoubtedly improved over the last 18
months in the residential sector. Whilst the uncertainty has cast some doubt over the housing
market in the immediate short term, Derbyshire Dales is an area of relatively strong demand with
sales values generally exceeding £2,368 per sq m (£220 per sq ft). As a result, the viability
analysis that has been produced displays positive results across most residential development
typologies and in most locations.
The implications for the viability of sites put forward through the SHLAA is that they are expected
to be viable, subject to the nature and extent of individual site constraints (which have not been
examined within this report) and the level of planning obligations that the Council seeks through
the Local Plan and proposed Community Infrastructure Levy.
The viability analysis indicates that the draft Local Plan policies are broadly compliant with the
viability requirements of the NPPF although care will be required to ensure that these policies
are implemented flexibility.
In respect of CIL, the level of headroom on residential development depends to a large extent
on the affordable housing required and there is a trade-off which needs to be considered by the
Council in respect of the relative and competing needs of affordable housing versus community
infrastructure required to deliver economic growth.
At an affordable housing level of 30%, our analysis indicates there is headroom for CIL on
residential development ranging from £0 per sq m to £120 per sq m depending on location. The
strategic site sampling validates the area wide viability modelling. However, it is acknowledged
that there may be additional costs in bringing forward the strategic sites as additional information
is made available in terms of deliverability.


Derbyshire Dales District Council
Appendix 1: Open space and recreational standards

Derbyshire Dales District Council
Equipment costs
Category
Sq m per
dwelling
requirement
in Local Plan*
Cost per sq
m**
Cost per
dwelling General
Large sites (500
units or more) Assumptions
Children's play 0.93 105.00£ 97.65£ S106 S106 On site or nearby off site
Outdoor sports facilities 42.43 40.00£ 1,697.20£ CIL CIL
No guidance in supportive text
but assumed from wording of
Policy H13 that scale will
dictate off site pooled
contribution via CIL
Parks and gardens 19.03 15.00£ 285.45£ CIL S106
Wording of supporting text
indicates that this will be a
general contribution therefore
it is envisaged this will be via
CIL except for large scale sites
Semi natural green space 32.71 10.00£ 327.10£ excluded excluded
Amenity green space 29.93 12.00£ 359.16£ excluded excluded
Allotments 3.94 15.00£ 59.10£ CIL S106
Civic Space 0.23 20.00£ 4.60£ CIL S106
Sports Halls 41.7 960.00£ 40,032.00£ CIL CIL
Swimming Pools 22.7 2,400.00£ 54,480.00£ CIL CIL
Fitness provision 1,400.00£ -£ CIL CIL
* land except in case of swimming pools, sports halls and fitness provision which is assumed to be floor area of buildings
** costs based on SPONS handbook
Equipment costs per dwelling
General sites 97.65£
Large scale sites 446.80£
Land costs
Land required for general sites 0.93
Land required for large scale sites 24.13
Assume existing use value - agricultural
per ha 25,000£
per sq m 2.5
Cost of additional land per dwelling for
general sites 2.33£
Cost of additional land per dwelling for
large sites 60.33£
Commuted sum for maintenance
Cost per sq m £1.60
Commuted cost per dwelling (general) £1.49
Commuted cost per dwelling (large sites) £38.61
Total cost impact per dwelling
Total cost per dwelling (general) 101.46£
Total cost per dwelling (large sites) 545.73£
S106 or CIL (assumption of how
these requirements will be
applied)
Wording of supporting text
states that 'towns and villages
across plan area have
access…so contributions will
not be sought'.
Wording of supporting text
indicates that this will be a
general contribution therefore
it is envisaged this will be via
CIL except for large scale sites
No guidance in supportive text
but assumed from wording of
Policy H13 that scale will
dictate off site pooled
contribution via CIL

Derbyshire Dales District Council
Appendix 2: Market evidence
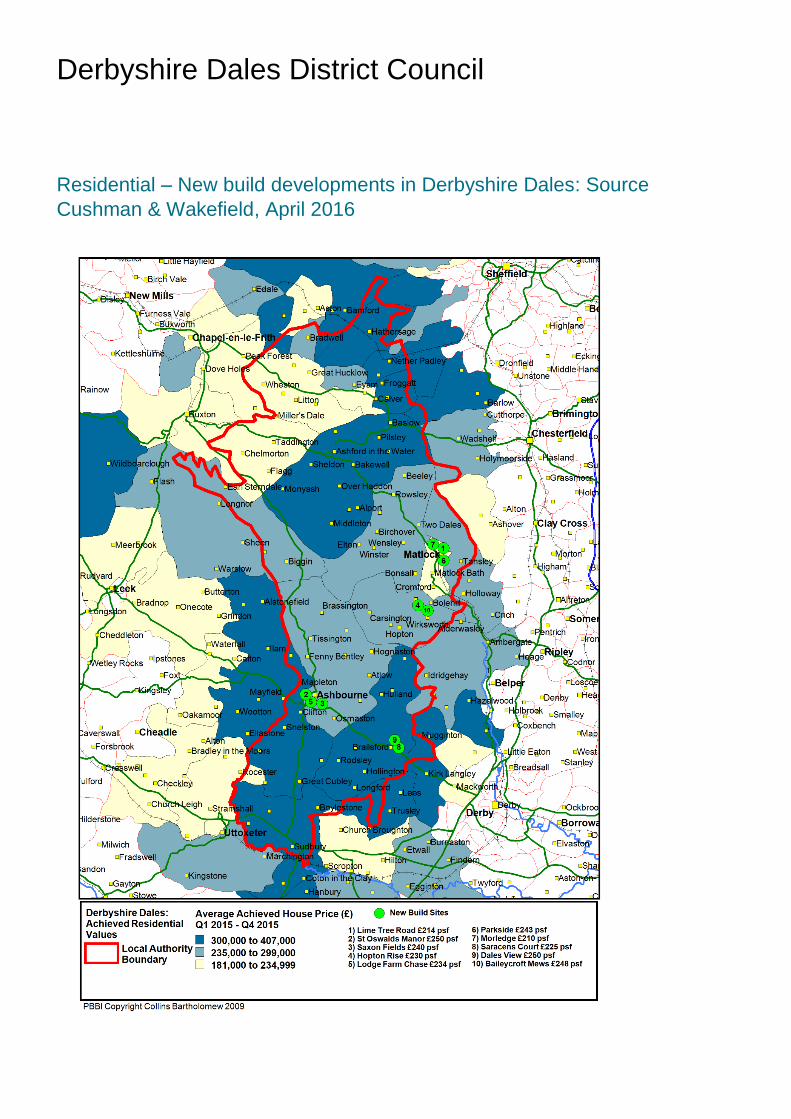
Derbyshire Dales District Council
Residential – New build developments in Derbyshire Dales: Source
Cushman & Wakefield, April 2016


Derbyshire Dales District Council
Developer Number of Beds Transaction Date Sales Price Achieved (£) Area (sqft) £/sqft Date Address Sold Price (£) Area (sqft) £ Psf Overall Averages
5 bed detached not sold £575,000 1700 £338.24 11-Dec-15 111 lime tree road 525,000£ 2497 210.25£
5 bed detached not sold £550,000 1600 £343.75 04-Dec-15 109 line tree road 545,000£ 2497 218.26£
5 bed detached not sold £550,000 1600 £343.75
£341.91 Average 214.26£
plot 1 - 4 bed eastcoat Feb-15 £450,000 1683 £267.38 Dec-15 16 spire close 345,000£ 1399 246.60£
plot 5 - 4 bed detached astley Oct-14 £325,000 1415 £229.68 Nov-15 12 spire close 500,000£ 1948 256.67£
plot6 - 4 bed detached didbrook Oct-14 £425,000 1821 £233.39 Oct-15 11 spire close 485,000£ 1991 243.60£
plot 7 - 5 bed detached Oct-14 £450,000 1959 £229.71 Aug-15 18 spire close 340,000£ 1399 243.03£
plot 8 Oct-14 £425,000 1821 £233.39 Jun-15 2 spire close 520,000£ 1948 266.94£
plot 9 - corbrideg 5 bed detached Oct-14 £495,000 2033 £243.48 Jun-15 9 spire close 495,000£ 2023 244.69£
plot 11 tunstall 5 bed detached Oct-14 £485,000 1987 £244.09
corbridge last week £550,000 2033 £270.54
plot 6 astley this month £345,000 1415 £243.82
plot 17 didbrook Mar-15 £435,000 1821 £238.88
astley Feb-14 £340,000 1415 £240.28
Average £243.15 Average 250.26£ £245.66
3 bed semi 2015 £191,250 850 £225.00 Nov-15 10 tutbury hollow 325,000£ 1345 241.64£
3 bed detached 2015 £215,250 1050 £205.00 Nov-15 5 tutbury hollow 290,000£ 1173 247.23£
4 bed detacvhe 2015 £249,550 1150 £217.00 Oct-15 14 tutbuiy hollow 197,950£ 840 235.65£
4 bed mid 2015 £297,000 1350 £220.00 Oct-15 4 tutbury hollow 320,000£ 1313 243.72£
5 bed detached 2015 £445,050 2150 £207.00 Oct-15 6 tutbury hollow 197,950£ 840 235.65£
Oct-15 8 tutbury hollow 197,950£ 840 235.65£
Average £214.80 Average 239.92£ £228.50
Corfon 4 bed detached Dec 14 - present £365,000 1344 £271.58
aston 4 bed Dec 14 - present £384,950 1597 £241.05
milton 3 bed mid terr Dec 14 - present £210,000 1001 £209.79
milton 3 bed mid terr Dec 14 - present £220,000 1001 £219.78
shirebridge 4 bed semi Dec 14 - present £265,000 1426 £185.83
lichfield 3bed link detached Dec 14 - present £229,000 1000 £229.00
belmoor 4bed link detached Dec 14 - present £359,950 1350 £266.63
penrose 3 bed end terrace Dec 14 - present £225,000 1001 £224.78
milton 3 bed end terrace Dec 14 - present £225,000 1001 £224.78
milton 3 bed semi Dec 14 - present £225,000 1001 £224.78
Average £229.80 £229.80
darwin 3 bed detch jan 15 - present £234,950.00 921 £255.10 Dec-15 11 bower close 284,000£ 1227 231.46£
alwells 3 bed detached jan 15 - present £239,950.00 960 £249.95 Dec-15 1 bower close 199,950£ 818 244.44£
radcliffe4 bed detach jan 15 - present £274,950.00 1070 £256.96 Dec-15 13 bower close 299,950£ 1345 223.01£
crompton 4 bed detach jan 15 - present £325,000.00 1341 £242.36 Nov-15 6 bower close 299,950£ 1345 223.01£
darwin 3 bed detch £229,950 921 £249.67 Nov-15 5 bower close 291,900£ 1227 237.90£
rydle 2 bed end terrace £172,950 657 £263.24 Oct-15 3 bower close 199,950£ 818 244.44£
Oct-15 7 bower close 264,950£ 1076 246.24£
Aug-15 4 bower close 299,950£ 1345 223.01£
Jun-15 8 bower close 229,950£ 958 240.03£
Jun-15 2 bower close 310,000£ 1345 230.48£
Average £251.09 Average 234.40£ £241.33
New Sold Prices
Lime Tree Road, Matlock, DE4 3DU (asking prices only, 3 one off new build properties)
4) Wheeldon
Hopton Rise, Porter Lane, Middleton-by-wirksworth Derbyshire DE4, DE4 4LS- 47 dev - 12 sold
5) Miller Homes
Lodge Farm Chase, Ashbourne, 38 dev, 4 legally, 7 on going sales
1) Willersley
Construction
2) Bloor Homes
St Oswalds Manor, Belle Vue Road, Ashbourne, DE6 1AU
3) Radleigh Homes
Saxon Fields, Wyaston Road, Ashbourne, DE6

Derbyshire Dales District Council
2 bed flat Nov-14 £205,000 807 £254.03
2 bed flat Oct-14 £200,000 861 £232.29
Average £243 £243
42 -2 bed flat Sep-14 £125,000 667 £187.41
50 - 2 bed flat Apr-14 £125,000 667 £187.41
25 morledge - Detached Mar-15 £275,950 1270 £217.28
4 morledge - detached jan 15 - present £295,950 1270 £233.03
6 vale rise Feb-14 £285,950 1270 £225.16
Average £210 £210.06
6 - 3 bed detached Sep-14 £395,000 1894 £208.55
5 - 4 bed detached Aug-14 £435,000 1808 £240.60
Average £224.58 £224.58
Wells 4 bed detached 340,000£ 1344 252.98
Mitford 4 bed detached 340,000£ 1380 246.38
Chatsworth 5 bed detached 475,000£ 1885
Rosebury 5 bed detached 499,000£ 1983 251.64
Chichester 5 bed 1885
Buchan 4 bed 1264
darwin 3 bed detch 921
Nevis 3 bed 767
Rydal 2 bed 567
Average 250.33 250.33
162500 £154,375.00 592 260.77
165000 £156,750.00 592 264.78
162500 £154,375.00 592 260.77
162500 £154,375.00 592 260.77
200000 £190,000.00 850 223.53
200000 £190,000.00 936 202.99
220000 £209,000.00 807 258.98
Average 247.51 247.51
10) Rightmove (Fidler
Taylor)
Baileycroft Mews, Cemetry Lane, Wirksworth, DE4 4FZ
Luke Lane, Dales View, Brailsford, DE6 3BY
9) Miller Homes
RIGHTMOVE,
NETHOUSEPRICE &
ZOOPLA
COMPARABLES
6) Parkside, old englishe road, Matlock, DE4 3SX
7) Morledge, Matlock DE4 3SD (William Davis Homes)
8) Saracens Court, Brailsford, DE6 3DX

Derbyshire Dales District Council
Industrial transactions: Source Estates Gazette, May 2015
Transaction type
Address Deal/Auction date
Use type Total space Rental income
Size (sq m) Size(sq ft) per annum
per sq m per sq ft
Lease Unit B, Brookfield Industrial Estate, Tansley View, Old Coach Road, Tansley, Matlock, Derbyshire, DE4 5ND
24/03/2015 Industrial / Distribution
152 1,640 £12,000 £78.79 £7.32
Lease Ground, 2 North Leys, Ashbourne, Derbyshire, DE6 1DQ
01/02/2015 Industrial / Distribution
204 2,193 £9,000 £44.18 £4.10
Lease Unit 3, Kingsfield Industrial Estate, Derby Road, Wirksworth, Matlock, Derbyshire, DE4 4BG
24/11/2014 Industrial / Distribution
486 5,228 £15,000 £30.88 £2.87
Lease Unit 7, Kingsfield Industrial Estate, Derby Road, Wirksworth, Matlock, Derbyshire, DE4 4BG
08/09/2014 Industrial / Distribution
400 4,307 £12,000 £30.03 £2.79
Lease Workshop at Midbrooke Building, Industrial Unit, Intakes Lane, Turnditch, Belper, Derbyshire, DE56 2LU
30/10/2013 Industrial / Distribution
204 2,197 £12,000 £58.88 £5.47
Lease Old Hall Farm, Hales Green, Yeaveley, Ashbourne, Derbyshire, DE6 2DS
06/08/2013 Industrial / Distribution
308 3,310 £7,500 £24.43 £2.27
Lease Airfield Industrial Estate, Blenheim Road, Ashbourne, Derbyshire, DE6 1HA
06/11/2012 Industrial / Distribution
701 7,549 £40,000 £57.04 £5.30
Lease Unit 1, Runway Business Park, Moor Farm Road, Airfield Industrial Estate, Ashbourne, Derbyshire, DE6 1HD
20/04/2012 Industrial / Distribution
285 3,072 £12,500 £43.80 £4.07

Derbyshire Dales District Council
Office transactions: Source Estates Gazette, May 2015
Transaction Deal/Auction Total space Rental income
type Address date Use type
Size Size(sq ft) per annum
per sq m per sq ft
Lease Offices, 5a St John Street, 5a St. John Street, Ashbourne, Derbyshire, DE6 1GP
15/08/2014 Office 24 262 £6,749 £277.28 £25.76
Lease Units 3 & 4 - Ground Floor, Waterside Business Park - Spire House, Waterside Road, Ashbourne, Derbyshire, DE6 1DG
08/05/2014 Office 294 3,163 £45,000 £153.14 £14.23
Lease 24 Market Place, Ashbourne, Derbyshire, DE6 1HQ
19/02/2014 Office 122 1,312 £9,000 £73.84 £6.86
Lease GF Suite, Compton Offices, King Edward Street, Ashbourne, Derbyshire, DE6 1BW
27/01/2014 Office 42 448 £7,000 £168.19 £15.63
Lease Unit 1a - Ground Floor, Airfield Industrial Estate - Albany Court, Moor Farm Road, Airfield Industrial Estate, Ashbourne, Derbyshire, DE6 1HD
01/12/2012 Office 133 1,430 Not quoted
Lease 1 Parkhead Road, Causeway Lane, Crown Square, Matlock, Derbyshire, DE4 3AR
15/12/2011 Office 55 592 £5,028 £90.96 £8.45
Lease Unit 8, Lime Tree Business Park, Lime Tree Road, Matlock, Derbyshire, DE4 3EJ
15/11/2011 Office 63 682 £6,000 £94.72 £8.80
Lease Unit 9, Lime Tree Business Park, Lime Tree Road, Matlock, Derbyshire, DE4 3EJ
15/11/2011 Office 63 682 £6,000 £94.72 £8.80
Lease 42a St John Street, Ashbourne, Derbyshire, DE6 1GH
01/06/2011 Office 78 844 £6,000 £76.42 £7.10
Lease Unit 3 - Ground Floor, Waterside Business Park - Spire House, Waterside Road, Ashbourne, Derbyshire, DE6 1DG
26/05/2011 Office 94 1,011 £14,154 £150.70 £14.00

Derbyshire Dales District Council
Retail transactions: Source Estates Gazette, May 2015
Transaction type
Address Deal /Auction date
Use type
Total space Rental income
Size (Sq m)
Size (sq ft)
per annum per sq m per sq ft
Lease Unit 7, Shawcroft Centre, Shawcroft, Ashbourne, Derbyshire, DE6 1GD
15/11/2014 Retail 79 849 £12,650 £160.38 £14.90
Lease Ground, 8 Firs Parade, Matlock, Derbyshire, DE4 3AS
01/09/2014 Retail £13,500
Lease 31 Dale Road, Matlock, Derbyshire, DE4 3LT 28/08/2014 Retail 18 196 £6,000 £329.51 £30.61
Lease Ground, 35 Dale Road, Matlock, Derbyshire, DE4 3LT
28/08/2014 Retail 29 310 £8,000 £277.78 £25.81
Lease Entire Building, 25 Dig Street, 25 Dig Street, Ashbourne, Derbyshire, DE6 1GF
15/07/2014 Retail 319 3,436 £25,000 £78.32 £7.28
Lease Ground, 15 Firs Parade, Matlock, Derbyshire, DE4 3AS
10/02/2014 Retail 68 733 £10,600 £155.66 £14.46
Lease Ground, 40-42 North Parade, Matlock Bath, Matlock, Derbyshire, DE4 3NS
01/10/2013 Retail 108 1,164 £16,500 £152.58 £14.18
Lease Unit 3, The Riverside Centre, South Parade, Matlock Bath, Matlock, Derbyshire, DE4 3NR
15/08/2013 Retail 74 796 £10,000 £135.23 £12.56
Lease Unit 10, Shawcroft Centre, Shawcroft, Ashbourne, Derbyshire, DE6 1GD
25/04/2013 Retail 108 1,165 £12,717 £117.50 £10.92
Lease 19 Firs Parade, Matlock, Derbyshire, DE4 3AS 10/11/2012 Retail 63 680 £12,000 £189.95 £17.65
Lease Unit 5, Waterside Retail Park, Highfield Road, Ashbourne, Derbyshire, DE6 1DG
15/04/2012 Retail 373 4,013 £66,215 £177.61 £16.50
Lease 5 Dig Street, Ashbourne, Derbyshire, DE6 1GF 28/10/2011 Retail 100 1,075 £15,000 £150.20 £13.95
Lease 5a St John Street, 5a St. John Street, Ashbourne, Derbyshire, DE6 1GP
15/10/2011 Retail 94 1,014 £25,000 £265.38 £24.66
Lease Unit 5, Shawcroft Centre, Shawcroft, Ashbourne, Derbyshire, DE6 1GD
05/09/2011 Retail 151 1,626 £17,000 £112.54 £10.46
Lease Unit 1, Wellington Yard, St John Street, Ashbourne, Derbyshire, DE6 1GH
01/05/2011 Retail 65 699 £7,500 £115.49 £10.73

Derbyshire Dales District Council
Leisure transactions: Source Estates Gazette, May 2015
Transaction Auction Deal/Auction Total space
type sale status
Address date Use type Sub use type
Size UoM Size(sq ft)
Price
Auction Sold New Bath Hotel, New Bath Road, Matlock Bath, Matlock, Derbyshire, DE4 3PX
12/02/2015 Hotel Hotels (C1) £930,000
Auction Sold 76 Jackson Road, Matlock, Derbyshire, DE4 3JQ
10/07/2014 General, Hotel
Residential (C3), Hotels (C1)
£133,000
Auction Sold Hope & Anchor, Market Place, Wirksworth, Matlock, Derbyshire, DE4 4ET
14/10/2013 Drinking Establishment (Pub/Bar)
Leisure (A4)
£270,000
Auction Sold Hope & Anchor, Market Place, Wirksworth, Matlock, Derbyshire, DE4 4ET
09/09/2013 Drinking Establishment (Pub/Bar), General
Leisure (A4), Residential (C3)
£249,000

Derbyshire Dales District Council
Appendix 3: Summary of stakeholder responses to questionnaire survey

Derbyshire Dales District Council
Written responses
Question
number Question
Name of respondee Yes NO
Emery Planning See letter dated 12 June 2015 attached
William Davies X
The Guinness Partnership X Generally yes however;
Does the methodology reflect the complexity/timing in developing rural housing,
landowner’s aspirations on one hand and PPPA on the other with the restrictions and
covenants imposed?
Some of these issues are looked at in more detail later in this questionnaire and if the
tests reflect both then yes the methodology is ok.
NCHA X
Acclaim Housing Group Limited X
Fisher German LLP X
Radleigh Group Limited X Within the valuation process you do need to make an allowance for abnormal costs
associated with bring any development site forward.
Westleigh Partnership Limited X
Emery Planning See letter dated 12 June 2015 attached
William Davies X
The Guinness Partnership X While these are probably reflective of the average values in these areas, what might be
different is the volumes of transactions in the higher value areas are probably very low
which might skew the analysis.
NCHA X
Acclaim Housing Group Limited X
Fisher German LLP X
Radleigh Group Limited X
Westleigh Partnership Limited X
Quantitative Response
Do you agree with
the viability testing
methodology listed
above?
Do the above value
areas adequately
cover the range of
market areas
currently in the
District?
2.1
3.1

Derbyshire Dales District Council
Emery Planning See letter dated 12 June 2015 attached
William Davies X Density shouold be nearer 30 DPM or lower. Levels play a significant part in Derbyshire
Dales. The price bands are too great. I would rank:
Ashbourne and Villages - Highest priced area
Matlock and Villages - second priced area
Wirksworth and Villages - lowest priced area
The Guinness Partnership X A straight average density might not be reflective of the build in these areas, on the
smaller sites, [which might be rural] densities could be lower, given topography, likely
site characteristics, construction issues and demand etc. and the larger sites, if sites of
that size become available may be would cater for the high end of the market with very
much reduced densities for more executive type homes. You might find 35 would be
appropriate for schemes 4-6 but lower at either end
NCHA X
Acclaim Housing Group Limited X Value areas appear to be relevant and appropriate, but I am involved in affordable
housing delivery only. Open market valuation levels across the district are not an aspect
of my day to day work.
On unit mix for affordable schemes I would typically expect to see more emphasis on
smaller housetypes, including some one and two bed apartments on affordable housing
developments or schemes providing affordable homes through S106. 10% of the overall
mix on larger sites would not be unusual.
Fisher German LLP X Densities should be lower – Closer to 25dph.
Radleigh Group Limited X Your assessment should include sites which have detailed planning permission, where we feel the
actual densities are far lower than suggested above.
Furthermore we would query the sales prices going forward into the new plan period as at present
there is a demand which raises house prices. With more development sites coming on board this
will create competition whereby this will force sales prices down. This needs to be allowed for.
Do these figures make an allowance on just new build or second hand properties too?
Westleigh Partnership Limited X Affordable - 1 BF x 10%
- 2 BH x 45%
- 3 BH x 20%
- 2BB x 15%
- 4 BH x 10%
100%
Spec - 2BH S x 10%
- 3 BH S x 10%
- 3 BH D x 10%
- 4 BH D x 50%
- 5 BH D x 20%
100%
Do the selection of
site sizes, dwelling
mixes and densities
reflect an
appropriate range
for the District
3.2

Derbyshire Dales District Council
Emery Planning See letter dated 12 June 2015 attached
William Davies X House Type Size (Sq ft)
1 bed flat 550
2 bed flat 650
2 bed house 800
3 bed house 1,000
4 bed house 1,300
5 bed house 2,000
The Guinness Partnership Use NDSS - Would it be appropriate to use national space standards 2015
NCHA X
Acclaim Housing Group Limited X 3 Bed house - Size 82 sq m
Fisher German LLP X
Radleigh Group Limited X 1 Bed flat - 570 sq ft
2 bed flat - 650/700 sq ft
2 bed house - 690 sq ft
3 bed house - 850 sq ft
4 bed house - 1,350 sq ft
5 bed house - 2,000 sq ft
Westleigh Partnership Limited X 1 Bed Flat - 48 sq m
2 Bed Flat - 56 sq m
2 Bed House - 68 sq m
3 Bed House - 84 sq m
4 Bed House - 90-140 sq m
5 Bed House - 130 - 150 sq m
Emery Planning See letter dated 12 June 2015 attached
William Davies X Value Area 1 - £225 psf
Value Area 2 - £210 psf
Value Area 3 - £200 psf
Value Area 4 - £190 spf
Value Area 5 - £180 psf
The Guinness Partnership X
NCHA No Response
Acclaim Housing Group Limited X
Fisher German LLP X Value Area 1 - £230 psf
Value Area 5 - £175 psf
Range of £175-£230 psf. Don’t agree with the value areas.
Radleigh Group Limited X Value Area 1 - £225 psf
Value Area 2 - £190 psf
Value Area 3 - £170 psf
Westleigh Partnership Limited X Top Value = £280 psf
Mid Value = £220 psf
Low Value = £160 psf
3.3
Do you agree with
our size assumptions
in the above table?
3.4
Do you agree with
the sales value
assumptions?

Derbyshire Dales District Council
Emery Planning See letter dated 12 June 2015 attached
William Davies X Other costs / appraisal assumptions - Professional fees (inc planning) 8% on
construction costs
The Guinness Partnership X While I can agree with the notional sales values and build costs, the added complexity
of developing within the national park needs to be assessed and requirements from
PPPA and some of the covenants and restrictions that can be applied impact on
mortgagability and development costs.
Smaller schemes, particularly rural within the PPPA are typically very much more
expensive to develop and a separate section/weighting may be applied here?
NCHA X
Acclaim Housing Group Limited X 3 bed house sizes look generous. Affordable 3 bed homes are typically in the range 80-
85 sqm. Other housetypes size assumptions look reasonable but we do not develop
many 4 and 5 bed affordable homes and spec developers experience may be more
relevant.
Unable to comment meaningfully on sales values, but cost assumptions look realistic.
Fisher German LLP X Build Cost £
Houses - £100 psf
Flats - £115 psf
Radleigh Group Limited X Whilst we agree to a certain degree, we would query on how you would breakdown the build costs,
for example the cost to build to FFL and then above FFL to completion.
One assume abnormal costs are not taken into account?
Westleigh Partnership Limited X
Emery Planning See letter dated 12 June 2015 attached
William Davies Professional fees at 6% appear a little low nearer 8%
The Guinness Partnership Lead in times for smaller any rural sites may be longer than suggested
NCHA No Response
Acclaim Housing Group Limited ‘Other cost’ assumptions look generally realistic for modelling purposes on sites without
serious abnormals or infrastructure costs.
However complexity of development varies significantly from site to site, there is no
typical site in the Dales. A wide range of development factors affect development costs
across the district – topography, access, scale, ground conditions, contamination,
planning contributions.
Fisher German LLP Generally agree
Radleigh Group Limited We would suggest raising abnormal allowances to say between 12-15%.
Professional fees should also be raised given complex planning issues, including Appeal
processes and general rise in fees.
Westleigh Partnership Limited OK
Do you agree with
our cost
assumptions?
Please detail below
whether you agree
or disagree with the
assumptions
proposed in terms of
other development
costs and phasing.
Please detail
whether any other
consideration should
be taken.
3.6
3.5

Derbyshire Dales District Council
Emery Planning See letter dated 12 June 2015 attached
William Davies I cannot imagine any site in Derbyshire Dales viable with 45% affordable housing.
Target should be 30%. Affordable needs to be a mix of shared ownership, affordable
rent, social rent, low cost for sale to aid viability
The Guinness Partnership How do you intend to calculate the transfer values of affordable units?
DDDC and PPPA to comment on S106 contributions [presuming non housing related], I
feel these are low but it might be that we generally operate within the peak park which
have higher requirements and this may be a reasonable average?
NCHA In terms of tenure one significant one is not considered ie Affordable Rent whereby rent
is set at 80% of open market rent. This sometimes helps to increase transfer values but
DDDC prefer rents to be capped at Local Housing allowance which mitigates the
improvement. In terms of transfer values as a %OMV our view is:
Social Rent 45-50%
Affordable Rent 50%-55%
Intermediate ( Shared ownership) 70-75%
Acclaim Housing Group Limited Generally agree with the assumptions.
Please note that RP transfer levels are influenced by market rent levels but affordability
is tested on a site by site basis. Our approach is to ensure affordable homes remain
accessible and affordable to people in housing need. S106 offers are capped at
affordable rent levels in line with the Councils Local Housing Allowance, which can be
significantly lower than 80% of market rent levels in the higher value locations in the
district. This reduces transfer values offered to developers.
We also base shared ownership offers on an assumption that 25% equity sale is
required in higher value locations to maintain affordability for local people in lower paid
employment. This also reduces transfer values offered to developers.
Fisher German LLP No Response
Radleigh Group Limited Housing need is extremely complex within DD given a large proportion already built.
One would argue there is an oversupply and that the threshold should now be reduced
in line with other Councils in the East Midlands.
Furthermore, off site contributions should also be allowed for.
Westleigh Partnership Limited Affordable Rent
Transfer Value - 55% OMV
Shared Ownership - 65% to 70% OMV
We currently allow 3K pa but this would cover CIL as well.
Please detail below
where you agree and
disagree with the
assumptions
proposed and
whether any other
consideration should
be taken.
3.7

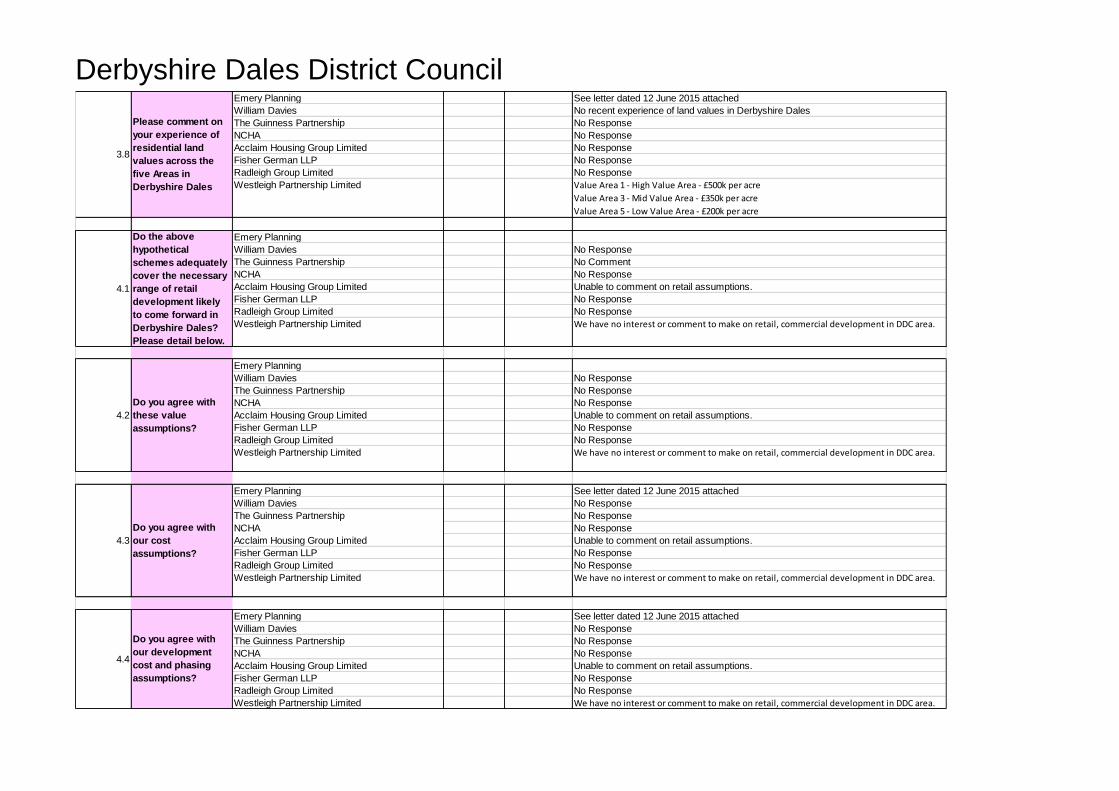
Derbyshire Dales District Council
Emery Planning See letter dated 12 June 2015 attached
William Davies No recent experience of land values in Derbyshire Dales
The Guinness Partnership No Response
NCHA No Response
Acclaim Housing Group Limited No Response
Fisher German LLP No Response
Radleigh Group Limited No Response
Westleigh Partnership Limited Value Area 1 - High Value Area - £500k per acre
Value Area 3 - Mid Value Area - £350k per acre
Value Area 5 - Low Value Area - £200k per acre
Emery Planning
William Davies No Response
The Guinness Partnership No Comment
NCHA No Response
Acclaim Housing Group Limited Unable to comment on retail assumptions.
Fisher German LLP No Response
Radleigh Group Limited No Response
Westleigh Partnership Limited We have no interest or comment to make on retail, commercial development in DDC area.
Emery Planning
William Davies No Response
The Guinness Partnership No Response
NCHA No Response
Acclaim Housing Group Limited Unable to comment on retail assumptions.
Fisher German LLP No Response
Radleigh Group Limited No Response
Westleigh Partnership Limited We have no interest or comment to make on retail, commercial development in DDC area.
Emery Planning See letter dated 12 June 2015 attached
William Davies No Response
The Guinness Partnership No Response
NCHA No Response
Acclaim Housing Group Limited Unable to comment on retail assumptions.
Fisher German LLP No Response
Radleigh Group Limited No Response
Westleigh Partnership Limited We have no interest or comment to make on retail, commercial development in DDC area.
4.1
Do the above
hypothetical
schemes adequately
cover the necessary
range of retail
development likely
to come forward in
Derbyshire Dales?
Please detail below.
Please comment on
your experience of
residential land
values across the
five Areas in
Derbyshire Dales
3.8
4.2
Do you agree with
these value
assumptions?
4.3
Do you agree with
our cost
assumptions?
4.4
Do you agree with
our development
cost and phasing
assumptions?

Derbyshire Dales District Council
Emery Planning See letter dated 12 June 2015 attached
William Davies No Response
The Guinness Partnership No Comment
NCHA No Response
Acclaim Housing Group Limited Unable to comment on retail assumptions.
Fisher German LLP No Response
Radleigh Group Limited No Response
Westleigh Partnership Limited We have no interest or comment to make on retail, commercial development in DDC area.
Emery Planning See letter dated 12 June 2015 attached
William Davies No Response
The Guinness Partnership No Response
NCHA No Response
Acclaim Housing Group Limited Unable to comment on retail assumptions.
Fisher German LLP No Response
Radleigh Group Limited No Response
Westleigh Partnership Limited We have no interest or comment to make on retail, commercial development in DDC area.
5.1
Do the above
hypothetical
schemes adequately
cover the necessary
range of office
development likely
to come forward in
Derbyshire Dales? If
not, please detail
below.
5.2
Do you agree with
these value
assumptions?
5.3
Do you agree with
our cost
assumptions?
5.4
Do you agree with
our development
cost and phasing
assumptions?

Derbyshire Dales District Council
Emery Planning See letter dated 12 June 2015 attached
William Davies No Response
The Guinness Partnership No Comment
NCHA No Response
Acclaim Housing Group Limited Unable to comment on industrial development assumptions.
Fisher German LLP No Response
Radleigh Group Limited No Response
Westleigh Partnership Limited We have no interest or comment to make on retail, commercial development in DDC area.
Emery Planning See letter dated 12 June 2015 attached
William Davies No Response
The Guinness Partnership No Response
NCHA No Response
Acclaim Housing Group Limited Unable to comment on industrial development assumptions.
Fisher German LLP No Response
Radleigh Group Limited No Response
Westleigh Partnership Limited We have no interest or comment to make on retail, commercial development in DDC area.
6.1
Do the above
hypothetical
schemes adequately
cover the necessary
range of industrial
development likely
to come forward in
the Derbyshire
Dales? If not, please
detail below.
6.2
Do you agree with
these value
assumptions?
6.3
Do you agree with
our cost
assumptions?
6.4
Do you agree with
our development
cost and phasing
assumptions?

Derbyshire Dales District Council
Emery Planning See letter dated 12 June 2015 attached
William Davies No Response
The Guinness Partnership No Comment
NCHA No Response
Acclaim Housing Group Limited Unable to comment on commercial development assumptions
Fisher German LLP No Response
Radleigh Group Limited No Response
Westleigh Partnership Limited We have no interest or comment to make on retail, commercial development in DDC area.
Emery Planning See letter dated 12 June 2015 attached
William Davies No Response
The Guinness Partnership No Response
NCHA No Response
Acclaim Housing Group Limited Unable to comment on commercial development assumptions
Fisher German LLP No Response
Radleigh Group Limited No Response
Westleigh Partnership Limited No Response
We have no interest or comment to make on retail, commercial development in DDC area.
Do you agree with
these value
assumptions?
7.1
Do the above
hypothetical
schemes adequately
cover the necessary
range of
development likely
to come forward in
the Derbyshire
Dales? If not, please
detail below.
7.2
7.3
Do you agree with
these cost
assumptions?
7.4
Do you agree with
our development
cost and phasing
assumptions?
Please comment on
your experience of
commercial land
values in Derbyshire
Dales
7.5

Derbyshire Dales District Council
Appendix 4: List of stakeholders invited to participate in viability consultation
June 2015

Organisation
Coverworld UK Ltd
The Thornhill Settlment
Fisher German
Miller Homes Ltd
Barton Willmore
Bakewell & Partners LLP
GJ Perry Planning Consultant
AMS Enterprises Ltd
Plan.it Ltd
Wheeldon Homes
Lone Star
Clowes Developments
Gleeson Strategic
Gladman Developments
William Davis
Wildgoose contruction
Radleigh Homes
Equity Housing Group
Peak District Rural HA
Guinness
East Midlands HA
Dales Housing Ltd
Acclaim Housing Group
Nottingham Community Housing Association
Derwent Living
Waterloo
Westleigh Developments
Pegasus Planning Group
Richborough Estates
Savills
Turley Associates
Alliance Planning
Planning Design Practice

Derbyshire Dales District Council
Appendix 5: Residential development appraisal results 30% Affordable
Housing

30 Dwellings per hectare
Value
Area Scheme
Site Size
(hectares)
Floor
coverage
(less AH
requirement
(Sq m)
Benchmark Land
Value per
hectare (£)
Actual
Benchmark
Land Value(£)
Residual Land
Value
(£)
Residual
Land Value
per hectare
minus
actual
benchmark
Land Value
(£)
Maximum
Available for
CIL
(£)
1 0.25 781 £1,178,100 £294,525 £599,600 £305,075 £391
2 0.50 976 £1,178,100 £589,050 £747,255 £158,205 £162
3 0.70 1,326 £1,178,100 £824,670 £1,004,458 £179,788 £136
4 1.00 1,932 £1,178,100 £1,178,100 £1,463,866 £285,766 £148
5 1.50 2,863 £1,178,100 £1,767,150 £2,179,566 £412,416 £144
6 3.00 5,794 £1,178,100 £3,534,300 £4,233,270 £698,970 £121
7 5.00 9,656 £1,178,100 £5,890,500 £6,802,146 £911,646 £94
8 10.00 19,301 £1,178,100 £11,781,000 £13,633,865 £1,852,865 £96
1 0.25 781 £1,070,000 £267,500 £490,750 £223,250 £286
2 0.50 976 £1,070,000 £535,000 £587,500 £52,500 £54
3 0.70 1,326 £1,070,000 £749,000 £785,683 £36,683 £28
4 1.00 1,932 £1,070,000 £1,070,000 £1,146,369 £76,369 £40
5 1.50 2,863 £1,070,000 £1,605,000 £1,713,321 £108,321 £38
6 3.00 5,794 £1,070,000 £3,210,000 £3,322,274 £112,274 £19
7 5.00 9,656 £1,070,000 £5,350,000 £5,337,603 -£12,397 -£1
8 10.00 19,301 £1,070,000 £10,700,000 £10,695,266 -£4,734 £0
1 0.25 781 £963,900 £240,975 £381,900 £140,925 £180
2 0.50 976 £963,900 £481,950 £427,745 -£54,205 -£56
3 0.70 1,326 £963,900 £674,730 £569,155 -£105,575 -£80
4 1.00 1,932 £963,900 £963,900 £822,176 -£141,724 -£73
5 1.50 2,863 £963,900 £1,445,850 £1,245,829 -£200,021 -£70
6 3.00 5,794 £963,900 £2,891,700 £2,410,217 -£481,483 -£83
7 5.00 9,656 £963,900 £4,819,500 £3,883,959 -£935,541 -£97
8 10.00 19,301 £963,900 £9,639,000 £7,780,450 -£1,858,550 -£96
Residential Area Wide Viability Analysis
Schemes 1-8: 30% Affordable Housing
H
i
g
h
M
e
d
i
u
m
L
o
w
e
r

Derbyshire Dales District Council
Value
Area Scheme
Site Size
(hectares)
Floor
coverage
(less AH
requirement
(Sq m)
Benchmark Land
Value per
hectare (£)
Actual
Benchmark
Land Value(£)
Residual Land
Value
(£)
Residual
Land Value
per hectare
minus
actual
benchmark
Land Value
(£)
Maximum
Available for
CIL
(£)
1 0.25 781 £1,178,100 £294,525 £559,103 £264,578 £339
2 0.50 976 £1,178,100 £589,050 £681,368 £92,318 £95
3 0.70 1,326 £1,178,100 £824,670 £913,129 £88,459 £67
4 1.00 1,932 £1,178,100 £1,178,100 £1,329,726 £151,626 £78
5 1.50 2,863 £1,178,100 £1,767,150 £1,993,275 £226,125 £79
6 3.00 5,794 £1,178,100 £3,534,300 £3,857,130 £322,830 £56
7 5.00 9,656 £1,178,100 £5,890,500 £6,187,207 £296,707 £31
8 10.00 19,301 £1,178,100 £11,781,000 £12,398,507 £617,507 £32
1 0.25 781 £1,070,000 £267,500 £450,253 £182,753 £234
2 0.50 976 £1,070,000 £535,000 £521,613 -£13,387 -£14
3 0.70 1,326 £1,070,000 £749,000 £695,450 -£53,550 -£40
4 1.00 1,932 £1,070,000 £1,070,000 £1,011,052 -£58,948 -£31
5 1.50 2,863 £1,070,000 £1,605,000 £1,519,893 -£85,107 -£30
6 3.00 5,794 £1,070,000 £3,210,000 £2,944,496 -£265,504 -£46
7 5.00 9,656 £1,070,000 £5,350,000 £4,738,493 -£611,507 -£63
8 10.00 19,301 £1,070,000 £10,700,000 £9,493,572 -£1,206,428 -£63
1 0.25 781 £963,900 £240,975 £341,403 £100,428 £129
2 0.50 976 £963,900 £481,950 £361,858 -£120,092 -£123
3 0.70 1,326 £963,900 £674,730 £478,183 -£196,547 -£148
4 1.00 1,932 £963,900 £963,900 £689,995 -£273,905 -£142
5 1.50 2,863 £963,900 £1,445,850 £1,056,434 -£389,416 -£136
6 3.00 5,794 £963,900 £2,891,700 £2,042,542 -£849,158 -£147
7 5.00 9,656 £963,900 £4,819,500 £3,276,693 -£1,542,807 -£160
8 10.00 19,301 £963,900 £9,639,000 £6,562,754 -£3,076,246 -£159
Residential Area Wide Viability Analysis
Schemes 1-8: 30% Affordable Housing
H
i
g
h
M
e
d
i
u
m
L
o
w
e
r

Value
Area Scheme
Site Size
(hectares)
Floor
coverage
(less AH
requirement
(Sq m)
Benchmark Land
Value per
hectare (£)
Actual
Benchmark
Land Value(£)
Residual Land
Value
(£)
Residual
Land Value
per hectare
minus
actual
benchmark
Land Value
(£)
Maximum
Available for
CIL
(£)
1 0.25 781 £1,178,100 £294,525 £518,605 £224,080 £287
2 0.50 976 £1,178,100 £589,050 £615,481 £26,431 £27
3 0.70 1,326 £1,178,100 £824,670 £822,460 -£2,210 -£2
4 1.00 1,932 £1,178,100 £1,178,100 £1,199,392 £21,292 £11
5 1.50 2,863 £1,178,100 £1,767,150 £1,796,352 £29,202 £10
6 3.00 5,794 £1,178,100 £3,534,300 £3,483,402 -£50,898 -£9
7 5.00 9,656 £1,178,100 £5,890,500 £5,591,234 -£299,266 -£31
8 10.00 19,301 £1,178,100 £11,781,000 £11,203,020 -£577,980 -£30
1 0.25 781 £1,070,000 £267,500 £409,755 £142,255 £182
2 0.50 976 £1,070,000 £535,000 £455,726 -£79,274 -£81
3 0.70 1,326 £1,070,000 £749,000 £606,258 -£142,742 -£108
4 1.00 1,932 £1,070,000 £1,070,000 £875,185 -£194,815 -£101
5 1.50 2,863 £1,070,000 £1,605,000 £1,327,269 -£277,731 -£97
6 3.00 5,794 £1,070,000 £3,210,000 £2,566,985 -£643,015 -£111
7 5.00 9,656 £1,070,000 £5,350,000 £4,137,790 -£1,212,210 -£126
8 10.00 19,301 £1,070,000 £10,700,000 £8,288,587 -£2,411,413 -£125
1 0.25 781 £963,900 £240,975 £300,905 £59,930 £77
2 0.50 976 £963,900 £481,950 £295,971 -£185,979 -£191
3 0.70 1,326 £963,900 £674,730 £387,939 -£286,791 -£216
4 1.00 1,932 £963,900 £963,900 £555,804 -£408,096 -£211
5 1.50 2,863 £963,900 £1,445,850 £860,809 -£585,041 -£204
6 3.00 5,794 £963,900 £2,891,700 £1,653,995 -£1,237,705 -£214
7 5.00 9,656 £963,900 £4,819,500 £2,671,667 -£2,147,833 -£222
8 10.00 19,301 £963,900 £9,639,000 £5,348,673 -£4,290,327 -£222
Residential Area Wide Viability Analysis
Schemes 1-8: 30% Affordable Housing
H
i
g
h
M
e
d
i
u
m
L
o
w
e
r

Derbyshire Dales District Council
Value
Area Scheme
Site Size
(hectares)
Floor
coverage
(less AH
requirement
(Sq m)
Benchmark Land
Value per
hectare (£)
Actual
Benchmark
Land Value(£)
Residual Land
Value
(£)
Residual
Land Value
per hectare
minus
actual
benchmark
Land Value
(£)
Maximum
Available for
CIL
(£)
1 0.25 781 £1,178,100 £294,525 £741,257 £446,732 £572
2 0.50 976 £1,178,100 £589,050 £955,158 £366,108 £375
3 0.70 1,326 £1,178,100 £824,670 £1,285,696 £461,026 £348
4 1.00 1,932 £1,178,100 £1,178,100 £1,884,794 £706,694 £366
5 1.50 2,863 £1,178,100 £1,767,150 £2,786,908 £1,019,758 £356
6 3.00 5,794 £1,178,100 £3,534,300 £5,416,277 £1,881,977 £325
7 5.00 9,656 £1,178,100 £5,890,500 £8,684,222 £2,793,722 £289
8 10.00 19,301 £1,178,100 £11,781,000 £17,405,847 £5,624,847 £291
1 0.25 781 £1,070,000 £267,500 £621,522 £354,022 £453
2 0.50 976 £1,070,000 £535,000 £779,428 £244,428 £250
3 0.70 1,326 £1,070,000 £749,000 £1,048,927 £299,927 £226
4 1.00 1,932 £1,070,000 £1,070,000 £1,528,462 £458,462 £237
5 1.50 2,863 £1,070,000 £1,605,000 £2,273,566 £668,566 £234
6 3.00 5,794 £1,070,000 £3,210,000 £4,416,408 £1,206,408 £208
7 5.00 9,656 £1,070,000 £5,350,000 £7,111,204 £1,761,204 £182
8 10.00 19,301 £1,070,000 £10,700,000 £14,207,680 £3,507,680 £182
1 0.25 781 £963,900 £240,975 £501,787 £260,812 £334
2 0.50 976 £963,900 £481,950 £603,698 £121,748 £125
3 0.70 1,326 £963,900 £674,730 £807,709 £132,979 £100
4 1.00 1,932 £963,900 £963,900 £1,179,329 £215,429 £112
5 1.50 2,863 £963,900 £1,445,850 £1,761,528 £315,678 £110
6 3.00 5,794 £963,900 £2,891,700 £3,417,267 £525,567 £91
7 5.00 9,656 £963,900 £4,819,500 £5,484,260 £664,760 £69
8 10.00 19,301 £963,900 £9,639,000 £10,989,416 £1,350,416 £70
Residential Area Wide Viability Analysis
Schemes 1-8: 30% Affordable Housing
H
i
g
h
M
e
d
i
u
m
L
o
w
e
r

Value
Area Scheme
Site Size
(hectares)
Floor
coverage
(less AH
requirement
(Sq m)
Benchmark Land
Value per
hectare (£)
Actual
Benchmark
Land Value(£)
Residual Land
Value
(£)
Residual
Land Value
per hectare
minus
actual
benchmark
Land Value
(£)
Maximum
Available for
CIL
(£)
1 0.25 781 £1,178,100 £294,525 £457,943 £163,418 £209
2 0.50 976 £1,178,100 £589,050 £539,351 -£49,699 -£51
3 0.70 1,326 £1,178,100 £824,670 £720,210 -£104,460 -£79
4 1.00 1,932 £1,178,100 £1,178,100 £1,048,724 -£129,376 -£67
5 1.50 2,863 £1,178,100 £1,767,150 £1,571,857 -£195,293 -£68
6 3.00 5,794 £1,178,100 £3,534,300 £3,047,177 -£487,123 -£84
7 5.00 9,656 £1,178,100 £5,890,500 £4,900,013 -£990,487 -£103
8 10.00 19,301 £1,178,100 £11,781,000 £9,817,844 -£1,963,156 -£102
1 0.25 781 £1,070,000 £267,500 £359,978 £92,478 £118
2 0.50 976 £1,070,000 £535,000 £395,571 -£139,429 -£143
3 0.70 1,326 £1,070,000 £749,000 £524,871 -£224,129 -£169
4 1.00 1,932 £1,070,000 £1,070,000 £760,775 -£309,225 -£160
5 1.50 2,863 £1,070,000 £1,605,000 £1,156,804 -£448,196 -£157
6 3.00 5,794 £1,070,000 £3,210,000 £2,226,536 -£983,464 -£170
7 5.00 9,656 £1,070,000 £5,350,000 £3,600,805 -£1,749,195 -£181
8 10.00 19,301 £1,070,000 £10,700,000 £7,213,046 -£3,486,954 -£181
1 0.25 781 £963,900 £240,975 £262,013 £21,038 £27
2 0.50 976 £963,900 £481,950 £251,792 -£230,158 -£236
3 0.70 1,326 £963,900 £674,730 £329,130 -£345,600 -£261
4 1.00 1,932 £963,900 £963,900 £469,404 -£494,496 -£256
5 1.50 2,863 £963,900 £1,445,850 £736,662 -£709,188 -£248
6 3.00 5,794 £963,900 £2,891,700 £1,404,314 -£1,487,386 -£257
7 5.00 9,656 £963,900 £4,819,500 £2,269,515 -£2,549,985 -£264
8 10.00 19,301 £963,900 £9,639,000 £4,543,137 -£5,095,863 -£264
Residential Area Wide Viability Analysis
Schemes 1-8: 30% Affordable Housing
H
i
g
h
M
e
d
i
u
m
L
o
w
e
r

Derbyshire Dales District Council
40 Dwellings per hectare
Value
Area Scheme
Site Size
(hectares)
Floor
coverage
(less AH
requirement
(Sq m)
Benchmark Land
Value per
hectare (£)
Actual
Benchmark
Land Value(£)
Residual Land
Value
(£)
Residual
Land Value
per hectare
minus
actual
benchmark
Land Value
(£)
Maximum
Available for
CIL
(£)
1 0.25 902 £1,178,100 £294,525 £701,227 £406,702 £451
2 0.50 1,216 £1,178,100 £589,050 £923,530 £334,480 £275
3 0.70 1,822 £1,178,100 £824,670 £1,389,115 £564,445 £310
4 1.00 2,646 £1,178,100 £1,178,100 £1,994,999 £816,899 £309
5 1.50 3,862 £1,178,100 £1,767,150 £2,903,021 £1,135,871 £294
6 3.00 7,724 £1,178,100 £3,534,300 £5,509,699 £1,975,399 £256
7 5.00 12,883 £1,178,100 £5,890,500 £8,774,117 £2,883,617 £224
8 10.00 25,809 £1,178,100 £11,781,000 £17,627,910 £5,846,910 £227
1 0.25 902 £1,070,000 £267,500 £573,722 £306,222 £339
2 0.50 1,216 £1,070,000 £535,000 £720,107 £185,107 £152
3 0.70 1,822 £1,070,000 £749,000 £1,089,959 £340,959 £187
4 1.00 2,646 £1,070,000 £1,070,000 £1,562,291 £492,291 £186
5 1.50 3,862 £1,070,000 £1,605,000 £2,280,678 £675,678 £175
6 3.00 7,724 £1,070,000 £3,210,000 £4,320,226 £1,110,226 £144
7 5.00 12,883 £1,070,000 £5,350,000 £6,931,807 £1,581,807 £123
8 10.00 25,809 £1,070,000 £10,700,000 £13,936,871 £3,236,871 £125
1 0.25 902 £963,900 £240,975 £446,216 £205,241 £228
2 0.50 1,216 £963,900 £481,950 £517,616 £35,666 £29
3 0.70 1,822 £963,900 £674,730 £785,171 £110,441 £61
4 1.00 2,646 £963,900 £963,900 £1,137,128 £173,228 £65
5 1.50 3,862 £963,900 £1,445,850 £1,657,765 £211,915 £55
6 3.00 7,724 £963,900 £2,891,700 £3,124,964 £233,264 £30
7 5.00 12,883 £963,900 £4,819,500 £5,041,292 £221,792 £17
8 10.00 25,809 £963,900 £9,639,000 £10,137,704 £498,704 £19
Residential Area Wide Viability Analysis
Schemes 1-8: 30% Affordable Housing
H
i
g
h
M
e
d
i
u
m
L
o
w
e
r

Value
Area Scheme
Site Size
(hectares)
Floor
coverage
(less AH
requirement
(Sq m)
Benchmark Land
Value per
hectare (£)
Actual
Benchmark
Land Value(£)
Residual Land
Value
(£)
Residual
Land Value
per hectare
minus
actual
benchmark
Land Value
(£)
Maximum
Available for
CIL
(£)
1 0.25 902 £1,178,100 £294,525 £653,789 £359,264 £398
2 0.50 1,216 £1,178,100 £589,050 £838,862 £249,812 £205
3 0.70 1,822 £1,178,100 £824,670 £1,263,419 £438,749 £241
4 1.00 2,646 £1,178,100 £1,178,100 £1,814,838 £636,738 £241
5 1.50 3,862 £1,178,100 £1,767,150 £2,645,988 £878,838 £228
6 3.00 7,724 £1,178,100 £3,534,300 £5,016,507 £1,482,207 £192
7 5.00 12,883 £1,178,100 £5,890,500 £8,014,070 £2,123,570 £165
8 10.00 25,809 £1,178,100 £11,781,000 £16,104,029 £4,323,029 £168
1 0.25 902 £1,070,000 £267,500 £526,283 £258,783 £287
2 0.50 1,216 £1,070,000 £535,000 £637,497 £102,497 £84
3 0.70 1,822 £1,070,000 £749,000 £963,478 £214,478 £118
4 1.00 2,646 £1,070,000 £1,070,000 £1,384,568 £314,568 £119
5 1.50 3,862 £1,070,000 £1,605,000 £2,031,082 £426,082 £110
6 3.00 7,724 £1,070,000 £3,210,000 £3,826,417 £616,417 £80
7 5.00 12,883 £1,070,000 £5,350,000 £6,134,206 £784,206 £61
8 10.00 25,809 £1,070,000 £10,700,000 £12,331,579 £1,631,579 £63
1 0.25 902 £963,900 £240,975 £398,778 £157,803 £175
2 0.50 1,216 £963,900 £481,950 £432,423 -£49,527 -£41
3 0.70 1,822 £963,900 £674,730 £661,382 -£13,348 -£7
4 1.00 2,646 £963,900 £963,900 £956,374 -£7,526 -£3
5 1.50 3,862 £963,900 £1,445,850 £1,400,715 -£45,135 -£12
6 3.00 7,724 £963,900 £2,891,700 £2,629,197 -£262,503 -£34
7 5.00 12,883 £963,900 £4,819,500 £4,272,203 -£547,297 -£42
8 10.00 25,809 £963,900 £9,639,000 £8,595,642 -£1,043,358 -£40
Residential Area Wide Viability Analysis
Schemes 1-8: 30% Affordable Housing
H
i
g
h
M
e
d
i
u
m
L
o
w
e
r

Derbyshire Dales District Council
Value
Area Scheme
Site Size
(hectares)
Floor
coverage
(less AH
requirement
(Sq m)
Benchmark Land
Value per
hectare (£)
Actual
Benchmark
Land Value(£)
Residual Land
Value
(£)
Residual
Land Value
per hectare
minus
actual
benchmark
Land Value
(£)
Maximum
Available for
CIL
(£)
1 0.25 902 £1,178,100 £294,525 £606,351 £311,826 £346
2 0.50 1,216 £1,178,100 £589,050 £753,144 £164,094 £135
3 0.70 1,822 £1,178,100 £824,670 £1,140,917 £316,247 £174
4 1.00 2,646 £1,178,100 £1,178,100 £1,635,844 £457,744 £173
5 1.50 3,862 £1,178,100 £1,767,150 £2,388,922 £621,772 £161
6 3.00 7,724 £1,178,100 £3,534,300 £4,523,058 £988,758 £128
7 5.00 12,883 £1,178,100 £5,890,500 £7,250,853 £1,360,353 £106
8 10.00 25,809 £1,178,100 £11,781,000 £14,573,765 £2,792,765 £108
1 0.25 902 £1,070,000 £267,500 £478,845 £211,345 £234
2 0.50 1,216 £1,070,000 £535,000 £550,851 £15,851 £13
3 0.70 1,822 £1,070,000 £749,000 £838,862 £89,862 £49
4 1.00 2,646 £1,070,000 £1,070,000 £1,212,323 £142,323 £54
5 1.50 3,862 £1,070,000 £1,605,000 £1,768,252 £163,252 £42
6 3.00 7,724 £1,070,000 £3,210,000 £3,328,891 £118,891 £15
7 5.00 12,883 £1,070,000 £5,350,000 £5,372,264 £22,264 £2
8 10.00 25,809 £1,070,000 £10,700,000 £10,803,853 £103,853 £4
1 0.25 902 £963,900 £240,975 £351,339 £110,364 £122
2 0.50 1,216 £963,900 £481,950 £347,540 -£134,410 -£111
3 0.70 1,822 £963,900 £674,730 £535,611 -£139,119 -£76
4 1.00 2,646 £963,900 £963,900 £782,837 -£181,063 -£68
5 1.50 3,862 £963,900 £1,445,850 £1,148,682 -£297,168 -£77
6 3.00 7,724 £963,900 £2,891,700 £2,131,456 -£760,244 -£98
7 5.00 12,883 £963,900 £4,819,500 £3,503,349 -£1,316,151 -£102
8 10.00 25,809 £963,900 £9,639,000 £7,056,431 -£2,582,569 -£100
Residential Area Wide Viability Analysis
Schemes 1-8: 30% Affordable Housing
H
i
g
h
M
e
d
i
u
m
L
o
w
e
r

Value
Area Scheme
Site Size
(hectares)
Floor
coverage
(less AH
requirement
(Sq m)
Benchmark Land
Value per
hectare (£)
Actual
Benchmark
Land Value(£)
Residual Land
Value
(£)
Residual
Land Value
per hectare
minus
actual
benchmark
Land Value
(£)
Maximum
Available for
CIL
(£)
1 0.25 902 £1,178,100 £294,525 £867,163 £572,638 £635
2 0.50 1,216 £1,178,100 £589,050 £1,186,842 £597,792 £492
3 0.70 1,822 £1,178,100 £824,670 £1,784,088 £959,418 £527
4 1.00 2,646 £1,178,100 £1,178,100 £2,549,808 £1,371,708 £518
5 1.50 3,862 £1,178,100 £1,767,150 £3,721,568 £1,954,418 £506
6 3.00 7,724 £1,178,100 £3,534,300 £7,079,395 £3,545,095 £459
7 5.00 12,883 £1,178,100 £5,890,500 £11,199,661 £5,309,161 £412
8 10.00 25,809 £1,178,100 £11,781,000 £22,495,744 £10,714,744 £415
1 0.25 902 £1,070,000 £267,500 £726,906 £459,406 £509
2 0.50 1,216 £1,070,000 £535,000 £964,850 £429,850 £353
3 0.70 1,822 £1,070,000 £749,000 £1,449,913 £700,913 £385
4 1.00 2,646 £1,070,000 £1,070,000 £2,082,925 £1,012,925 £383
5 1.50 3,862 £1,070,000 £1,605,000 £3,028,339 £1,423,339 £369
6 3.00 7,724 £1,070,000 £3,210,000 £5,748,548 £2,538,548 £329
7 5.00 12,883 £1,070,000 £5,350,000 £9,145,562 £3,795,562 £295
8 10.00 25,809 £1,070,000 £10,700,000 £18,373,224 £7,673,224 £297
1 0.25 902 £963,900 £240,975 £586,650 £345,675 £383
2 0.50 1,216 £963,900 £481,950 £740,666 £258,716 £213
3 0.70 1,822 £963,900 £674,730 £1,120,902 £446,172 £245
4 1.00 2,646 £963,900 £963,900 £1,605,788 £641,888 £243
5 1.50 3,862 £963,900 £1,445,850 £2,343,791 £897,941 £233
6 3.00 7,724 £963,900 £2,891,700 £4,440,905 £1,549,205 £201
7 5.00 12,883 £963,900 £4,819,500 £7,106,314 £2,286,814 £178
8 10.00 25,809 £963,900 £9,639,000 £14,281,698 £4,642,698 £180
Residential Area Wide Viability Analysis
Schemes 1-8: 30% Affordable Housing
H
i
g
h
M
e
d
i
u
m
L
o
w
e
r

Derbyshire Dales District Council
Value
Area Scheme
Site Size
(hectares)
Floor
coverage
(less AH
requirement
(Sq m)
Benchmark Land
Value per
hectare (£)
Actual
Benchmark
Land Value(£)
Residual Land
Value
(£)
Residual
Land Value
per hectare
minus
actual
benchmark
Land Value
(£)
Maximum
Available for
CIL
(£)
1 0.25 902 £1,178,100 £294,525 £535,292 £240,767 £267
2 0.50 1,216 £1,178,100 £589,050 £658,985 £69,935 £58
3 0.70 1,822 £1,178,100 £824,670 £998,269 £173,599 £95
4 1.00 2,646 £1,178,100 £1,178,100 £1,432,994 £254,894 £96
5 1.50 3,862 £1,178,100 £1,767,150 £2,093,066 £325,916 £84
6 3.00 7,724 £1,178,100 £3,534,300 £3,961,414 £427,114 £55
7 5.00 12,883 £1,178,100 £5,890,500 £6,335,364 £444,864 £35
8 10.00 25,809 £1,178,100 £11,781,000 £12,734,096 £953,096 £37
1 0.25 902 £1,070,000 £267,500 £419,431 £151,931 £168
2 0.50 1,216 £1,070,000 £535,000 £476,484 -£58,516 -£48
3 0.70 1,822 £1,070,000 £749,000 £727,143 -£21,857 -£12
4 1.00 2,646 £1,070,000 £1,070,000 £1,049,027 -£20,973 -£8
5 1.50 3,862 £1,070,000 £1,605,000 £1,532,425 -£72,575 -£19
6 3.00 7,724 £1,070,000 £3,210,000 £2,884,579 -£325,421 -£42
7 5.00 12,883 £1,070,000 £5,350,000 £4,665,219 -£684,781 -£53
8 10.00 25,809 £1,070,000 £10,700,000 £9,383,096 -£1,316,904 -£51
1 0.25 902 £963,900 £240,975 £305,782 £64,807 £72
2 0.50 1,216 £963,900 £481,950 £293,937 -£188,013 -£155
3 0.70 1,822 £963,900 £674,730 £452,957 -£221,773 -£122
4 1.00 2,646 £963,900 £963,900 £664,054 -£299,846 -£113
5 1.50 3,862 £963,900 £1,445,850 £974,059 -£471,791 -£122
6 3.00 7,724 £963,900 £2,891,700 £1,811,580 -£1,080,120 -£140
7 5.00 12,883 £963,900 £4,819,500 £2,967,185 -£1,852,315 -£144
8 10.00 25,809 £963,900 £9,639,000 £5,975,913 -£3,663,087 -£142
Residential Area Wide Viability Analysis
Schemes 1-8: 30% Affordable Housing
H
i
g
h
M
e
d
i
u
m
L
o
w
e
r

Appendix 6: Strategic site sampling appraisals

Derbyshire Dales District Council
Derbyshire Dales District Council Site Specific Viability Analysis
SHLAA167 Leys Farm Residential development
Location plan
Site Promoter/developer contact details
Radleigh Homes
Site address
Leys Farm, Wyaston Road, Ashbourne
Site size
15.59 ha (gross) 38.5 acres 3.83 ha (net) 9.5 acres
Details of proposed development including current planning status
Housing – 115 dwellings anticipated. 30 dwellings per hectare

Site constraints
The site comprises pasture land. The northern half of the site is gently sloping and the southernmost third of the site sloping down to the southern boundary is steeply sloping and considered unsuitable for development at this stage. To accommodate a suitable access along Wyaston Road, the highway would need to be widened and the hedge relocated further into the site to ensure suitable visibility.
Accommodation schedule
Housing Mix
Ha (net)
No units
1 bed
2 bed
3 bed
4 bed
5 bed
Total
3.83 115 4 32 40 2 2 80 Total Market
11 10 6 1 1 29 Total Social & Affordable Rented
3 2 1 0 0 6 Total Shared Ownership
35 Total Affordable
1 bed 2 bed 3 bed 4 bed
5 bed Total sq m
223 2093 3794 263 349 6722 Total market sq m
613 654 569 131 174 2142 Total social & affordable rented sq m
167 131 95 0 0 393 Total shared ownership
LEAP children’s play area
POS area
Anticipated start date
Development appraisal assumes immediate start
Anticipated build period
6 months pre construction 6 months post construction Total construction – 46 months
No development phase and timing of delivery
115 units. One outlet. Sale rate of 30 units per outlet per annum equating to 3 years 10 months for delivery.
Planning obligations (including AH) & timing of payments
S106 contributions addressed below in abnormal costs 30% affordable housing (80% social rented and 20% shared ownership)
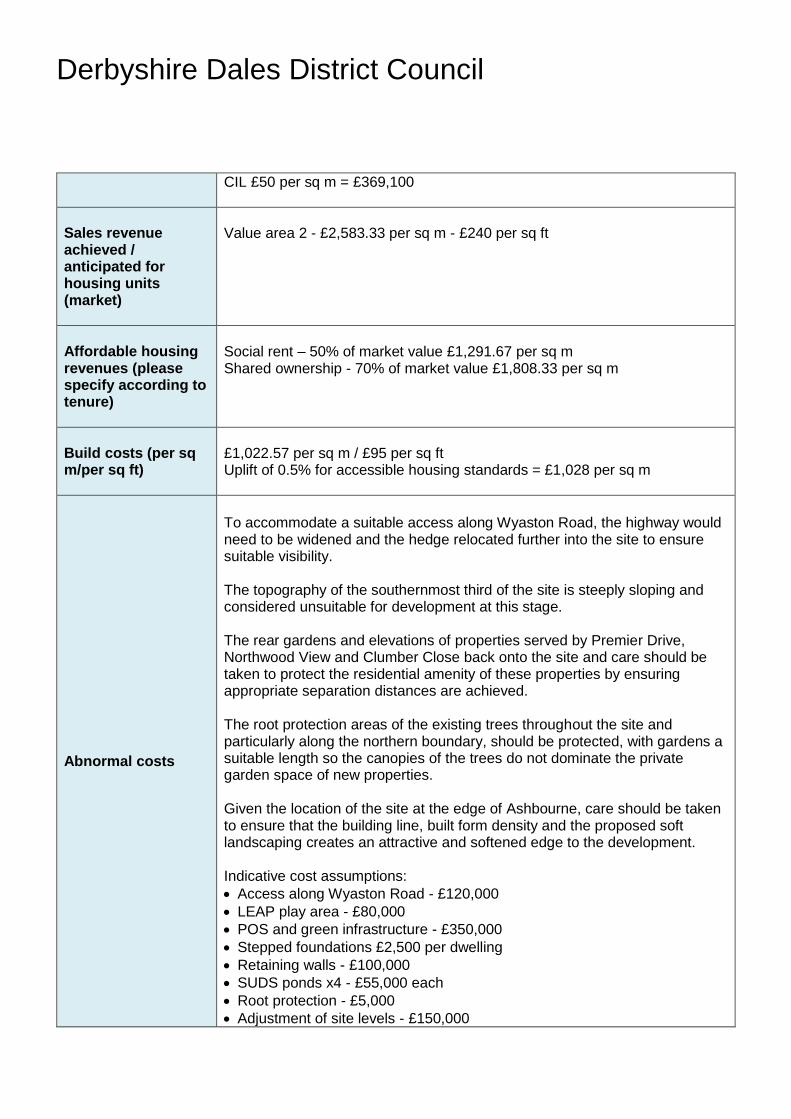
Derbyshire Dales District Council
CIL £50 per sq m = £369,100
Sales revenue achieved / anticipated for housing units (market)
Value area 2 - £2,583.33 per sq m - £240 per sq ft
Affordable housing revenues (please specify according to tenure)
Social rent – 50% of market value £1,291.67 per sq m Shared ownership - 70% of market value £1,808.33 per sq m
Build costs (per sq m/per sq ft)
£1,022.57 per sq m / £95 per sq ft Uplift of 0.5% for accessible housing standards = £1,028 per sq m
Abnormal costs
To accommodate a suitable access along Wyaston Road, the highway would need to be widened and the hedge relocated further into the site to ensure suitable visibility. The topography of the southernmost third of the site is steeply sloping and considered unsuitable for development at this stage. The rear gardens and elevations of properties served by Premier Drive, Northwood View and Clumber Close back onto the site and care should be taken to protect the residential amenity of these properties by ensuring appropriate separation distances are achieved. The root protection areas of the existing trees throughout the site and particularly along the northern boundary, should be protected, with gardens a suitable length so the canopies of the trees do not dominate the private garden space of new properties. Given the location of the site at the edge of Ashbourne, care should be taken to ensure that the building line, built form density and the proposed soft landscaping creates an attractive and softened edge to the development. Indicative cost assumptions:
Access along Wyaston Road - £120,000
LEAP play area - £80,000
POS and green infrastructure - £350,000
Stepped foundations £2,500 per dwelling
Retaining walls - £100,000
SUDS ponds x4 - £55,000 each
Root protection - £5,000
Adjustment of site levels - £150,000

Secure by Design - £600 per property
Extra over costs - £100,000
Profit (Market units and Affordable units)
17.37% Blended profit rate to account of market (20% of GDV) and affordable units (6% of GDV)
Land value
Benchmark land value £1,069,986 per ha (£433,000 per acre) - residential
Any other relevant information
Planning permission secured on this development
Fees
Professional fees -12% on construction costs Contingencies - 5% on construction costs Stamp duty – At prevailing level Agent and Legal Fees on land – 1.5% Sales, legal and marketing costs – 3.5% Finance costs - 6.75% debt funding

Derbyshire Dales District Council

Derbyshire Dales District Council Site Specific Viability Analysis
SHLAA241 Land to the rear of RBS, Darley Dale Residential Development
Location plan
Site Promoter/developer contact details
Site address
Land to the rear of RBS Darley Dale
Site size
10.18 ha (gross) – 25.15 acres 4.76 ha (net) – 11.75 acres
Details of proposed development including current planning status
Housing – 143 dwellings expected. 30 dwellings per hectare.
Site constraints
Parts of the site are affected by Flood Zone 2 & 3. The site is on land associated with DFS and adjoining agricultural fields fronting the A6 through Darley Dale close to its junction with Station Road and Chesterfield Road. The site has various existing uses. Large areas on the north western and

Derbyshire Dales District Council
north eastern sides comprise open agricultural land. Central and southern areas are occupied by development associated with DFS (furniture retail warehouse). There are three residential properties on site. New access required to serve the development comprising a new junction on the A6 frontage. Improvement of existing and development of new pedestrian / cycle routes Provision of public open space and green infrastructure on site with links to the wider countryside. Potential for historical / archaeological interest - Warney Brook and Mill Lade. Developer contributions required towards the production of infrastructure, educational services and other community services including open space.
Accommodation schedule
Housing Mix
Ha (net)
No units
1 bed
2 bed
3 bed
4 bed
5 bed
Total
4.76 143 5 40 50 3 2 100 Total Market
14 12 7 1 1 35
Total Social & Affordable Rented
3 3 2 0 0 8 Total Shared Ownership
43 Total Affordable
1 bed 2 bed 3 bed 4 bed 5 bed Total
sq m
279 2616 4743 394 446 8477 Total market sq m
780 785 664 131 174 2535 Total social & affordable rented sq m
167 196 190 0 0 553 Total shared ownership
Anticipated start date
Development appraisal assumes immediate start
Anticipated build period
6 months pre construction 6 months post construction Total construction 57 months
No development phase and timing of delivery
143 units. One outlet. Sale rate of 30 units per outlet per annum equating to 4 years 7 months to delivery.

Planning obligations (including AH) & timing of payments
S106 contributions addressed below in abnormal costs 30% affordable housing (80% social rented and 20% shared ownership) CIL at £50 per sq m = £473,350
Sales revenue achieved / anticipated for housing units (market)
Value area 2 - £2,583.33 per sq m - £240 per sq ft market units
Affordable housing revenues (please specify according to tenure)
Social rent – 50% of market value £1,291.67 per sq m Shared ownership - 70% of market value £1,808.33 per sq m
Build costs (per sq m/per sq ft)
£1,022.57 per sq m / £95 per sq ft Uplift of 0.5% for accessible housing standards = £1028 per sq m
Abnormal costs
Indicative cost assumptions for
access improvements: £110,000 (profiled 6 months duration from construction start)
demolition works (DFS): £200,000 (assumes 2-3 storeys)
on site POS /Green infrastructure £300,000
Flood mitigation (raising land levels by 750mm) - £1,000,000
Attenuation tanks - £500,000
Secured by design - £85,800
Extra over costs - £100,000
Profit (Market units and Affordable units)
17.37% Blended profit rate to account of market (20% of GDV) and affordable units (6% of GDV)
Land value
Benchmark land value £1,070,000 per ha (£433,000 per acre) - residential
Any other relevant information
Fees
Professional Fees -12% on construction costs Contingencies - 5% on construction costs Stamp Duty – At prevailing level Agent and legal fees on land – 1.5% Sales, legal and marketing costs – 3.5%

Derbyshire Dales District Council
Finance costs - 6.75% debt funding


Derbyshire Dales District Council
Derbyshire Dales District Council Site Specific Viability Analysis
SHLAA266 Land at Ashbourne Airfield Phase 1 Mixed use development
Location plan
Site Promoter/developer contact details
Site address
Land at Ashbourne Airfield, Ashbourne
Site size
49.9 ha (gross) – 123.3 acres 21.23 ha (net) – 52.46 acres
Details of proposed development including current planning status
Housing – 367 dwellings expected at 30 dwellings per hectare Employment Land – 8 hectares
Site constraints
Access improvements required. Potential for contamination given previous use as airfield.

Accommodation schedule
Residential
Housing Mix
Ha (net)
No units
1 bed
2 bed
3 bed
4 bed
5 bed
Total
21.23 367 13 103 128 6 6 256 Total Market
35 31 18 2 2 88 Total Social & Affordable Rented
9 8 4 1 1 0 Total Shared Ownership
110 Total Affordable
1 bed 2 bed 3 bed 4 bed 5 bed Total
sq m
725 6737 12141 788 788 21178 Total market sq m
1951 2028 1707 263 349 6297 Total social & affordable rented sq m
502 523 379 131 174 1710 Total shared ownership
Commercial Mixed use hub comprising:
500 sq m total floor space - Use Class A1 retail / A2 financial and professional services
500 sq m total restaurants / cafes / A4 drinking establishments
750 sq m D1 non-residential institution/community facility
500 sq m enterprise centre Assumed 1 hectare land sale in Year 1 for mixed use hub. Land sale based on employment land value benchmark of £494,200 per ha / £200,000 per acre 8 hectares of employment land - Land sale based on employment land value benchmark of £494,200 per ha / £200,000 per acre. Disposal profile - 2 hectares in each of years 1 and 2. 1 hectare in each of year 3, 4, 5 and 6.
Anticipated start date
Development appraisal assumes immediate start
Anticipated build period
6 months pre construction 6 months post construction 49 months total construction
No development phase and timing of delivery
367 units. Three outlets. Sales rate of 25 units per outlet per annum equating to 75 units per annum therefore giving a development timescale of 4 years 11 months.

Derbyshire Dales District Council
Planning obligations (including AH) & timing of payments
S106 addressed in abnormals costs below 30% affordable housing (80% social rented and 20% shared ownership) CIL at £50 per sq m = £1,781,280 (three instalments of £394,367).
Sales revenue achieved / anticipated for housing units (market)
Value area 2 - £2,583.33 per sq m - £240 per sq ft
Affordable housing revenues (please specify according to tenure)
Social rent – 50% of market value £1,291.67 per sq m Shared ownership - 70% of market value £1,808.33 per sq m
Build costs (per sq m/per sq ft)
£1,022.57 per sq m / £95 per sq ft Uplift of 0.5% for accessible housing standards = £1028 per sq m
Abnormal costs
Access Improvements – Indicative cost assumption £300,000
Provision of a landscape buffer between existing and new development. Provision of a landscape bund alongside the south eastern and north eastern boundaries of Vital Earth at least 7.5m in height and topped with 2m acoustic fencing. Provision of a landscape buffer to the rear of existing properties on Lady Hole Lane. The provision of tree planting alongside the western boundary of the site Indicative cost assumption: £250,000 per phase
The provision of an area reserved for wildlife along the north eastern boundary and the provision of public open space and green infrastructure on site with links
Indicative cost assumption: £262,500
Substation - £150,000
Gas governor £70,000
Infrastructure - £100,000 per phase
Secure by Design - £220,200
On site attenuation tanks - £800,000
Extra Over Costs - £100,000 per phase
Developer contribution towards the provision of infrastructure, educational services and other community services including open space as required, included in CIL contribution.
Provision for public transport, cycle and pedestrian routes to Ashbourne town centre, included in CIL contribution.
Profit (Market units and Affordable units)
17.37% Blended profit rate to account of market (20% of GDV) and affordable units (6% of GDV)

Land value
Benchmark land value £1,069,986 per ha (£433,000 per acre) - residential Benchmark land value £494,200 per ha (£200,000 per acre) - employment
Any other relevant information
Fees
Professional Fees -12% Contingencies - 5% Stamp Duty – At prevailing rate Agent and legal fees on land – 1.5% Sales, legal and marketing fees – 3.5% Finance - 6.75% Debt funding

Derbyshire Dales District Council

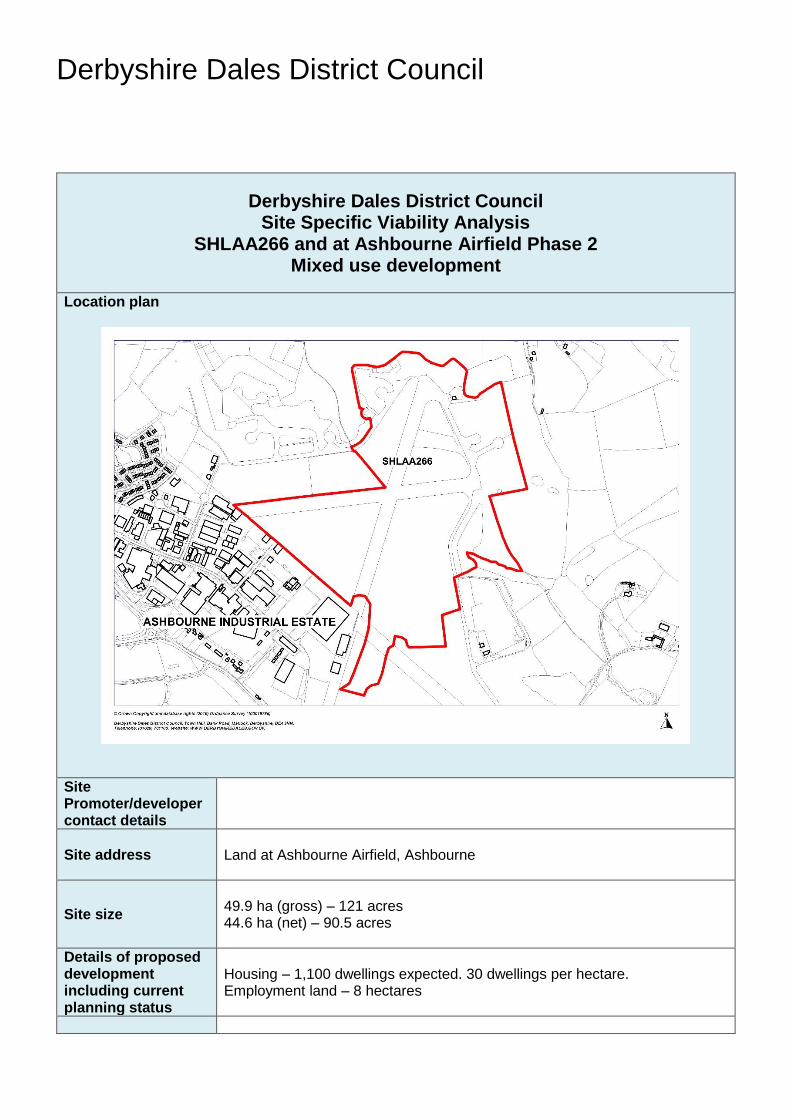
Derbyshire Dales District Council
Derbyshire Dales District Council Site Specific Viability Analysis
SHLAA266 and at Ashbourne Airfield Phase 2 Mixed use development
Location plan
Site Promoter/developer contact details
Site address
Land at Ashbourne Airfield, Ashbourne
Site size
49.9 ha (gross) – 121 acres 44.6 ha (net) – 90.5 acres
Details of proposed development including current planning status
Housing – 1,100 dwellings expected. 30 dwellings per hectare. Employment land – 8 hectares

Site constraints
Access improvements – costs included in Phase 1. Potential for contamination given previous use as airfield.
Accommodation schedule
Housing Mix
Ha (net)
No units
1 bed
2 bed
3 bed
4 bed
5 bed
Total
44.6 1100 39.0 308.
0 385.
0 19.0 19.0 770 Total Market
106.
0 92.0 53.0 7.0 6.0 264 Total Social & Affordable Rented
26.0 23.0 13.0 2.0 2.0 66 Total Shared Ownership
330 Total Affordable
1 bed 2 bed 3 bed 4 bed 5 bed Total
sq m
2174 20144 36519 2494 3315 64646 Total market sq m
5909 6017 5027 919 1047 18919 Total social & affordable rented sq m
1449 1504 1233 263 349 4798 Total shared ownership
Anticipated start date
Development appraisal assumes immediate start
Anticipated build period
6 months pre construction 6 months post construction 132 months total construction
No development phase and timing of delivery
1,100 units. Four outlets, 25 units per outlet per annum = 100 units per annum equating to 11 years delivery rate. Three phases of residential development with residential units distributed equally across all three phases. 8 hectares of employment land – Land sale based on employment land value benchmark of £494,200 per ha / £200,000 per acre. Disposal profile: Phase 1 – 3 hectares = £1,482,600 Phase 2 – 2.5 hectares = £1,235,500 Phase 3 – 2.5 hectares = £1,235,500
Planning obligations (including AH) & timing of payments
S106 addressed in abnormals costs below 30% affordable housing (80% social rented and 20% shared ownership) CIL at £50 per sq m = £3,611,800

Derbyshire Dales District Council
(Paid in three instalments: Phase 1 = £1,203,933; Phase 2 = £1,203,933; Phase 3 = £1,203,933).
Sales revenue achieved / anticipated for housing units (market)
Value area 2 - £2,583.33 per sq m - £240 per sq ft
Affordable housing revenues (please specify according to tenure)
Social rent – 50% of market value £1,291.67 per sq m Shared ownership - 70% of market value £1,808.33 per sq m
Build costs (per sq m/per sq ft)
£1,022.57 per sq m / £95 per sq ft Uplift of 0.5% for accessible housing standards = £1028 per sq m
Abnormal costs
Secure by Design Phase 1 & Phase 2 - £240,000, Phase 3 - £180,000
Substation - £150,000 (Phase 1)
Gas Governor - £70,000 (Phase 1)
Infrastructure - £100,000 per phase
On site attenuation tank - £1.5m (Phase 1)
POS and Green Infrastructure - £262,500 per phase
Landscape Bund and Buffers - £250,000 per phase
Extra Over costs - £100,000 per phase Provision for public transport, cycle and pedestrian routes to Ashbourne town centre included in s106 costs
Profit (Market units and Affordable units)
17.37% Blended profit rate to account of market (20% of GDV) and affordable units (6% of GDV)
Land value
Benchmark land value £1,069,986 per ha (£433,000 per acre) - residential Benchmark land value £494,200 per ha (£200,000 per acre) – employment
Any other relevant information
Fees
Professional Fees -12% Contingencies - 5% Stamp Duty – At prevailing rate Agent and legal fees on land – 1.5% Sales, legal and marketing fees – 3.5% Finance - 6.75% Debt funding

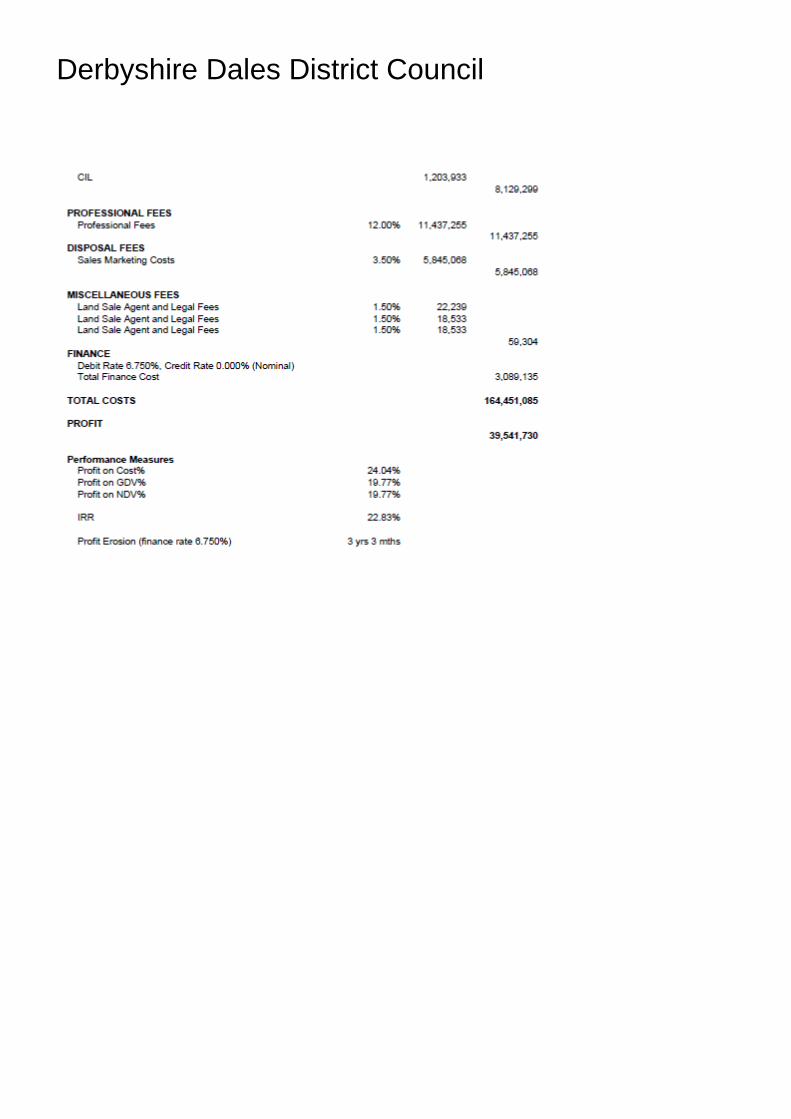
Derbyshire Dales District Council

Derbyshire Dales District Council Site Specific Viability Analysis
SHLAA269 Land off Middleton Road & Cromford Road, Wirksworth Mixed Use Development
Location plan
Site Promoter/developer contact details
Site address
Land off Middleton Road and Cromford Road, Wirksworth
Site size
9.04 ha (gross) 22.3 acres 6.2 ha (net) 15.32 acres
Details of proposed development including current planning status
Housing – 126 dwellings proposed. 30 dwellings per hectare Employment Land – 2 hectares

Derbyshire Dales District Council
Site constraints
Contamination and ground survey required Ecological survey required Flood Risk Assessment required
Accommodation schedule
Housing Mix
Ha (net)
No units
1 bed
2 bed
3 bed
4 bed
5 bed
Total
6.2 126 4 35 44 2 2 87 Total Market
12 11 6 1 1 31 Total Social & Affordable Rented
3 3 2 0 0 8 Total Shared Ownership
38 Total Affordable
1 bed 2 bed 3 bed 4
bed 5 bed Total
sq m
223 2289 4174 263 349 7297 Total market sq m
669 719 569 131 174 2263 Total social & affordable rented sq m
167 196 190 0 0 553 Total shared ownership
Land sale based on employment land value benchmark of £494,200 per ha / £200,000 per acre. 2 ha of employment land sold £988,400
Anticipated start date
Development appraisal assumes immediate start
Anticipated build period
6 months pre construction 6 months post construction Total construction – 50 months
No development phase and timing of delivery
126 units. One outlet, 30 units per annum equating to 4 years and 3 months delivery time.
Planning obligations (including AH) & timing of payments
S106 addressed in abnormals costs below 30% affordable housing (80% social rented and 20% shared ownership) CIL at £50 per sq m = £408,350.
Sales revenue achieved / anticipated for housing units (market)
Value area 2 - £2,583.33 per sq m - £240 per sq ft
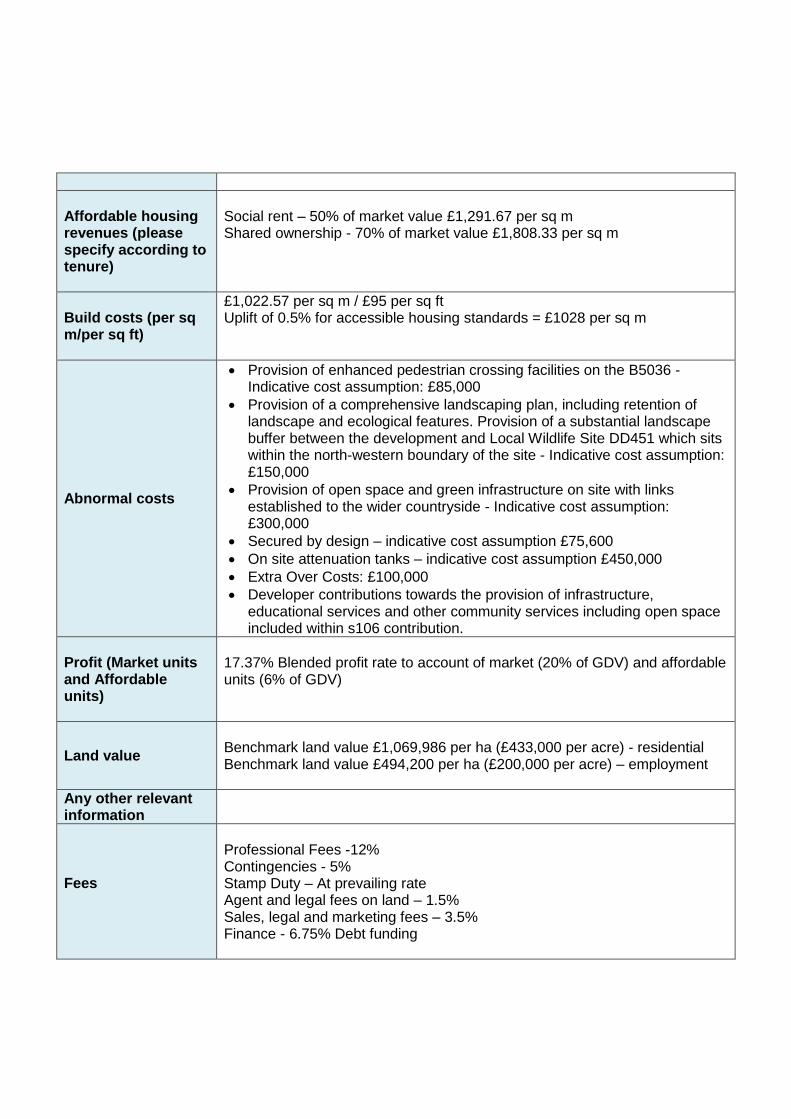
Affordable housing revenues (please specify according to tenure)
Social rent – 50% of market value £1,291.67 per sq m Shared ownership - 70% of market value £1,808.33 per sq m
Build costs (per sq m/per sq ft)
£1,022.57 per sq m / £95 per sq ft Uplift of 0.5% for accessible housing standards = £1028 per sq m
Abnormal costs
Provision of enhanced pedestrian crossing facilities on the B5036 - Indicative cost assumption: £85,000
Provision of a comprehensive landscaping plan, including retention of landscape and ecological features. Provision of a substantial landscape buffer between the development and Local Wildlife Site DD451 which sits within the north-western boundary of the site - Indicative cost assumption: £150,000
Provision of open space and green infrastructure on site with links established to the wider countryside - Indicative cost assumption: £300,000
Secured by design – indicative cost assumption £75,600
On site attenuation tanks – indicative cost assumption £450,000
Extra Over Costs: £100,000
Developer contributions towards the provision of infrastructure, educational services and other community services including open space included within s106 contribution.
Profit (Market units and Affordable units)
17.37% Blended profit rate to account of market (20% of GDV) and affordable units (6% of GDV)
Land value
Benchmark land value £1,069,986 per ha (£433,000 per acre) - residential Benchmark land value £494,200 per ha (£200,000 per acre) – employment
Any other relevant information
Fees
Professional Fees -12% Contingencies - 5% Stamp Duty – At prevailing rate Agent and legal fees on land – 1.5% Sales, legal and marketing fees – 3.5% Finance - 6.75% Debt funding

Derbyshire Dales District Council


Derbyshire Dales District Council
Derbyshire Dales District Council Site Specific Viability Analysis
SHLAA281 Land at Stancliffe Quarry Residential Development
Location plan
Site Promoter/developer contact details
Site address
Land at A6 (Stancliffe Quarry), Dale Road North, Darley Dale
Site size
10.15 ha (gross) – 25 acres 3.3 ha (net) – 8.15 acres
Details of proposed development including current planning status
Housing – 100 dwellings proposed. 30 dwellings per hectare

Site constraints
Former quarry site likely to require remediation and potential for stabilisation of the north east quarry face adjacent to Stancliffe Hall.
Accommodation schedule
Housing Mix
Ha (net)
No units
1 bed
2 bed
3 bed
4 bed
5 bed
Total
3.3 100 4 28 35 2 1 70 Total Market
10 8 5 1 1 25 Total Social & Affordable Rented
2 2 1 0 0 5 Total Shared Ownership
30 Total Affordable
1 bed 2 bed 3 bed 4
bed 5 bed Total
sq m
223 1831 3320 263 174 5811 Total market sq m
557 523 474 131 174 1861 Total social & affordable rented sq m
111 131 95 0 0 337 Total shared ownership
Anticipated Start Date
Development appraisal assumes immediate start.
Anticipated build period
6 months pre construction 6 months post construction Total construction – 40 months
No development phase and timing of delivery
110 units. One outlet. 30 units per annum equating to 3 years 8 months to delivery.
Planning obligations (including AH) & timing of payments
S106 addressed in abnormals costs below 30% affordable housing (80% social rented and 20% shared ownership) CIL at £50 per sq m = £325,050
Sales revenue achieved / anticipated for housing units (market)
Value area 2 - £2,583.33 per sq m - £240 per sq ft
Affordable housing revenues (please
Social rent – 50% of market value £1,291.67 per sq m Shared ownership - 70% of market value £1,808.33 per sq m

Derbyshire Dales District Council
specify according to tenure)
Build costs (per sq m/per sq ft)
£1,022.57 per sq m / £95 per sq ft Uplift of 0.5% for accessible housing standards = £1028 per sq m
Abnormal costs
A new access with the A6 to serve the comprehensive development is
required - Indicative cost assumption: £100,000
Improvements to existing and development of new pedestrian / cycle routes - Indicative cost assumption: £269,000 (assumes 1,076m long x 3m wide cycle path at £250 per m)
Open space/Green Infrastructure provision – indicative cost assumption: £250,000
Secured by design – indicative cost assumption £60,000
On site attenuation tank - indicative cost assumption £400,000
Extra Over costs: £100,000
Developer contribution towards the provision of infrastructure, educational services and other community services including open space included within s106 contribution
Profit (Market units and Affordable units)
17.37% Blended profit rate to account of market (20% of GDV) and affordable units (6% of GDV)
Land value
Benchmark land value £1,069,986 per ha (£433,000 per acre) - residential
Any other relevant information
Fees
Professional Fees -12% Contingencies - 5% Stamp Duty – At prevailing rate Agent and legal fees on land – 1.5% Sales, legal and marketing fees – 3.5% Finance - 6.75% Debt funding


Derbyshire Dales District Council
Derbyshire Dales District Council Site Specific Viability Analysis
SHLAA435 Halldale Quarry Mixed Use Development
Location plan
Site Promoter/developer contact details
Site address
Halldale Quarry, Matlock Spa Road, Matlock
Site size
7.9 ha (gross) – 19.5 acres 9.3 ha (net) – 22.98 acres
Details of proposed development including current planning status
Housing – 220 dwellings proposed. 30 dwellings per hectare 2 hectares employment space

Site constraints
The site lies within a designated RIGS site. The site is potentially contaminated or unstable and requires further investigation and remediation. Environmental Health comments pending. Site predominantly brownfield (more than 70% of site area).
Accommodation schedule
Housing Mix
Ha (net)
No units
1 bed
2 bed
3 bed
4 bed
5 bed
Total
9.3 220 8 62 77 4 4 155 Total Market
21 18 11 1 1 52 Total Social & Affordable Rented
5 5 3 0 0 13 Total Shared Ownership
66 Total Affordable
1 bed 2 bed 3 bed 4
bed 5 bed Total
sq m
446 4055 7304 525 698 13028 Total market sq m
1171 1177 1043 131 174 3697 Total social & affordable rented sq m
279 327 394 0 0 1000 Total shared ownership
2 hectares of employment land – Land sale based on employment land value benchmark of £494,200 per ha / £200,000 per acre. (£988,400)
Anticipated start date
Development appraisal assumes immediate start.
Anticipated build period
6 months per construction 6 months post construction 53 months total construction.
No development phase and timing of delivery
220 units. 2 outlets. 25 units per outlet per annum equating to 50 units per annum, 4 years 5 months to delivery.
Planning obligations (including AH) & timing of payments
S106 addressed in abnormals costs below 30% affordable housing (80% social rented and 20% shared ownership) CIL at £10 per sq m = £145,430
Sales revenue achieved / anticipated for
Value area 3 - £2,368.06 per sq m - £220 per sq ft

Derbyshire Dales District Council
housing units (market)
Affordable housing revenues (please specify according to tenure)
Social rent – 50% of market value £1,211 per sq m Shared ownership - 70% of market value £1,657.64 per sq m
Build costs (per sq m/per sq ft)
£1,022.57 per sq m / £95 per sq ft Uplift of 0.5% for accessible housing standards = £1028 per sq m
Abnormal costs
Provision of crossing facilities across Matlock Spa Road and the provision of footways up to and into the site - Indicative cost assumption: £40,000
Provision of open space and green infrastructure on site with links established to the wider countryside - Indicative cost assumption: £425,000
Secured by design – Indicative cost assumption £132,000
On site attenuation tanks - £600,000
Extra Over Costs: £100,000 Developer contributions towards the provision of infrastructure, educational services and other community services including open space through s106 contributions.
Profit (Market units and Affordable units)
17.37% Blended profit rate to account of market (20% of GDV) and affordable units (6% of GDV)
Land value
Benchmark land value £963,900 per ha (£390,000 per acre) – residential Benchmark land value £494,200 per ha (£200,000 per acre) - employment.
Any other relevant information
Fees
Professional Fees -12% Contingencies - 5% Stamp Duty – At prevailing rate Agent and legal fees on land – 1.5% Sales, legal and marketing fees – 3.5% Finance - 6.75% Debt funding


Derbyshire Dales District Council

Derbyshire Dales District Council Site Specific Viability Analysis
SHLAA473 Land at Middle Peak Quarry, Wirksworth Residential Development
Location plan
Site Promoter/developer contact details
Tarmac
Site address
Land at Middle Peak Quarry, Wirksworth
Site size
72 ha (gross) – 178 acres 7.3 ha (net) – 18 acres
Details of proposed development
Housing – 645 dwellings expected. 30 dwellings per hectare.

Derbyshire Dales District Council
including current planning status
Site constraints
Former Limestone Quarry therefore parts of the site will likely to be unstable and potentially contaminated. There are a number of environmental designations on the site; Dale Quarry SSS1, Stoney wood Wildlife site, Regionally important geological site, Tree preservation orders, Middleton conservation area, Wirksworth conservation area, scheduled monument, designated and non-designated heritage assets.
Accommodation schedule
Housing Mix
Ha (net)
No units
1 bed
2 bed
3 bed
4 bed
5 bed
Total
7.3 220 23 181 226 11 11 452 Total Market
62 54 31 4 4 155 Total Social &
Affordable Rented
15 14 8 1 1 39 Total Shared
Ownership
194 Total Affordable
1 bed 2 bed 3 bed 4 bed 5 bed Total
sq m
1258 11812 21413 1482 1969
37,93
5 Total market sq m
3452 3544 2937 508 675
11,11
5 Total social & affordable rented sq m
863 886 734 127 169 2,779 Total shared ownership
Anticipated start date
Development appraisal assumes immediate start
Anticipated build period
6 months pre construction 6 months post construction Total construction 103 months (8.6 years)
No development phase and timing of delivery
645 units. 3 outlets. Sale rate of 25 units per outlet per annum equating to 75 units per annum, 103 months to delivery.
Planning obligations (including AH) & timing of payments
S106 addressed in abnormals costs below 30% affordable housing (80% social rented and 20% shared ownership) CIL at £50 per sq m = £2,083,150

Sales revenue achieved / anticipated for housing units (market)
Value area 2 - £2,583.33 per sq m - £240 per sq ft
Affordable housing revenues (please specify according to tenure)
Social rent – 50% of market value £1,291.67 per sq m Shared ownership - 70% of market value £1,808.33 per sq m
Build costs (per sq m/per sq ft)
£1,022.57 per sq m / £95 per sq ft Uplift of 0.5% for accessible housing standards = £1028 per sq m
Abnormal costs
Provision of enhanced pedestrian crossing facilities on the B5036 -
Indicative cost assumption: £220,000
Improvements of existing and development of new pedestrian/cycle routes - Indicative cost assumption: £250,000
Provision of open space and green infrastructure on site with links established to the wide countryside - Indicative cost assumption: £400,000
Secured by design – Indicative cost assumption £387,000
On site attenuation tank – Indicative cost assumption £1,500,000
Extra over costs - £350,000
Developer contributions towards the provision of infrastructure, educational services and other community services including open space as required included within s106 contributions.
Profit (Market units and Affordable units)
17.37% Blended profit rate to account of market (20% of GDV) and affordable units (6% of GDV)
Land value
Benchmark land value £963,900 per ha (£390,000 per acre) – residential
Any other relevant information
Fees
Professional Fees -12% Contingencies - 5% Stamp Duty – At prevailing rate Agent and legal fees on land – 1.5% Sales, legal and marketing fees – 3.5% Finance - 6.75% Debt funding

Derbyshire Dales District Council

Derbyshire Dales District Council Site Specific Viability Analysis
SHLAA224 Land off Gritstone Road / Pinewood Road, Matlock Residential development
Location plan
Site Promoter/developer contact details
Site address
Land off Gritstone Road/ Pinewood Road, Matlock
Site size
20.8 ha (gross) 51.4 acres 14.3 ha (net) 35.3 acres
Details of proposed development including current planning status
Housing – 430 units. 30 dwellings per hectare.
Site constraints
Site is predominantly greenfield - more than 70%.

Derbyshire Dales District Council
Accommodation schedule
Housing Mix
Ha (net)
No units
1 bed
2 bed
3 bed
4 bed
5 bed
Total
14.3 430 15 120 151 8 8 301 Total Market
41 36 21 3 3 103 Total Social & Affordable Rented
10 9 5 1 1 26 Total Shared Ownership
129 Total Affordable
1 bed 2 bed 3 bed 4 bed 5 bed Total
sq m
839 7875 14276 988 1313 25290 Total market sq m
2301 2362 1958 339 450 7410 Total social & affordable rented sq m
575 591 489 85 113 1853 Total shared ownership
Anticipated start date
Development appraisal assumes immediate start
Anticipated build period
6 months pre construction 6 months post construction Total construction 52 months (4 years 2 months)
No development phase and timing of delivery
430 units. Assume 4 outlets. Sale rate of 25 units per annum per outlet equating to 100 units per annum, 4 years and 4 months to delivery
Planning obligations (including AH) & timing of payments
S106 addressed in abnormals costs below 30% affordable housing (80% social rented and 20% shared ownership) CIL at £10 per sq m = £286,150
Sales revenue achieved / anticipated for housing units (market)
Value area 3 - £2,368.06 per sq m - £220 per sq ft
Affordable housing revenues (please
Social rent – 50% of market value £1,211 per sq m Shared ownership - 70% of market value £1,657.64 per sq m

specify according to tenure)
Build costs (per sq m/per sq ft)
£1,022.57 per sq m / £95 per sq ft Uplift of 0.5% for accessible housing standards = £1028 per sq m
Abnormal costs
Secure by design – Indicative cost assumption - £261,600
Provision of a link road through the development to Gritstone Road - Indicative cost assumption: £600,000
Improvements to existing and development of new pedestrian/cycle routes - Indicative cost assumption: £187,500 (749m @ £250 per m)
Provision of open space and green infrastructure on site with links established to the wider countryside - Indicative cost assumption: £600,000
On site attenuation tank – Indicative cost assumption - £900,000
Gas governor – Indicative cost assumption - £75,000
Electricity substation - £150,000
Extra Over costs - £100,000
Developer contributions towards the provision of infrastructure, educational service and other community services including open space through s106 contributions.
Profit (Market units and Affordable units)
17.37% Blended profit rate to account of market (20% of GDV) and affordable units (6% of GDV)
Land value
Benchmark land value £963,900 per ha (£390,000 per acre) – residential
Any other relevant information
N/A
Fees
Professional Fees -12% Contingencies - 5% Stamp Duty – At prevailing rate Agent and legal fees on land – 1.5% Sales, legal and marketing fees – 3.5% Finance - 6.75% Debt funding

Derbyshire Dales District Council


